Article

Wind-Thermal-Nuclear-Storage Combined Time Division Power Dispatch Based on Numerical Characteristics of Net Load

1
School of Electrical Engineering, Dalian University of Technology, Dalian 116024, China
2
State Grid Liaoning Electric Power Co., Ltd., Shenyang 110006, China
3
Electric Power Research Institute of State Grid Liaoning Electric Power Co., Ltd., Shenyang 110006, China
4
State Grid Anshan Electric Power Supply Company, Anshan 114000, China
5
School of Control Science and Engineering, Dalian University of Technology, Dalian 116024, China
*
Authors to whom correspondence should be addressed.
Energies 2020, 13(2), 364; https://doi.org/10.3390/en13020364
Submission received: 11 December 2019 / Revised: 30 December 2019 / Accepted: 9 January 2020 / Published: 11 January 2020

Abstract

:
In order to satisfy the strategic needs of energy sustainable development, renewable energy has developed rapidly and the power systems have been transformed to a new generation of power systems. In the renewable energy power generation technologies, the fastest developing wind power generation are highly intermittent and fluctuating. When high penetration of renewable power connects to the power grid and participates in the system dispatch, there will be more difficulties and challenges in the energy balance control. In this paper, a wind-thermal-nuclear-storage combined time division power dispatch strategy based on numerical characteristics of net load is proposed, where a specific thermal generating mode and an unconventional nuclear generating mode are discussed. In the strategy, the dispatch time division method is introduced in detail and the sample entropy theory is used to calculate the net load complexity. An adaptive thermal generating mode is determined according to the numerical characteristics of the net load. The nuclear generating modes of constant power operation, time division operation, and net load tracking time division operation are compared and analyzed, respectively. Finally, the wind-thermal-nuclear-storage combined time division power dispatch strategy aiming at decreasing the ramping power of thermal generators is achieved, and the increasing of the participation of pumped storage and improving of the continuous and steady operation time of thermal generators are realized. The experiment simulation is developed on an actual provincial power system in the northeast of China. The results verify that the thermal generator ramping power in the case based on SampEn are reduced, and the participation of pumped storage is improved. When both of the thermal generating mode and nuclear generating mode are according to the changing of net loads, the ramping powers of thermal generators are further decreased.

1. Introduction

In order to meet the strategic needs of sustainable energy development, the supply side of the power system tends to be in the clean and low-carbon development and the proportion of renewable energy is expected to reach up to 60% by 2050 [1,2]. In the power system, the renewable power sources such as wind power and photovoltaic will respond to the load demands together with the traditional thermal generator and nuclear generators. At the same time, the large number of flexible loads such as distributed power and electric vehicles access to the grid, increases the uncertainties on the load side and further increases the response capability requirements of the traditional power supply to the power fluctuation [3]. In the traditional dispatch strategy, the dispatching time interval is constant such as 15, 30 min, and 1 h. Thus, with strong uncertainties in the system, the power outputs of thermal generators need to ramp up and down frequently, which will cause the constantly inlet valve adjustment of the turbine and the frequent changes of the in and out amount of air and coal. These actions will bring difficulties to the actual operation, while aggravating the mechanical wear of the units, waking the operation stability, and shortening the mechanic life [4]. Even the thermal generators need transformation to solve the above problems [5].
Another important traditional power supply in the power system is the nuclear power. In China, the install capacity of nuclear power will reach 60 million kW and the number of nuclear units under construction with capacity of million kW is around 30 [6]. Nuclear power as a kind of high-capacity clean power energy participates in the power system peak shaving directly to respond to the uncertainty of renewable energy is more common in foreign countries with a high proportion of nuclear install capacity. In France, the overhaul combination mode and daily load-tracking mode are utilized in the power system peak shaving [7]. In China, the nuclear power units are mostly close to the load center and the power grid capacity is large. Thus, some nuclear power plants participate in the system peak shaving through down rating [8,9]. For example, in the northeast of China, during the winter heating periods, due to the thermal generation has minimum output limits, during the load trough periods, the peak shaving capability and reserve capacity are both insufficient, which will cause wind curtailment. Normally, considering the operation safety, the nuclear units always operate as a base load and they prefer not to assist in the peak shaving [10]. However, due to the large amount renewable power energy access to the power grid, the uncertainties of the system are aggravated. Thus, along with the nuclear capacity increases, the peak shaving of the power system is more different. In order to meet the requirements of the new environment, it is of great significance to determine the operation mode of the thermal units and nuclear units and further provide the accommodative day-ahead power dispatch strategy.
In respect of the issues above, there are many studies on the power dispatch strategy with high proportion of renewable energy [11,12,13,14,15,16]. The coordination among multi-sources in the power system that is utilized to improve the consumption of renewable power energy is one of the most important strategies. On the power supply side, the hydroelectric power plants, thermal power plants, gas power plants, etc. are flexible sources to promote their development and utilization [11,12]. On the load side, the flexible loads such as electric vehicles [13] and energy storage [14] are introduced to increase the system flexibility, which can improve the reserve capability and promote the consumption of renewable energy. The pumped storage is a kind of large, flexible, and fast response capability owning energy storage unit [15,16]. The coordinated operation of nuclear units and pumped storage is a kind of effective means to improve the peak shaving capability of the system.
Facing the large-scale renewable power access to the power grid, the up and down ramping power of thermal generators is the important factor that affects the load demand response [17,18,19,20,21]. However, these studies are based on the traditional economic power dispatch, in which the dispatch time interval is stable and the thermal power output should change frequently according to the fluctuation of renewable energy. One of the efficiency means to solve the above difficulties is the analysis from the time dimension. The authors of [22] show a sub-hourly scale dispatch considering the uncertainty caused by renewable energy, in which the generator ramping constraints are taken into account at a sub-hourly scale. The results show that the sub-hourly scale dispatch can improve the flexibility of the system and promote the renewable energy consumption. The authors of [23] provide a day-ahead and auxiliary short-term power dispatch strategy, which realizes the multi-time scale coordination to increase the penetration rate of renewable energy. The authors of [24] introduce the frequency factor of thermal power outputs and build the constraint functions of unit adjustment times. Through optimization, the times of the power ramp up and down are kept within limits. However, the determination of the time limits is subjective and it should be determined according to the numerical characteristics of loads. The authors of [25] study a unit combined dispatch strategy with an enhanced unit ramping ability. The strategy provides the ramping constraints at different time level, which can satisfy all the uncertainty changing of the system on the basis that the predicted load demand is satisfied. However, the excessive reserved ramping power will lead to a waste of resources. The above studies have studied the power dispatch on the perspective of time scale and thermal ramping power limitations, but there is less studies on the power dispatch based on the numerical characteristics of net loads, which can provide an adaption time division power dispatch strategy. Further, the ramping mode of generators can be determined according to the net load numerical characteristics in this paper.
In addition, the description of the load and renewable energy uncertainty will affect the dispatch strategy determination. In this paper, the net load, obtained by the difference between traditional loads and renewable power, is the dispatch objects. There are many uncertainty description methods, such as those we can study and the uncertainty of load and power source, respectively and make them integrated. The stochastic programming model and fuzzy programming model [26,27,28] together with the appropriate optimization algorithm are the most common methods to solve uncertainty problems. In addition, we can conduct the numerical analysis on the net loads and analyze the curve trends, volatility, hourly ramping power, and complexity of the net loads [29,30]. In many numerical analysis methods, the complexity calculation is a reasonable and objective numerical analysis method to reflect the numerical characteristics of time series, such as the information entropy [31] and approximate entropy (ApEn) [32] in the entropy theory. The number requirement of data in ApEn is little and it is suitable for engineering applications [32]. Due to the calculation process of ApEn, it has the comparison of self-data segments in order to avoid the logarithm of zero, which leads to the result of ApEn relying on its data length and has the computational limitation. The SampEn is introduced by Richman based on ApEn [33]. The SampEn is utilized to describe the degree of randomness and complexity of time series. Compared to ApEn, the SampEn retains the advantages of ApEn and reduces the calculation losses of ApEn. SampEn owns a good applicability and consistency and it has been widely used in the complexity calculation [34,35].
In this paper, a wind-thermal-nuclear-storage combined time division power dispatch strategy based on numerical characteristics of net load is provided to stablize the generation and increase the operation efficiency of the thermal generators. The net loads are the objects that need to be satisfied in the dispatch. The net load is formed by the results after the renewable energy is consumed by electric loads. The complexity calculation method is introduced and the net load time division method is explained in detail. This strategy focuses on the day-ahead power dispatch and the complexity calculation is based on the forecasted load and renewable energy power outputs. According to the proposed numerical characteristics of net load-based dispatch strategy, the specific thermal generation mode and net load tracking nuclear generation mode are provided. On these bases, the thermal ramping power are reduced; the continuous and stable operating time and the operation efficiency are improved. Moreover, the constant operating mode and net load tracking operating mode of nuclear generators are compared and analyzed. Finally, a simulation model based on an actual provincial power system in the northeast of China is developed. The MATLAB (R2018a, MathWorks, Natick, MA, USA) is used to insulate the efficiency of the proposed dispatch strategy.
The organization of this paper is as follows. Section 2 analyzed the numerical characteristics of the net load and introduced the dispatching time division and complexity calculation method. In Section 3, a wind-thermal-nuclear-storage combined time division power dispatch model is built and studied. In Section 4, the case study and discussion based on an actual provincial power system in the northeast of China are conducted. In the last section, the conclusions are stated.

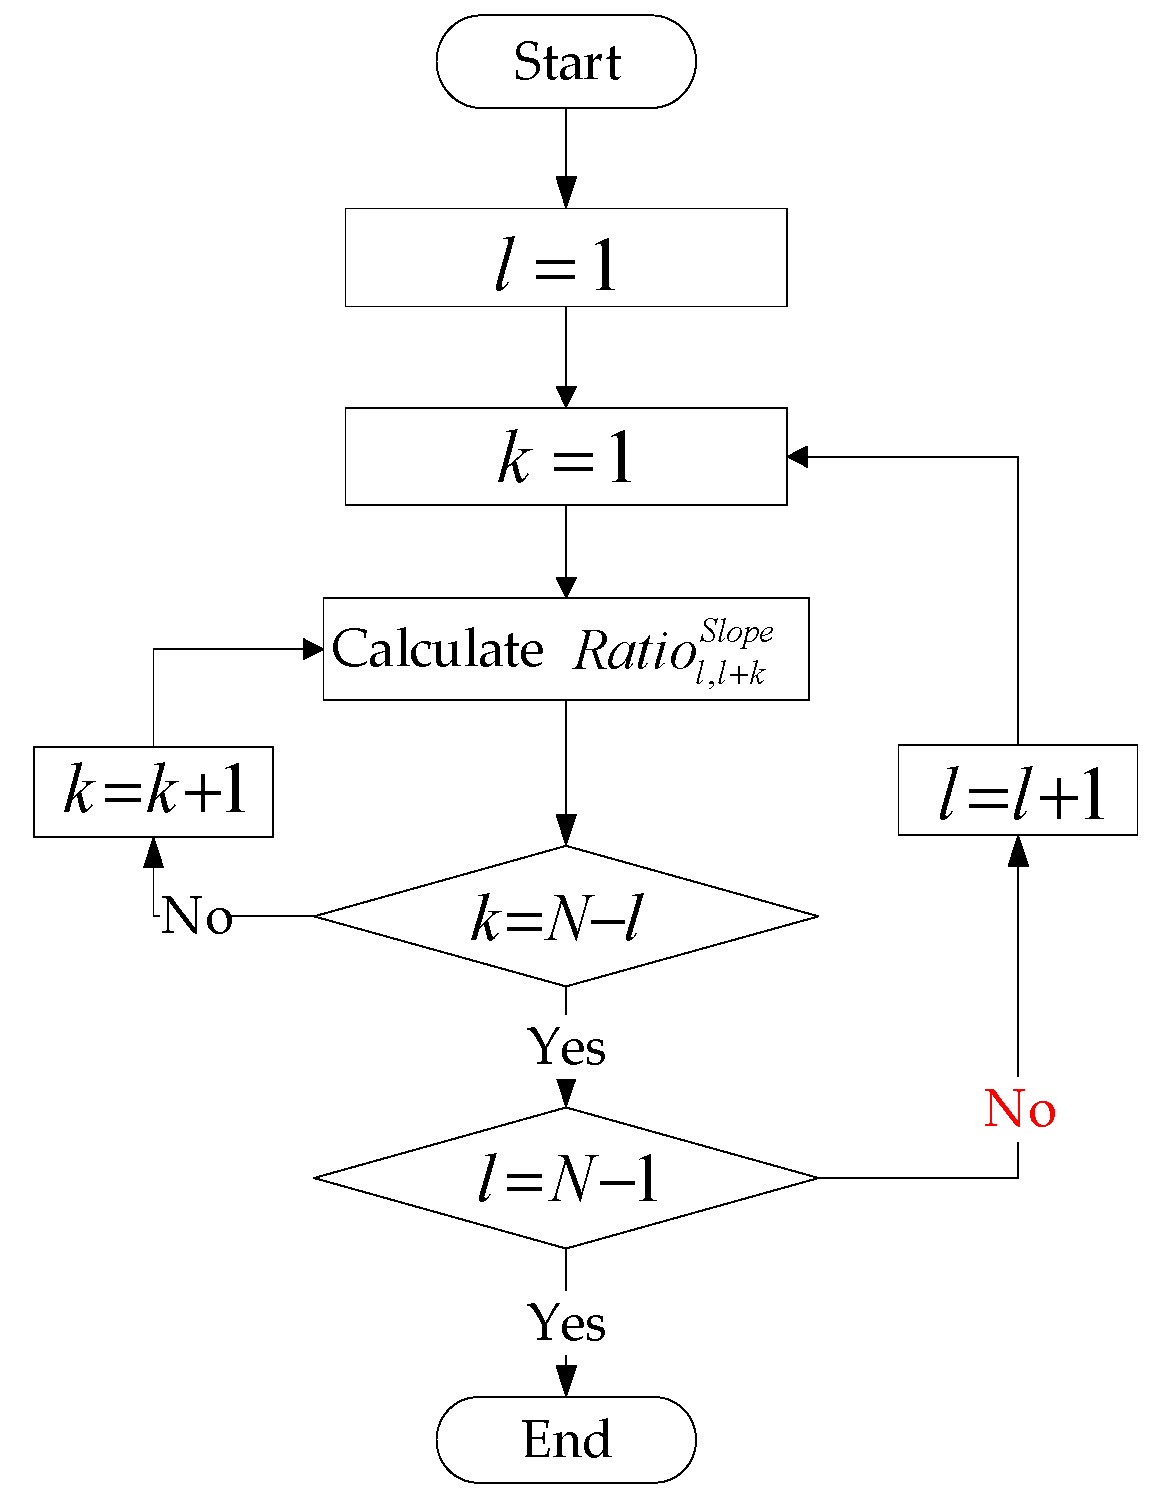
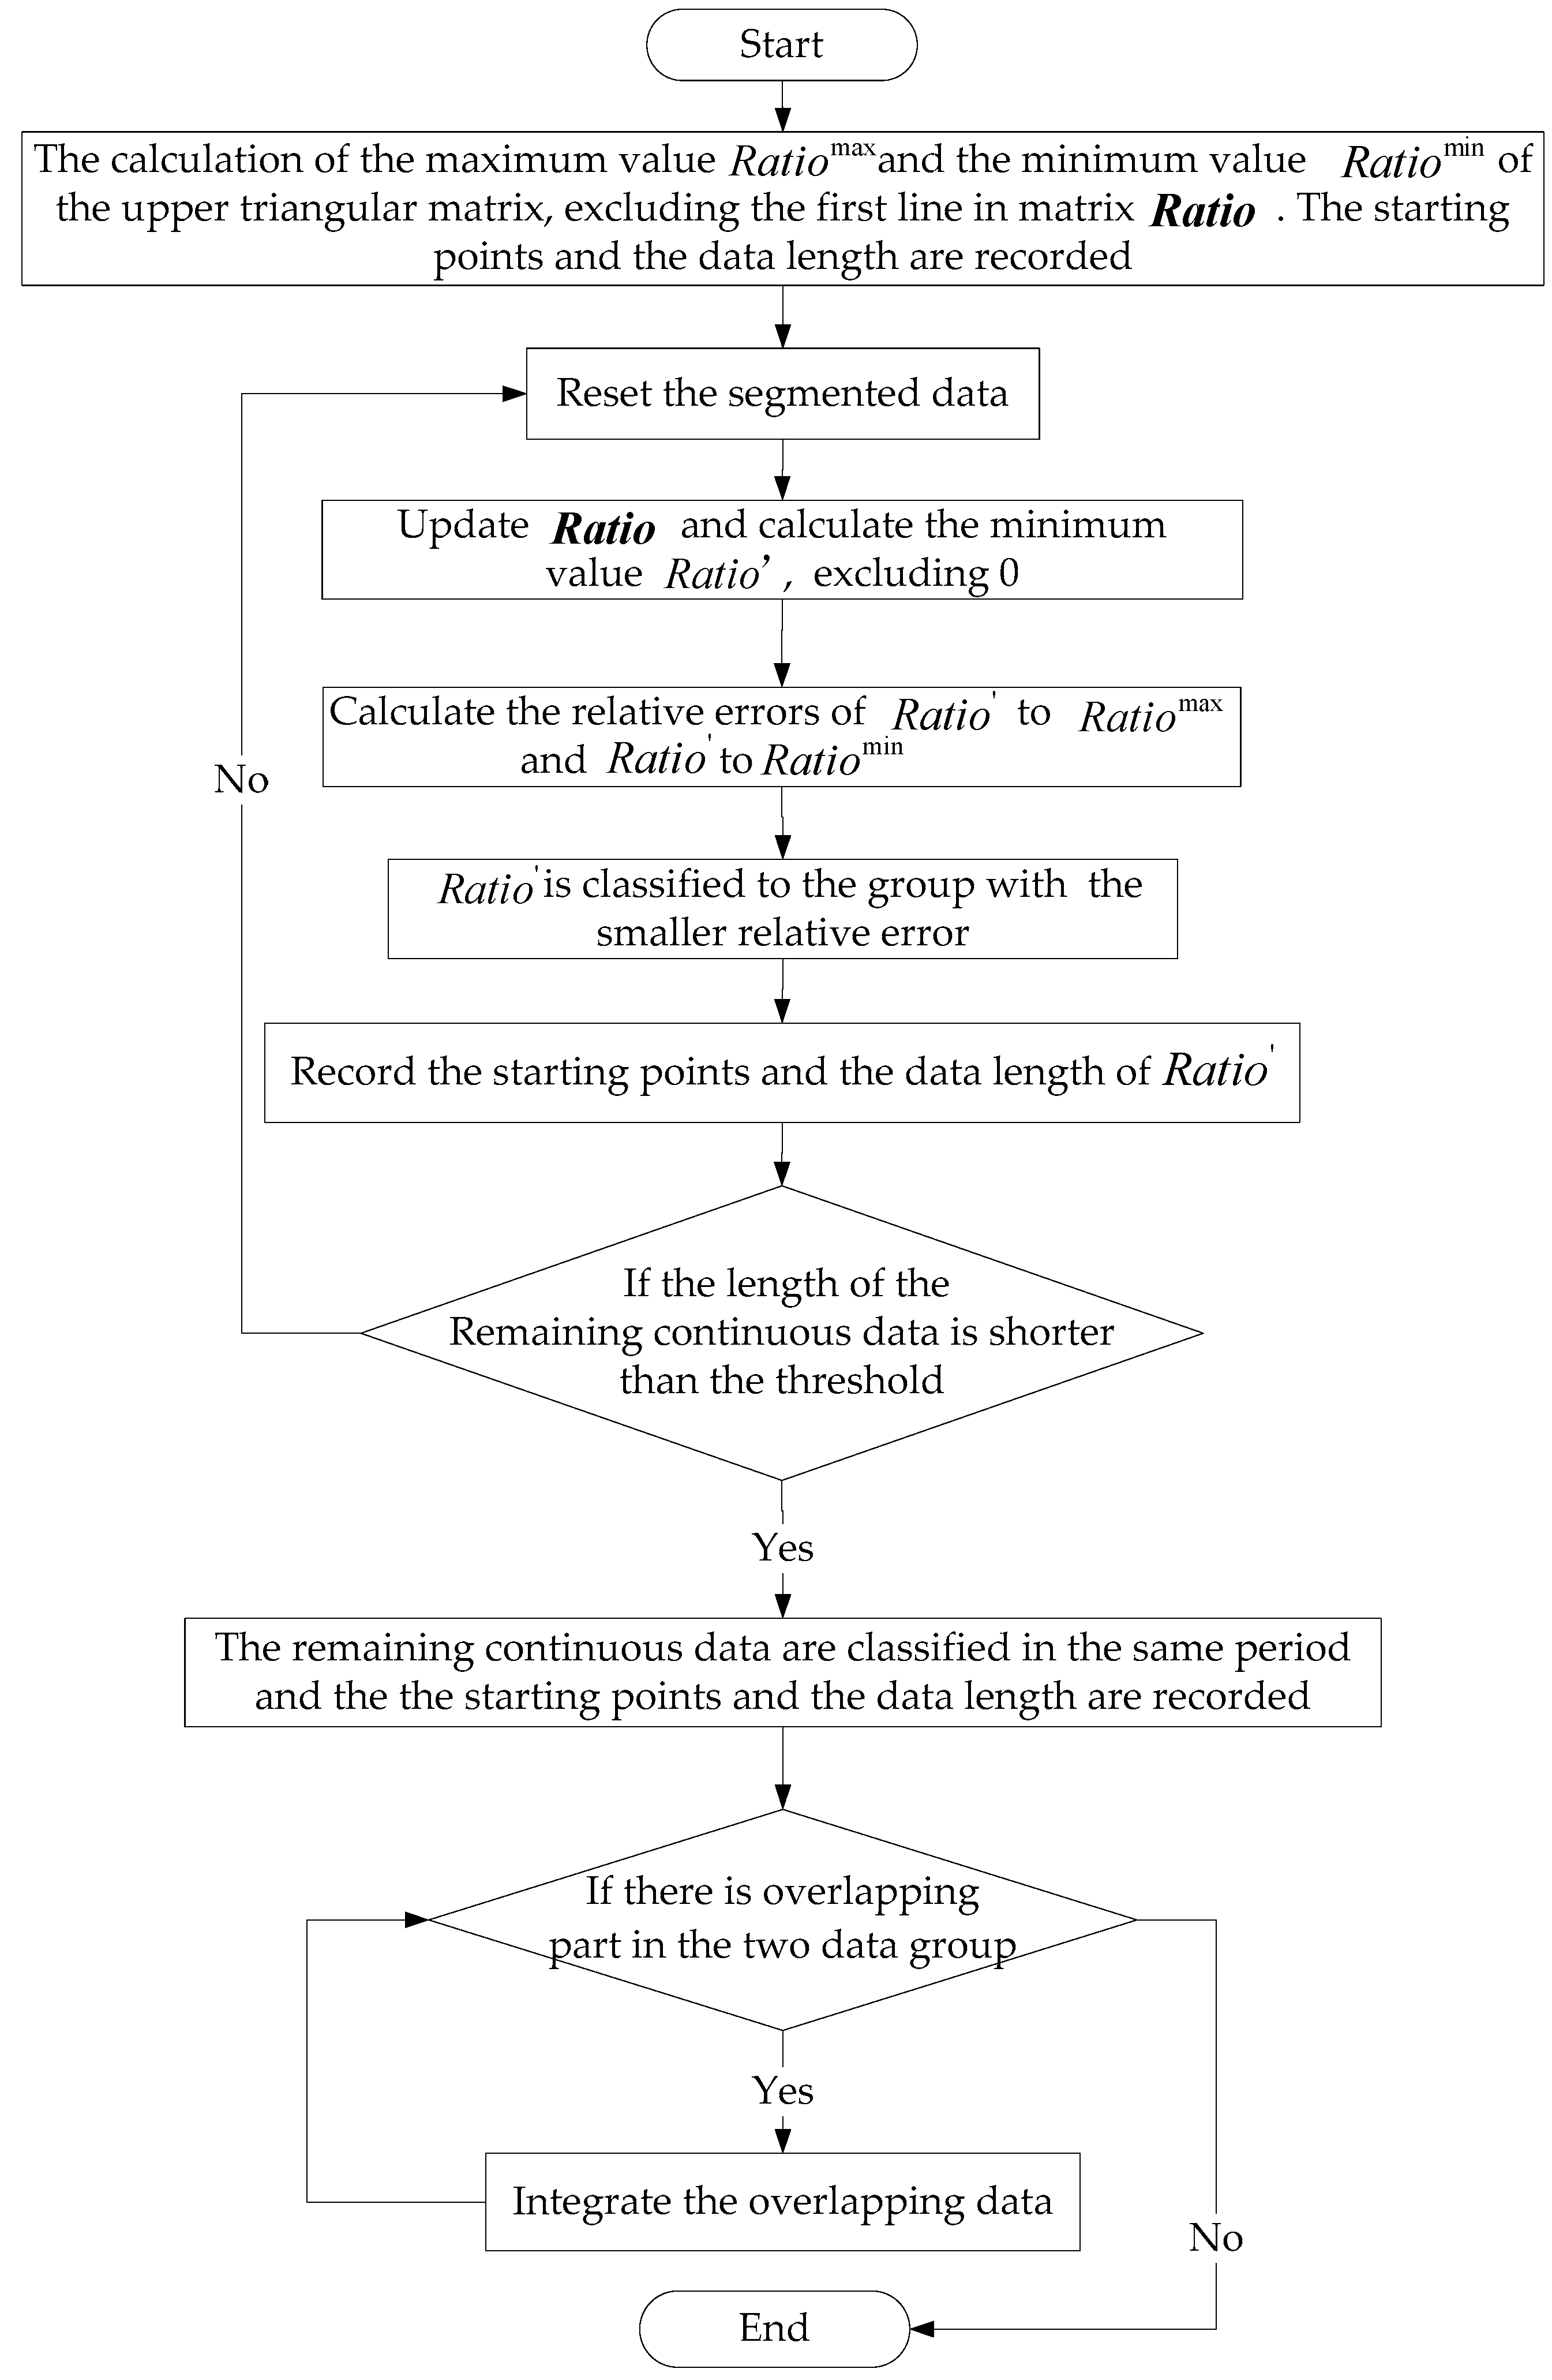
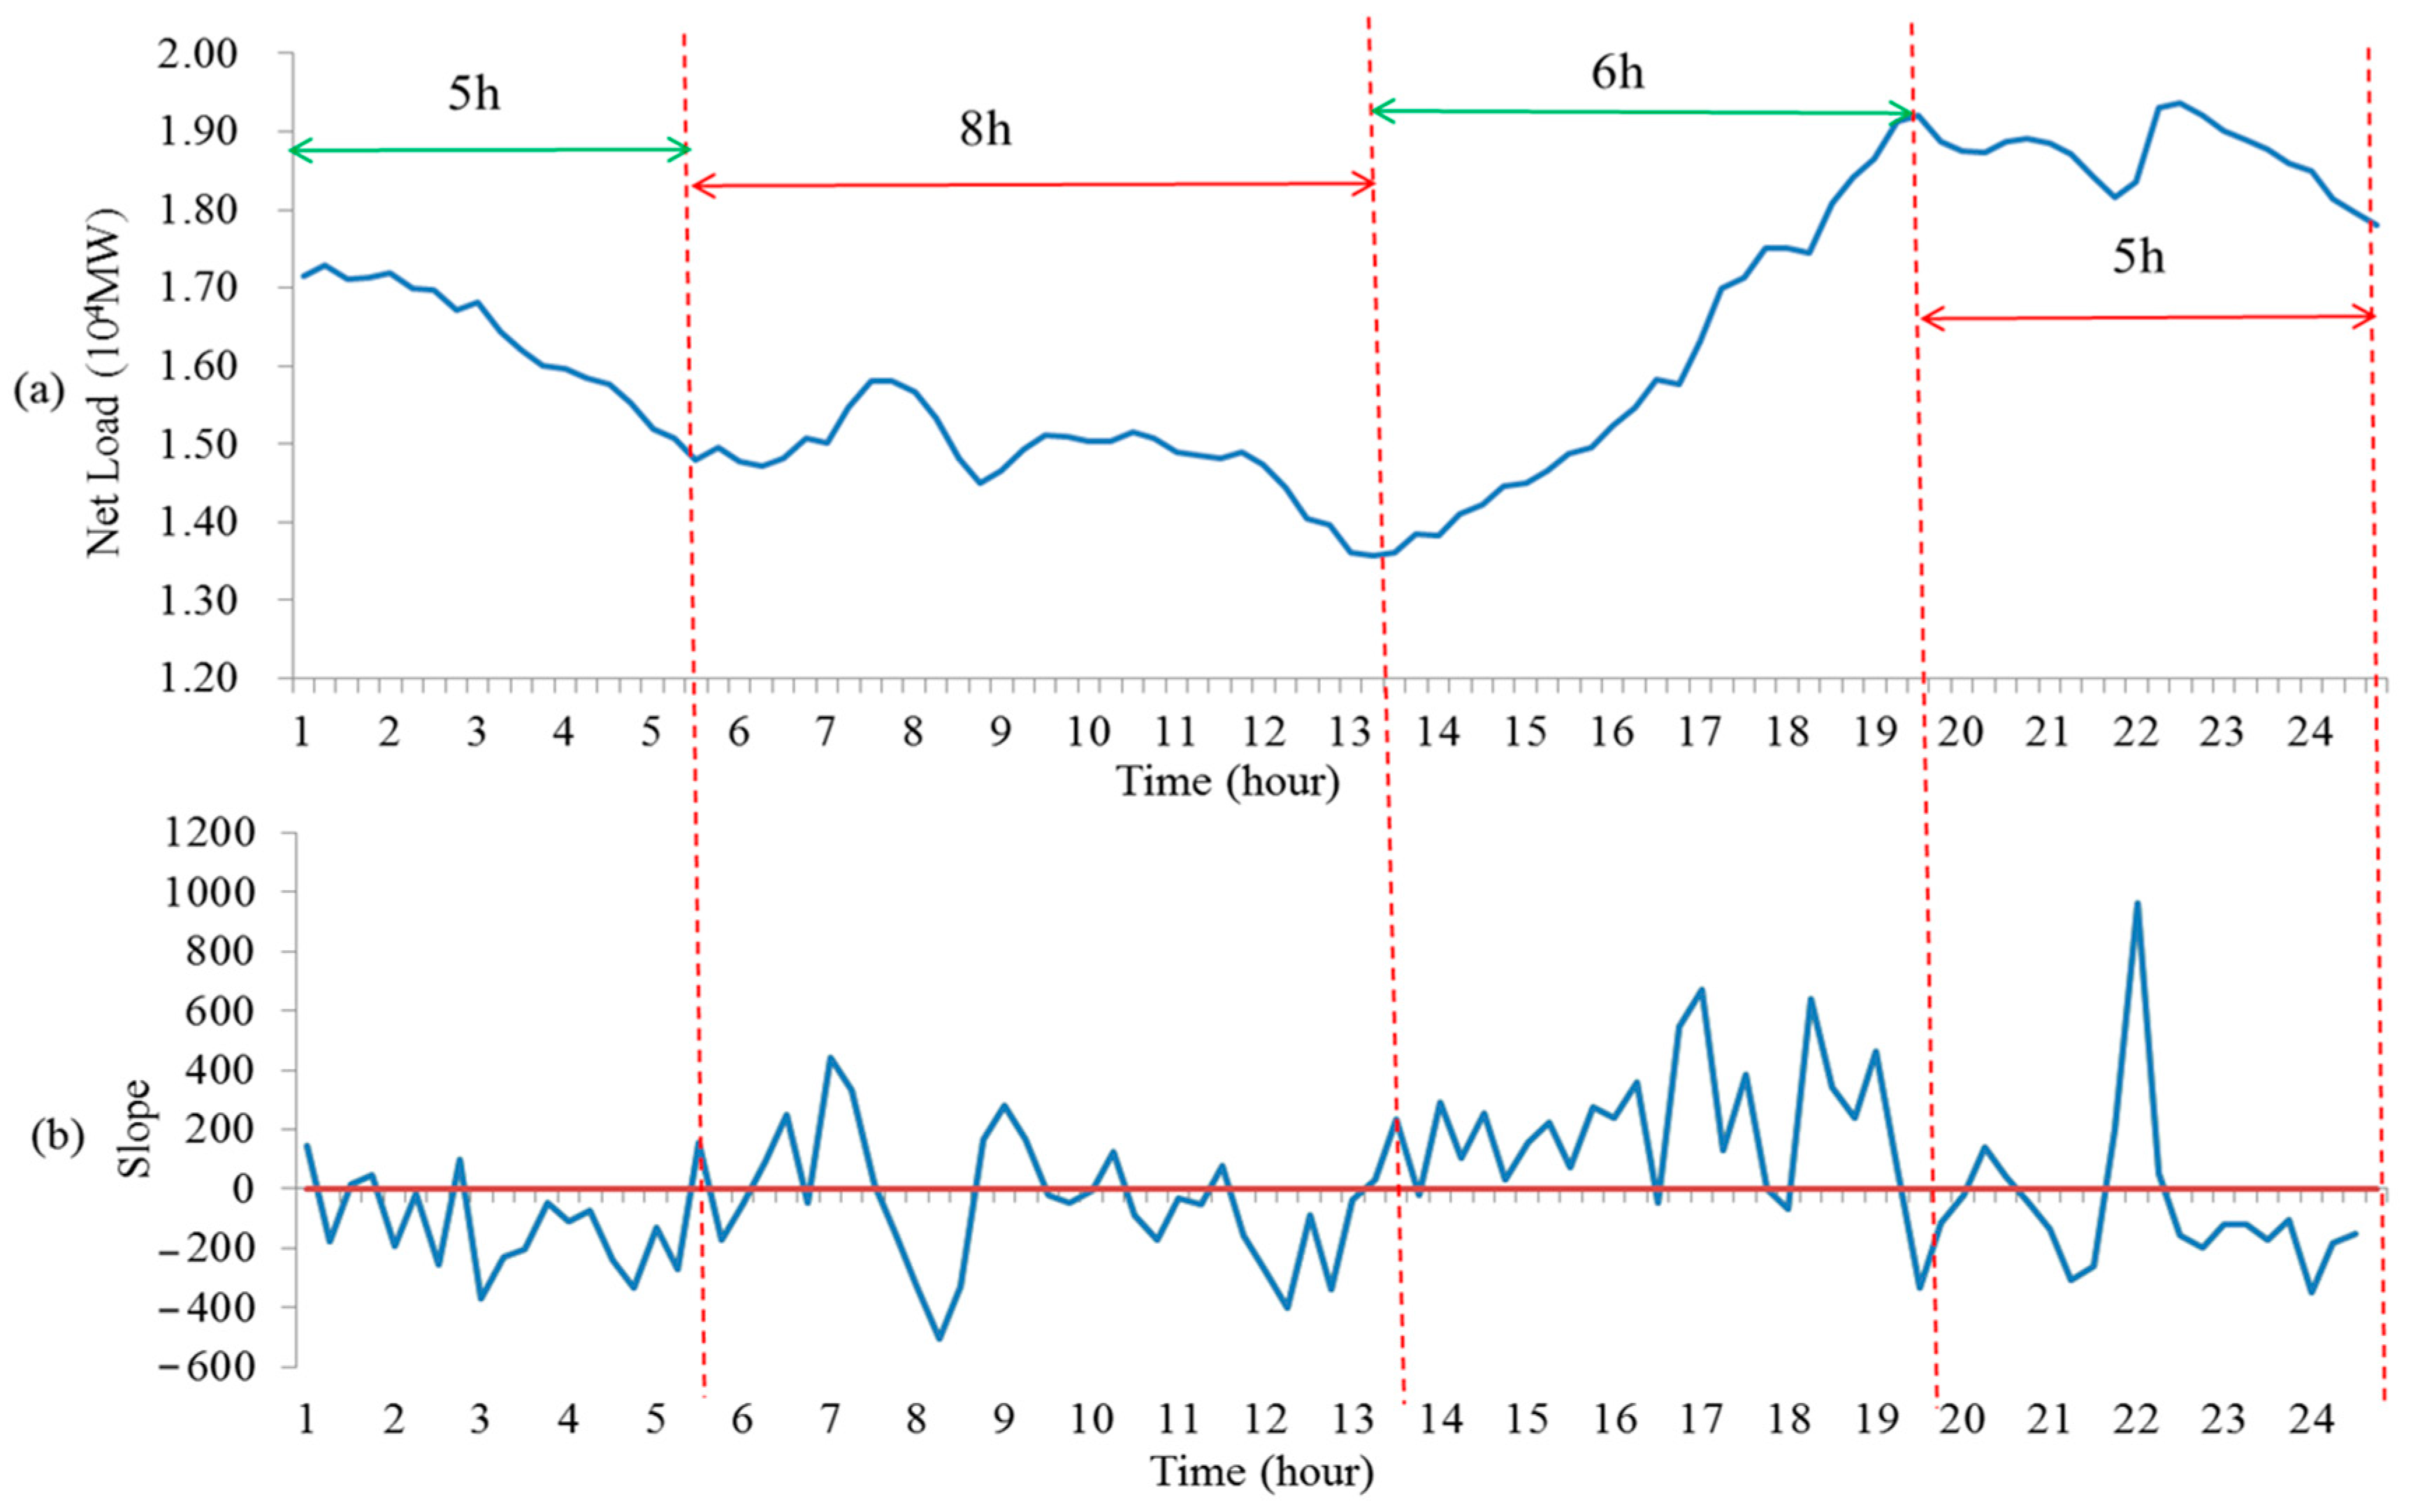
2. Numerical Characteristic Analysis of the Net Load

In the traditional power dispatch operation, the dispatching time scales are usually fixed, such as 24 h day-ahead power dispatch and 96 time scale power dispatch. In these power dispatch modes, when the system uncertainties are increased, the power outputs of thermal generators need to be adjusted frequently every hour or 15 min, which will cause the mechanical loss and reduce the operation efficiency. In this section, the numerical characteristics of the net load are analyzed and the generating mode of thermal generators is provided.
The time series of the traditional load is shown as { L l } = { l ( 1 ) , l ( 2 ) , , l ( N ) } and the uncertain power output time series is shown as { W l } = { w ( 1 ) , w ( 2 ) , , w ( N ) } . Thus, the time series of net load is defined as { N L l } = { n l ( 1 ) , n l ( 2 ) , , n l ( N ) } , n l ( l ) = l ( l ) w ( l ) , where, l = 1 , 2 , , N 1 . The slope of the adjacent point is an important numerical characteristic of the net load. The sign changing of the slope means that the changing direction of net load changes. Conversely, if the slope sign does not change in a certain time interval, the net load conforms to the monotony change in that time interval. The slope of the adjacent points is calculated as Equation (1) shows.
S l o p e ( l ) = n l ( l + 1 ) n l ( l )
In order to calculate the changing frequency of the net load, the ratio of sign variation to the data is rolling calculated during time interval t l ~ t l + k , where the l = 1 , 2 , , N 1 and k = 1 , 2 , , N l . The equation is formulated as follows.
s y m b o l l S l o p e = sign ( S l o p e ( l ) )
{ i f s y m b o l l S l o p e = s y m b o l l + 1 S l o p e , t r a n s l S l o p e = 0 i f s y m b o l l S l o p e s y m b o l l + 1 S l o p e , t r a n s l S l o p e = 1
R a t i o l , l + k S l o p e = count k = 1 ~ N l ( t r a n s l S l o p e , t r a n s l + k S l o p e ) k
where the s y m b o l l S l o p e in Equation (1) means the sign extraction; if s y m b o l l S l o p e equals to 1, the net load at the next moment is larger than the prior one, conversely, if s y m b o l l S l o p e equals to −1, the net load at the next moment is smaller than the prior one. Equation (3) is formulated to mark the sign changing of the adjacent slope. t r a n s l S l o p e equals to 0 means that the sign of the adjacent slope is the same and the changing direction of the net load is not changed; t r a n s l S l o p e equals to 1 means that the sign of the adjacent slope is changed and the changing direction of the net load is changed. The ratio of slope sign variation to data size is calculated by Equation (4), where the data starting point is l, the data length is k, and the corresponding time interval is t l ~ t l + k . The calculation process is shown in Figure 1.
According to the rolling calculation above, a matrix R a t i o with ( N 1 ) × ( N 1 ) ranks comprised by elements R a t i o l , l + k S l o p e can be achieved. The meaning of lines is the data length and the meaning of rows is the data starting point. In accordance with the time sequence, the R a t i o l , l + k S l o p e is classified according to its value. The similar data are divided in a same time interval, thus the segment points t g of the subsequence are achieved, where t g Τ and g = 1 , 2 , , G . Τ is the set of segment points and G is the number of the subsequences. The flow chart of net load time division is shown in Figure 2.
The detail steps of net load subsequence time division are as follows:
First of all, the maximum value R a t i o max and the minimum value R a t i o min of the upper triangular matrix in R a t i o are calculated, where the first line in the matrix is excluded (the first line is the original slope sequence). The starting points and the data length are recorded and the maximum and minimum value of the ratio of slope sign variation to data size are achieved.
Secondly, the recorded data are reset and the matrix in R a t i o are upgraded. The minimum value R a t i o of the remaining data, excluding 0, is calculated. Further the relative errors of R a t i o to R a t i o max and R a t i o to R a t i o min are calculated, after which the R a t i o is classified to the group with smaller relative error.
Thirdly, the data length threshold is given and the length of the remaining continuous data is compared with the threshold. If the length of data is longer than the threshold then repeat the second step; on the contrary, if the length of data is shorter than the threshold, the remaining data are classified in the same group. The threshold is determined dynamically according to the divided time intervals, which is usually set as 3 h.
Finally, the starting points and the length of data of the divided time intervals are recorded. The time intervals with the overlapping part are integrated in a same one until there is no overlapping part in each time interval.
The complexity of the net load is calculated by the SampEn theory [36], which can be formulated as Equations (A1) and (A2) in Appendix A.

3. Wind-Thermal-Nuclear-Storage Combined Time Division Power Dispatch Model

3.1. Thermal Generating Mode

In order to reduce the ramping time of the thermal generators and extend the stable operation time, which can improve the utilization efficiency of traditional power sources and the stability of auxiliary systems, the thermal generator generating mode is determined by the numerical characteristic of net load. The SampEn is introduced to reflect the complexity level of the net load. The SampEn and net load complexity have the positive correlation and the proportion of SampEn is the evaluation criterion of the net load complexity. If the magnitude of the proportion of SampEn in each subsequence is different, the magnitude has priority to be the proportion threshold. If the magnitude of the proportion of SampEn in each subsequence is the same, the proportion threshold is determined according to the actual SampEn calculation results.
The S a m p E n t τ t τ + 1 N e t L o a d is the SampEn of the subsequence P N L t τ t τ + 1 during the time interval t τ to t τ + 1 . The R a t i o t τ t τ + 1 S a m p E n is the proportion of S a m p E n t τ t τ + 1 N e t L o a d , which is formulated as Equation (5).
R a t i o t τ t τ + 1 S a m p E n = S a m p E n t τ t τ + 1 N e t L o a d s u m ( S a m p E n N e t L o a d )
The thermal generating mode according to SampEn is as follows, where the threshold of the proportion is expressed as φ .
1. If R a t i o t τ t τ + 1 S a m p E n φ :
The more complex the net load time series is, the larger SampEn it has. In a time period with certain length, the data of net load are changing frequently and there is no obvious amplitude changing. Thermal generators prefer to maintain continuous and stable power outputs and the main power balance source is the pumped storage.
2. If R a t i o t τ t τ + 1 S a m p E n < φ :
The less complex the net load time series is, the smaller SampEn is. In a time period with certain length, there is obviously amplitude changing and the changing will last a certain time. In this time period, thermal generators ramp up and down to respond to the changing of net load and as the main power balance source. The pumped storage with strong peak shaving capability participate in the dispatch coordinates with the thermal generators.
The thermal generating mode with SampEn of net load is formulated as Equations (6) and (7).
{ R a t i o t τ t τ + 1 S a m p E n φ : | max ( P j , t τ , P j , t τ + 1 , , P j , t τ + 1 ) min ( P j , t τ , P j , t τ + 1 , , P j , t τ + 1 ) | = 0 R a t i o t τ t τ + 1 S a m p E n < φ : P min , j P j , t P max , j t ( t τ , t τ + 1 )
t τ + 1 = t τ + Δ t τ , Δ t τ Δ t
where P j , t is the real power output of unit j at time t. P min j is the jth minimum thermal power outputs and P max , j is the jth maximum thermal power outputs; t τ is the starting time point in the time interval Δ t τ ; t τ + 1 is the ending time point in the time interval Δ t τ and also it is the starting time point of the next time interval; Δ t is the column vector composed by the divided time intervals; Δ t τ is the τ th time interval in Δ t , where τ = 1 , 2 , , Γ ; Γ is the total amount of the dispatching periods.

3.2. Time Division Day-Ahead Power Dispatch Model

3.2.1. Objective Functions

In the time division day-ahead power dispatch model, the thermal generation cost F T , environmental cost F E [13], which is equivalent to the carbon dioxide emissions and the pumped storage operation cost F H are formulated in Equation (8). The meanings of the parameters are introduced in Table 5.
{ F T = t = 1 T j G ( a j × P j , t 2 + b j × P j , t + c j ) F E = t = 1 T j G ( α j × P j , t 2 + β j × P j , t + γ j ) F H = t = 1 T h H ( c H P × S ( P H , h , t P ) + c H G × S ( P H , h , t G ) ) + t = 1 T 1 ( c H PG × S H , t , t + 1 PG )
In this paper, T is 24 h and G is the number of the thermal generators of a real provincial power system, which is 17 here. The period of the three objectives is day.
The nuclear power generation cost F N is formulated in Equation (9). The meanings of the parameters are introduced in Table 5.
F N = t = 1 T n N ( a n NU × P n , t NU + b n NU )
According to the 2015 Projected Costs of Generating Electricity reported by the International Energy Agency (IEA) and the Nuclear Energy Agency (NEA), the nuclear power generating costs contain the operational and maintenance cost, fuel cost and waste management cost [37]. The fuel cost and the waste management cost are represented by the coefficient b n NU and the operation and maintenance cost is represented by the coefficient a n NU .
The nuclear power unit participating in the peak-shaving of the power dispatch will bring peak-shaving costs. The peak-shaving of the nuclear power unit will raise the auxiliary power ratio and reduce the generating efficiency, further increasing the average generating costs. When the nuclear power unit operation power is decreased from the rated operation power P R N to ( 1 λ PD ) P R N , where λ PD is the depth of peak-shaving, the operation cost of nuclear power unit operating at ( 1 λ PD ) P R N is formulated as follows.
F λ PD PS = 1 + η P PS 1 + η R PS F R NU
where, F R NU is the operation cost under the rated power level; η R PS is the auxiliary power ratio under the rated power level; η P PS is the auxiliary power ratio under ( 1 λ PD ) P R N power level.
Although the shutdown refueling cycle of the nuclear power plant can be adjusted within limits according to the power level of the nuclear units, the nuclear power unit participating in the peak-shaving will cause fuel waste, in general. The nuclear peak-shaving fuel cost is shown in Equation (11).
F N UPS = ( 1 λ PD ) F R NU
Thus, the nuclear peak-shaving cost can be formulated as
F N PS = F N UPS + F λ PD PS F R NU

3.2.2. Constraints

1. Power Balance Constraints
The power balance constraints at time t are formulated in Equation (13). The meanings of the parameters are introduced in Table 5.
j = 1 G P j , t + h = 1 H P H , h , t G + n = 1 N P n , t N P NL , t h = 1 H P H , h , t P = 0
where P NL , t can be calculated by P NL , t = P L , t w = 1 W P W , w , t pre s = 1 S P S , s , t pre .
2. Constraints of Thermal Generators
The constraints contain the generating power limits, the generating ramp rate limits, and the spinning reserve chance constraints. According to reference [38], the fluctuation of photovoltaic power mainly occurs in the time scale of 5 min, thus in the day-ahead power dispatch, the up and down reserve for wind power need to satisfy a certain probability and for photovoltaic power, the up and down reserve are plus and minus 5% of the predicted photovoltaic power, respectively.
The constraint equations are as follows. The meanings of the parameters are introduced in Table 5.
{ P min , j P j , t P max , j P j , t P j , t 1 R U j P j , t 1 P j , t R D j Pr { j = 1 G P U R , j , t w = 1 W ( P W , w , t pre P W , w , t ) + s = 1 S P S , s , t UR } ρ Pr { j = 1 G P D R , j , t w = 1 W ( P W , w , t P W , w , t pre ) + s = 1 S P S , s , t DR } ρ P U R , j , t min ( P max , j P j , t , R U j ) P D R , j , t min ( P j , t P min , j , R D j )
The uncertainty of wind power outputs are considered through its probability distribution, which is estimated based on the Beta distribution [39], shown in Equation (15). The above chance constraints are solved by the definition of fractile, shown in Equation (16). The meanings of the parameters are introduced in Table 5.
f w ( p w ) = p w α 1 ( 1 p w ) β 1 B ( α , β )
Pr ( Y > Y ρ ) = ρ ρ ( 0 , 1 )
3. The Pumped Storage Operation Constraints
The constraints of pumping and generating power and the reservoir energy conversion of the pumped storage are shown as follows. The meanings of the parameters are introduced in Table 5.
{ P H , min , h G P H , h , t G P H , max , h G P H , min , h P P H , h , t P P H , max , h P H h , t + 1 = H h , t + Δ t × ( P H , h , t P × γ P P H , h , t G γ G ) H h , T = H h , 1 H min , h H h , t H max , h P H , h , t G P H , h , t P = 0
4. The Constraints of Nuclear Power Generation
The constraints of nuclear power generation are formulated according to the daily load tracking mode. The nuclear power units are operated at high power level and low power level, the constraints are shown as follows. The meanings of the parameters are introduced in Table 5.
P n , t N = { P N , I t [ 0 , t min I ] [ t max II , 24 ] P N , II t [ t max I , t min II ] P N , II ( t t min I ) + ( t max I t ) P N , I t max I t min I t [ t min I , t max I ] P N , I ( t t min II ) + ( t max II t ) P N , II t max II t min II t [ t min II , t max II ]
{ T max I T min I T min T max II T min II T min T   min I + 24 T max II T min N , I T min II T max I T min N , II
λ PD λ PD , max
λ PD = max ( P N , I , P N , II ) min ( P N , I , P N , II ) max ( P N , I , P N , II )

4. Case Study

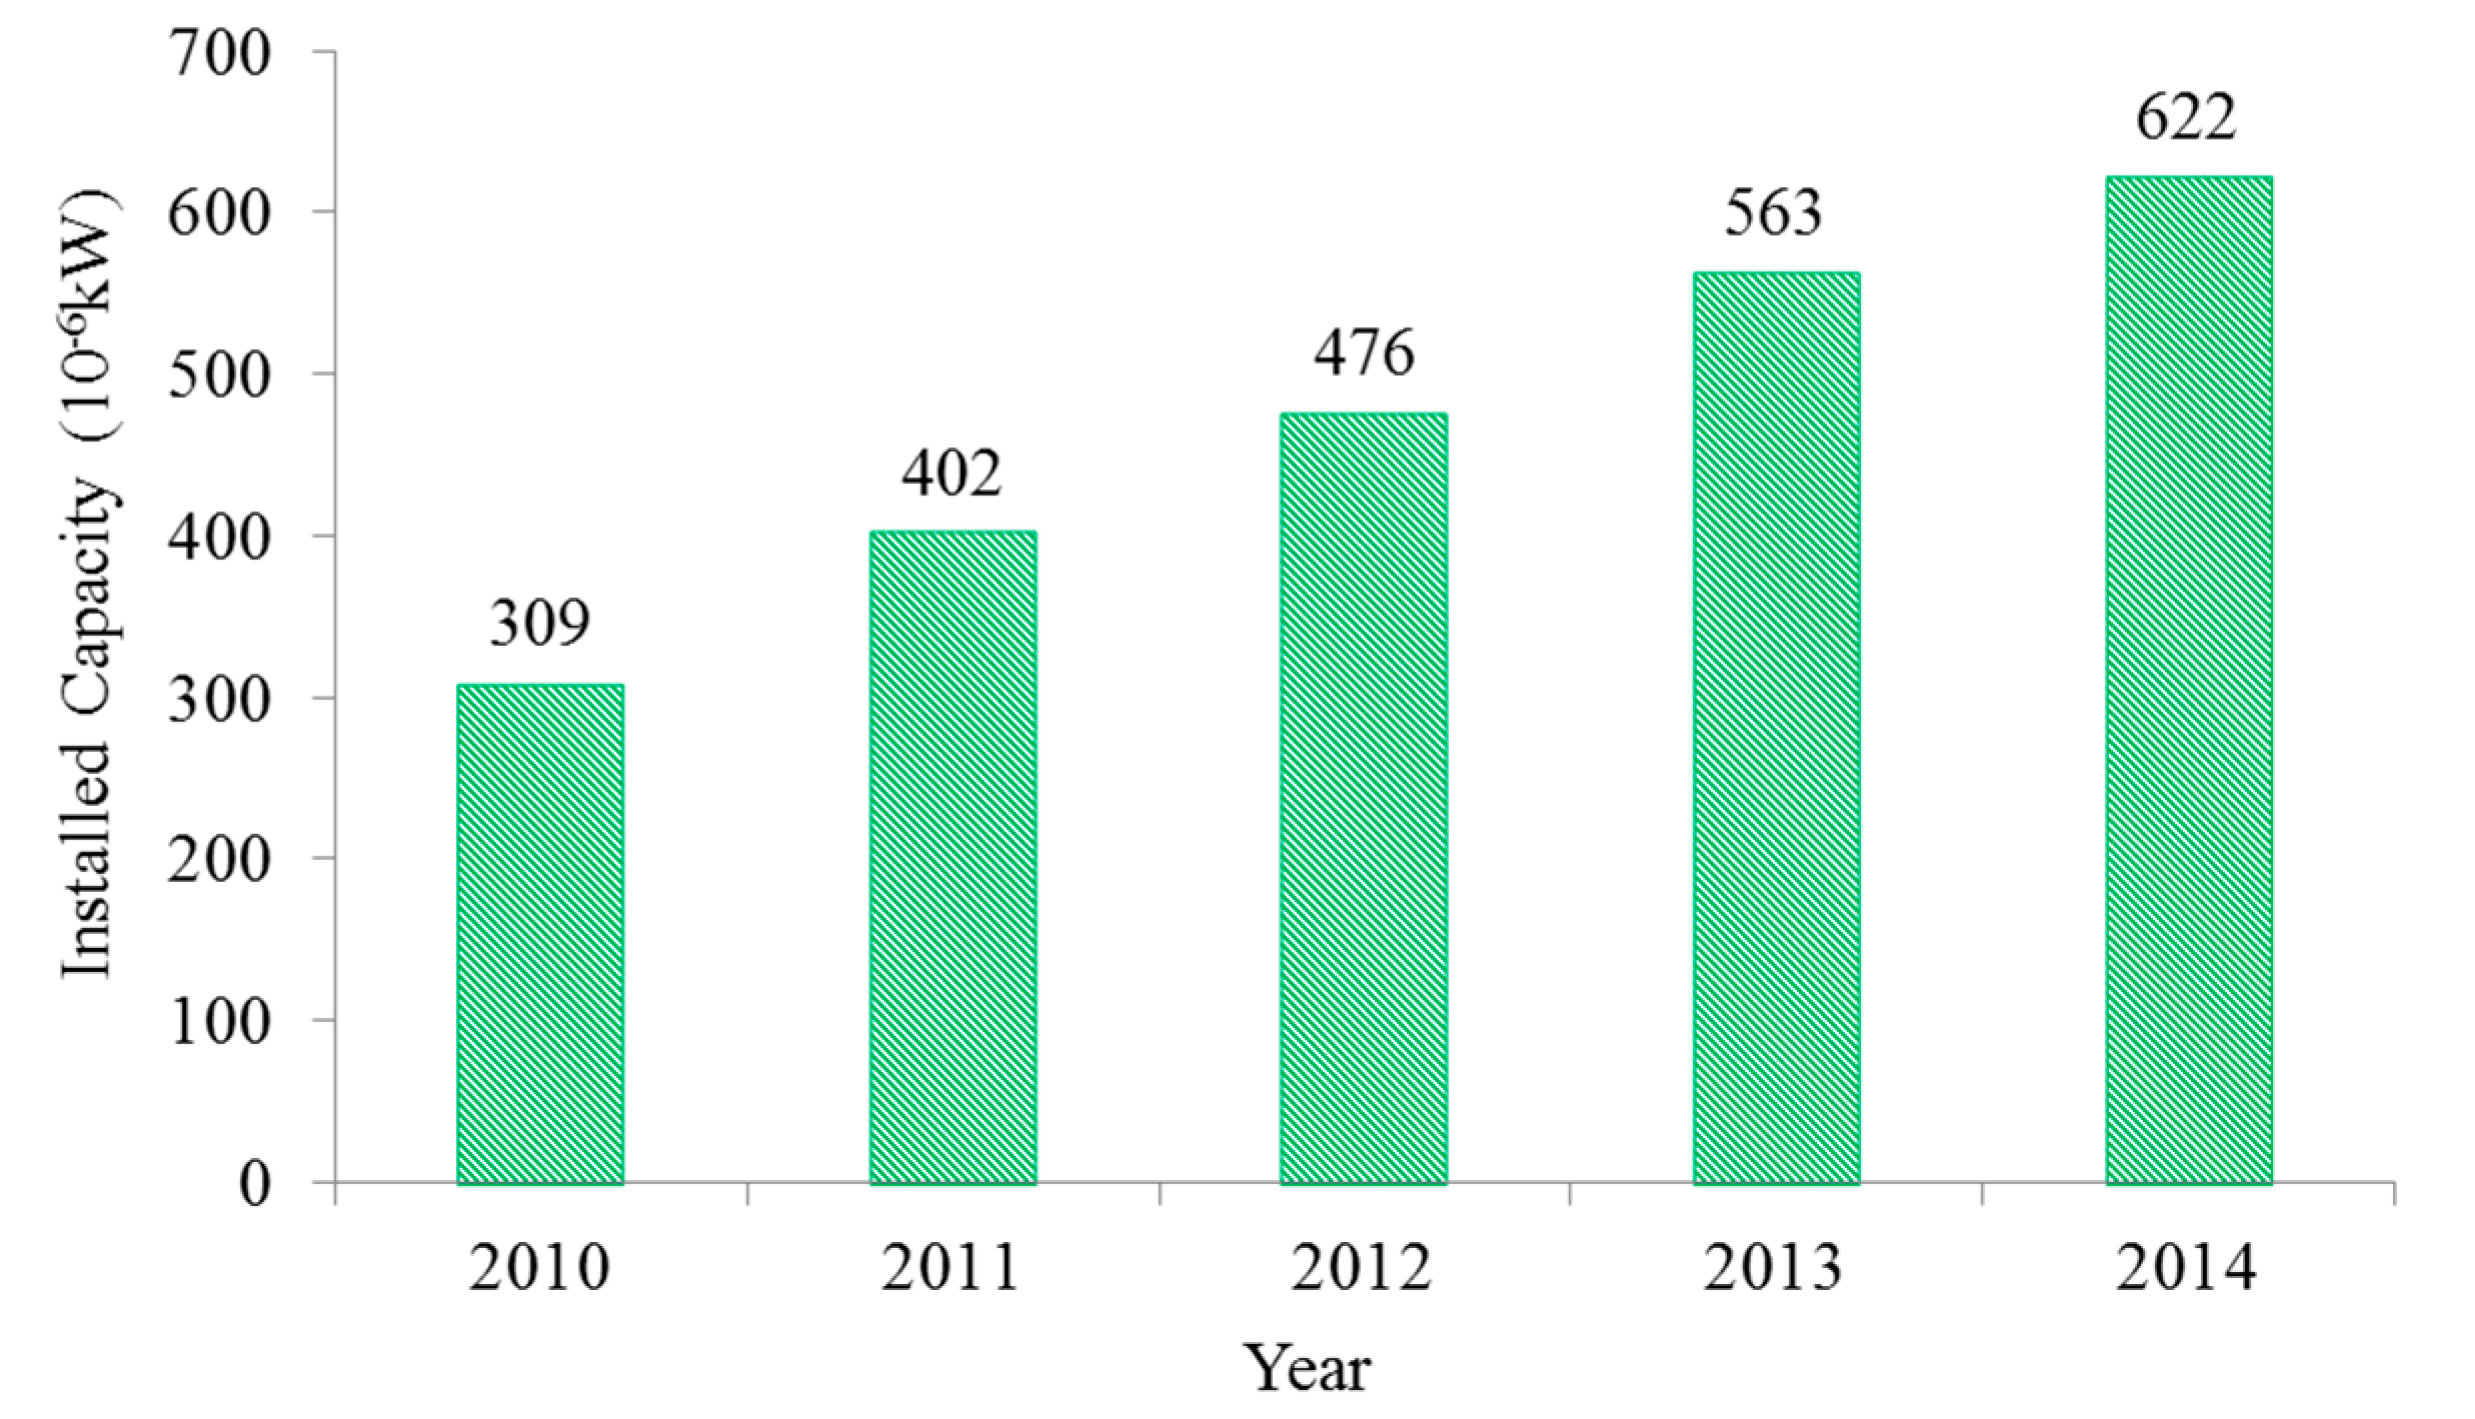
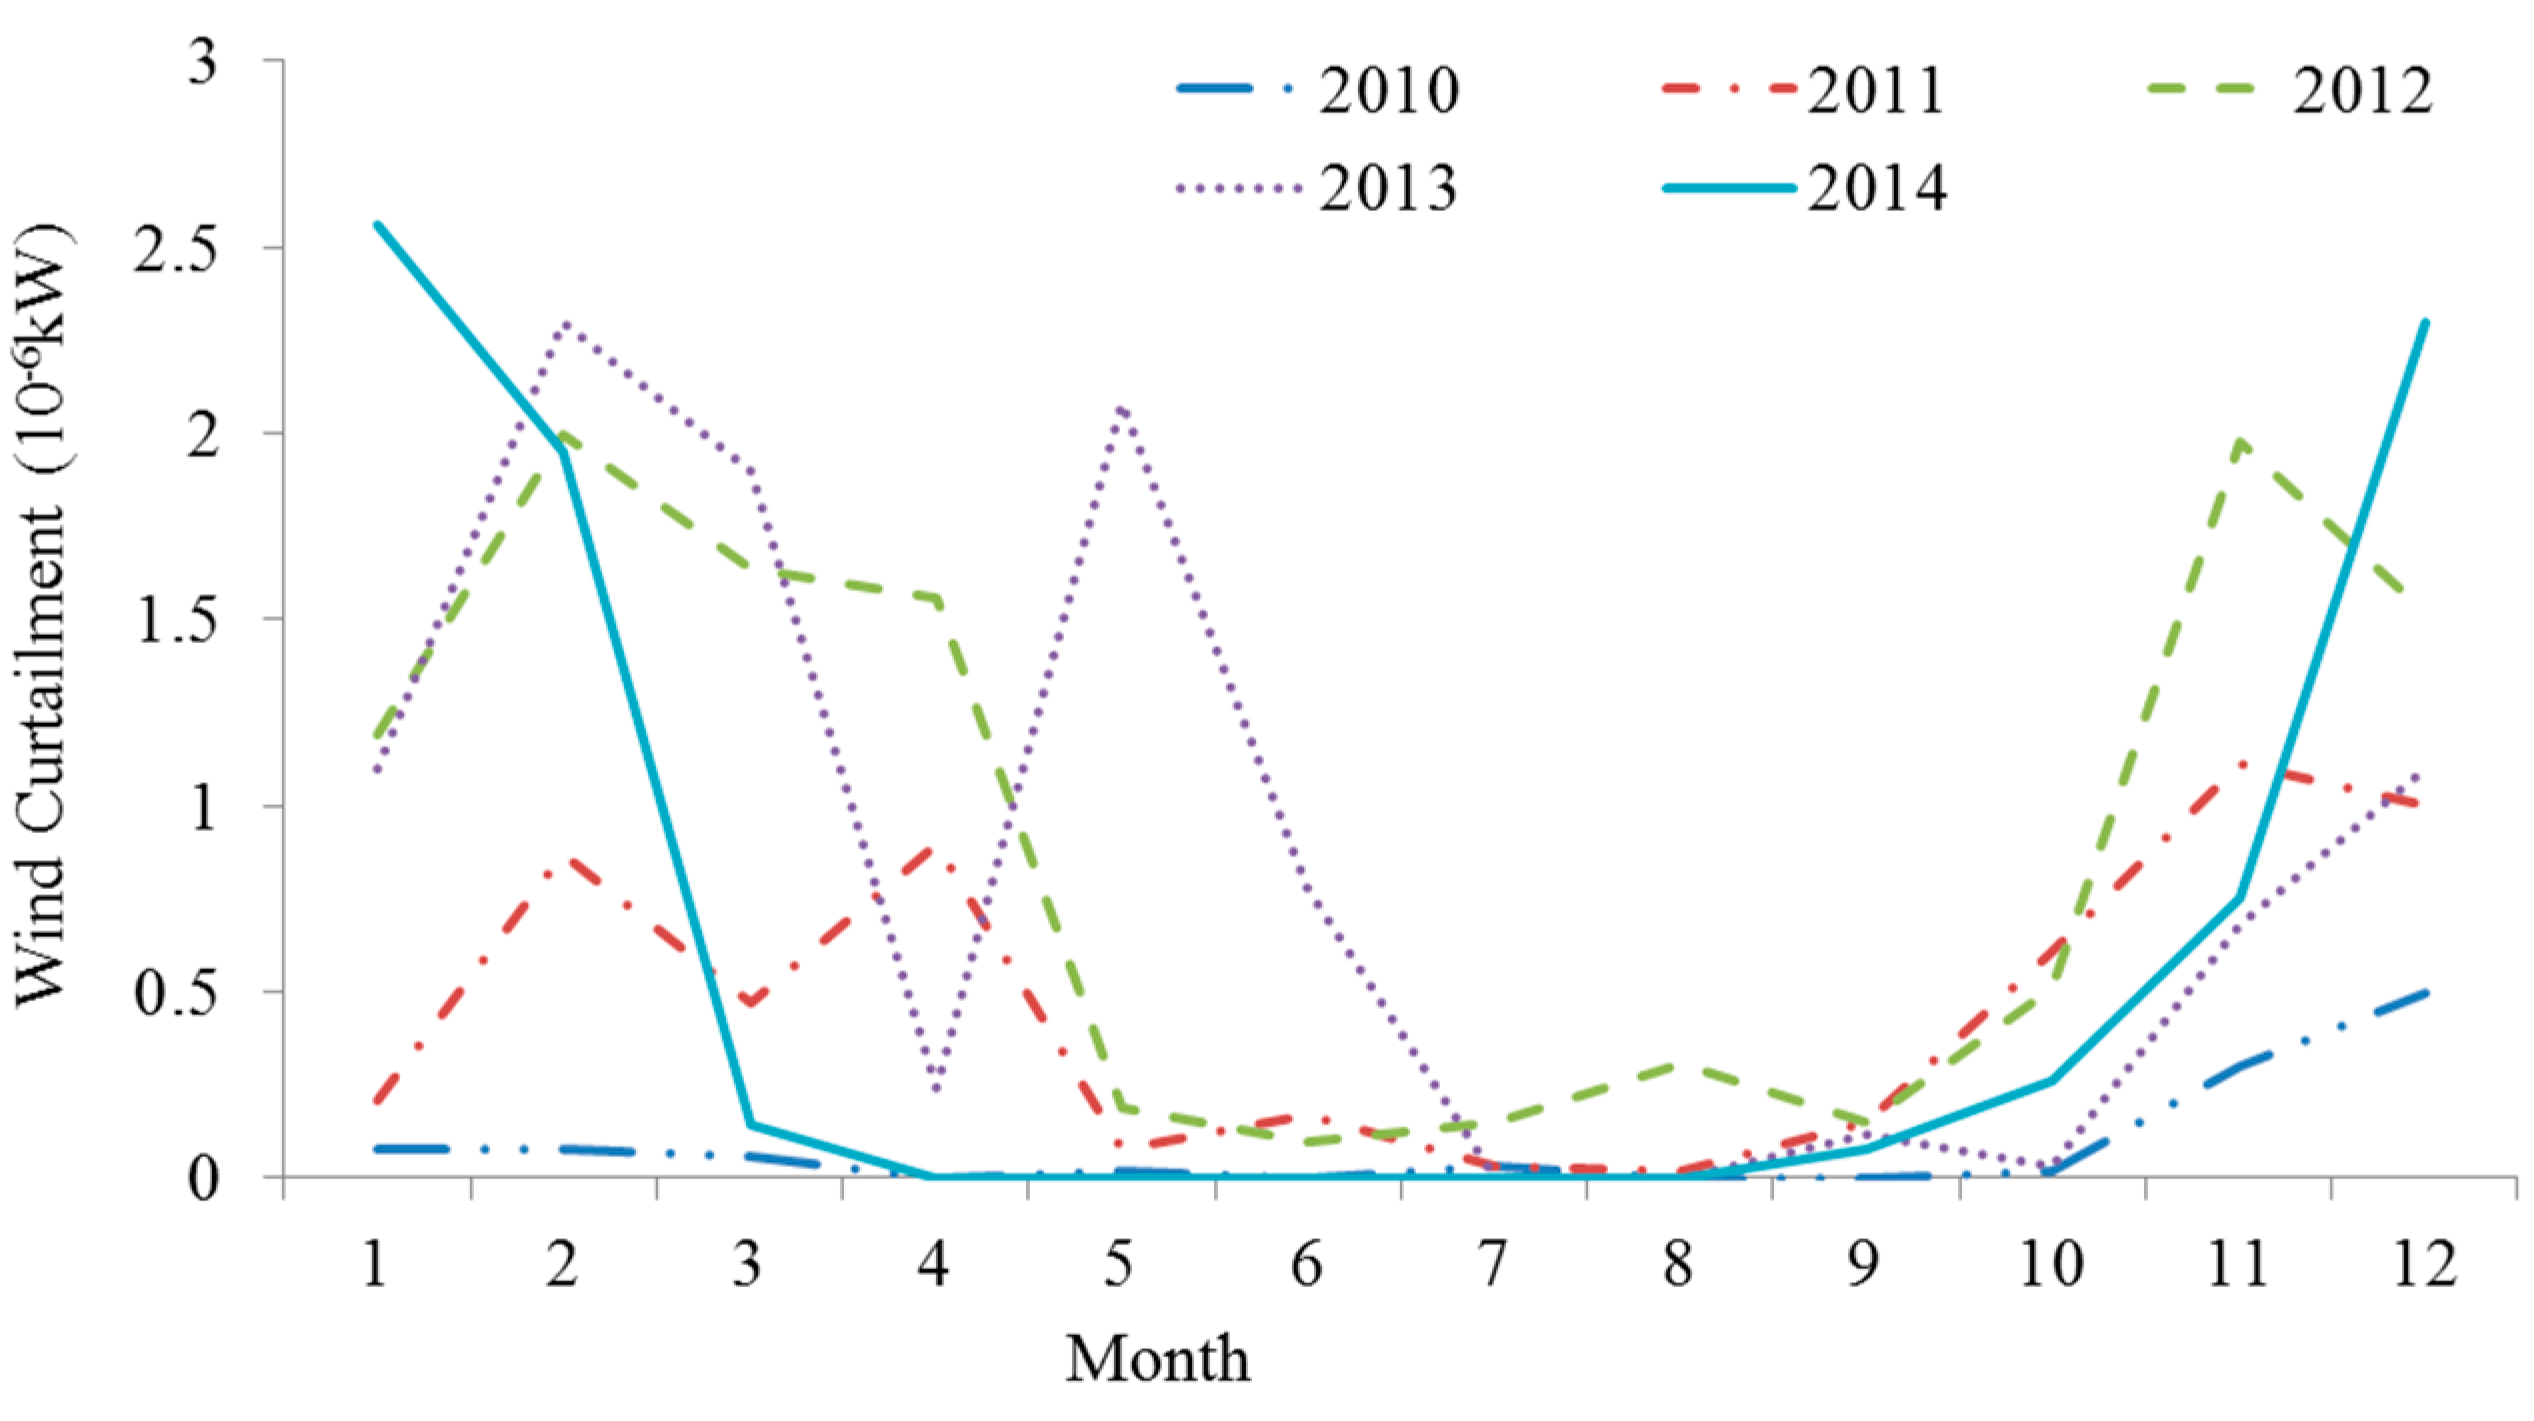
4.1. Status Analysis of the Provincial Power Grid

In this paper, an actual provincial power system in the northeast of China is developed to demonstrate the effectiveness of the proposed power dispatch strategy. This power system is the load center of the northeast China power grid, in which the loads are concentrated and the power sources are distributed unevenly. Nowadays, with the increase of the installed capacity of wind power, there are series urgent problems. This province is in the northeast of China, where the coal resources are abundant and the thermal power generation is the main supply power. When the machine and furnace have defects or the quality of the coal is poor, the power resources will be insufficient to meet the load demands. Thus, in this province, the load growth, new generator production, installed capacity of wind power and machine and furnace defects are taken into account and there will be sufficient reserve capacity reserved on the condition that there is no large-scale unplanned units shut down or large area lack of coal units shut down. For example, the annual reserve power in 2015 is more than 4.2 million kW. The superfluous reserve power will cause the waste of resources and does not follow the energy sustainable development strategy [40]. This province is rich in wind energy, but due to the output uncertainty of wind power, the prediction accuracy of wind power is low. During the load trough periods, wind curtailment will occur. The changing tendency of the wind power installed capacity is shown in Figure 3 and the wind curtailment situation of the provincial power grid is shown in Figure 4.
By the end of 2014, this province contains pumped storage units with 2000 MW installed capacity, whose capacity proportion is less than 10% of the traditional power resources. Furthermore, the province contains hydropower plants with 620.5 MW installed capacity, whose capacity proportion is less than 5% of the traditional power resources. The installed capacity of the power sources with peak shaving capability is not sufficient to meet the renewable energy consumption demands. Moreover, the reservoir capacity of the pumped storage is limited, due to which the pumped storage generation does not have the capability of long-time sustained generation. The day-ahead dispatch mode in this province is the traditional fixed time duration dispatch, thus the traditional power generators need to respond to the uncertainty of the renewable power generation which will cause the frequent generated power adjustment and reduce the unit life and operation efficiency. With the long history of the coal mining, the coal resources are exhausted. The new power dispatch strategy which can improve the renewable energy consumption, decrease the thermal power generation and realize that the wind-thermal-nuclear-storage cooperative operation is urgently needed.

4.2. The Actual Operating Environment and Parameters of the Provincial Power Grid

In the provincial power grid, there are 91 thermal units with installed capacity of 23,345 MW and 77 wind power units with installed capacity of 6219.61 MW. The thermal generators are integrated as 17 thermal generators based on the regions in the province. There is one pumped storage with installed capacity of 2000 MW and an operation efficiency of 76.5% [41], whose generation state cost is RMB 750 yuan/MW, pumping state cost is RMB 1000 yuan/MW, and operation state switching cost is RMB 1500 yuan [42,43]. There are four provincial directly scheduled photovoltaic power stations with the total installed capacity of 40 MW and 15 provincial directly scheduled hydraulic power plants with the total installed capacity of 620.5 MW. There is one nuclear power plant with installed capacity of 2237.58 MW, where the η R PS is 5% and the η P PS is 7%. The operation cost under rated power level is 222.4 yuan/MW·h [44]. The coefficients of fuel cost functions and environmental cost functions for thermal units are shown in Table 7. In this paper, the case study is conducted based on the provincial power system under maximum operational mode during non-heating periods, in which there are certain amounts of generators and equipment under overhaul. The installed capacity and scale of renewable power energy in 2014 is small, however, according to the national renewable energy and power system development plan, the installed capacity in this paper is extended to 10,000 MW. The load data in a day in late April is chosen and the maximum load is 19,445 MW. Thus, the wind permeability is 51%. The wind permeability is the proportion of wind installed capacity to the maximum load. Under the maximum operation mode during the non-heating periods, all the provincial directly scheduled photovoltaic power stations access the power grid. The generation costs of wind power and photovoltaic are ignored.

4.3. SampEn Calculation of the Net Load

The net load curve of the provincial power grid and its slope are shown in Figure 5. The net load numerical characteristics are analyzed and the complexity are calculated based on SampEn. The results are shown in Table 1, where the proportion threshold is set as 20%.

4.4. Result Comparison and Analysis

There are four cases in this paper, where the wind power reserve confidence degree is 0.9.
  • Case 1: Dispatch strategy without SampEn and the nuclear power is constant.
  • Case 2: Dispatch strategy based on SampEn and the nuclear power is constant.
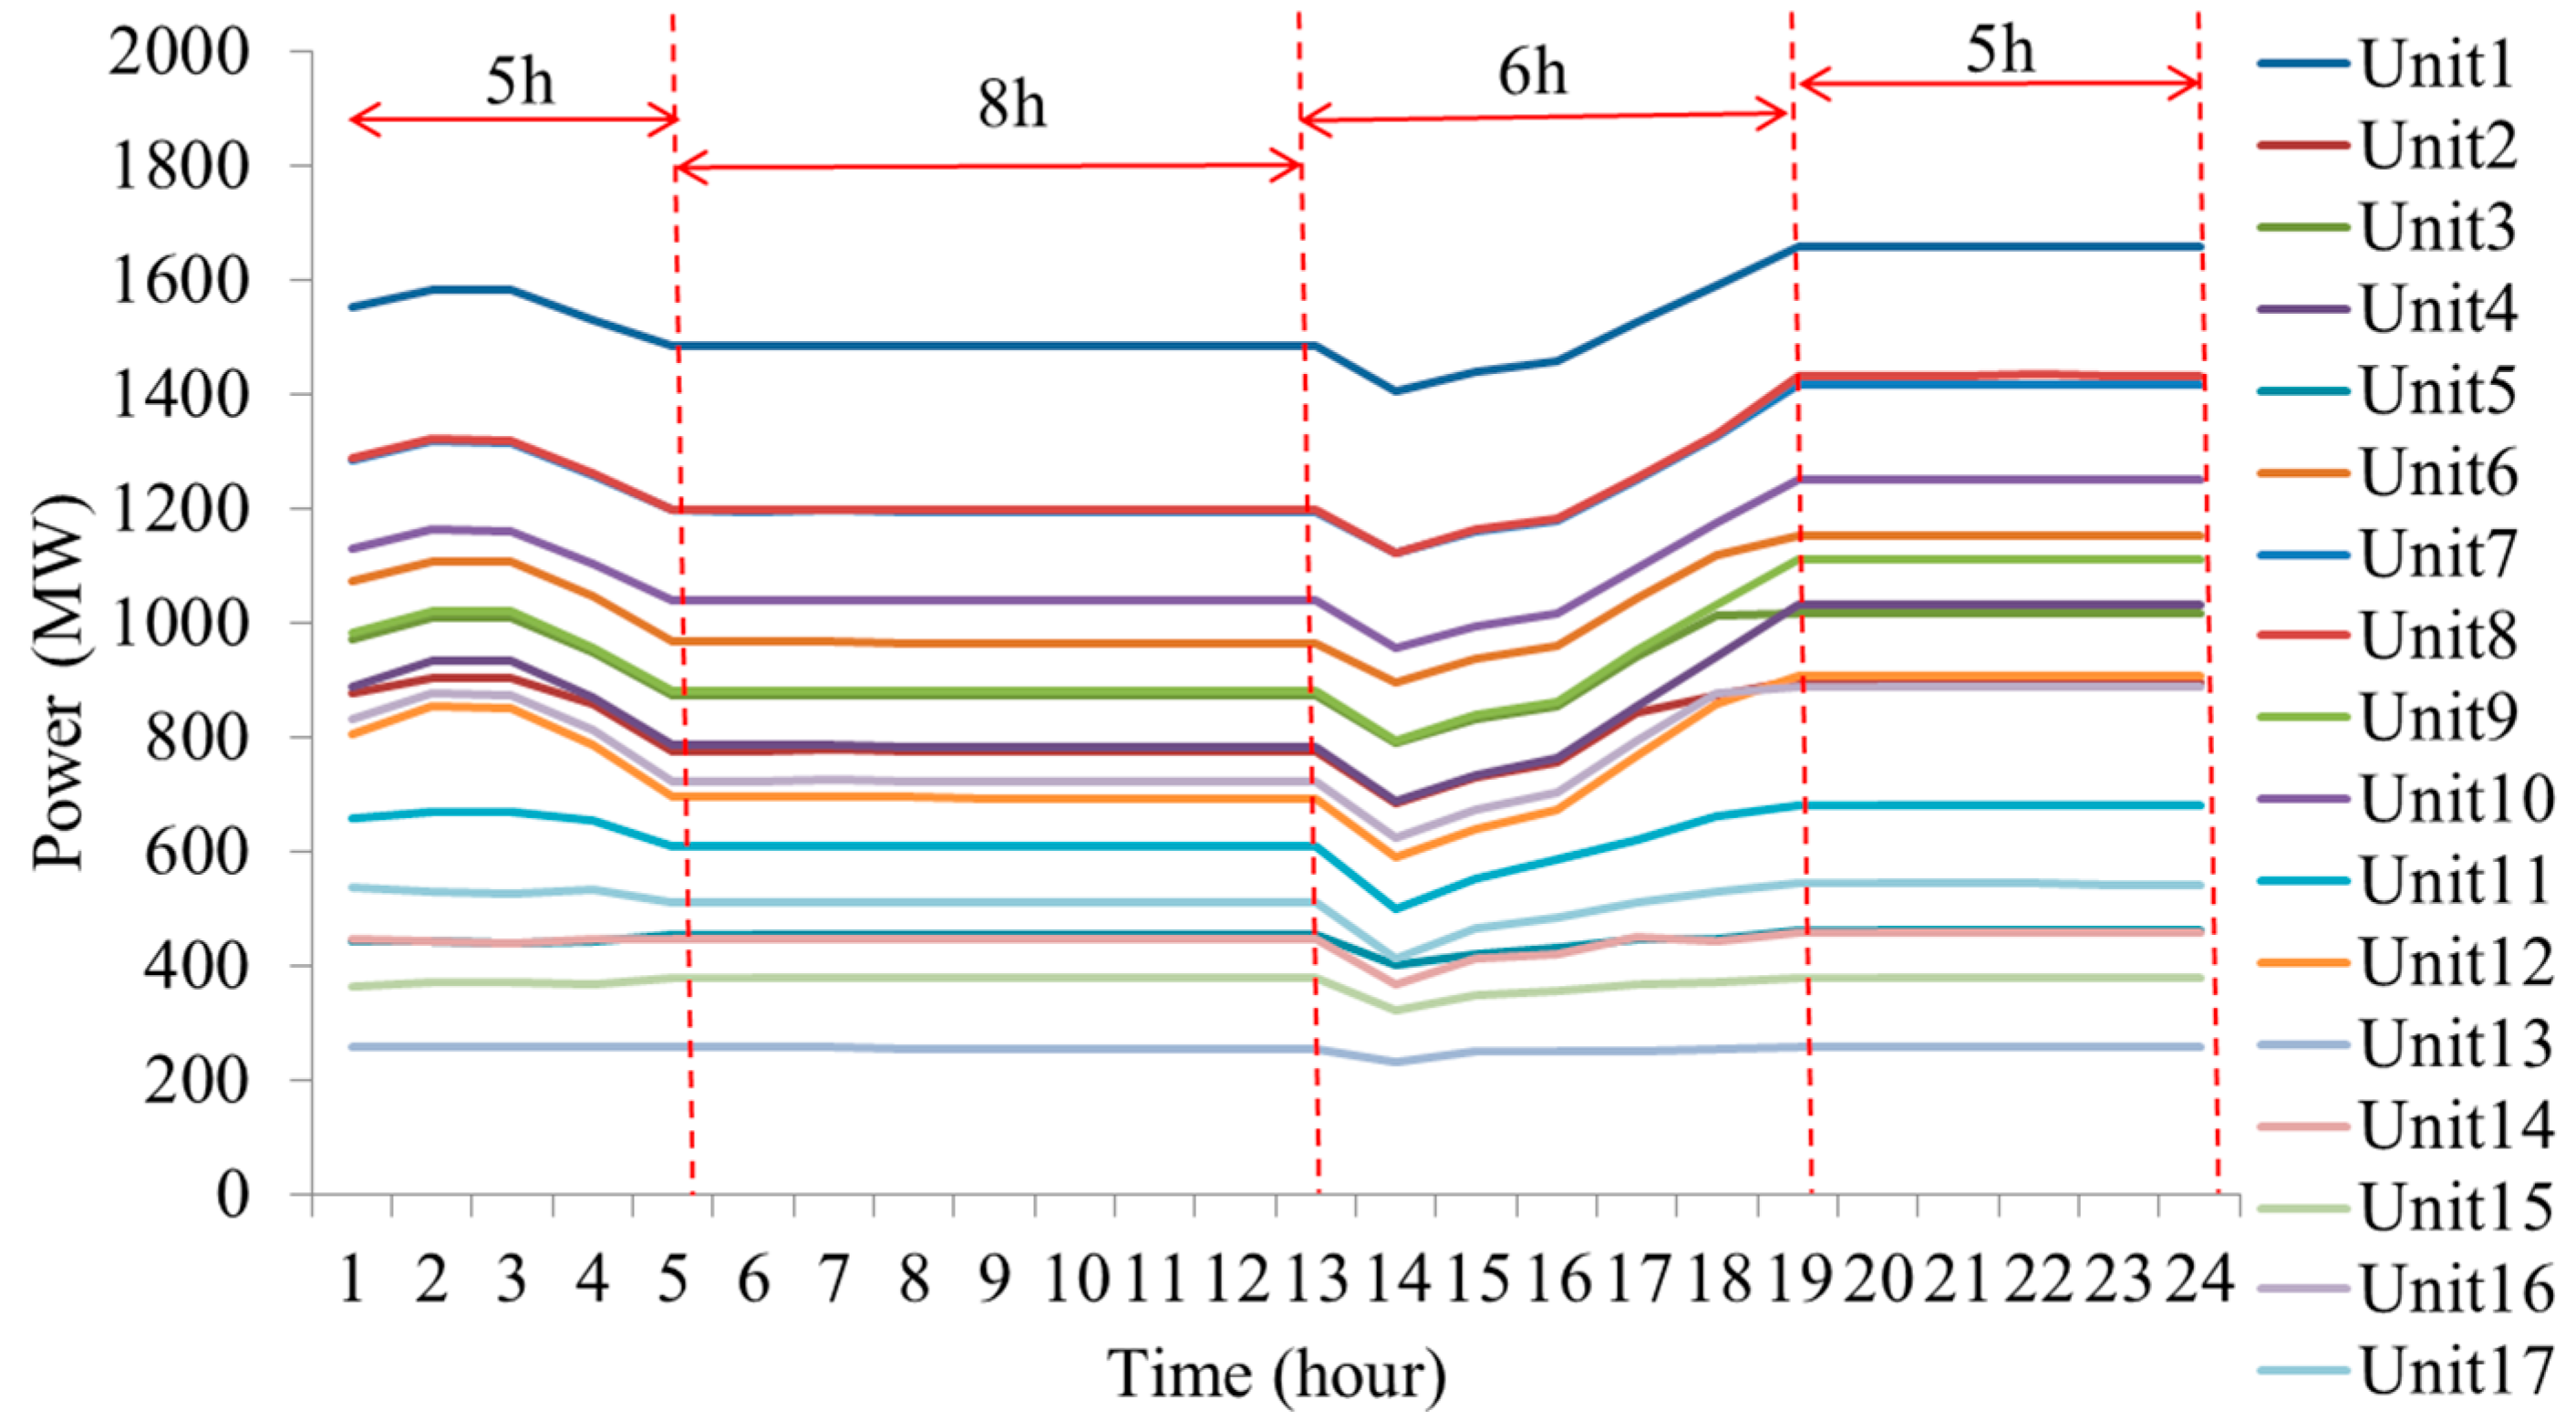
  • Case 3: Dispatch strategy based on SampEn and the nuclear power is under “6-3-12-3” operation mode, where the nuclear generators are operating at high power level for 6 h, operating at low power level for 12 h, and ramping up and down for 3 and 3 h, respectively.
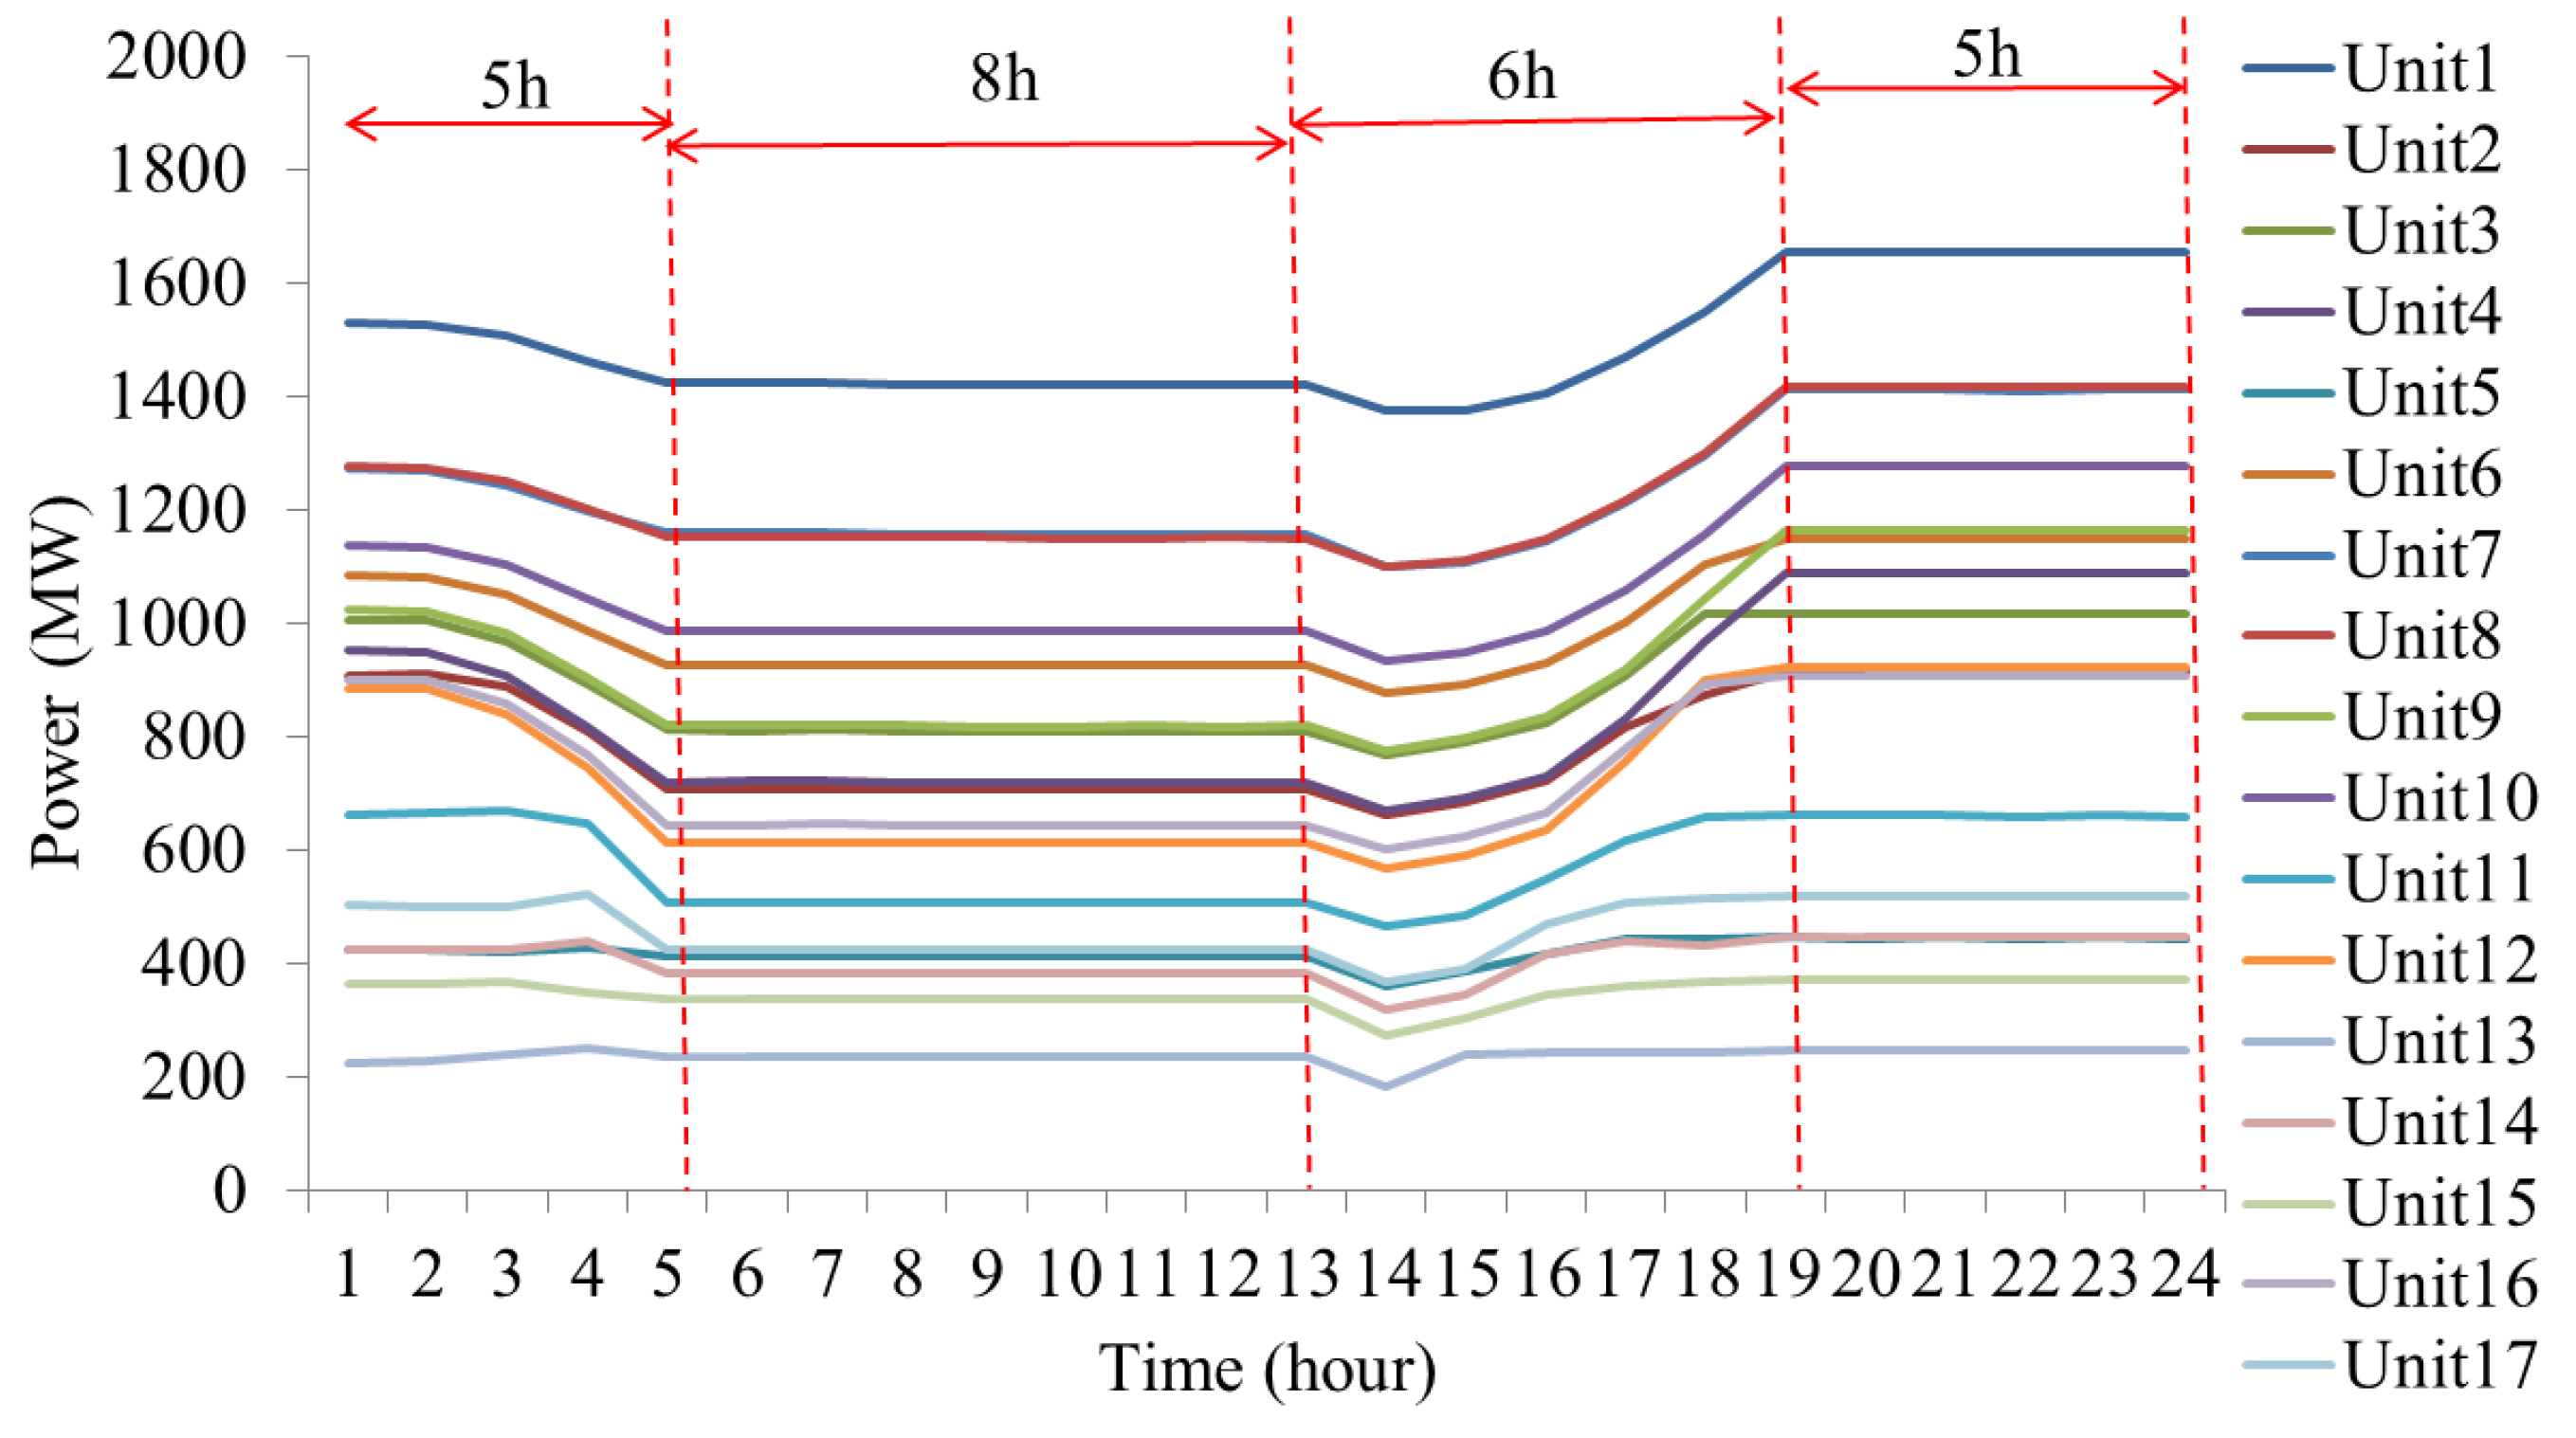
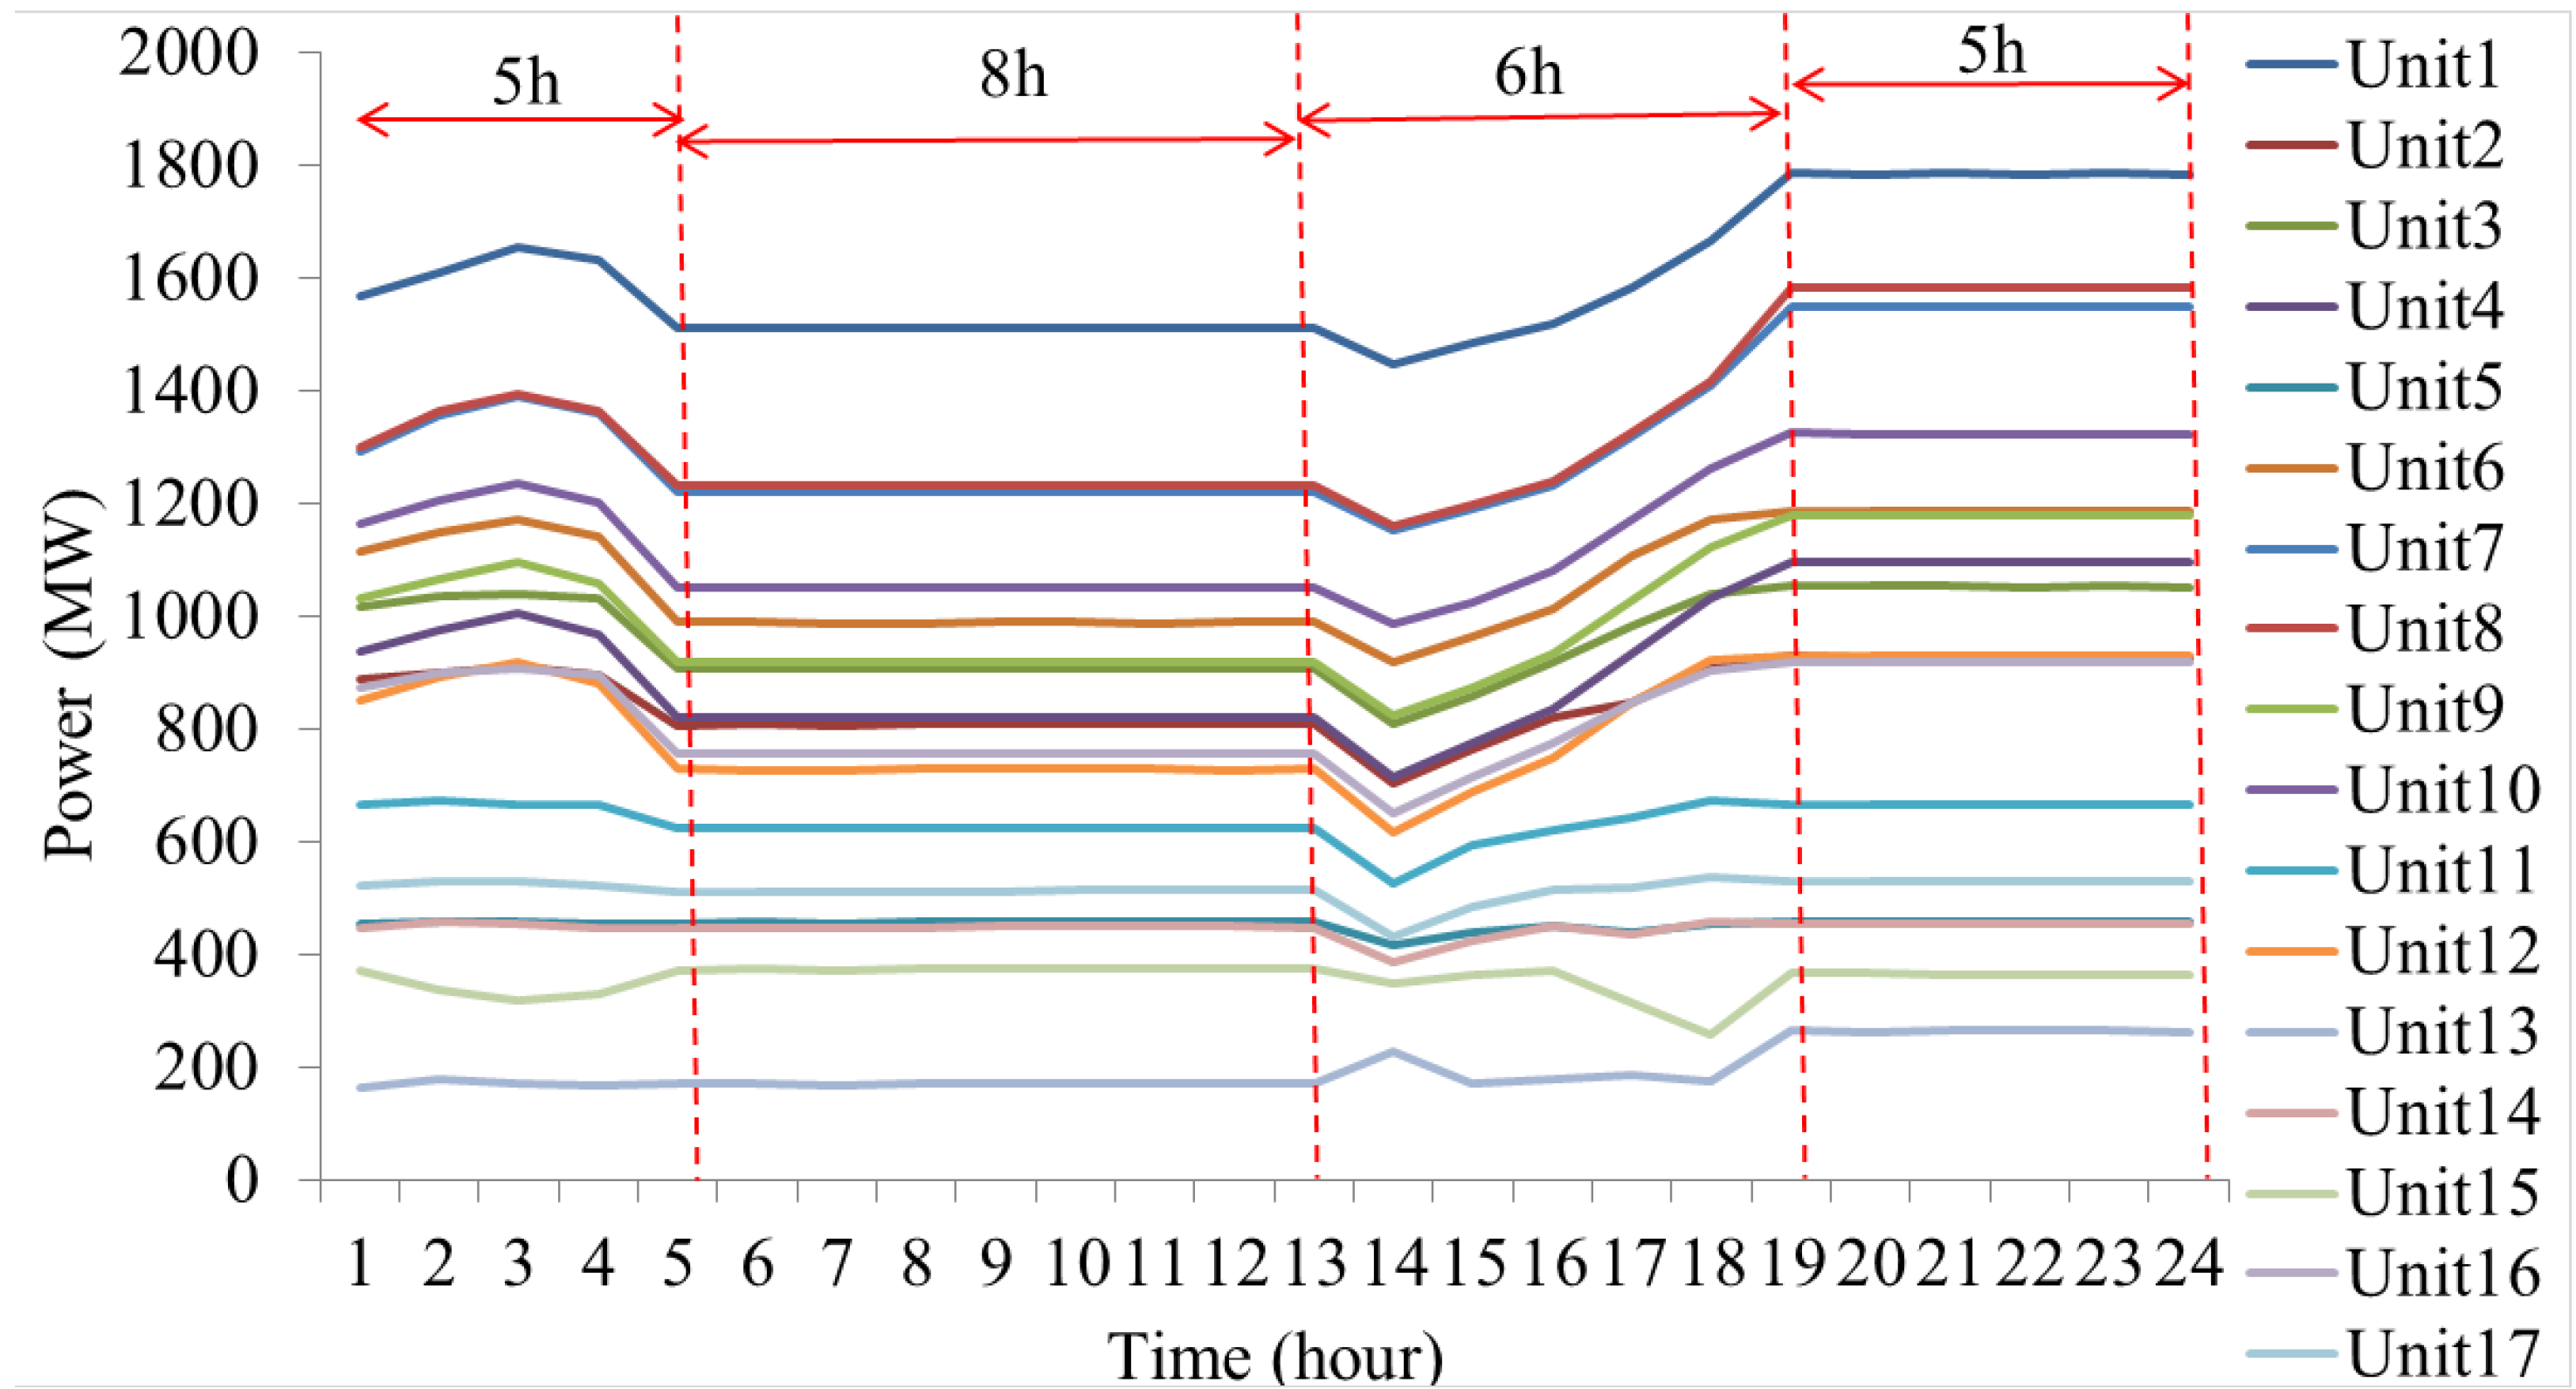
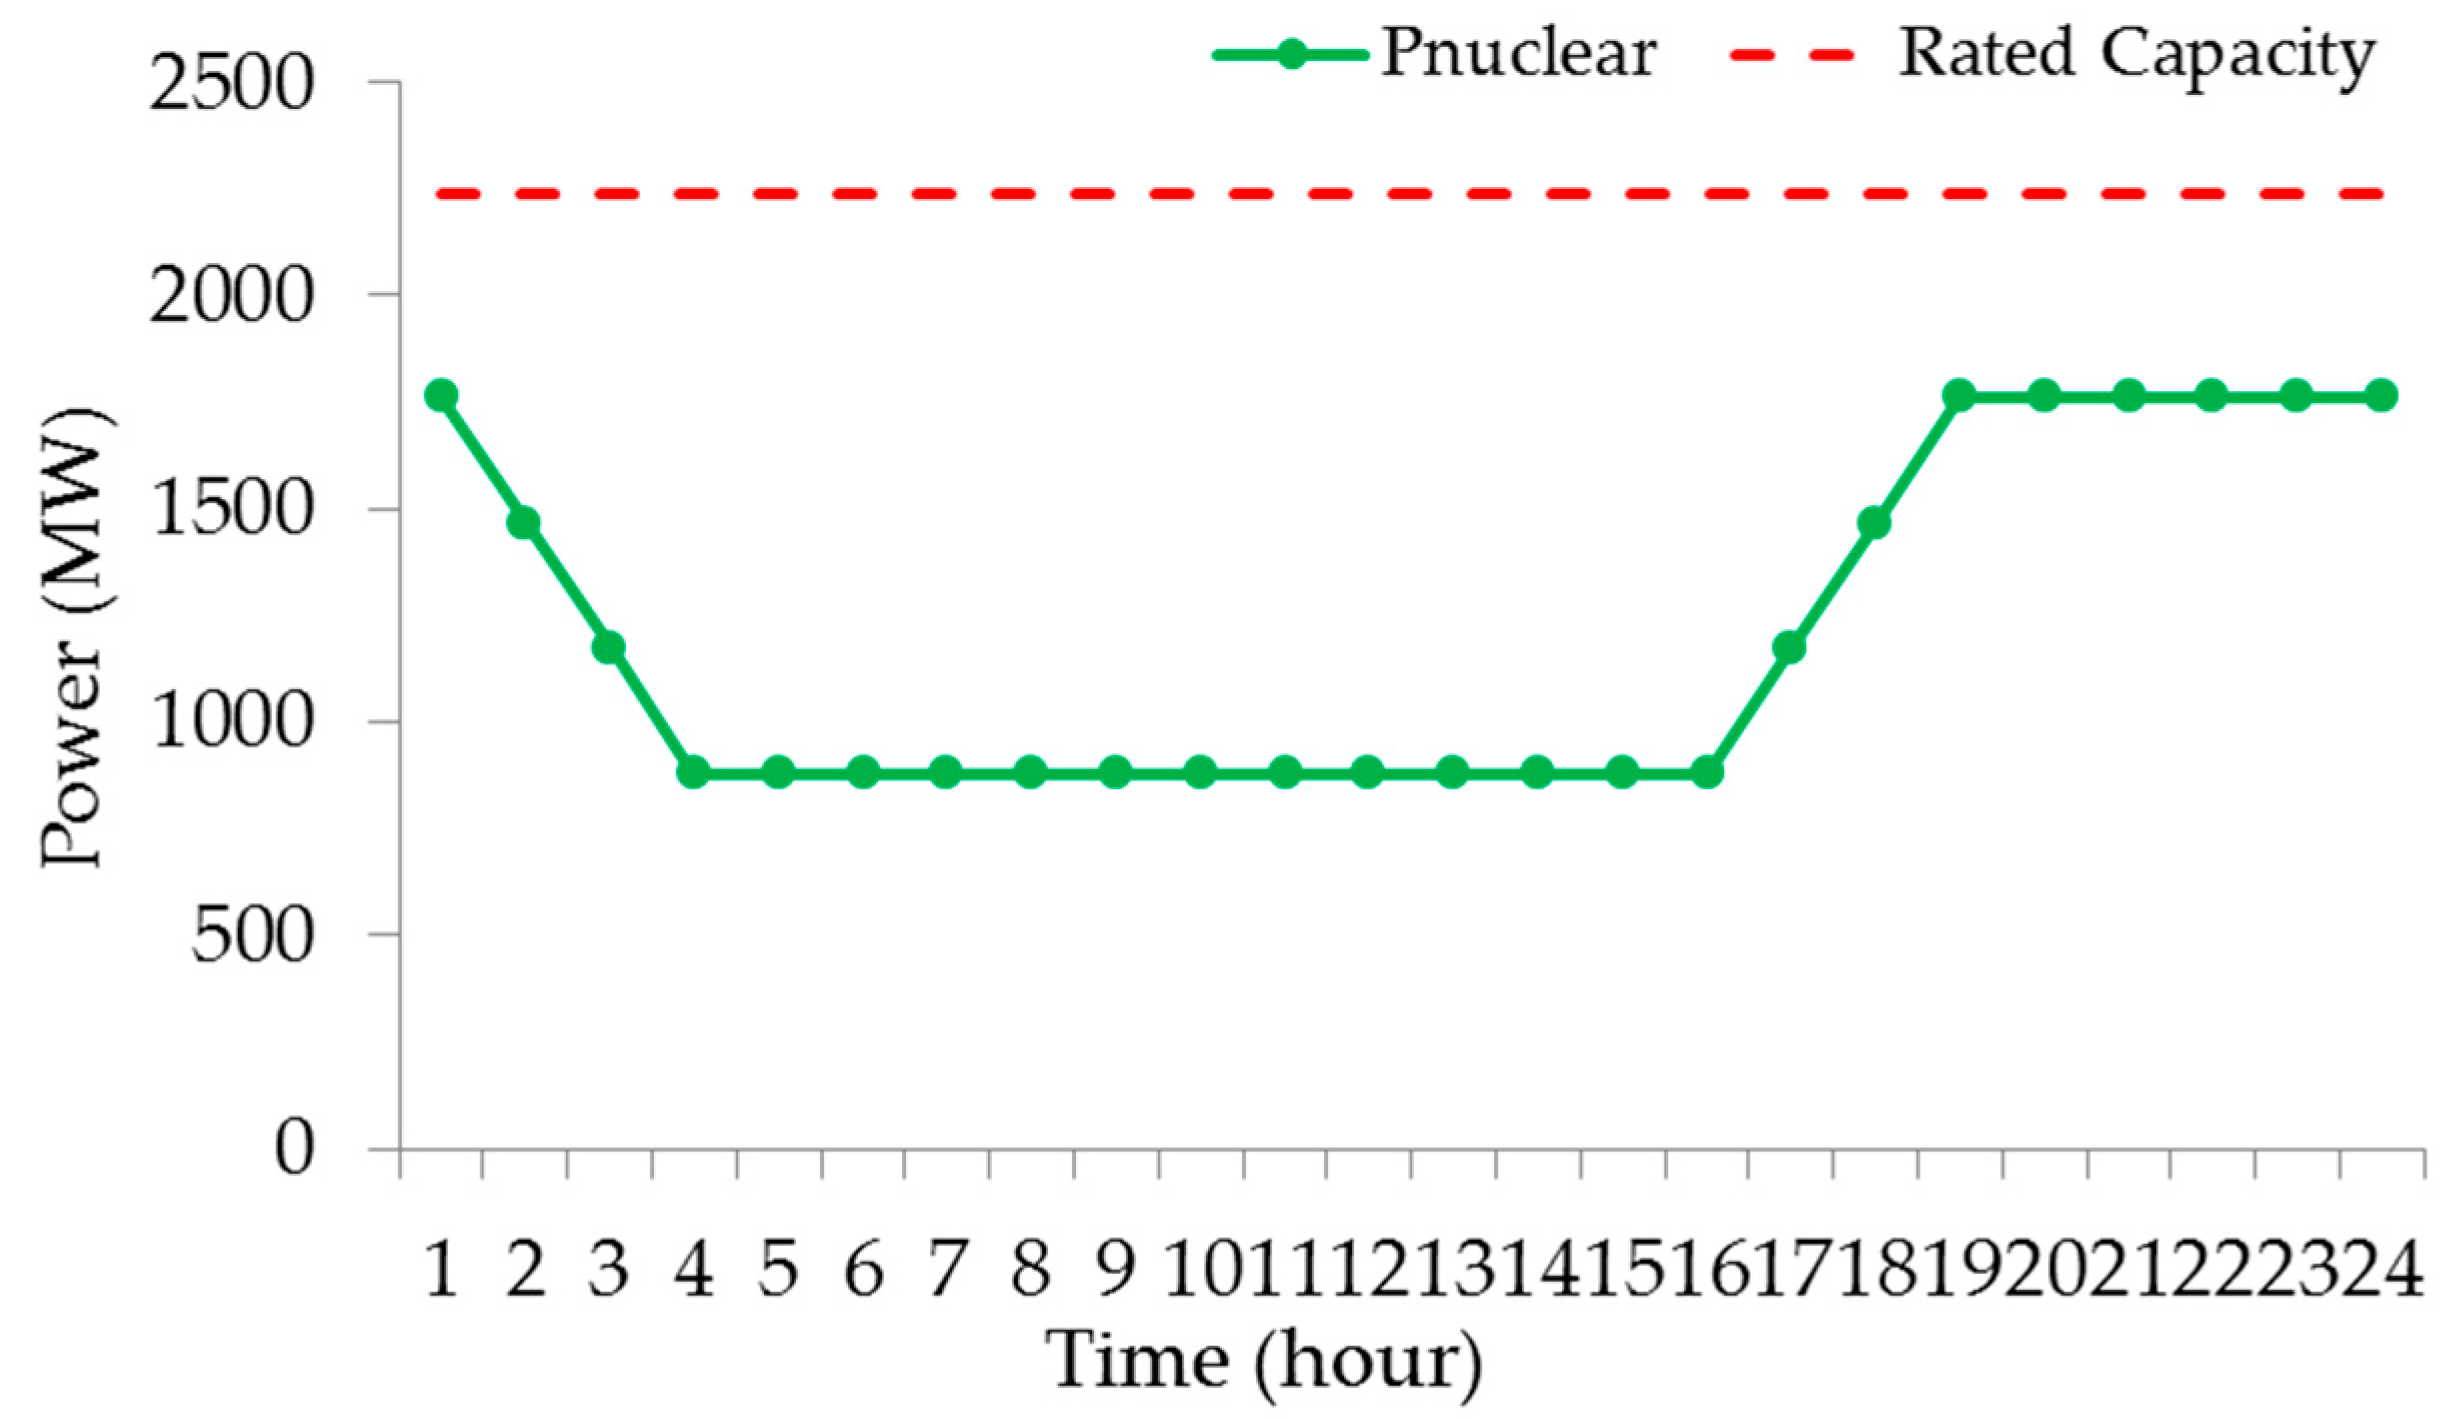
  • Case 4: Dispatch strategy based on SampEn and the nuclear power is under “5-8-6-5” operation mode, where the nuclear generators are operating at high power level for 5 h, operating at low power level for 8 h, and ramping up and down for 6 and 5 h, respectively.

4.4.1. Results in Case 1

Figure 6 shows the thermal power outputs in Case 1. Figure 7 shows the pumped storage power outputs. When the pumped storage is operated as loads, the power outputs are positive and when the pumped storage is operated as power source, the power outputs are negative. The nuclear power output is 1400.93 MW. The total output of thermal generation is 342,101.52 MW, the throughput of pumped storage is 4006.11 MW and the total output of nuclear generation is 33,622.37 MW in a day.

4.4.2. Results in Case 2

Figure 8 shows the thermal power outputs in Case 2. Figure 9 shows the pumped storage power outputs. When the pumped storage is operated as loads, the power outputs are positive and when the pumped storage is operated as power source, the power outputs are negative. The nuclear power output is 2125.63 MW. The total output of thermal generation is 324,853.82 MW, the throughput of pumped storage is 6190.17 MW and the total output of nuclear generation is 51,015.16 MW in a day.

4.4.3. Results in Case 3

Figure 10 shows the thermal power outputs in Case 3 and Figure 11 shows the pumped storage power outputs. When the pumped storage is operated as loads, the power outputs are positive and when the pumped storage is operated as power source, the power outputs are negative. The nuclear power outputs are shown in Figure 12, where the depth of peak shaving is 50%.

4.4.4. Results in Case 4

Figure 13 shows the thermal power outputs in Case 4 and Figure 14 shows the pumped storage power outputs. When the pumped storage is operated as loads, the power outputs are positive and when the pumped storage is operated as power source, the power outputs are negative. The nuclear power outputs are shown in Figure 15, where the depth of peak shaving is 50%.

4.4.5. Result Comparison of Case 1 and Case 2

Table 2 shows the results in Case 1 and Case 2, which contain total cost, thermal generation cost and nuclear generation cost, thermal up and down ramping power and the pumped storage throughput power.

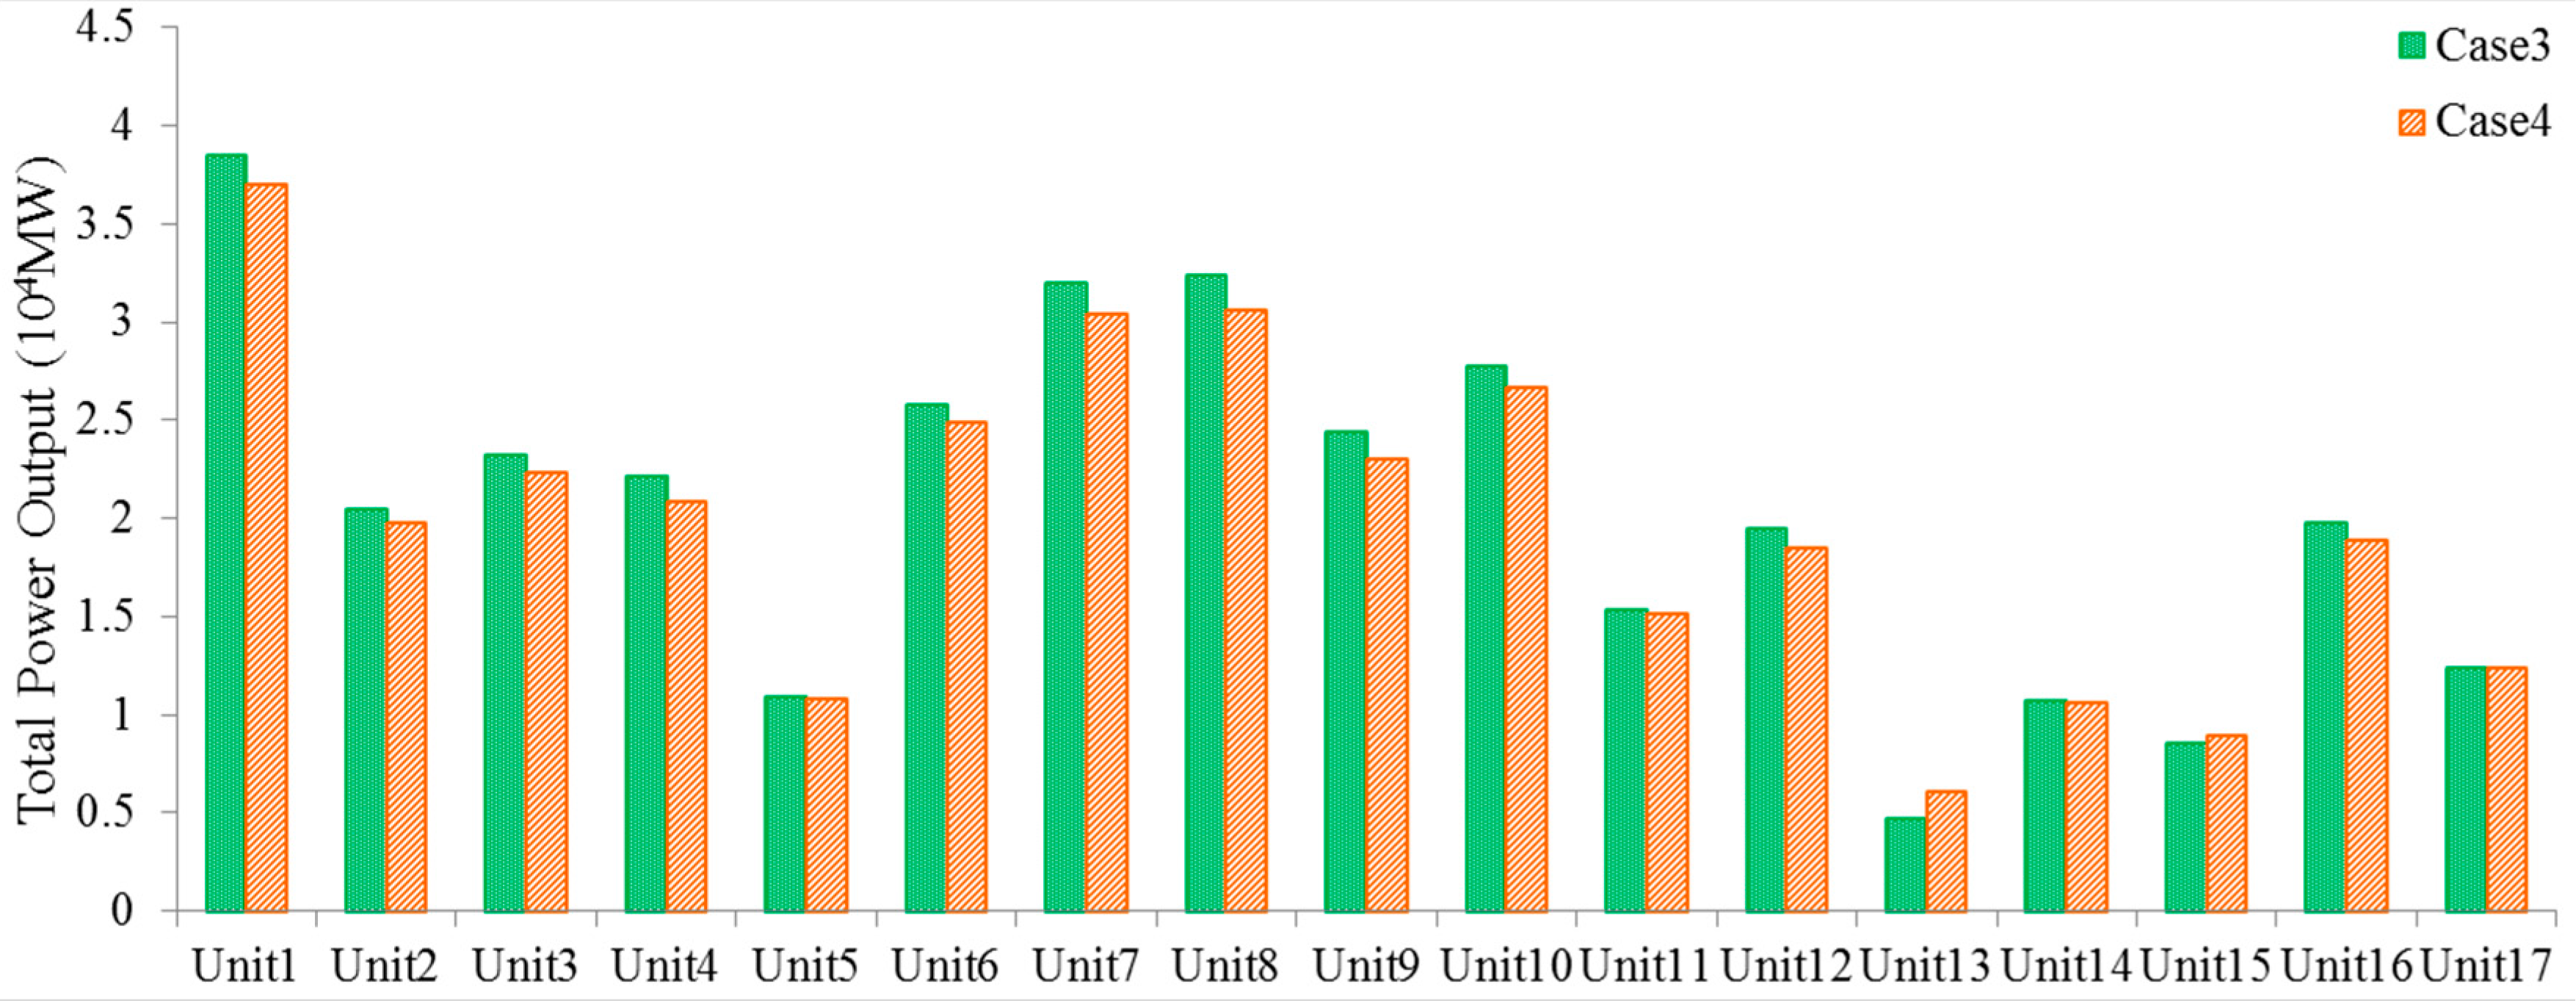
4.4.6. Result Comparison of Case 3 and Case 4

Table 3 shows the results in Case 3 and Case 4, which contain total cost, thermal generation cost and nuclear generation cost, thermal up and down ramping power and the pumped storage throughput power. Figure 16 shows the total thermal power outputs of each unit in Case 3 and Case 4.

4.4.7. Result Comparison of Case 2 and Case 4

Table 4 shows the results in Case 2 and Case 4, which contain total cost, thermal generation cost and nuclear generation cost, thermal up and down ramping power and the pumped storage throughput power.

4.5. Discussion

4.5.1. Result Analysis of Case 1 and Case 2

The thermal power outputs in Case 1 and Case 2 are shown in Figure 6 and Figure 8, respectively. Results in Figure 6 show that the power outputs of the thermal generator change frequently in each time period. In Figure 8, the thermal power outputs based on SampEn during time periods 5 to 13 and 19 to 24 is constant, respectively. The pumped storage power outputs in Case 1 and Case 2 are shown in Figure 7 and Figure 9, respectively. In Case 1, the thermal generators satisfy the changing of net loads principally and in Case 2, the dispatch strategy is based on numerical characteristics of net loads and the thermal generation mode is determined based on SampEn of net loads. The pumped storage mainly responds to the changing of net loads during the time periods where the net load complexity is large, thus the participation of pumped storage is increased. In Case 2, the pumped storage throughput is 54.52% more than that in Case 1, which can be found in Table 2. The nuclear power output in Case 1 is 1400.93 MW and is 2125.63 MW in Case 2, due to which the nuclear generation cost in Case 2 is 34.39% more than Case 1. In Case 2, the dispatch strategy is based on SampEn, in which the sustained and stable operation duration of thermal generators is extended to 8 and 5 h, thus the thermal up and down ramping power is 34.70% and 42.90% lower than those in Case 1, respectively, where the up and down ramping power is the thermal generator ramp up power outputs and ramp down power outputs, respectively. Moreover, the continuous and stable operating time of thermal generators in Case 2 is 5 and 8 h, which means the power output variation times are reduced. Thus, combined with the less ramping power, the dispatch strategy in Case 2 reduced the resource utilization that reduced the wastes of resources. Further, the less times of power output variation, the less adjustments constantly of the inlet valve of the turbine and the changing times of the in and out amount of air and coal. Thus, in a sense, the mechanical loss is reduced and operation efficiency is increased.

4.5.2. Result Analysis of Case 3 and Case 4

The thermal power outputs in Case 3 and Case 4 are shown in Figure 10 and Figure 13, respectively. The dispatch strategies in Case 3 and Case 4 are both based on SampEn and the thermal generation mode is according to the net load complexity. The thermal power outputs based on SampEn during time periods 5 to 13 and 19 to 24 are constant, respectively. The nuclear power outputs in Case 3 are shown in Figure 12 and the generation mode is ‘3-12-3-6’, which is modified according to the real operation condition and from the ‘12-3-6-3’ generation mode [45]. The nuclear power outputs in Case 4 are shown in Figure 15 and the generation mode is ‘5-8-6-5’; which is according to the SampEn of the net loads similar to the thermal generation mode. In Case 4, the high power is the upper limit of the nuclear power output and the peak shaving time is 11 h in total, which increases the peak shaving cost. In Case 3, the peak-shaving time is 6 h in total, thus considering the generation cost, the total nuclear operation cost is 40.86% lower than that in Case 4. However, in Case 4, the nuclear generation mode and thermal generation mode are both according to the complexity of the net loads, due to which the matched-degree between power and load is high. It can be seen in Figure 16, that the total thermal power outputs of most of the units in Case 4 are less than in Case 3. Moreover, the total thermal power output in Case 4 is 3.44% less than that in Case 3, which can be found in Table 3. Again, since the nuclear generation mode and thermal generation mode are both according to the complexity of the net loads in Case 4, the thermal up and down ramping power is 18.4% and 13.75% lower than those in Case 3, respectively. The dispatch strategies in Case 3 and Case 4 are both based on SampEn and the pumped storage mainly responds to the changing of net loads. In Case 4, the pumped storage throughput is 12.72% more than that in Case 3. Thus, it can be seen that in Case 4, where the nuclear generation mode and thermal generation mode are both according to the complexity of the net loads, the participation of pumped storage is higher than in Case 3, where only thermal generation mode is according to the complexity of the net loads.

4.5.3. Result Analysis of Case 2 and Case 4

The thermal power outputs in Case 2 and Case 4 are shown in Figure 8 and Figure 13, respectively. The thermal generation modes of these two cases are both based on the SampEn. However, in Case 2, the nuclear generation power is constant in all time periods, and in Case 1, the generation power is according to the SampEn of net loads. Thus, in Case 2, there is no nuclear peak-shaving cost and the cost is 34.06% lower than that in Case 4. Due to the nuclear is operating at a high power level in Case 2, the thermal generation cost is 4.62% lower than that in Case 4. Thus, the total cost is 5.92% lower than that in Case 4. Although, the economy of Case 2 is better than Case 4, the thermal ramping power in Case 4 is lower than that in Case 2. The nuclear generation mode in Case 4 assists thermal generators to respond to the net load fluctuation. Therefore, in Case 4, the thermal up and down ramping power are 5.19% and 10.27% lower than those in Case 2, respectively. Further, the pumped storage throughput is 1.67% lower than that in Case 2.

5. Glossary/Nomenclature/Abbreviations

The glossary, nomenclature and abbreviations are shown in Table 5 and Table 6. The coefficients are shown in Table 7.

6. Conclusions

In this paper, a wind-thermal-nuclear-storage combined time division power dispatch strategy based on numerical characteristics of net load is proposed which focuses on the adaption dispatch time interval and thermal generation mode determination after high proportion wind and solar energies accessed to the power grid. A specific generating mode of thermal generators is determined. The nuclear generating modes of constant power operation, time division operation, and net load tracking time division operation are compared and analyzed. The conclusions based on the actual provincial power system are as follows:
  • In the provided wind-thermal-nuclear-storage combined time division power dispatch strategy, the net loads are the objects that need to be satisfied in the dispatch which are formed by the results of the renewable energy consumed by electric loads. In the strategy, the curtailment of renewable power is not allowed, which maximized the renewable energy utilization efficiency.
  • A net load time division method is explained in detail, which can segment the dispatch time interval according to the numerical characteristics of the net loads. Further, the calculation process of the net loads SampEn is provided in detail, which can reflect the complexity of net loads. Further, the fitted thermal generation mode and nuclear generation mode are determined depending on the net load numerical characteristics.
  • In the dispatch strategy with SampEn in Case 2, the throughput of the pumped storage 2 is 54.52% more than that without SampEn in Case 1, thus the dispatch strategy with SampEn improved the interaction between pumped storage and renewable energies. Moreover, the thermal generator ramping time periods are reduced and the up and down ramping power in Case 2 based on SampEn are 34.70% and 42.90% lower than that without SampEn in Case 1. Therefore, the duration of thermal generator stable operation is increased and the stability of the system is improved.
  • The nuclear generating mode of constant generation mode, time division generation mode, and net load tracking generation mode are compared and analyzed. The constant generation with a high power level of nuclear in Case 2 is with a highest economy and the peak shaving of nuclear generation is prevented. The net load tracking generation mode in Case 4 achieved the lowest up and down ramping power of thermal generators. Thus, we can draw a conclusion that the economy pursuit generation mode of nuclear can be the constant generation mode at a high power level and the thermal generation stability friendly generation mode of nuclear can be the net load tracking generation mode.

Author Contributions

Formal analysis, Y.Z.; Methodology, S.L.; Software, Z.L.; Supervision, H.S.; Validation, H.H.; Writing—original draft, X.S.; Writing—review and editing, S.H., H.G., and H.S. All authors have read and agreed to the published version of the manuscript.

Funding

This work is supported by the State Grid Henan Electric Power Company 2019 Science and Technology Project (5217L018000M) and the National Natural Science Fund Project (61873048).

Conflicts of Interest

The authors declare no conflict of interest.

Appendix A

The time series { P i N e t L o a d } = { p N L ( 1 ) , p N L ( 2 ) , , p N L ( T N L ) } is the subsequence of the net load. The equations are as follows.
{ P N L ( i ) = [ p N L ( i ) , p N L ( i + 1 ) , , p N L ( i + m N L 1 ) ] d i j m N L ( P N L ( i ) , P N L ( j ) ) = [ | u ( i ) u ( j ) | | u ( i + 1 ) u ( j + 1 ) | | u ( i + m N L 1 ) u ( j + m N L 1 ) | ] D N L i j m N L ( P N L ( i ) , P N L ( j ) ) = max ( d i m N L ( P N L ( i ) , P N L ( j ) ) ) B N L i m N L ( r N L ) = count ( D N L i j m N L ( P N L ( i ) , P N L ( j ) ) < r N L ) T N L m N L B A v g m N L ( r N L ) = i = 1 T N L m N L + 1 B N L i m N L ( r N L ) T N L m N L + 1 S a m p E n N e t L o a d ( r N L , m N L ) = lim T N L { ln ( B A v g m N L + 1 ( r N L ) B A v g m N L ( r N L ) ) }
where, i = 1 , 2 , , T N L m N L + 1 and m N L is the dimension of subsequence, which usually equal to 2 or 3; the D N L i j m N L ( P N L ( i ) , P N L ( j ) ) is the distance of the subsequence P N L ( i ) and P N L ( j ) , and j = 1 , 2 , , T N L m N L + 1 , j i ; the D N L i j m N L ( P N L ( i ) , P N L ( j ) ) is the maximum distance between P N L ( i ) and P N L ( j ) ; the r N L means the tolerance level of the similarity between two states. In this paper, the r N L was set 0.2 × S T D N L , and S T D N L is the standard deviation of N L ; the B N L i m N L ( r N L ) means the actual vector average; the above equations need to be calculated twice with another dimension m + 1 and the B A v g m N L + 1 ( r N L ) is achieved; the S a m p E n N e t L o a d ( r N L , m N L ) means the sample entropy theoretically. T N L is the length of time series. In practice, when T N L is finite, SampEn is described as follows.
S a m p E n N e t L o a d ( r N L , m N L , T N L ) = ln ( B A v g m N L + 1 ( r N L ) / B A v g m N L ( r N L ) )

References

  1. Lu, Z.X.; Huang, H.; Shan, B.G.; Wang, Y.H.; Du, S.H.; Li, J.H. Morphological evolution model and power forecasting prospect of future electric power systems with high proportion of renewable energy. Autom. Electr. Power Syst. 2017, 41, 12–18. [Google Scholar]
  2. Energy Research Institute of the National Development and Reform Commission. 2050 High Proportion Renewable Energy Development Scenario and Path Study in China; Institute of Energy, National Development and Reform Commission: Beijing, China, 2015. [Google Scholar]
  3. Kang, C.Q.; Yao, L.Z. Key scientific issues and theoretical research framework for power systems with high proportion of renewable energy. Autom. Electr. Power Syst. 2017, 41, 2–11. [Google Scholar]
  4. Xu, F.; Li, L.L.; Chen, Z.X.; Tu, M.F.; Ding, Q. Generation scheduling model and application with fluctuation reduction of unit output. Autom. Electr. Power Syst. 2012, 36, 45–50. [Google Scholar]
  5. Wang, W.; Sun, Y.; Liu, J.Z. load-change control strategy for combined heat and power units adapted to rapid frequency regulation of power grid. Autom. Electr. Power Syst. 2018, 42, 63–69. [Google Scholar]
  6. Yang, Y.S.; Zhang, J.; Feng, T.T. Study on compensation mechanism for Ppak-regulating ancillary service of nuclear units. Power Syst. Technol. 2017, 41, 908–913. [Google Scholar]
  7. Correa-Posada, C.M.; Sanchez-Martin, P. Integrated power and natural gas model for energy adequacy in short-term operation. IEEE Trans. Power Syst. 2016, 30, 3347–3355. [Google Scholar]
  8. Liu, Q.; Wu, G.Y.; Song, X.L.; Su, Z.D.; Huang, J.D.; Su, Y. Modeling of large-capacity nuclear power unit suitable for power grid stability analysis. Power Syst. Technol. 2017, 41, 908–913. [Google Scholar]
  9. Jia, H.J.; Wang, D.; Xu, X.D.; Yu, X.D. research on some key problems related to integrated energy systems. Autom. Electr. Power Syst. 2015, 39, 198–207. [Google Scholar]
  10. Wang, J.; Zhao, J.; Liu, D.; Shao, Y.; Wang, H. Optimal scheduling model of peak load regulation considering participation of nuclear power plant. Proc. CSEE 2018, 38, 1665–1674. [Google Scholar]
  11. Zhou, B.R.; Geng, G.C.; Jiang, Q.Y. Hydro-thermal-wind coordination in day-ahead unit commitment. IEEE Trans. Power Syst. 2016, 31, 4626–4637. [Google Scholar]
  12. Jiang, R.; Wang, J.; Guan, Y. Robust unit commitment with wind power and pumped storage hydro. IEEE Trans. Power Syst. 2012, 27, 800–810. [Google Scholar] [CrossRef]
  13. Sun, H.; Shen, Z.H.; Zhou, W.; Sun, Q.Z.; Sun, M.Z.; Wang, Z.H. multi-objective congestion dispatch of active distribution network based on source-load coordination. Autom. Electr. Power Syst. 2017, 41, 88–95. [Google Scholar]
  14. Hu, S.B.; Sun, H.; Peng, F.X.; Zhou, W.; Cao, W.P.; Su, A.L.; Chen, X.D.; Sun, M.Z. Optimization strategy for economic power dispatch utilizing retired EV batteries as flexible loads. Energies 2018, 11, 1657. [Google Scholar] [CrossRef] [Green Version]
  15. Chazarra, M.; Perez-Diaz, J.I.; Garcia-Gonzalez, J. Optimal joint energy and secondary regulation reserve hourly scheduling of variable speed pumped storage hydropower plants. IEEE Trans. Power Syst. 2018, 33, 103–115. [Google Scholar] [CrossRef]
  16. Bruninx, K.; Dvorkin, Y.; Delarue, E.; Hrvoje, P.; Kirschen, D.S. Coupling pumped hydro energy storage with unit commitment. IEEE Trans. Sustain. Energy 2016, 7, 786–796. [Google Scholar] [CrossRef]
  17. Lannoye, E.; Flynn, D.; O’Malley, M. Assessment of power system flexibility: A high-level approach. In Proceedings of the IEEE Power & Energy Society General Meeting, San Diego, CA, USA, 22–26 July 2012; pp. 1–8. [Google Scholar]
  18. Li, J.; Wang, S.; Ye, L.; Fang, J. A coordinated dispatch method with pumped-storage and battery-storage for compensating the variation of wind power. Prot. Control Mod. Power Syst. 2018, 3, 2. [Google Scholar] [CrossRef] [Green Version]
  19. Papavasiliou, A.; Oren, S.S.; O’Neill, R.P. Reserve requirements for wind power integration: A scenario-based stochastic programming framework. IEEE Trans. Power Syst. 2011, 26, 2197–2206. [Google Scholar] [CrossRef] [Green Version]
  20. Matos, M.A.; Bessa, R.J. Setting the operating reserve using probabilistic wind power forecasts. IEEE Trans. Power Syst. 2011, 26, 594–603. [Google Scholar] [CrossRef]
  21. Wu, Y.K.; Chang, L.T.; Su, P.E.; Hsieh, T.Y.; Jan, B.S. Assessment of potential variability of net load following the integration of 3 GW wind power in Taiwan. Energy Procedia 2016, 100, 117–121. [Google Scholar] [CrossRef] [Green Version]
  22. Zhang, L.; Yang, J.; Jian, X.H.; Zhang, F.; Han, X.S. Unit Commitment with Energy Storage Considering Operation Flexibility at Sub-hourly Time-scales. Autom. Electr. Power Syst. 2018, 42, 48. [Google Scholar]
  23. Zou, G.; Ma, Y.; Yang, J.; Hou, M. Multi-time scale optimal dispatch in adn based on milp. Int. J. Electr. Power Energy Syst. 2018, 102, 393–400. [Google Scholar] [CrossRef]
  24. Gao, M.; Wu, R.B.; Zhang, X.Q.; Yin, Y.; Hu, Y.; Ge, X.Y. Study and application of economic dispatch with power plant generation change constraints. Mach. Electron. 2017, 35, 15–18. [Google Scholar]
  25. Yong, T.; Yao, J.; Yang, S.; Yang, Z. Ramp enhanced unit commitment for energy scheduling with high penetration of renewable generation. In Proceedings of the 2015 IEEE Power & Energy Society General Meeting, Denver, CO, USA, 26–30 July 2015. [Google Scholar]
  26. Juan, M.; Mahdi, P.; Matti, L.; José, R. Optimal location-allocation of storage devices and renewable-based dg in distribution systems. Electr. Power Syst. Res. 2019, 172, 11–21. [Google Scholar]
  27. Hong, L.; Jie, D.; Zhang, D.Y.; Yang, J.H. A distributed energy resources aggregation model based on multi-scenario and multi-objective methodology. Appl. Sci. 2019, 9, 3586. [Google Scholar]
  28. Gao, S.; Zhang, Y.Q.; Liu, Y. Incorporating concentrating solar power into high renewables penetrated power system: A chance-constrained stochastic unit commitment analysis. Appl. Sci. 2019, 9, 2340. [Google Scholar] [CrossRef] [Green Version]
  29. Shaker, H.; Zareipour, H.; Wood, D. Impacts of large-scale wind and solar power integration on California’s net electrical load. Renew. Sustain. Energy Rev. 2016, 58, 761–774. [Google Scholar] [CrossRef]
  30. Xia, J.N. Multiscale Irreversibility and Complexity Analysis of Time Series; Beijing Jiaotong University: Beijing, China, 2017. [Google Scholar]
  31. Han, S.W.; Myung-Whun, K. An information entropy interpretation of photon absorption by dielectric media. Opt. Commun. 2020, 454, 124447. [Google Scholar] [CrossRef]
  32. Skoric, T.; Mohamoud, O.; Milovanovic, B.; Japundzic-Zigon, N.; Bajic, D. Binarized cross-approximate entropy in crowd sensing environment. Comput. Biol. Med. 2017, 80, 137–147. [Google Scholar] [CrossRef]
  33. Richman, J.S.; Moorman, J.R. Physiological time-series analysis using approximate entropy and sample entropy. Am. J. Physiol. Heart Circ. Physiol. 2000, 278, 2039–2049. [Google Scholar] [CrossRef] [Green Version]
  34. Xu, W. The Complexity Algorithms Research of Chaotic Sequences Based on Entropy Theory. Ph.D. Thesis, Heilongjiang University, Harbin, China, 2017. [Google Scholar]
  35. Sun, W.; Wang, Y. Short-term wind speed forecasting based on fast ensemble empirical mode decomposition, phase space reconstruction, sample entropy and improved back-propagation neural network. Energy Convers. Manag. 2018, 157, 1–12. [Google Scholar] [CrossRef]
  36. Costa, M.; Goldberger, A.L.; Peng, C.K. Multiscale entropy analysis of complex physiologic time series. Phys. Rev. Lett. 2007, 89, 705–708. [Google Scholar] [CrossRef] [PubMed] [Green Version]
  37. International Atomic Energy Agency. Operating Experience with Nuclear Power Stations in Member States in 2014; International Atomic Energy Agency: Vienna, Austria, 2015. [Google Scholar]
  38. Chen, X.X.; Zhang, L.Z.; Yang, M.; Zhu, Y. A method for agc reserve capacity analysis considering photovoltaic power fluctuation characteristics. Autom. Electr. Power Syst. 2015, 39, 16–21. [Google Scholar]
  39. Bludszuweit, H.; Dominguez-Navarro, J.A.; Llombart, A. Statistical analysis of wind power forecast error. IEEE Trans. Power Syst. 2008, 23, 991. [Google Scholar] [CrossRef]
  40. A Special Study on China’s Sustainable Energy Development Strategy; Science Press: Beijing, China, 2006.
  41. Yan, K. Water Conservancy Dictionary; Shanghai Lexicographical Publishing House: Shanghai, China, 1994; p. 447. [Google Scholar]
  42. Liu, F.; Pan, Y.; Yang, J.F.; Zhou, J.Y.; Zhou, J.Y.; Zhu, Z.L.; Li, Q. Unit commitment model for combined optimization of wind power-thermal power-pumped storage hydro. Proc. CSEE 2015, 35, 766–775. [Google Scholar]
  43. Xu, F.; Liu, J.; Zang, T.; Ding, Q.; Tu, M.F. Unit commitment problem with pumped-storage units. Autom. Electr. Power Syst. 2012, 36, 36–40. [Google Scholar]
  44. Zhao, J.; Liu, D.C.; Lei, Q.S.; Du, Z.; Wang, J.; Zhou, L.; Huang, Y. Analysis of nuclear power plant participating in peak load regulation of power grid and combined operation with pumped storage power plant. Proc. CSEE 2011, 31, 1–6. [Google Scholar]
  45. Sui, X.; Lu, S.Y.; Su, A.L.; Sun, H.; Zhou, W.; Li, H. Source load interactive optimization scheduling method for nuclear peak regulation based on power to gas technology. Proc. CSU-EPSA 2019, 1–9. [Google Scholar] [CrossRef]
Figure 1. Calculation process of the ratio of slope sign variation to data size.
Energies 13 00364 g001
Figure 2. Flow chart of net load time division.
Energies 13 00364 g002
Figure 3. The changing tendency of the wind power installed capacity.
Energies 13 00364 g003
Figure 4. The wind curtailment situation of the provincial power grid.
Energies 13 00364 g004
Figure 5. Net load curve of the provincial power grid (a) and the slope of net load (b).
Energies 13 00364 g005
Figure 6. Thermal power outputs in Case 1.
Energies 13 00364 g006
Figure 7. Pumped storage power outputs in Case 1.
Energies 13 00364 g007
Figure 8. Thermal power outputs in Case 2.
Energies 13 00364 g008
Figure 9. Pumped storage power outputs in Case 2.
Energies 13 00364 g009
Figure 10. Thermal power outputs in Case 3.
Energies 13 00364 g010
Figure 11. Pumped storage power outputs in Case 3.
Energies 13 00364 g011
Figure 12. Nuclear power outputs in Case 3.
Energies 13 00364 g012
Figure 13. Thermal power outputs in Case 4.
Energies 13 00364 g013
Figure 14. Pumped storage power outputs in Case 4.
Energies 13 00364 g014
Figure 15. Nuclear power outputs in Case 4.
Energies 13 00364 g015
Figure 16. Total thermal power outputs of each unit in Case 3 and Case 4.
Energies 13 00364 g016
Table 1. SampEn of net loads.
Time Periods (h) S a m p E n t τ t τ + 1 N e t L o a d SampEn   Proportion   R a t i o t τ t τ + 1 S a m p E n
1–50.592715%
5–81.081728%
8–130.921124%
13–190.18325%
19–241.059328%
Table 2. Result comparison of Case 1 and Case 2 in a day.
ParametersCase 1Case 2Percentage Optimization of Case 2 Compared to Case 1
Total cost (107 yuan)8.36308.00184.32%
Thermal generation cost F T (107 yuan)7.53367.05436.36%
Nuclear operation cost F N (107 yuan)0.33030.4439−34.39%
Up ramping power (MW)6683.674364.1934.70%
Down ramping power (MW)5839.753334.4642.90%
Throughput of pumped storage (MW)4006.116190.17−54.52%
Table 3. Result comparison of Case 3 and Case 4 in a day.
ParametersCase 3Case 4Percentage Optimization of Case 4 Compared to Case 3
Total cost (107 yuan)8.53848.47580.73%
Thermal generation cost F T (107 yuan)7.59717.38022.86%
Nuclear operation cost F N (107 yuan)0.42250.5951−40.86%
Up ramping power (MW)5070.794137.8418.40%
Down ramping power (MW)3468.732991.8613.75%
Throughput of pumped storage (MW)5399.926086.82−12.72%
Total thermal power outputs (105 MW)3.493.373.44%
Table 4. Result comparison of Case 2 and Case 4 in a day.
ParametersCase 2Case 4Percentage Optimization of Case 4 Compared to Case 2
Total cost (107 yuan)8.00188.4758−5.92%
Thermal generation cost F T (107 yuan)7.05437.3802−4.62%
Nuclear operation cost F N (107 yuan)0.44390.5951−34.06%
Up ramping power (MW)4364.194137.845.19%
Down ramping power (MW)3334.462991.8610.27%
Throughput of pumped storage (MW)6190.176086.821.67%
Table 5. Nomenclature.
ParametersMeaning
L l Traditional load time series
l Number of load
W l Uncertain power output
N L l Net load
S l o p e The slope of the adjacent points
s y m b o l l S l o p e The sign extraction of S l o p e
t r a n s l S l o p e Marks of sign changing of the adjacent slope
R a t i o l , l + k S l o p e The ratio of slope sign variation to data size
kThe data length
t g The segment points
Τ The set of segment points
R a t i o The matrix with ( N 1 ) × ( N 1 ) ranks comprised by elements R a t i o l , l + k S l o p e
R a t i o max The maximum value of the upper triangular matrix in R a t i o
R a t i o min The minimum value of the upper triangular matrix in R a t i o
P i N e t L o a d The subsequence of the net load at time t g
p N L The elements in P i N e t L o a d
T N L The length of time series
D N L i j m N L The distance of the subsequence P N L ( i ) and P N L ( j )
r N L The tolerance level
m N L The dimension of subsequence
S T D N L The standard deviation of N L
B N L i m N L ( r N L ) The actual average over all the vectors
S a m p E n t τ t τ + 1 N e t L o a d The sSample eEntropy of the subsequence during the time interval t τ to t τ + 1
R a t i o t τ t τ + 1 S a m p E n The proportion of S a m p E n t τ t τ + 1 N e t L o a d
φ The threshold of the proportion
P j , t (MW)The real power output of unit j at time t
P min j (MW)The minimum power outputs of P j , t
P max , j (MW)The maximum power outputs of P j , t
Δ t τ The time interval
Δ t The column vector composed by the divided time intervals
Γ The total amount of the dispatching periods
F T (yuan)The thermal generation cost
F E (kg)The environmental cost
F H (yuan)The pumped storage operation cost
G The number of the dispatchable thermal units
HThe dispatchable pumped storage units
TThe number of hours in a day
a j (yuan/MW2)The coefficients of fuel cost functions for thermal unit j
b j (yuan/MW)The coefficients of fuel cost functions for thermal unit j
c j (yuan)The coefficients of fuel cost functions for thermal unit j
α j (kg/MW2 h)The coefficients of environmental cost for thermal unit j
β j (kg/MW h)The coefficients of environmental cost for thermal unit j
γ j (kg/h)The coefficients of environmental cost for thermal unit j
c H P (yuan/MW)The pumping cost coefficient of pumped storages
c H G (yuan/MW)The generating cost coefficient of pumped storages
P H , h , t P (MW)The pumping power of pumped storage unit h at time t
P H , h , t G (MW)The generating power of pumped storage unit h at time t
S ( P H , h , t P ) The pumping state of pumped storage unit h
S ( P H , h , t G ) The generating state of pumped storage unit h
c H PG (yuan)The pumping and generating state switching cost of pumped storage units
S H , t , t + 1 PG The pumping and generating state is switched from time t to time t + 1
NThe number of the dispatchable nuclear power units
a n NU (yuan/MW·h)The coefficients of fuel cost functions for nuclear unit n
b n NU (yuan)The coefficients of fuel cost functions for nuclear unit n
P n , t NU (MW)The power output of nuclear power unit n at time t
λ PD The depth of peak -shaving
P R N (MW)The rated operation power of the nuclear generator
F R NU (yuan)The operation cost under rated power level
η R PS The auxiliary power ratio under the rated power level
η P PS The auxiliary power ratio under ( 1 λ PD ) P R N power level
F λ PD PS (yuan)The operation cost of nuclear power unit operating at ( 1 λ PD ) P R N
F N UPS (yuan)The peak -shaving fuel cost of nuclear power unit
F N PS (yuan)The peak -shaving cost of nuclear power unit
n = 1 G P n , t (MW)The total thermal generation power output during the tth time period
n = 1 N P n , t N (MW)The total nuclear generation power output during the tth time period
P NL , t (MW)The total net load demands at time t
P W , w , t pre (MW)The predicted wind power of wind farm w at time t
P S , s , t pre (MW)The predicted photovoltaic power of photovoltaic station s at time t
W The total number of the wind farms
S The total number of the photovoltaic power stations
R U j (MW)The ramp-up rate limits of the ith thermal generator
R D j (MW)The ramp-down rate limits of the ith thermal generator
P UR , j , t (MW)The actual up reserve of thermal generator j
P DR , j , t (MW)The actual down reserve of thermal generator j
P W , w , t (MW)The actual wind power of wind farm w at time t
s = 1 S P S , s , t UR (MW)The up reserve for photovoltaic power output
s = 1 S P S , s , t DR (MW)The down reserve for photovoltaic power output
p W Normalized wind power output
B ( α , β ) Beta distribution function
α , β The distribution shape parameters of Beta distribution function
YThe random variable
Y ρ The fractile of ρ
ρ The confidence coefficient
P H , min , h G (MW)The minimum generating power of pumped storage
P H , max , h G (MW)The maximum generating power of pumped storage
P H , min , h P (MW)The minimum pumping power of pumped storage
P H , max , h P (MW)The maximum pumping power of pumped storage
H h , t (MW)The storage condition of the reservoir at time t
γ P The pumping efficiency of pumped storage
γ G The generating efficiency of pumped storage
H min , h (MW)The minimum power storage of reservoir
H max , h (MW)The maximum power storage of reservoir
P N , I (MW)The power output before the first time peak -shaving
P N , II (MW)The power output before the second time peak -shaving
T max I The maximum operation point-in-time of the first time peak -shaving
T min I The minimum operation point-in-time of the first time peak -shaving
T max II The maximum operation point-in-time of the second time peak -shaving
T min II The minimum operation point-in-time of the second time peak -shaving
P n , t N (MW)The power output of nuclear generation n at time t
T min The minimum peak-shaving duration of the first time peak -shaving
T min The minimum peak-shaving duration of the second time peak -shaving
T min N , I The minimum operation duration of nuclear power units operation at P N , I
T min N , II The minimum operation duration of nuclear power units operation at P N , II
λ PD , max The maximum peak -shaving depth
Table 6. Acronyms.
Table 6. Acronyms.
AcronymsMeaning
SampEnSample Entropy
NLNet Load
IEAInternational Energy Agency
NEANuclear Energy Agency
ApEnApproximate Entropy
Table 7. Coefficients.
a (yuan/MW2)b (yuan/MW)C (yuan)α (kg/MW2 h)β (kg/MW h)γ (kg/h)
0.0053195.46673173.30.022−2.86130
0.04189.647600.072−2.72132
0.04189.647600.044−2.94137
0.06157.863000.058−2.35130
0.2112.819,4400.087−2.36125
0.06157.863000.061−2.28110
0.0088184.3611760.032−2.36135
0.0033160.6677933.30.019−1.29157
0.05126.516,5900.051−1.14160
0.04164.432400.046−2.14137.7
0.1183.628800.076−2.12125
0.0592.513,6500.062−2.26142
0.765191.88368.550.09−2.03133
0.215910,8000.078−2.67155
0.433184.2673173.30.082−2.01160
0.0733177.227300.066−2.88130
0.0822163.692400.077−2.76159

