Article

Development and Application of an Intelligent Test System for the Model Test on Deep Underground Rock Caverns

1
Geotechnical and Structural Engineering Research Center, Shandong University, Jinan 250061, China
2
School of Civil Engineering, Shandong University, Jinan 250061, China
3
Faculty of Engineering, China University of Geosciences, Wuhan 430071, China
*
Authors to whom correspondence should be addressed.
Energies 2020, 13(2), 358; https://doi.org/10.3390/en13020358
Submission received: 1 December 2019 / Revised: 29 December 2019 / Accepted: 9 January 2020 / Published: 10 January 2020
(This article belongs to the Section D: Energy Storage and Application)

Abstract

:
The safe disposal of high-level radioactive waste (HLW) is a major issue to ensure environmental protection and the sustainable development of the nuclear energy industry; it is also an equally important issue regarding nuclear safety. Deep-buried geological disposal is recognized worldwide as the safest and most feasible way to protect human beings and the environment. To satisfy the research functions, most underground research laboratories (URLs) for geological repositories are buried deeply, and their layout is quite complex. To research nonlinear deformation characteristics and failure mechanism of deep underground caverns in the process of construction, we developed an intelligent true triaxial non-uniform loading/unloading model test system. The system has the advantages of a large rated output, starting from zero pressure, cyclic loading and unloading, high loading accuracy and displacement test accuracy, and arbitrary adjustment of device size. We carried out a true three-dimensional physical model test, taking the URL for the deep-buried geological disposal of HLW in Beishan area, Gansu Province as the prototype. The nonlinear deformation characteristics and the law of displacement change of the underground laboratory caverns are reproduced. We observed the whole process, from the appearance of micro cracks to the expansion of the cracks and the collapse of the cavern group. This provides an important experimental basis for optimizing the design and construction of URL for the deep-buried geological disposal of HLW. The value and slope of displacement calculated by the numerical simulation are mainly the same as the experimental results of the geological model test, which validates the accuracy and reliability of the model test system in this study.

1. Introduction

Nuclear energy is a safe and clean energy, and so it is increasingly favored by all countries. Accompanied with the establishment of a large number of nuclear power plants, the amount of HLW (high-level radioactive waste) produced will thus also increase significantly. It is conservatively estimated that the cumulative stock of HLW generated by China’s nuclear power plants will reach 83,000 tons by 2050 [1]. The safe disposal of HLW is a major issue to ensure environmental protection and the sustainable development of the nuclear energy industry; it is also an equally important issue regarding nuclear safety [2]. Deep-buried geological disposal is accepted worldwide as the safest and most feasible way to protect human beings and the environment [3,4,5,6,7].
The underground engineering projects of burying HLW are called geological repositories [8,9]. The construction conditions of a geological repository are complex. At the same time, the safety requirements of the project are relatively high, and its service life is very long (10,000 years) [10]. The underground research laboratory (URL) is an indispensable and important facility during the development of geological repositories [11]. To satisfy the research functions, most URLs are buried deeply, the layout of which is quite complex [12,13]. Therefore, the mechanical characteristics of the deep-buried surrounding rock in the URLs are greatly different from that of the shallow-buried surrounding rock. Many unpredictable problems will often encounter in the study of deep-buried surrounding rock [14], such as large deformation, rock burst, zonal disintegration, etc. The traditional theory, method and technology of the shallow-buried surrounding rock might be insufficient in the research of the nonlinear failure of the deep-buried surrounding rock. It is thus necessary to study the nonlinear deformation characteristics and failure mechanism of the rock mass around the deep-buried cave [15,16,17,18,19,20,21].
Compared with the theoretical analysis and numerical simulation, which have shortcomings in terms of investigating the failure pattern and mechanism of caverns, the physical model test has become an essential method to research the nonlinear deformation characteristics and failure mechanisms of the surrounding rock of deep and ultra-deep underground caverns due to its vivid, intuitive and real characteristics [22]. A geomechanical model test can study the process of engineering construction, deformation and failure by using the scaled geological model according to a similar principle [23,24]. A well-designed geomechanical model can simulate complex geological structures comprehensively and truly, find some new mechanical phenomena, and provide a basis for establishing a new theory and numerical model [25,26,27,28]. A well-designed model test can accurately reproduce the deformation characteristics and failure mechanisms of the engineering entity once the mechanical characteristics of the rock mass are captured by the analogue material and the in situ stress is applied properly following similar principles.
A variety of testing systems have been developed for the geomechanical modeling of underground engineering, including experimental equipment and measurement methods. For instance, Kulatilake et al. [29] designed an experimental device to research the destroying models of jointed rock under uniaxial compression. He et al. [30] designed a (physically finite elemental slab assemblage) PFESA model test system, simulated the excavation process of a horizontal tunnel in 45° inclined joint rock, and observed the spatio-temporal evolution process of EDZ (Excavation Disturbed Zone) by an infrared thermal imager. Shin et al. [31] designed a geomechanical model test system for simulating sandy soil pipe roof construction to study the influence of the length of the pipe shed and the reinforcement method on the structural stability. Zhu et al. [32,33] designed a large-scale quasi-3D model test system to carry out a model test of excavation and support of a cavern group of Shuangjiangkou Hydropower Station and compared this with the numerical analysis results. Chen et al. [34] designed and manufactured a geotechnical model test apparatus of the YD-A type (Tsinghua University, Beijing, China) to carry out a model test for the underground powerhouse cavern group of Xiaolangdi Hydropower Station, which demonstrated the correctness of the reinforcement scheme and determined the reasonable support parameters. Li et al. [35] designed a discrete 3D multi-principal stress surface loading test system, and applied some new technologies including the excavation method of concealed caverns and inner peep technology, etc. Based on this system, they successfully carried out the geomechanical model test of the underground powerhouse group of Xiluodu Hydropower Station.
The afore mentioned applications have confirmed the importance of a physical model test system in successful applications in rock engineering. However, some defects still limit the application of the system when modeling deep underground projects: (1) most of the loading counterforce device is fixed in size and cannot be flexibly adjusted according to the scale of the test model; (2) most of the model test systems are planar or quasi three-dimensional and can only simulate the loading process but not the unloading process; and (3) because of the mechanical defects, most loading systems have a starting pressure and cannot start from 0.
In order to overcome the above-mentioned defects, we developed an intelligent true triaxial non-uniform loading/unloading model test system. The system controlled by a digital servo has a high loading accuracy and good voltage stabilizing performance. The size of the loading device can be adjusted, and it can be loaded or unloaded. It can simulate the process of non-uniform loading/ unloading and pressure stabilization from low pressure to ultra-high pressure and can directly observe the process of excavation deformation and failure.

2. Development of the Test System

As shown in Figure 1, the intelligent true triaxial non-uniform loading/unloading model test system consists of a combined bench counterforce device, an ultrahigh-pressure true triaxial non-uniform loading/unloading device, an intelligent hydraulic loading/unloading and steady pressure numerical control system, an automatic displacement monitoring system, and a high-definition multi-probe peeping system. In the following section, each part of the system will be introduced in detail.

2.1. Combined Bench Counterforce Device

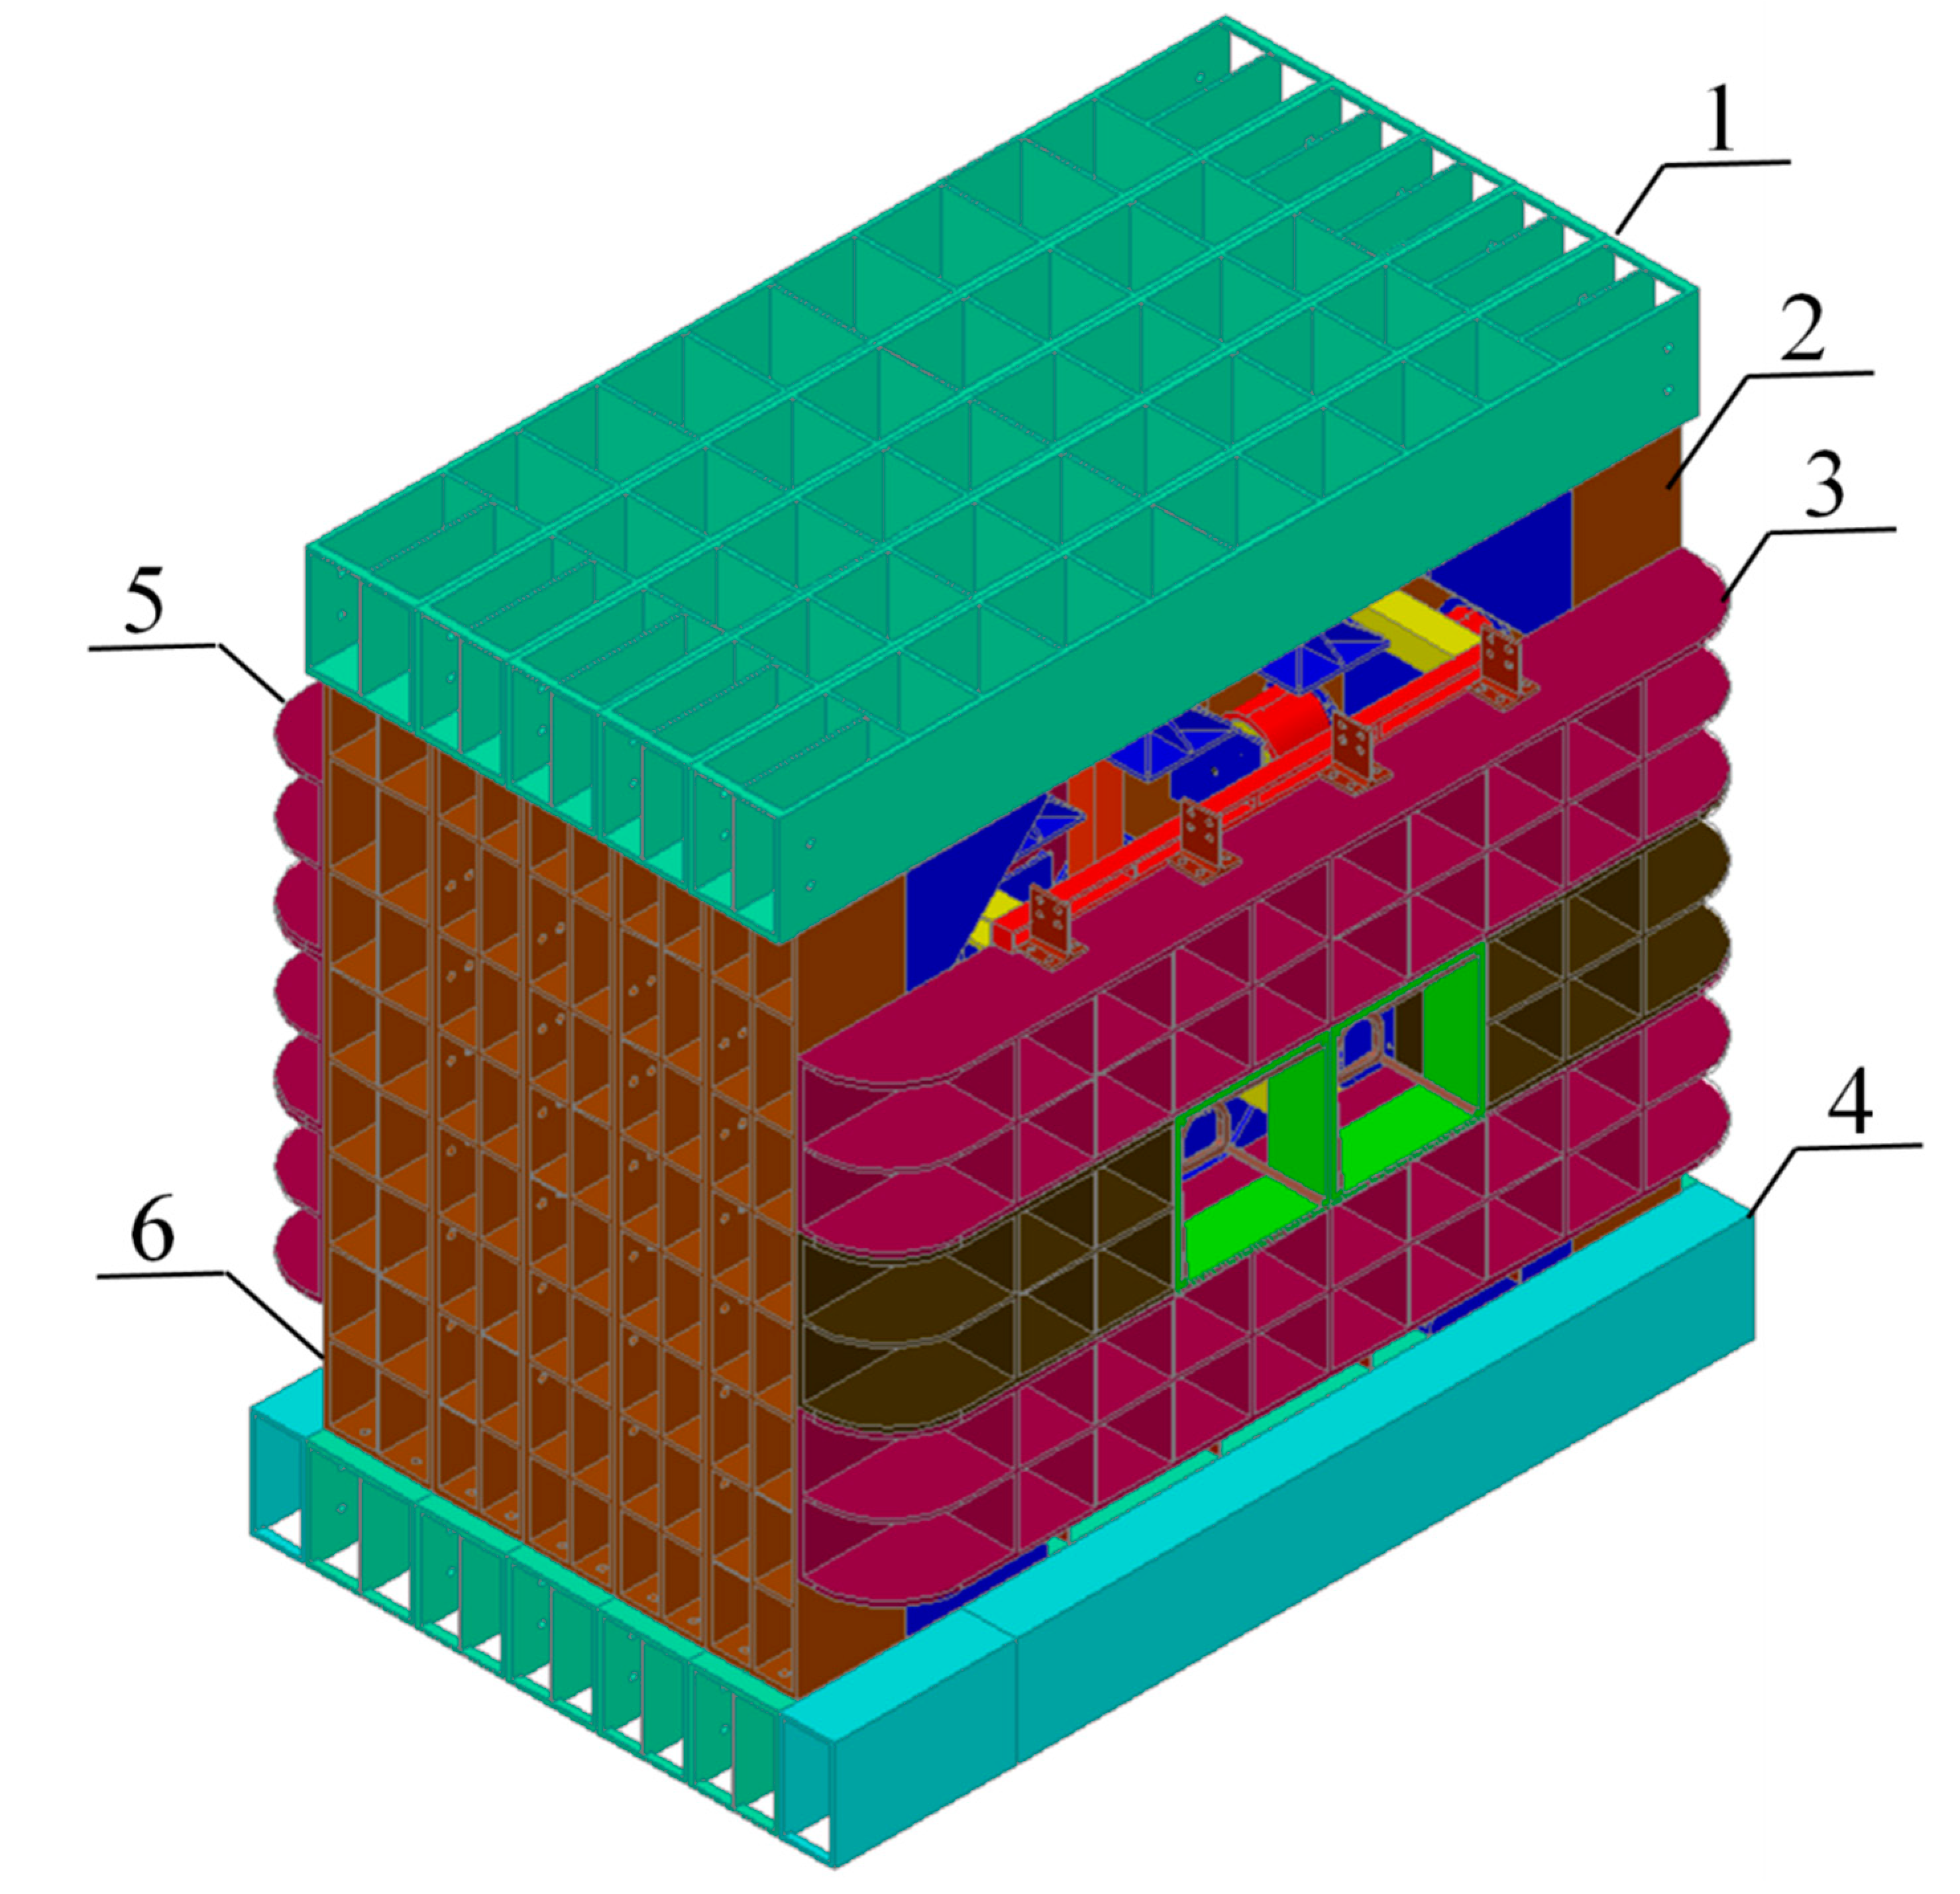
The combined bench counterforce device is mainly used for accommodating a test model and as a counterforce device for loading in tests. This device is formed by connecting detachable box-type members, including a box-type top beam, a box-type bottom beam, box-type left and right upright posts, a box-type front counterforce wall, a box-type rear counterforce wall, and other components. All the components are machined from high-strength steel plates with thicknesses of 25 mm and connected via high-strength bolts, steel corner fittings, and tie bars. The size of the combined bench counterforce device can be adjusted according to the model test range: the combined bench counterforce device has a length of 5.05 m, a height of 4.85 m, and a thickness of 3.6 m. As shown in Figure 2, the test model has a length of 2.5 m, a height of 2.5 m, and a thickness of 2.0 m.

2.2. True Triaxial Non-Uniform Loading/Unloading Device

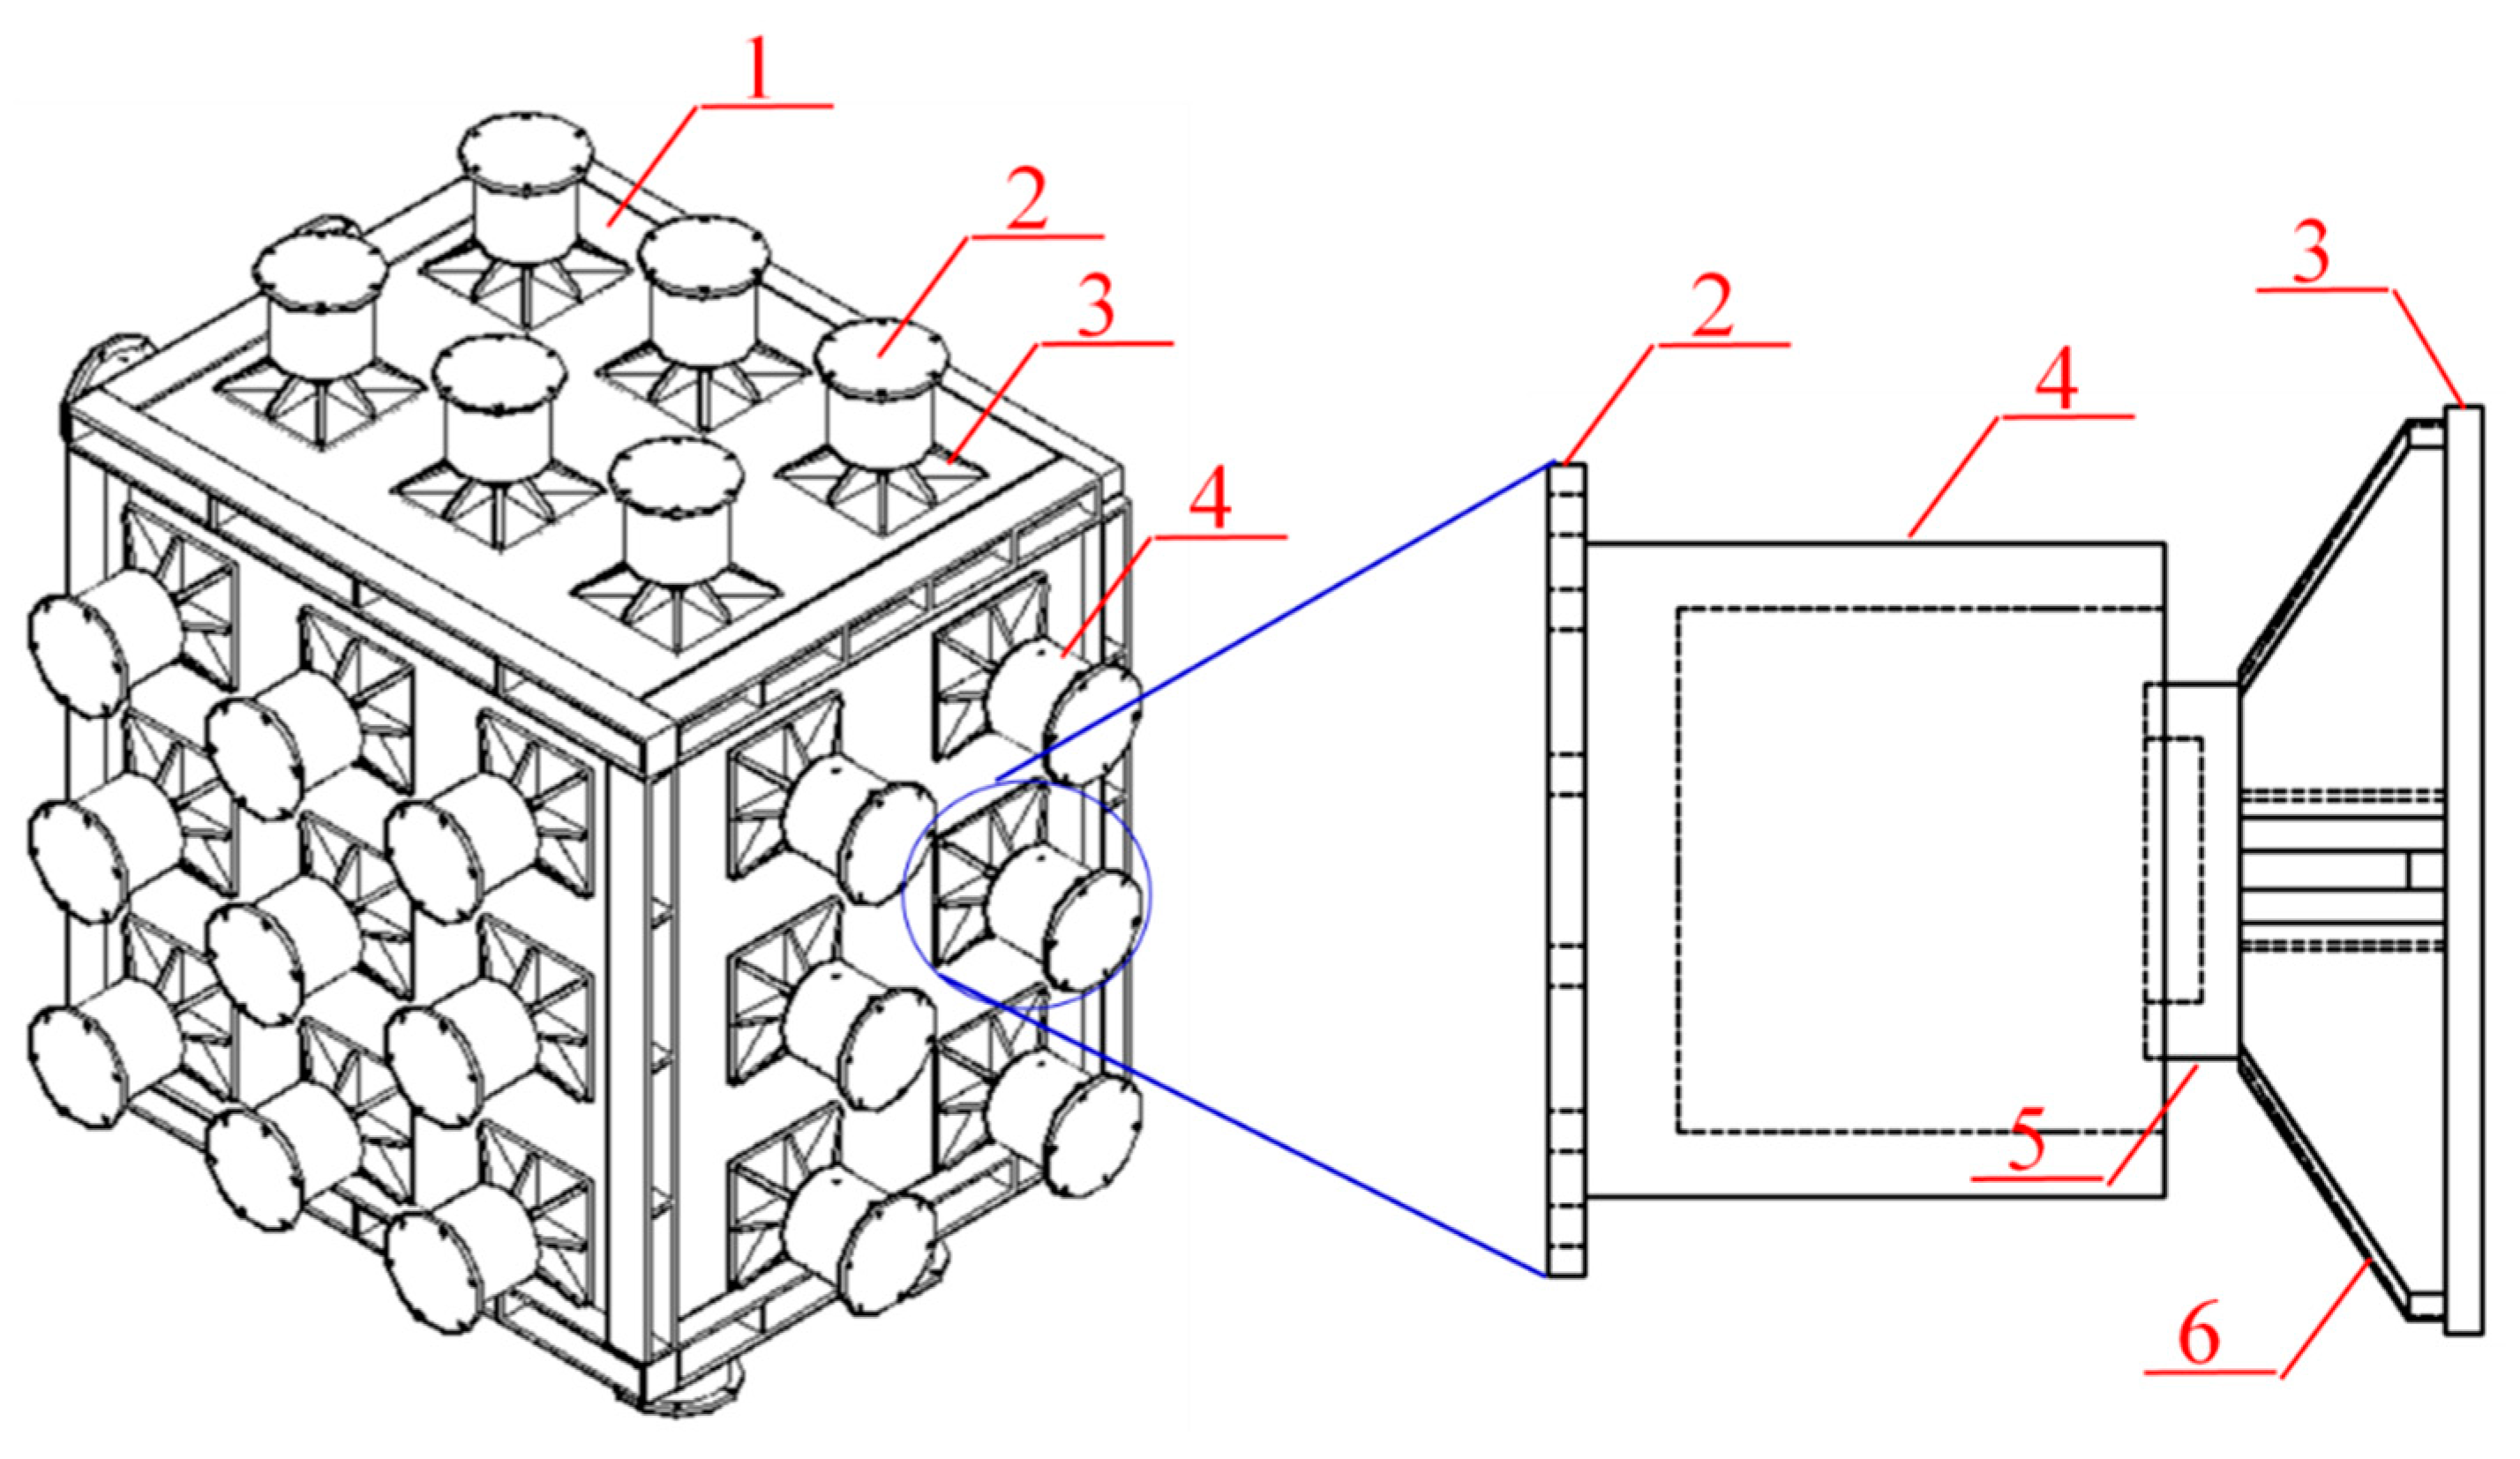
The ultrahigh-pressure true triaxial non-uniform loading/unloading device is arranged within the combined bench counterforce device. This device consists of 33 independent loading units. In the front of the test system, passive constraints were used to facilitate the excavation, while different numbers of loading units were installed on the other five surfaces for active loading. The 33 loading units were divided into eight groups, which respectively carried out independent and synchronous ultrahigh-pressure gradient non-uniform loading/unloading via eight oil ways controlled by the intelligent hydraulic loading/unloading and steady pressure numerical control system.
Each loading unit was composed of a hydraulic jack and a bench-type force transfer loading module (see Figure 3). The rated output of the hydraulic jack was 5000 KN. The design diameter of the oil cylinder was 280 mm, and the design range was 100 mm. The bench-type force transfer loading module was formed by welding a top plate (200 mm × 200 mm × 30 mm), a bottom plate (500 mm × 500 mm × 30 mm) and eight force transfer reinforcing rib plates with a thickness of 25 mm. The bottom plate of the bench-type force transfers loading module clings to a loading steel plate of the test model, thus effectively transferring the output of each loading unit to the surface of the model.

2.3. Intelligent Hydraulic Loading/Unloading Control System

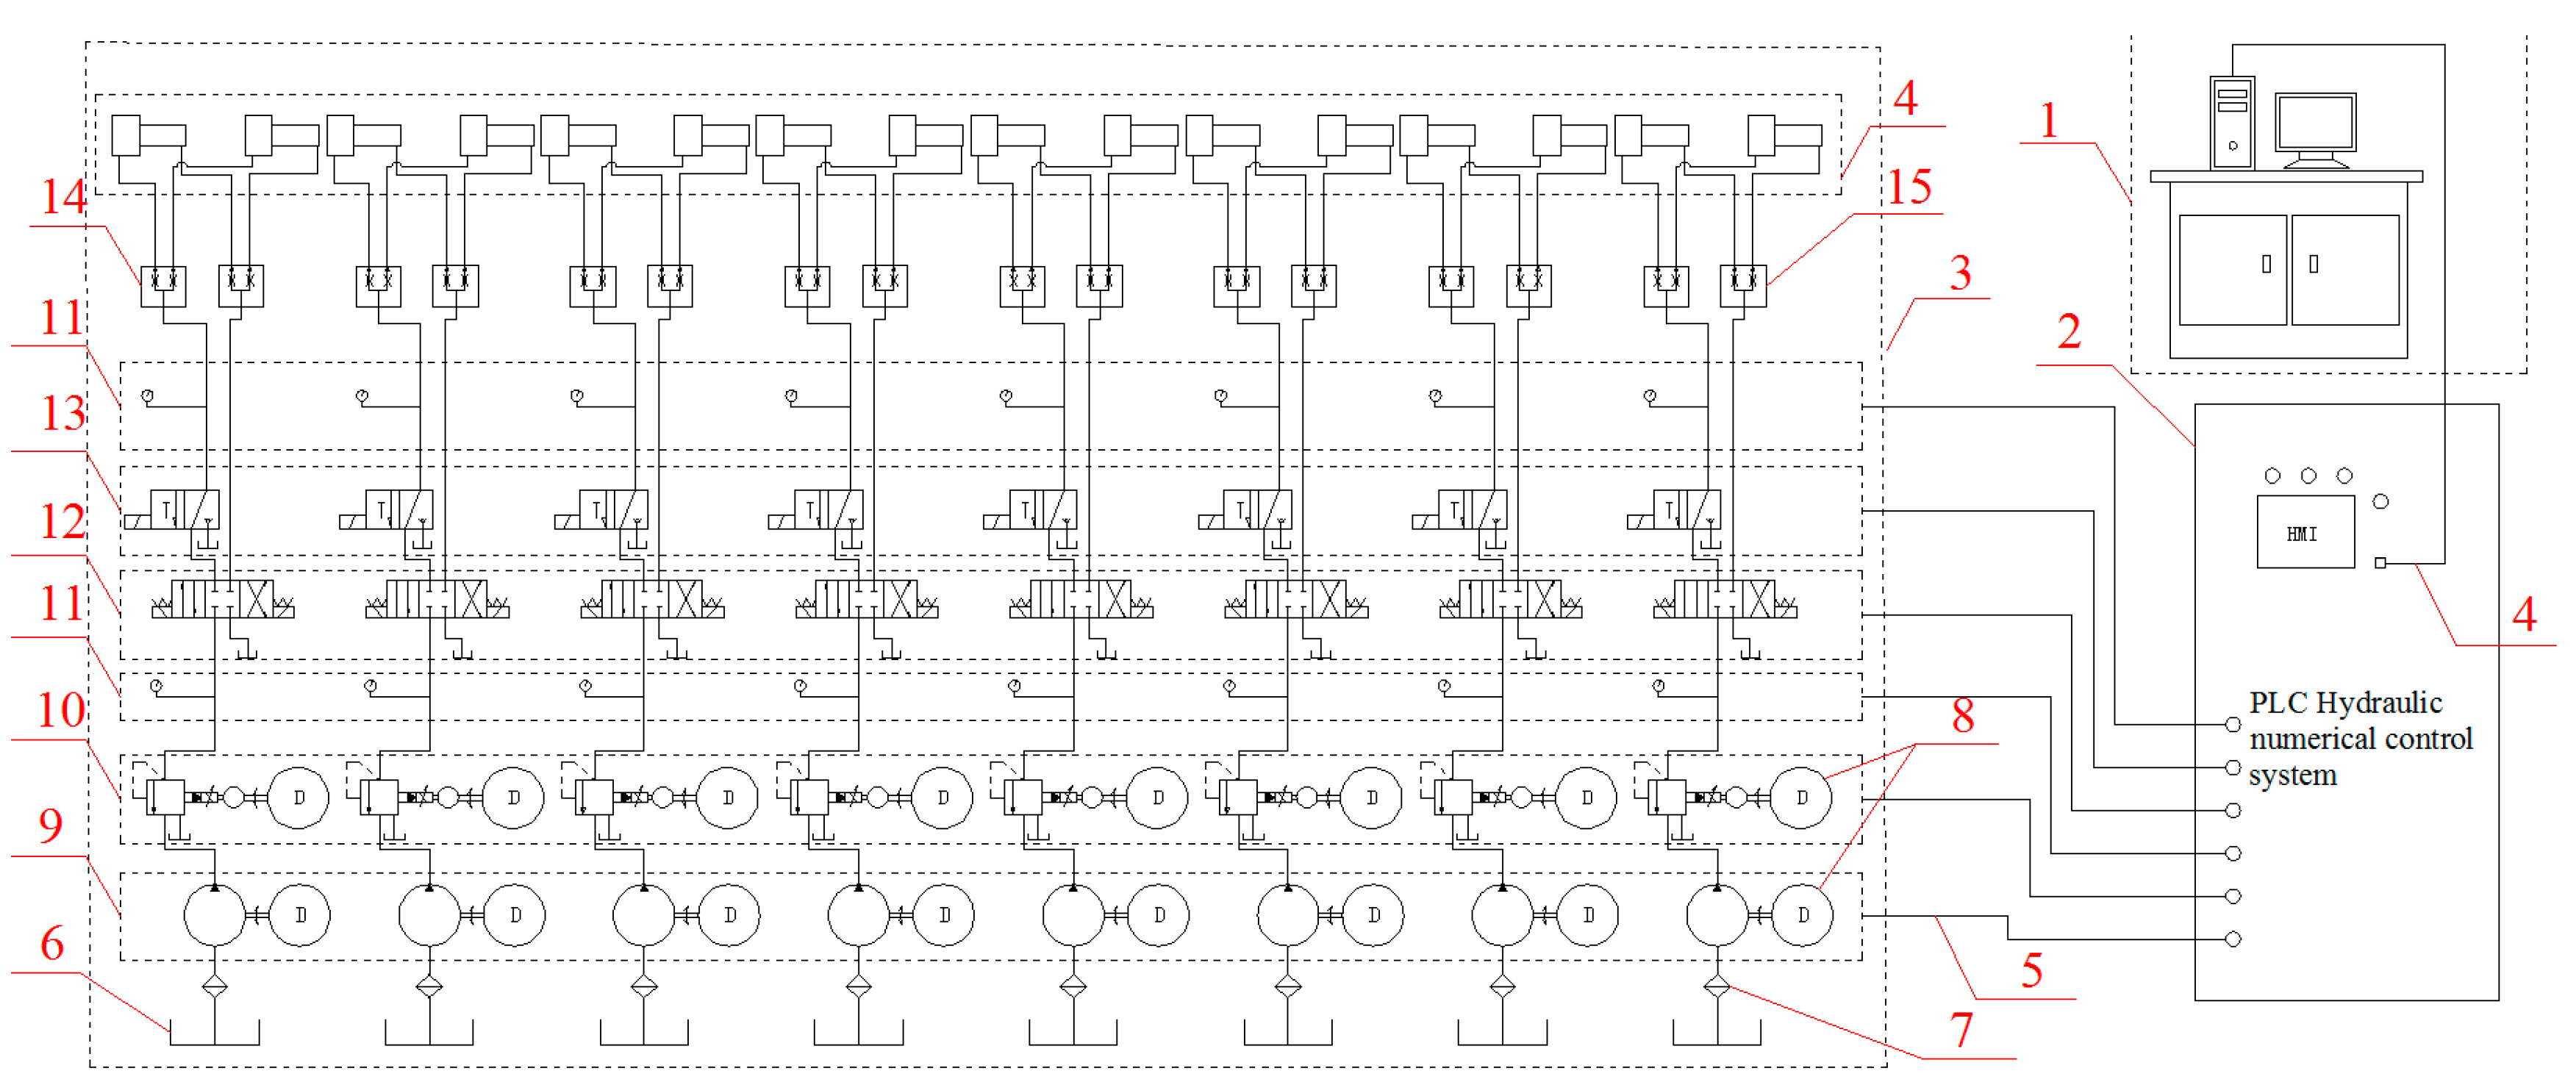
The intelligent hydraulic loading/unloading control system consists of the PC (personal computer) monitoring system, the PLC (programmable logic controller) hydraulic numerical control system and the ultrahigh-pressure execution system. The PC monitoring system was connected with the PLC hydraulic numerical control system via a network cable. The PLC hydraulic numerical control system was connected with the ultrahigh-pressure execution system to conduct the full closed-loop control of pressure.
The ultrahigh-pressure execution system can be divided into eight oil ways, which are mutually independent and are in parallel. Each oil way separately controls a group of loading units and runs independently without any disturbance.
Each oil way is an independent closed circuit in which the hydraulic oil circulates (see Figure 4). Different solenoid valves play different roles: the step overflow valve was used for adjusting the pressure of the oil way; the O-shaped three-position four-way electromagnetic reversing valve was used for controlling the flow direction of the oil way; the electromagnetic ball valve pressure retaining valve played a role in retaining the pressure; and the synchronous valve was used for ensuring that different hydraulic jacks on the same oil way realize synchronous loading.
The pressure adjustment process of the step overflow valve was realized as follows: a step motor drives the valve core of the step overflow valve to advance or retreat, and when the step motor drives the valve core to advance, oil circuit pressure is reduced; otherwise, oil circuit pressure is increased. The start pressure of the system can be reduced to 0 MPa via the variable frequency debugging of a step overflow valve drive system in combination with the stepless speed adjustment of the step motor to realize a zero-pressure start. The PLC hydraulic numerical control system can adjust the pressure change rate of the step overflow valve to realize the cyclic loading/unloading of the system. When the oil pressure of the cylinder changes, the PLC hydraulic numerical control system controls the step overflow valve in a servo manner to increase or reduce the pressure to realize instantaneous pressure supplement, meaning that the loading system is kept in a steady pressure state.
In the test process, each oil way runs independently to carry out loading according to the actual geostress, and they do not disturb each other. The loading of each oil way is calculated by the following formula:
σ t o p = γ h t o p σ b o t t o m = γ h b o t t o m σ g r a d i e n t i = k i γ h g r a d i e n t i }
where γ means the volume weight of the surrounding rock, htop means the actual buried depth of the top stratum of the model, hbottom is the actual buried depth of the bottom stratum of the model, ki is the side pressure coefficient of the geostress, and hgradienti is the actual buried depth of the stratum at each gradient loading layer. Thus, true three-dimensional gradient non-uniform loading changing with the depth is realized.
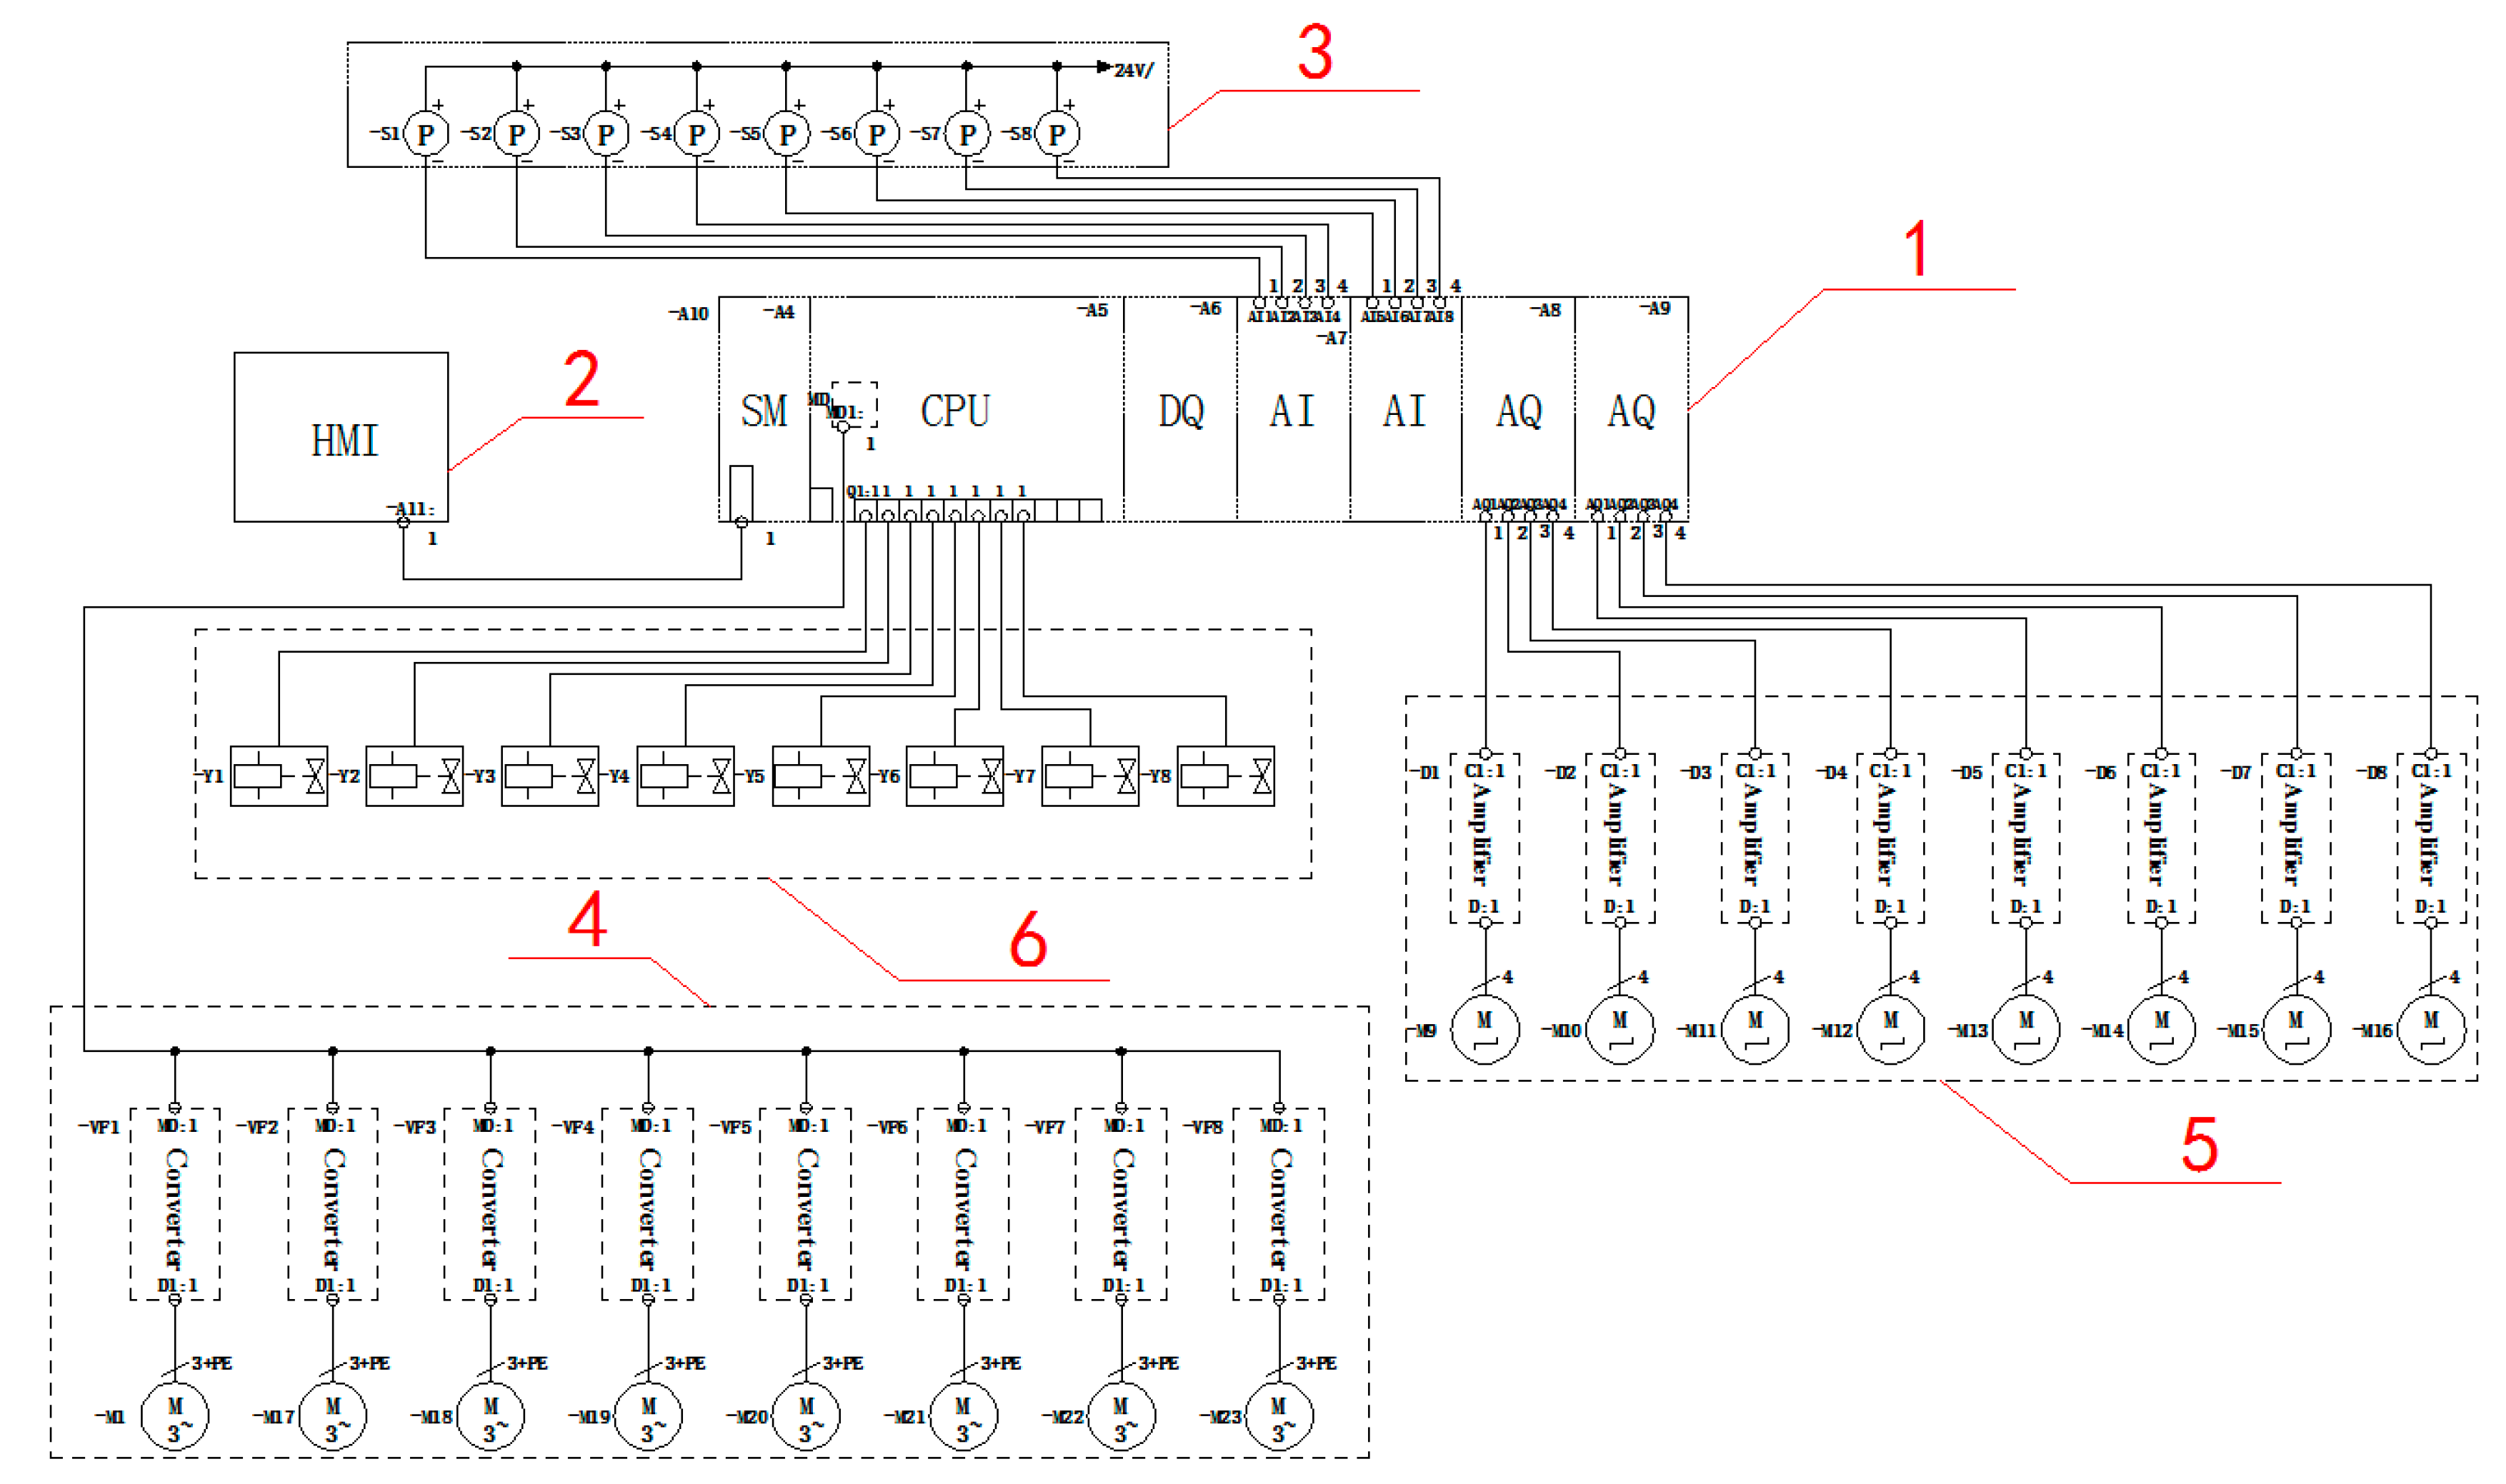
The PLC hydraulic numerical control system includes a human–machine interface (HMI), a programmable controller, a sensor system, a variable frequency oil pump drive system, a step overflow valve drive system, and an electromagnetic valve drive system (see Figure 5).
The pressure control flow of the intelligent hydraulic loading/unloading and steady pressure numerical control system is as follows:
  • The operator inputs a loading/unloading instruction via the HMI or the PC monitoring system of the visual human–machine interaction system;
  • The visual human–machine interaction system converts the instruction into a digital signal and transmits it to the PLC hydraulic numerical control system;
  • The central control unit of the PLC hydraulic numerical control system converts the digital pressure signal into an electrical signal;
  • The electrical signal is transmitted to the variable frequency oil pump drive system, the step overflow valve drive system and the electromagnetic valve drive system, respectively;
  • The variable frequency oil pump drive system controls the oil pump to pump the hydraulic oil into the oil ways;
  • The step overflow valve drive system controls the step motor to drive the valve core of the step overflow valve to advance or retreat, thus reducing or increasing the pressure of the oil ways;
  • The electromagnetic valve drive system controls the opening or closing of the O-shaped three-position four-way electromagnetic reversing valve and the electromagnetic ball valve pressure retaining valve to realize the division and pressure retention of the oil ways;
  • The sensor system feeds the detected oil way pressure information back to the programmable controller in time to process the oil way pressure information into a digital pressure signal;
  • The digital pressure signal is displayed on the HMI dynamically in real time, and the loading history is stored in the PC monitoring system.

2.4. Automatic Displacement Monitoring System

The automatic displacement monitoring system consists of the displacement transfer device, the displacement measuring device, the signal conversion device, the data processing device, and the computer system. The automatic displacement monitoring system realizes the automatic detection of model displacement via photoelectric conversion technology (see Figure 6).
The process of photoelectric conversion is as follows: the displacement measuring point moves with the deformation of the model and drives the flexible measuring rod of the displacement transfer device. The flexible measuring rod transmits the displacement to the grating ruler sensor in the displacement measure device. This displacement causes the number of Moire fringes to change. The change of the number exactly corresponds to the displacement transmitted from the measuring point of the model. The photoelectric conversion element converts the Moire fringe optical displacement transmitted by the grating ruler sensor into electrical signal. The electric signal is converted into digital signal by the data processing device and transmitted to the computer. Thus, the measured displacement can be displayed on the computer and saved in real time.

2.5. High-Definition Multi-Probe Peeping System

The high-definition multi-probe peeping system consists of a plurality of micro high-definition probes, a high-speed camera control panel, a data storage box, and a liquid crystal display; a plurality of micro high-definition probes were arranged at any inner or outer part of a model cavern, and the acquired video is displayed on the liquid crystal display in real time and automatically stored in data storage.

2.6. Technical Advantages

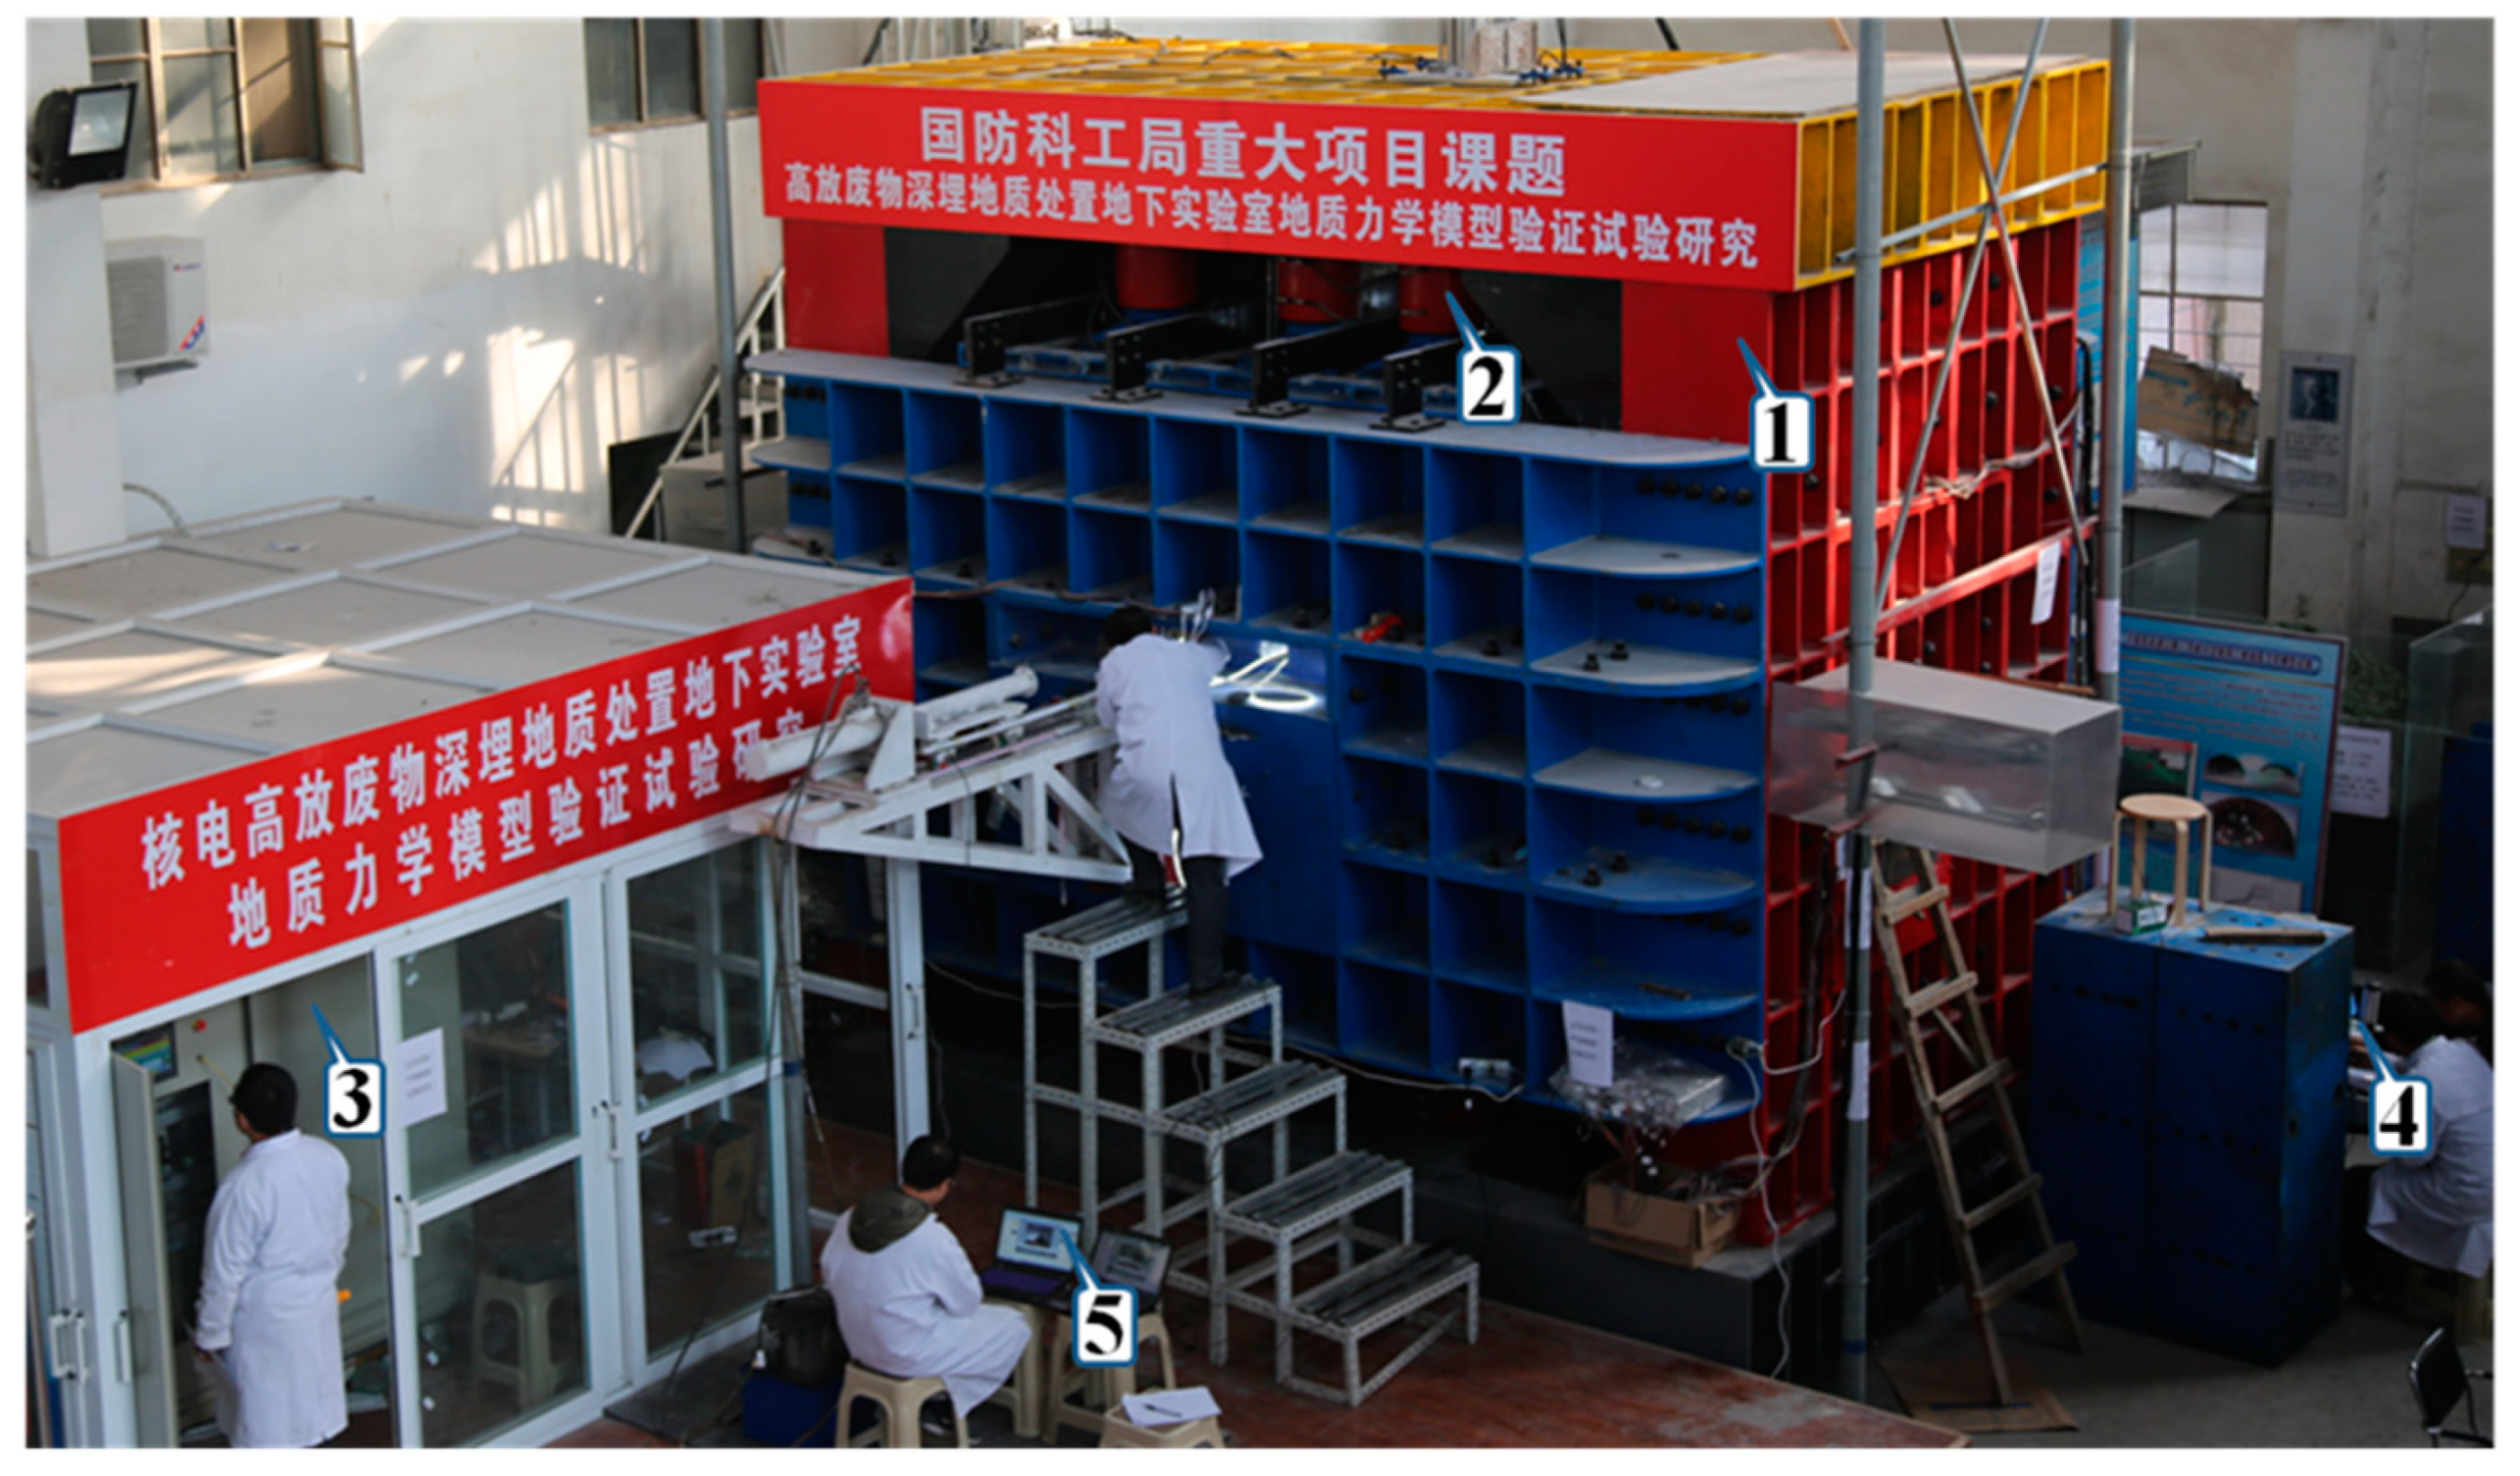
Figure 7 shows the real picture of the model test system after assembly.
This system has the following technical advantages:
  • The loading capacity of the current system is large (the rated output of the system is 63 MPa, and the maximum load is 45,000 kN), meaning that the system can be adopted in the modeling of high and non-uniform in situ stress.
  • The accuracy of the load applied by this system is high (1.5‰ F.S.), with a long duration for applying steady load (over 300 days). This system can meet the requirements of a physical model test, which has the characteristics of high loading accuracy and long test duration, starting from no in situ stress and the implementation of loading/unloading cycles.
  • This system has a broad loading range. It is able to perform a loading/unloading test with a maximum pressure of less than 63 MPa.
  • The test device is large in scale and adjustable in size. The size of the counterforce device can be adjusted according to the model test range to meet the test requirements of different scales of models.

3. Engineering Application

We carried out a true three-dimensional physical model test to verify the reliability of the developed model test system, taking the URL for the deep-buried geological disposal of HLW in the Beishan area, China as prototype.

3.1. Project Overview

The underground laboratory is situated in the Beishan area, Gansu Province. The surface area mainly comprises low mountains and hills. The relative height difference of the terrain is generally less than 30 m. The deep bedrock is mainly granodiorite. The maximum buried depth of the underground laboratory is –560 m, with the main structure composed of a shaft, drift, and ramp tunnel [36,37].

3.2. Model Construction

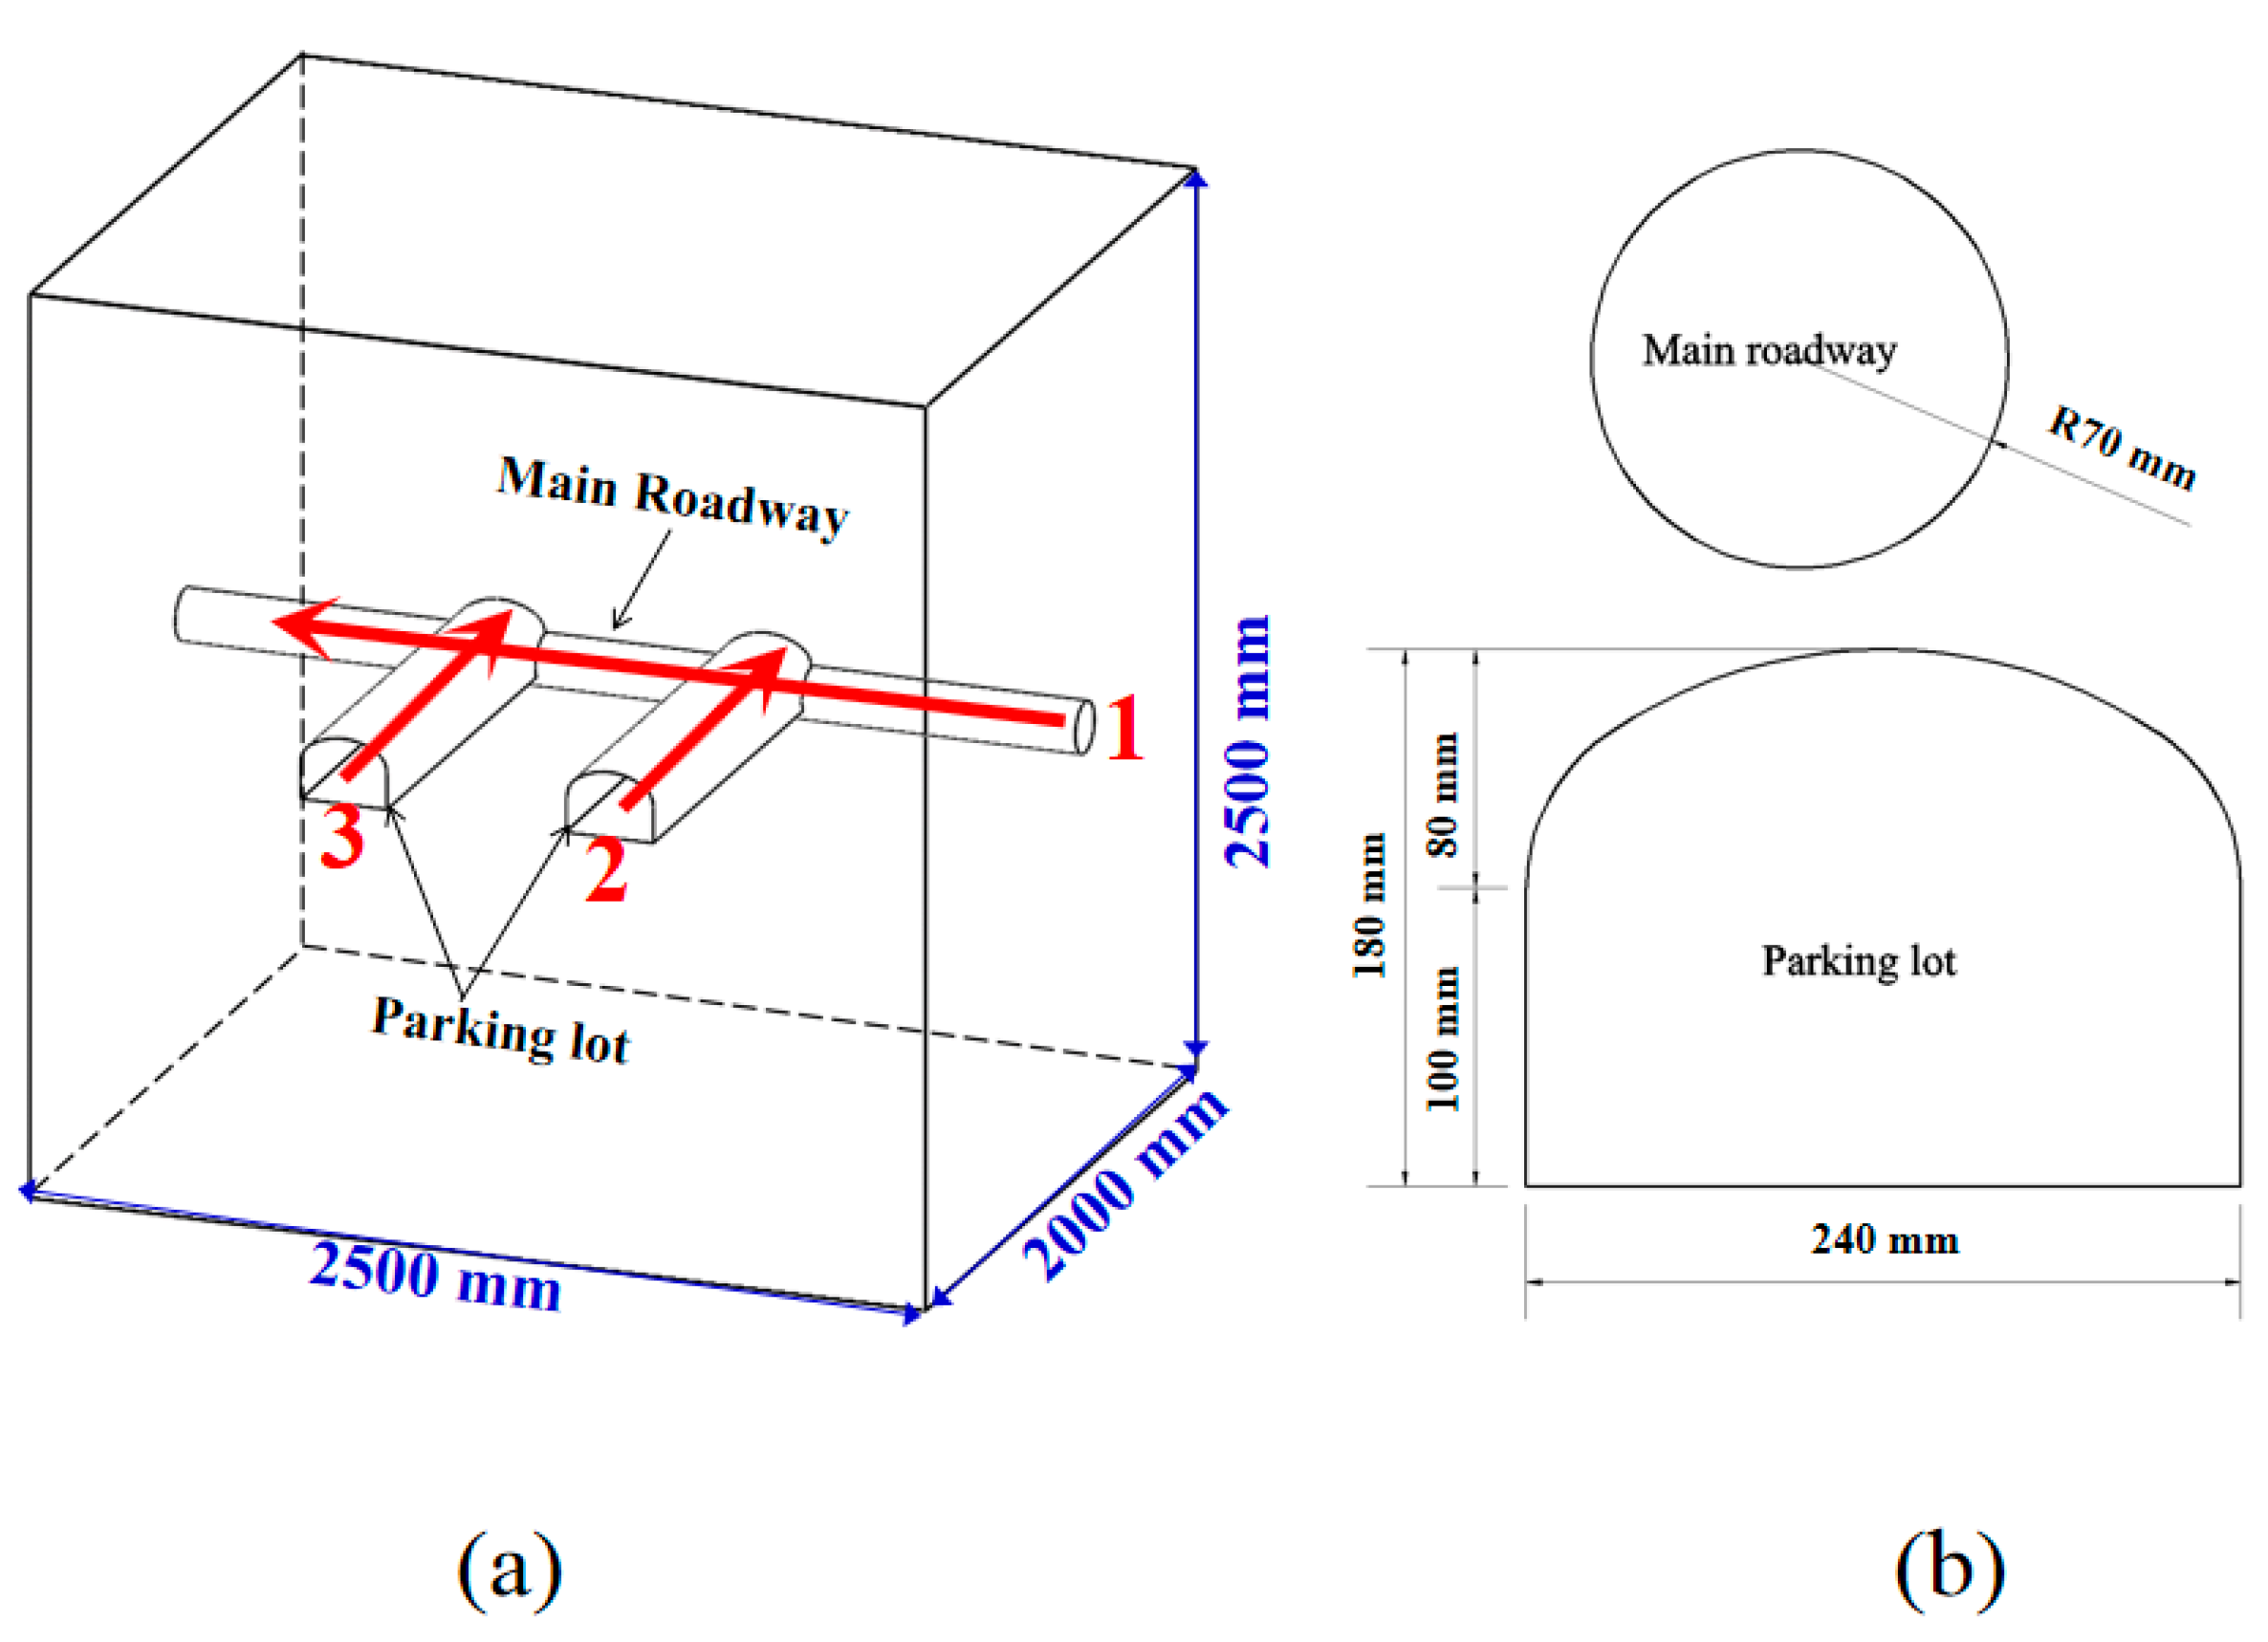
The simulation range of the prototype was 125 m × 125 m × 100 m (length × height × thickness). It included a main roadway (circular cross section with the diameter of 7 m) and tow parking lots (horseshoe cross section with the size of 12 m × 9 m). The geometric similar ratio CL was selected to be 50. Then, the model size was determined to be 2.5 m × 2.5 m × 2 m. The size of each cavern could be calculated according to the similarity principle, as can be found in Figure 8.
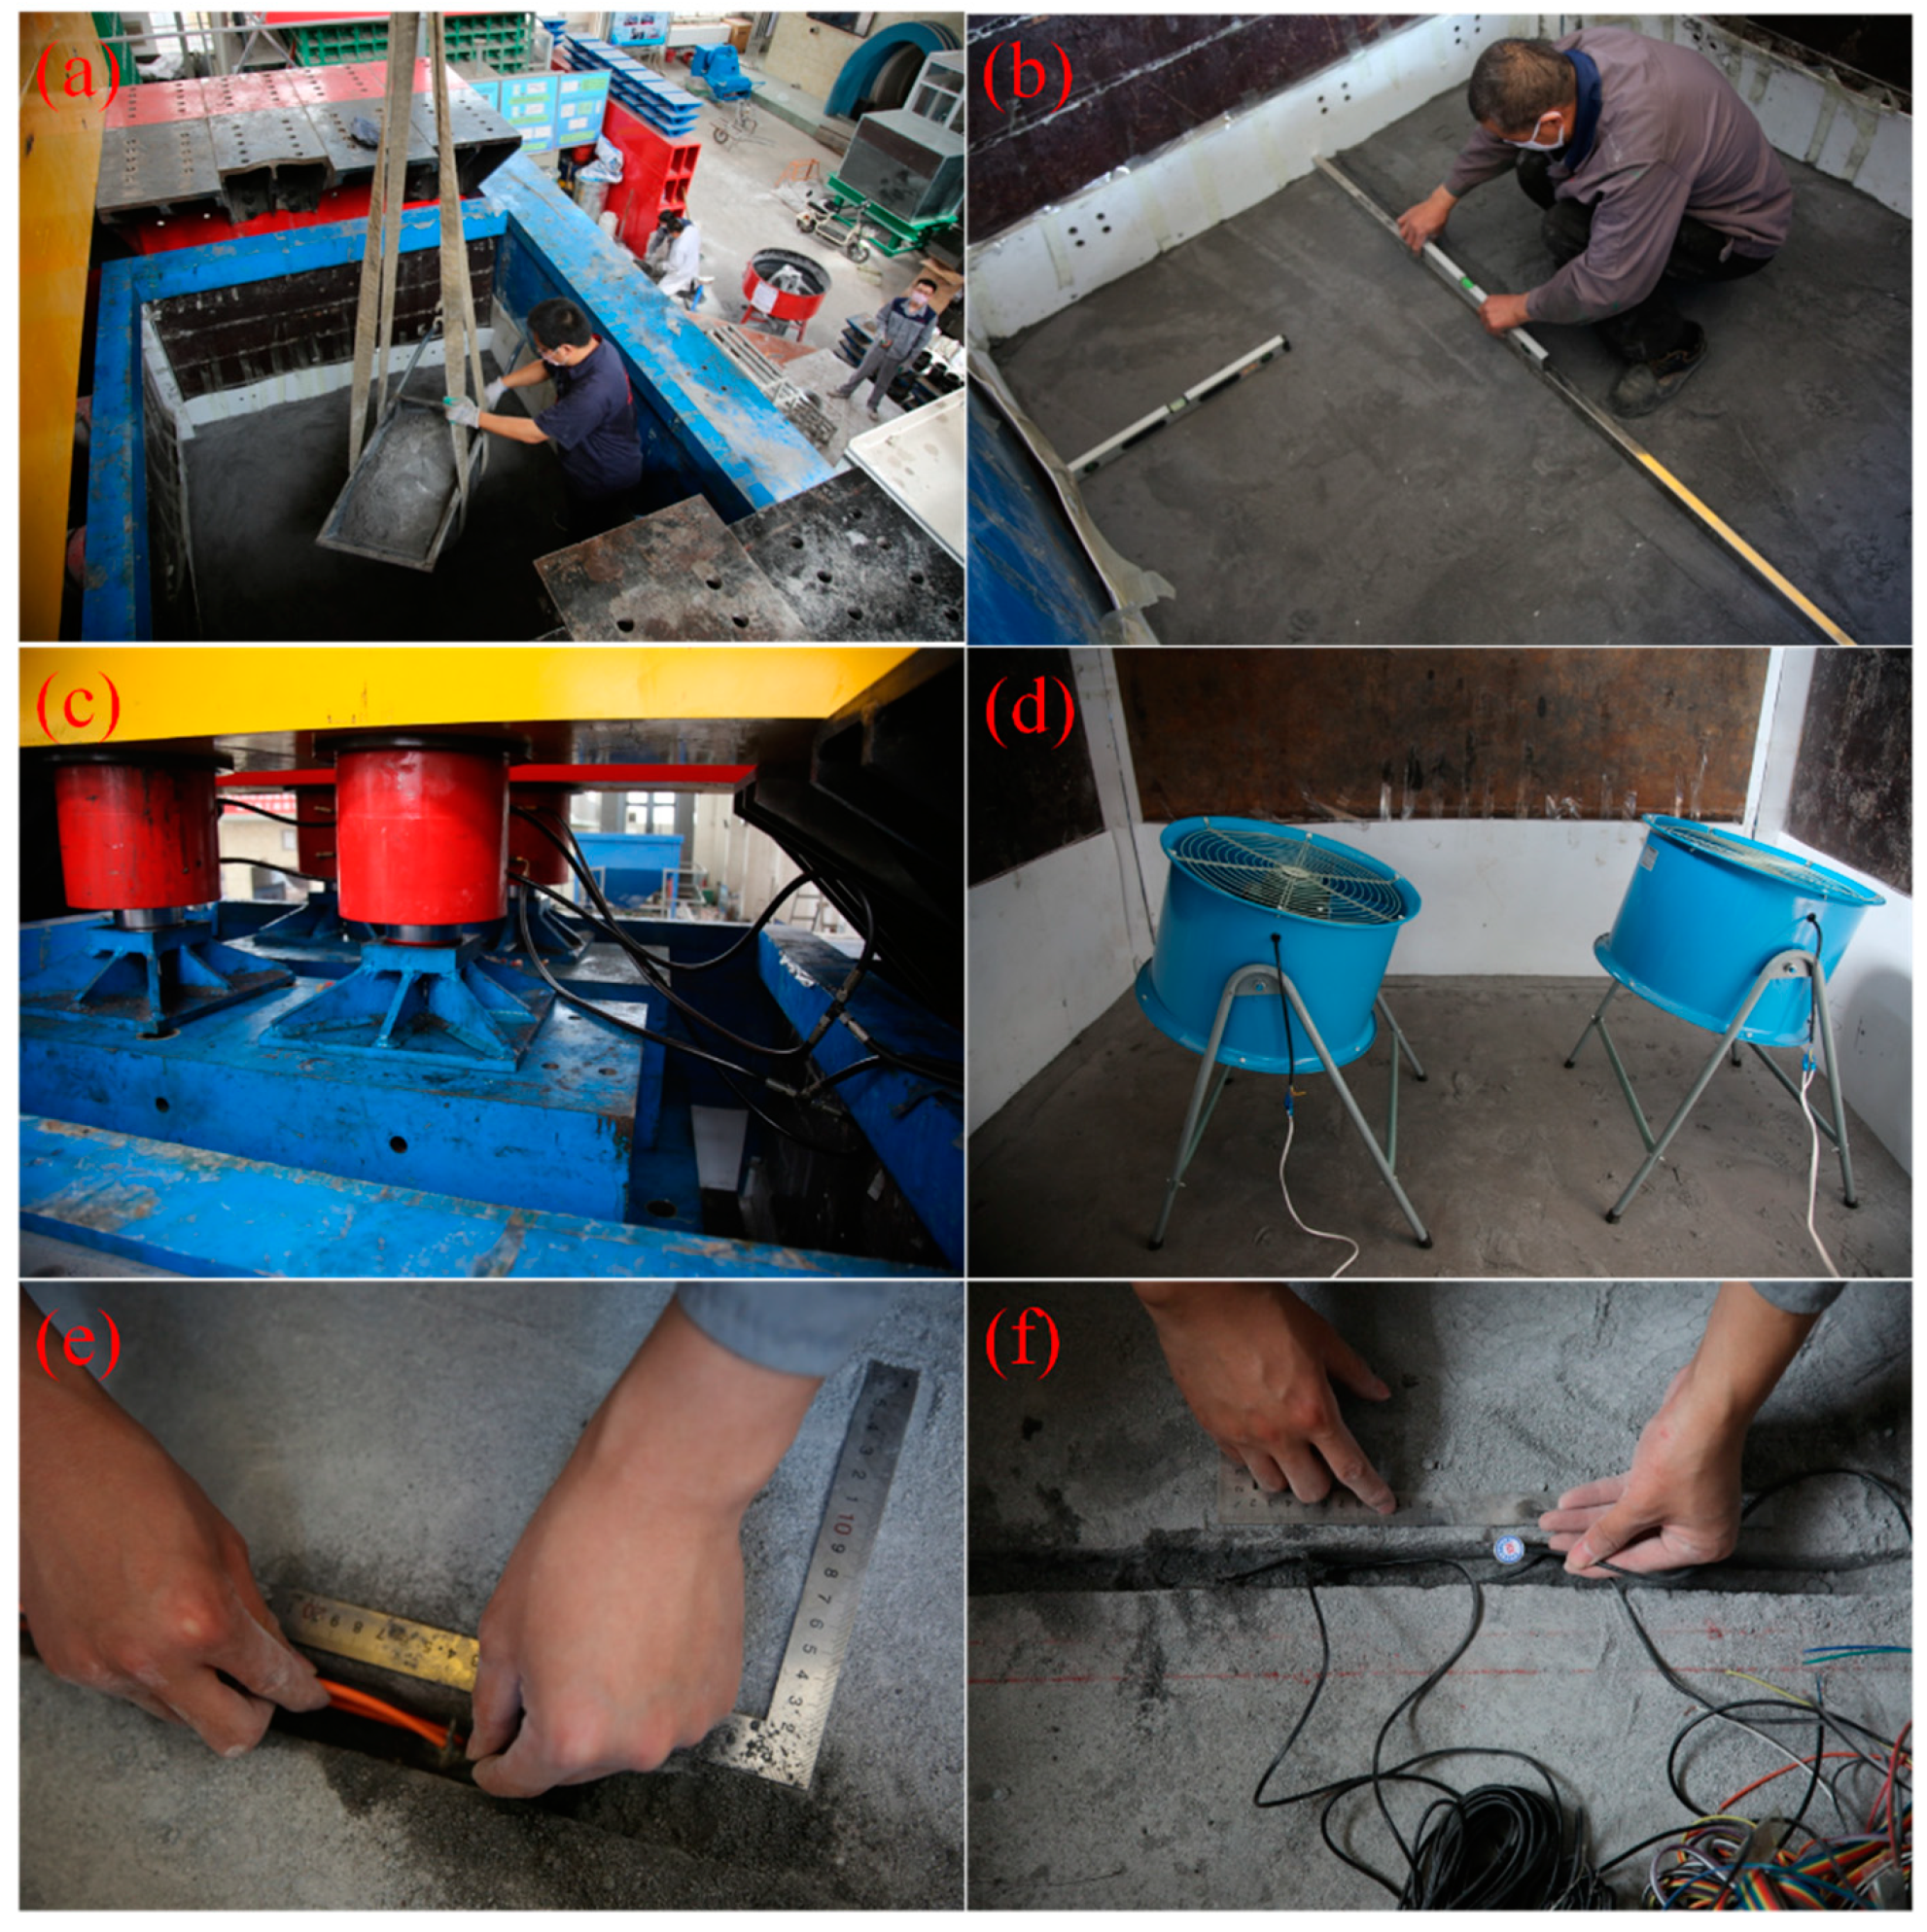
The physical model was established with the method of layer compaction and air-drying technology [38,39,40]. The specific steps are as follows: we poured the mixed material evenly into the test system layer by layer according to the proportion (see Figure 9a); the material was then compacted and air-dried after evenly spreading (see Figure 9b–d); when the model reached the designed position and height, we embedded the optical displacement sensor (see Figure 9e) and strain sensor (see Figure 9f) in the predetermined position; and then, we carried out the next layer of construction until the model was completed.

3.3. Loading Scenario and Excavation Process

With the aim of ensuring that the initial in-situ stress in the model basically conforms to the distribution of the actual in-situ stress of the project, true three-dimensional nonuniform loading must be loaded on the model body. The buried depth of the cavern bottom was –560 m. Based on the results of the in-situ stress inversion [41], we could determine the lateral pressure coefficient parallel to the main roadway axis was k1 = 1.138. The lateral pressure coefficient perpendicular to the main roadway axis was k2 = 0.776. The volume weight of the rock mass was γ = 26.8 KN/m3. So, the non-uniform distribution of the initial stress could be calculated according to Equation (1), as shown in Figure 10.
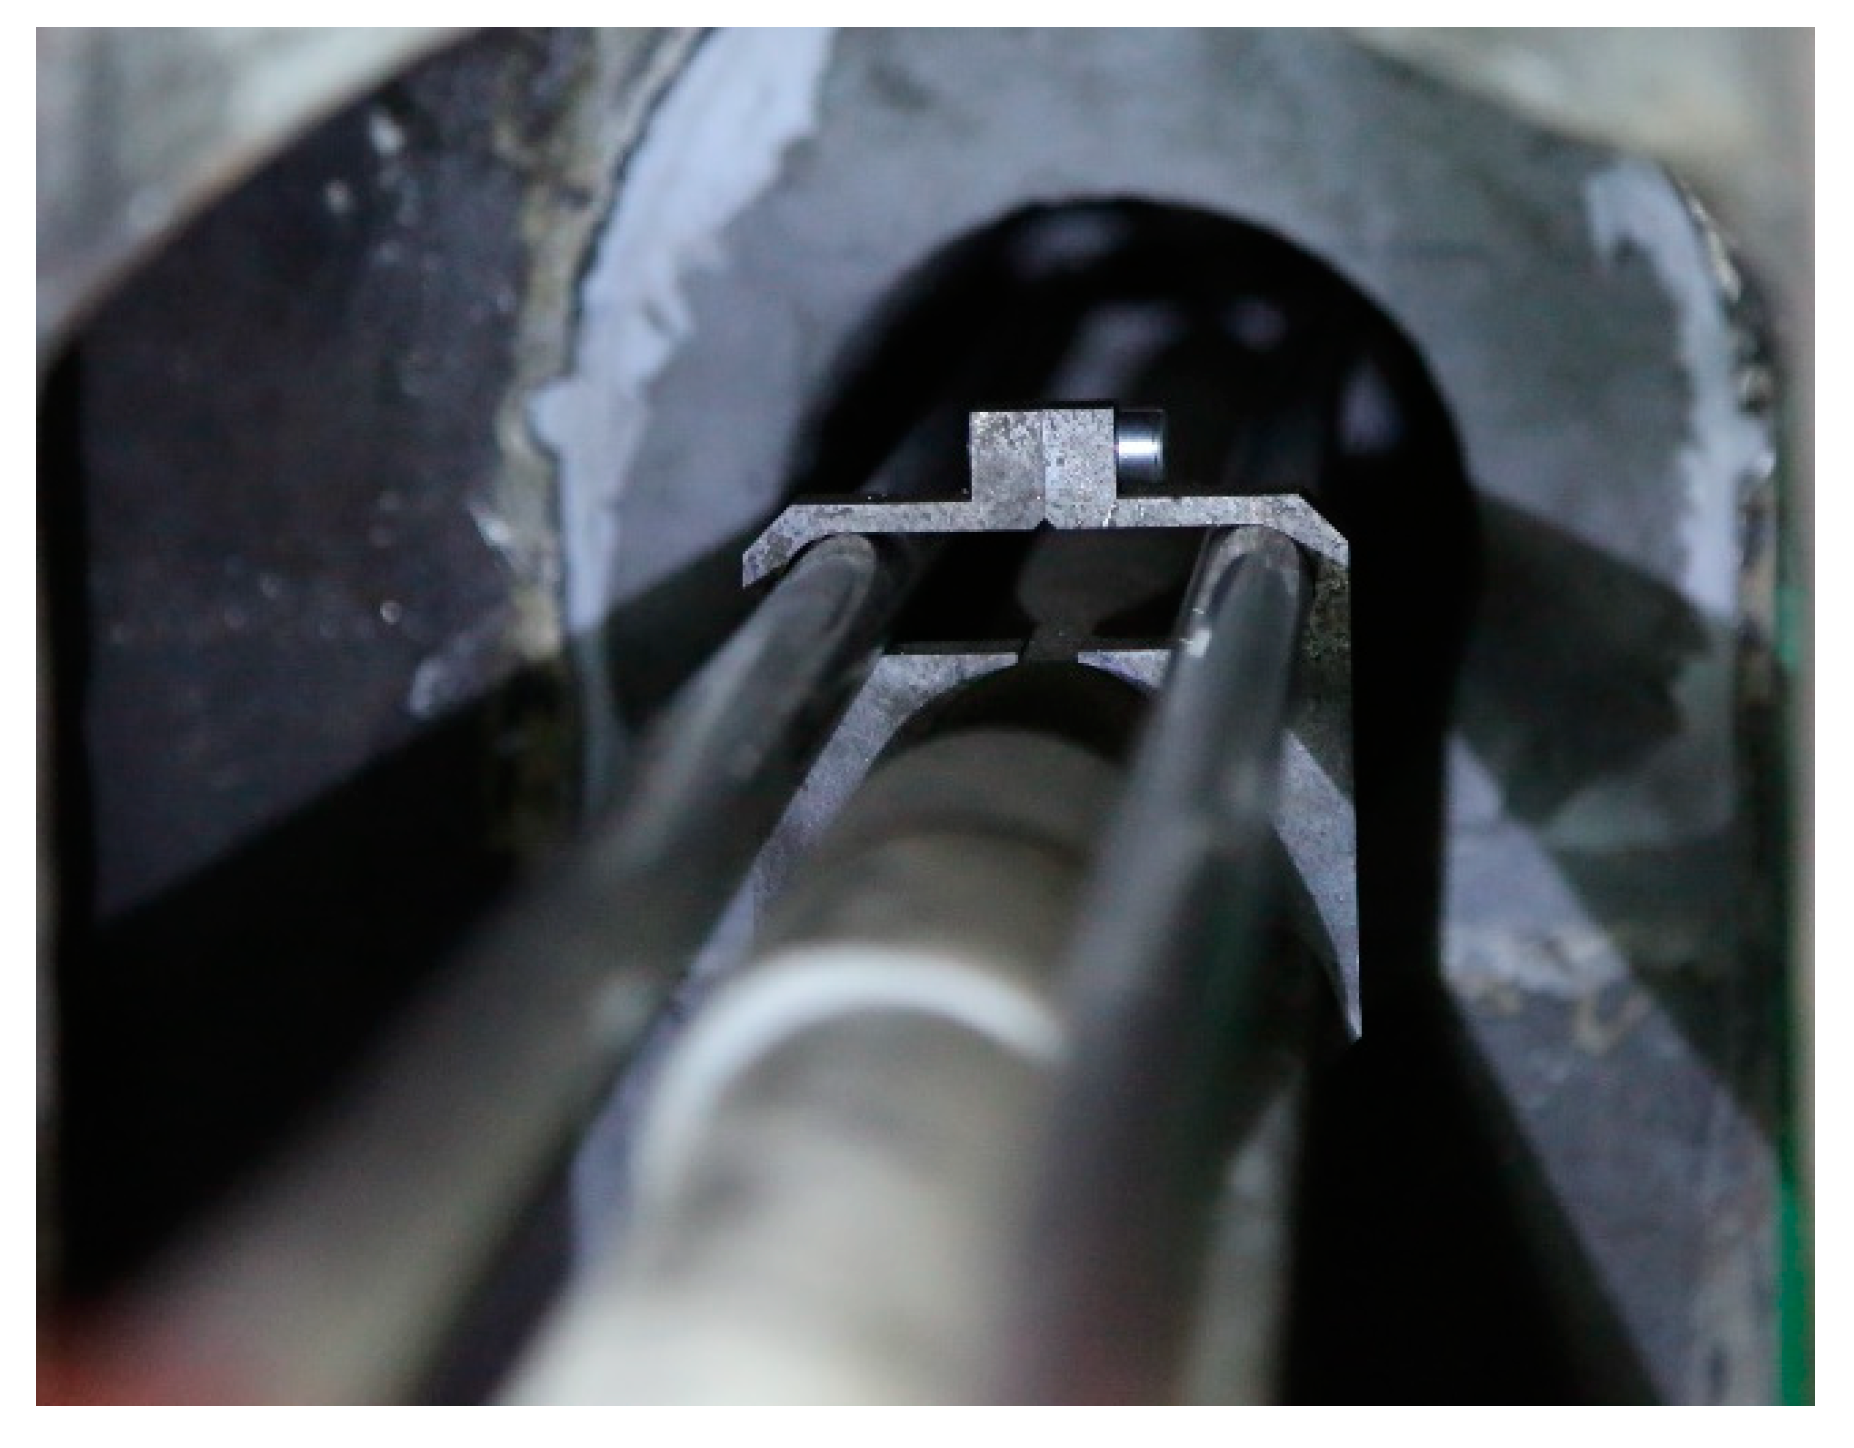
After the construction of the model, the jacks controlled by the test system were loaded on the surface of the model body in proportion until the initial geostress shown in Figure 10 was reached. Then, the initial in-situ stress field was formed in the model body after 24 hours of steady pressure. After the pressure stabilization, the micro TBM (tunnel boring machine) excavation device (see Figure 11) was used for excavation, and we observed the damage process of the excavated cavern in real time through the high-definition multi-probe peeping system.
After the completion of each cavern construction and excavation phase, we carried out the overloading test: namely, the self-weight stress and structural stress were gradually increased step by step with a magnitude of 0.1 times the initial stress, and the deformation and failure development around the tunnel are simultaneously observed through the high-definition multi-probe peeping system. After the first-level overloading and monitoring was completed, the next-level overloading was applied until the cavern collapse was obvious.

3.4. Results and Discussion

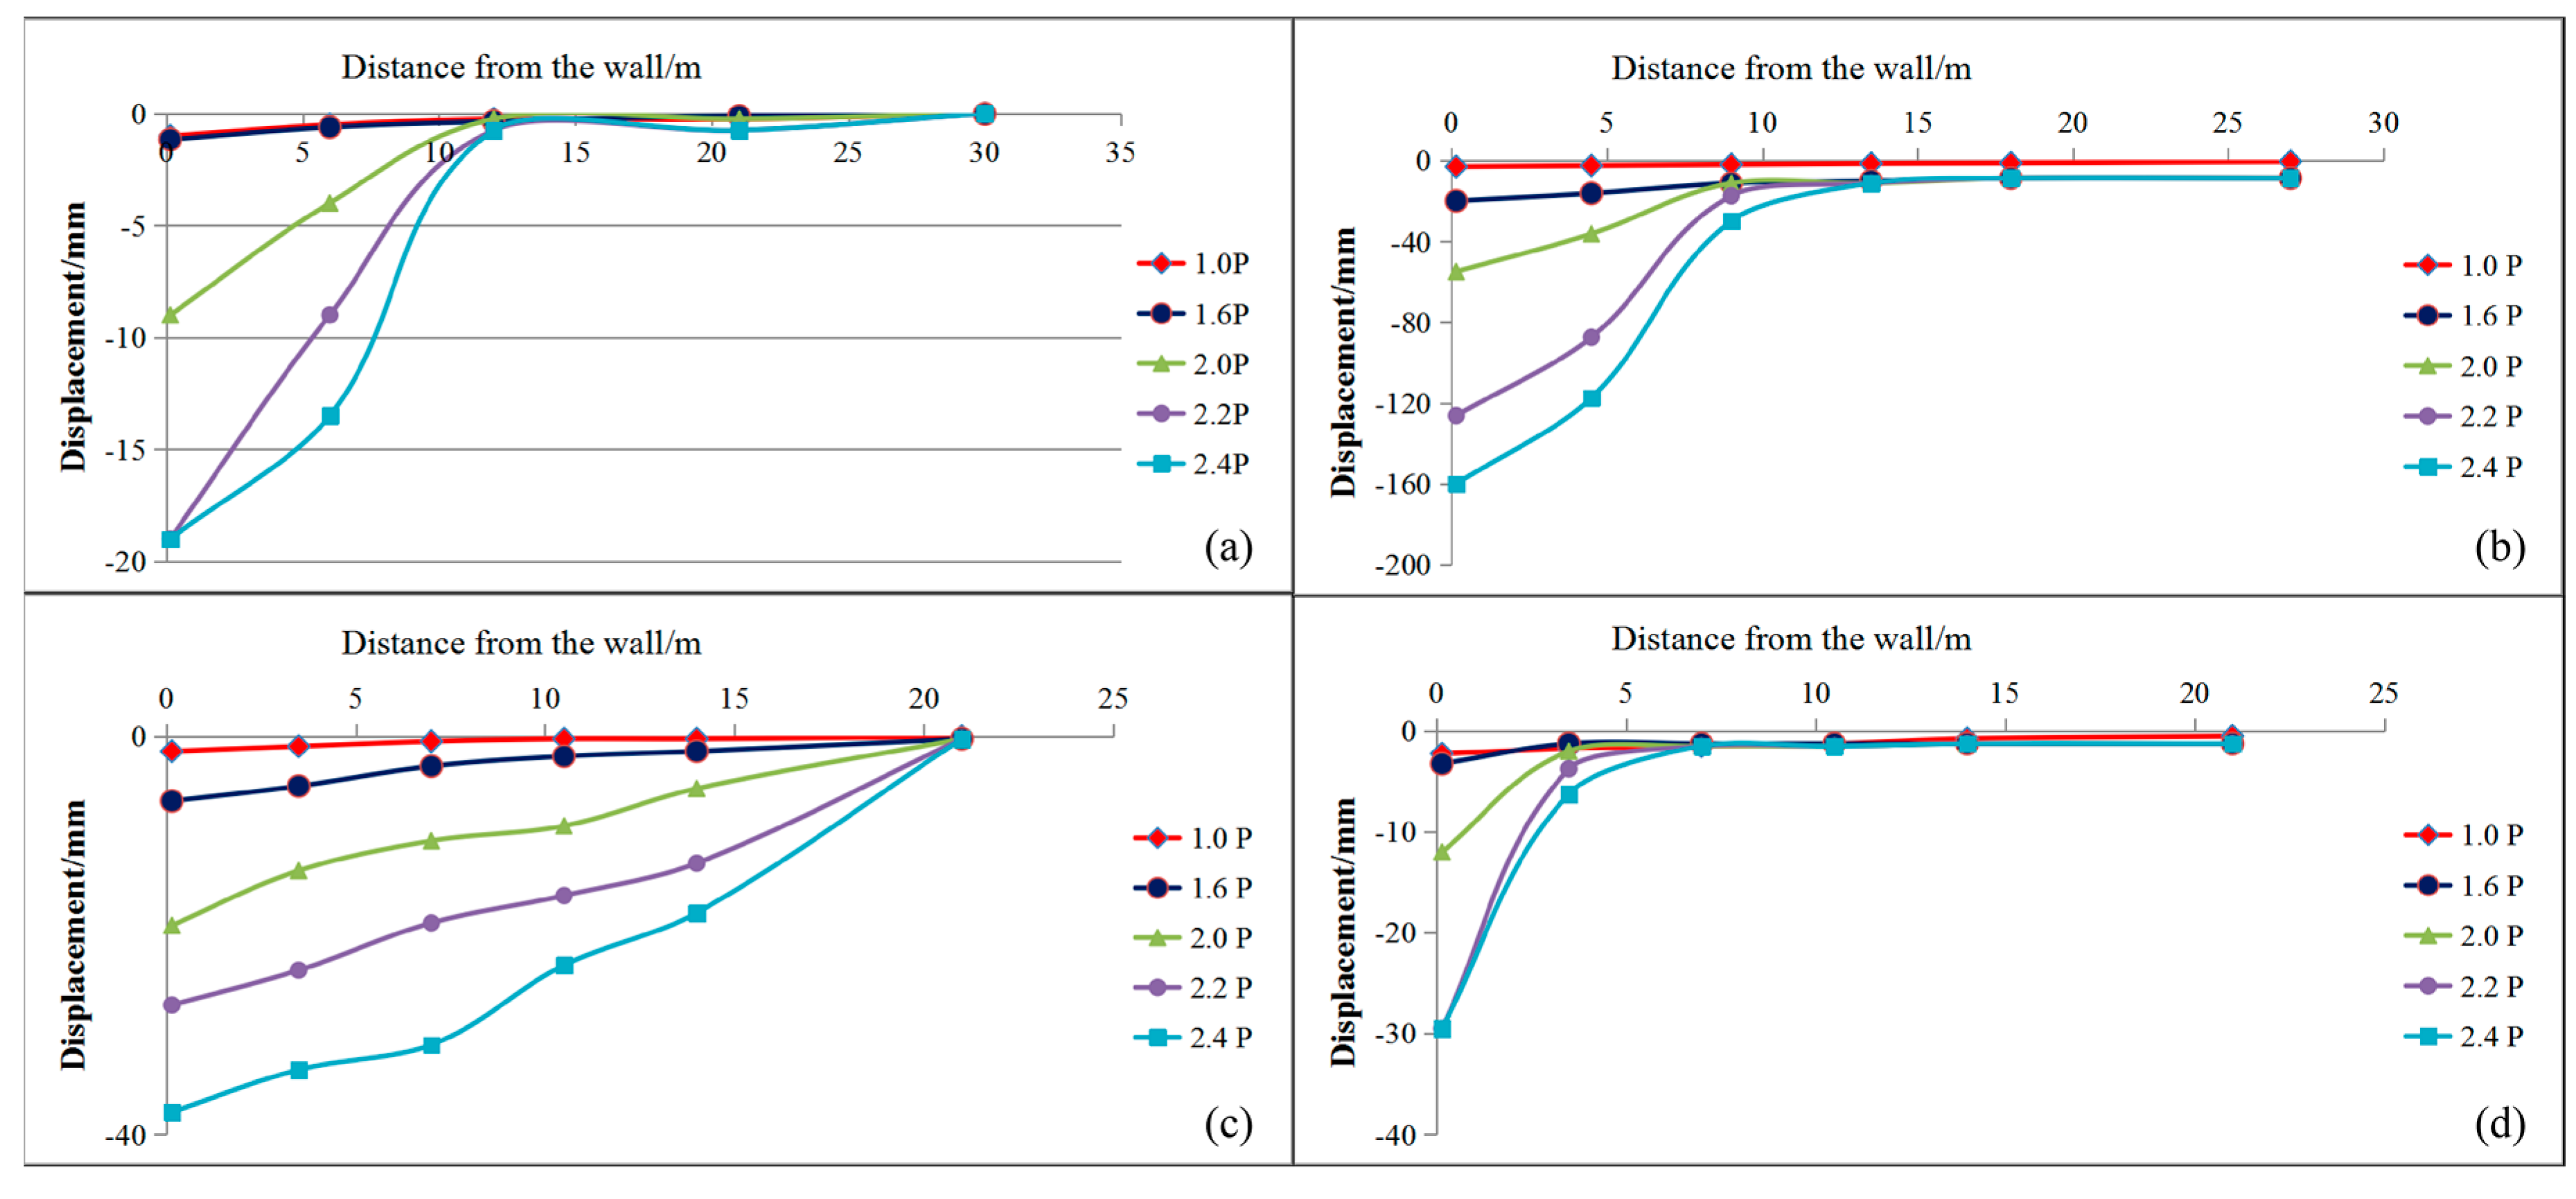
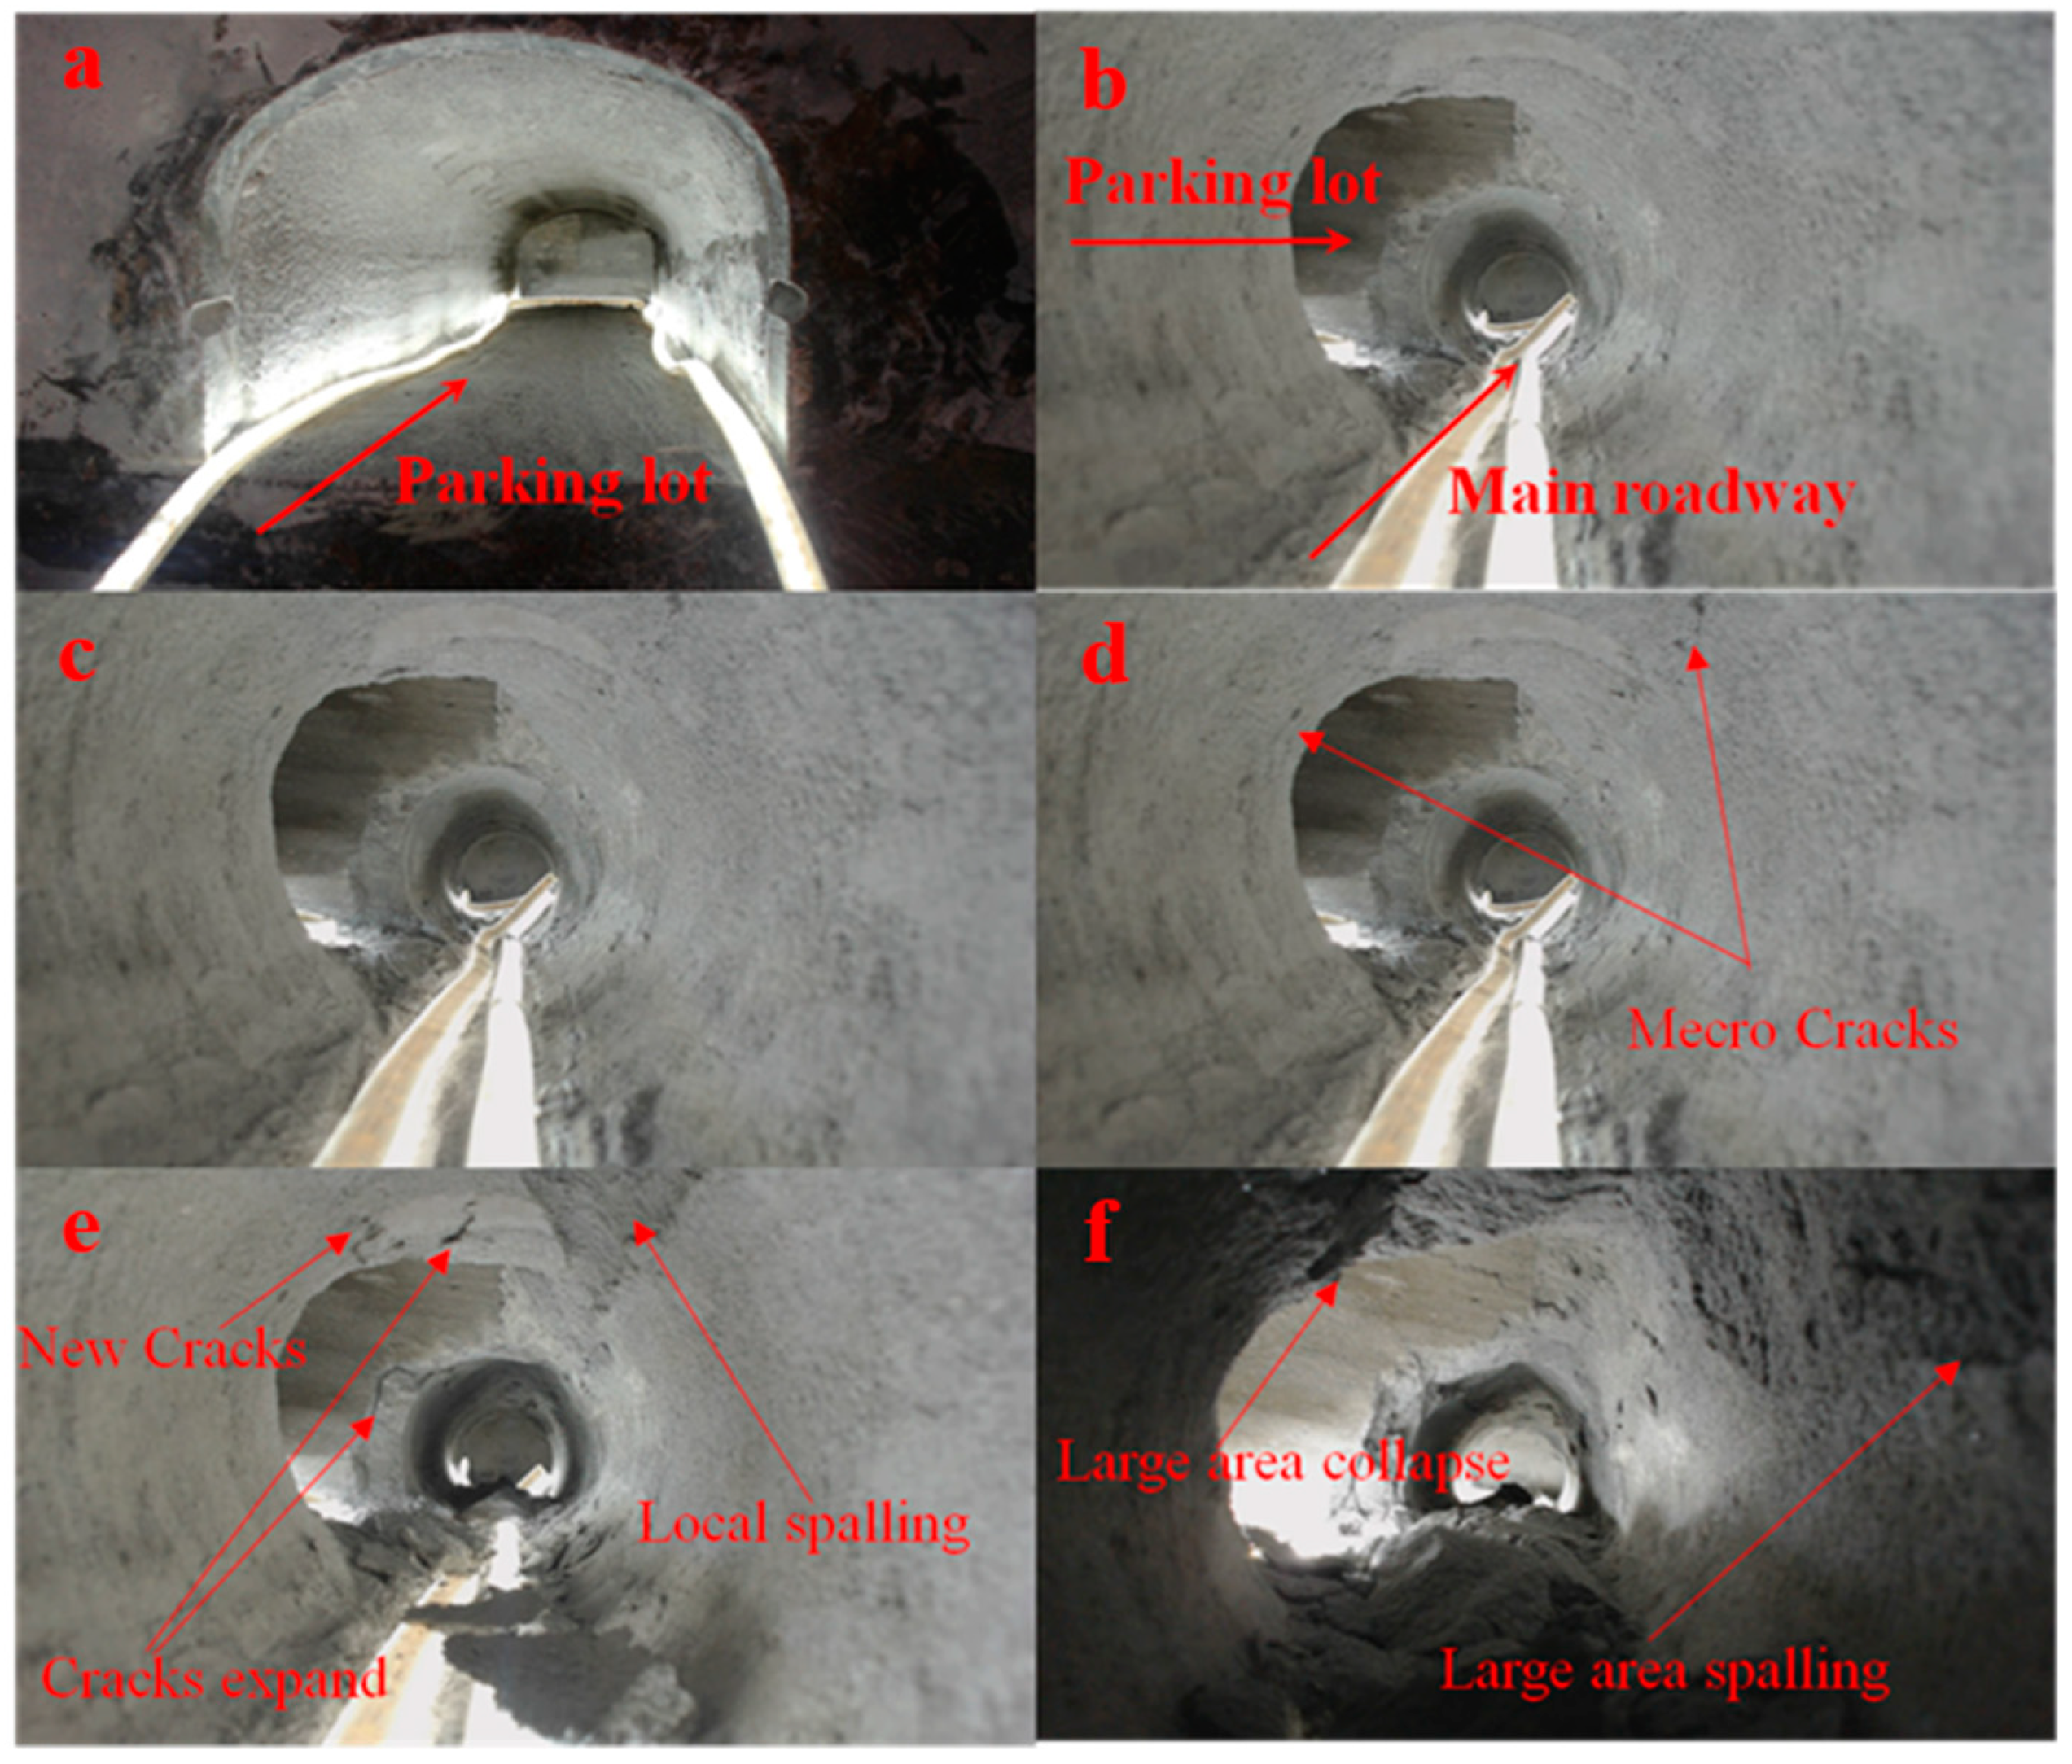
Through the displacement curve by the displacement monitoring system (as shown in Figure 12) and the deformation and damage photos recorded by the high-definition multi-probe peeping system (as shown in Figure 13), we could observe the following:
  • After excavation, the whole cavern group was in a stable state, and there were no visible cracks around the cavern (see Figure 13a,b); at this time, the deformation value of rock mass around the caverns was small, and the displacement decreased monotonously (see Figure 12 1.0).
  • With the gradual increase of the overload in-situ stress, the cavern group gradually changed from a stable state to a destructive state: the microcracks first appeared at the junction (see Figure 13d), and the overload multiple continued to increase; the microcracks gradually started to expand and penetrate, and large compression shear or tension shear cracks appeared at the vault and side wall of the cavern (see Figure 13e), at this time, the deformation around the cavern increased gradually (see Figure 12 2.0 P, 2.2 P).
  • Overload multiplication further increased, and the cracks rapidly expanded and broke through, which led to large-scale spalling damage on the intersection. This made the cavern group enter the stage of overall failure (see Figure 13f). At this time, both the displacement value and the displacement change rate increased significantly (see Figure 12 2.4P).
The laws observed by the high-definition multi-probe peeping system and the displacement monitoring system were consistent, which proved the test system to be reliable.
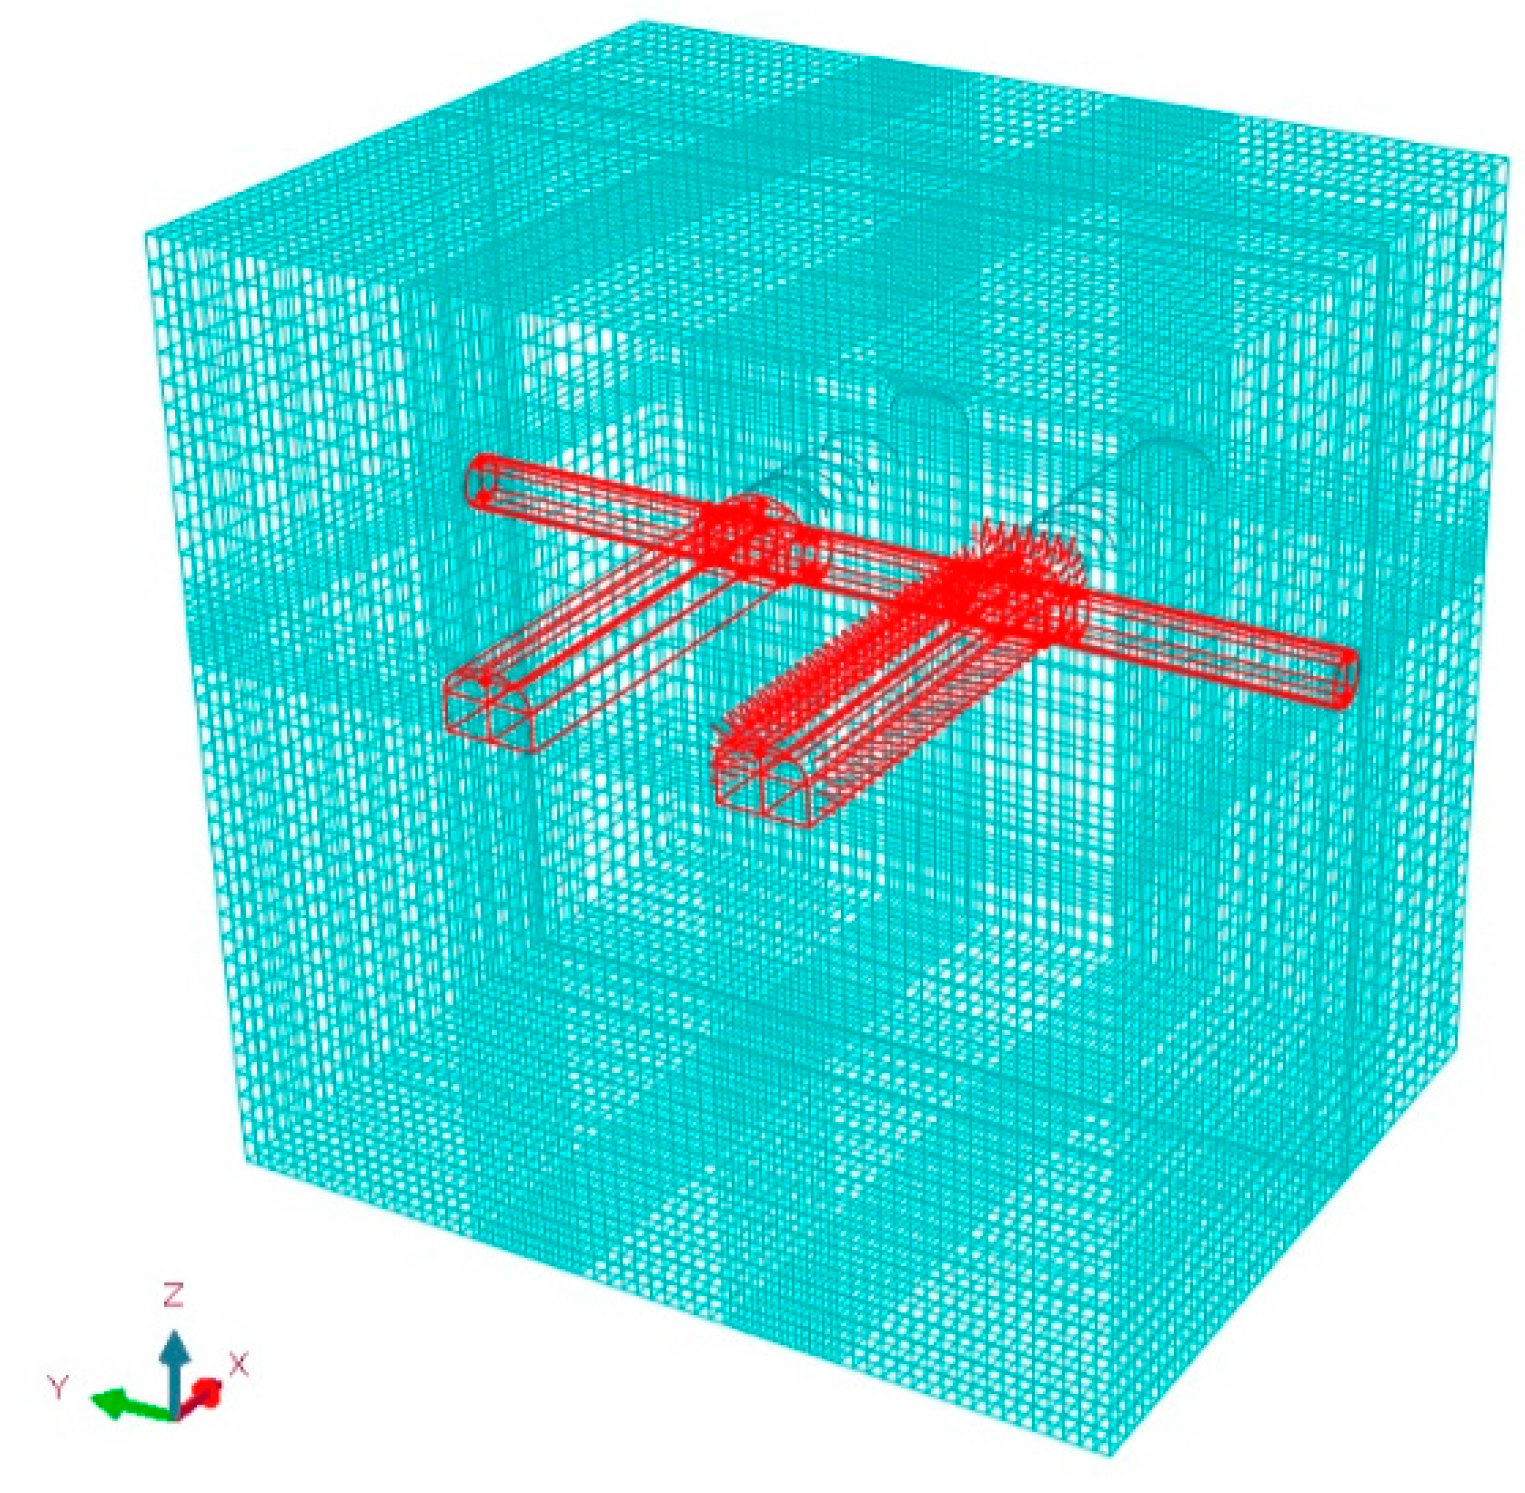
For the sake of verifying the dependability of the model test system, the finite element method software ABAQUS (Dassault SIMULIA, USA) was used to perform numerical calculation on the excavation process of the cavern group. The arrangement and geometry size of the cavern group in the numerical calculation were the same as the physical model test. The internal elements of the numerical model were all hexahedrons (see Figure 14).
The numerical model consisted of 984,342 nodes and 864,116 elements. As the model caverns group was still in the stage of elastic failure after excavation, we used the elastic-plastic model in the numerical calculation. We used the Mohr Coulomb criterion as the yield criterion. The rock mechanical parameters, the initial stress state and the excavation control parameters were consistent with the model test, facilitating strict comparison between the results of the model test and numerical calculation. We used a fixed constraint at the bottom, normal constraint at the side and overburden stress at the top as the boundary conditions.
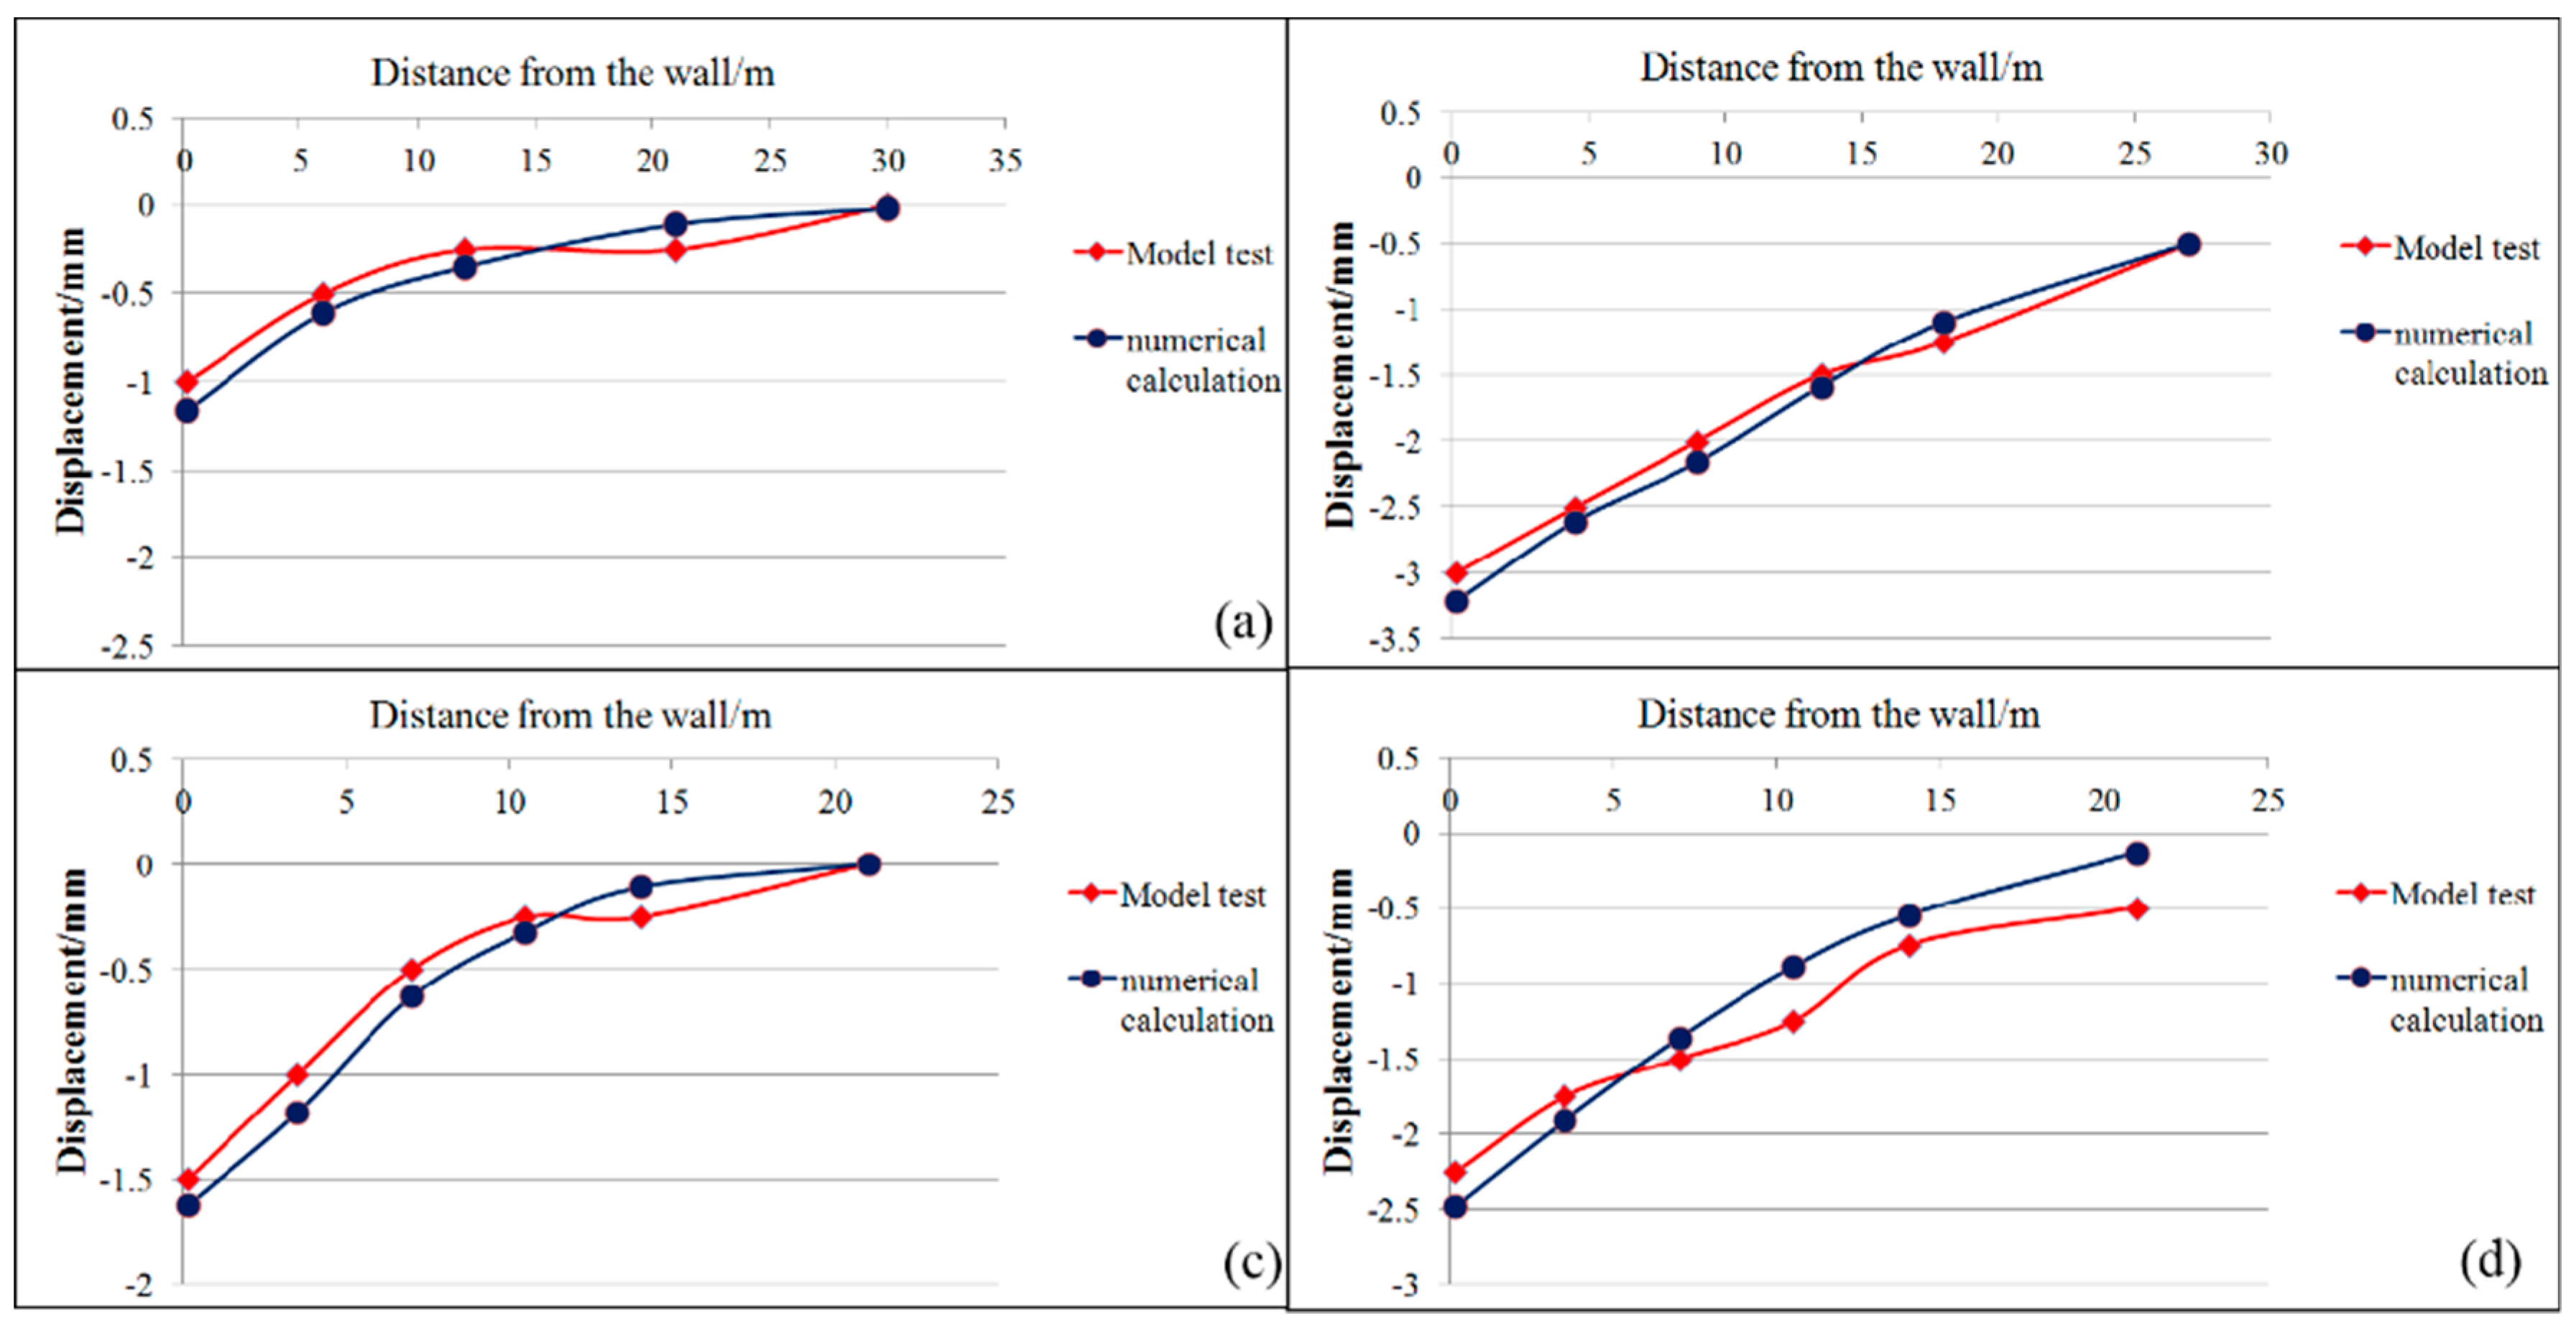
We compared the experimental results of displacement on the typical cross section with the numerical simulation (see Figure 15).
It can be seen from these figures that the value and slope of the displacement calculated by numerical simulation were largely the same as the experimental results of the geological model test. The comparison results validated the accuracy and reliability of the model test system in this study.

4. Conclusions

We developed an intelligent true triaxial non-uniform loading/unloading model test system using numerical control technology and photoelectric conversion technology. This system has the following advantages:
  • The rated output of the system is large (63 MPa), which can be adopted in the modeling of high and non-uniform in situ stress.
  • The accuracy of the load applied by this system is high (1.5‰ F.S.), with a long duration for applying steady load (over 300 days), which can start from no in situ stress and the implementation of loading/unloading cycles.
  • The test device is large in scale and adjustable in size.
  • The accuracy of the displacement test is high (±0.005 mm) and the failure process of the cavern can be observed directly.
We carried out a true three-dimensional physical model experiment for the excavation and overloading process of a typical cavern group in an underground laboratory. The whole cavern group was in a stable state after excavation. The deformation value of the rock mass around the cavern was small, and the displacement around the cavern decreased monotonously. We observed the whole process of deformation and failure of surrounding rock, from the appearance of microcracks, expansion of cracks and penetration to the collapse of the cavern group during the overloading test. The nonlinear deformation characteristics and the law of displacement change of the underground laboratory caverns were reproduced. This provided an important experimental basis for optimizing the design and building of URLs for the deep-buried geological disposal of HLW.
The value and slope of the displacement calculated by the numerical simulation were mainly the same as the experimental results of geological model test. The comparison results validated the accuracy and reliability of the model test system in this study. This model test system has important application prospects in simulating the nonlinear deformation failure mechanism of deep-buried underground engineering for energy, traffic, hydropower, mines and so on.

Author Contributions

Data curation, formal analysis, writing—original draft, writing—review and editing, C.L.; methodology, project administration, writing—review and editing, Q.Z.; formal analysis, software, Writing—review and editing, K.D.; data curation and software, W.X.; methodology, writing—review and editing, Y.J. All authors have read and agreed to the published version of the manuscript.

Funding

This research was funded by “the National Natural Science Foundation of China, grant number NO.41772282”, “the Taishan Scholars Project Foundation of Shandong Province”, “the Natural Key Research Development Project of China, grant number No. 2016YFC0401804”, and “the Preliminary research project of the underground laboratory for the geological disposal of high-level radioactive waste of China, grant number No. YK-KY-J-2015-25)”.

Acknowledgments

We would also like to express our heartfelt thanks to those who contributed to the review of this article and to the editors.

Conflicts of Interest

The authors declare no conflict of interest.

References

  1. Wang, J.; Chen, L.; Su, R.; Zhao, X.G. The Beishan underground research laboratory for geological disposal of high-level radioactive waste in China: Planning, site selection, site characterization and in situ tests. J. Rock Mech. Geotech. Eng. 2018, 10, 411–435. [Google Scholar] [CrossRef]
  2. Cerullo, N. An additional performance of HTRS: the waste radiotoxicity minimisation. Radiat. Prot. Dosim. 2005, 115, 122–125. [Google Scholar] [CrossRef] [PubMed]
  3. Ahn, J.; Apted, M.J. Geological Repository Systems for Safe Disposal of Spent Nuclear Fuels and Radioactive Waste, 2nd ed.; Ahn, J., Apted, M.J., Eds.; Woodhead Publishing: Cambridge, UK, 2017; p. 802. [Google Scholar]
  4. Scientific and Technical Basis for the Geological Disposal of Radioactive Wastes; Technical Reports Series No. 413; International Atomic Energy Agency: Wien, Vienna, 2003; 80p.
  5. Verron, H.; Sterpenich, J.; Bonnet, J.; Bourdelle, F.; Mosser-Ruck, R.; Lorgeoux, C.; Randi, A.; Michau, N. Experimental Study of Pyrite Oxidation at 100 °C: Implications for Deep Geological Radwaste Repository in Claystone. Minerals 2019, 9, 427. [Google Scholar] [CrossRef] [Green Version]
  6. Farid, O.M.; Ojovan, M.I.; Massoud, A.; Rahman, R.O.A. An Assessment of Initial Leaching Characteristics of Alkali-Borosilicate Glasses for Nuclear Waste Immobilization. Materials 2019, 12, 1462. [Google Scholar] [CrossRef] [Green Version]
  7. Zhang, C.L.; Wang, J.; Su, K. Concepts and tests for disposal of radioactive waste in deep geological formations. CJRME 2006, 25, 750. [Google Scholar]
  8. Laverov, N.P.; Omelianenko, B.L.; Velichkin, V.I. Geological Aspects of the Nuclear Waste Disposal Problem; Lawrence Berkeley Laboratory, University of California: Berkeley, CA, USA, June 1994; p. 22. [Google Scholar]
  9. Costin, L.S. Site Selection and Characterization Processes for Deep Geologic Disposal of High Level Nuclear Waste; Albuquerque Sandia National Laboratories: Alberquerque, NM, USA, October 1997; p. 18. [Google Scholar]
  10. Wang, J.; Su, R.; Chen, W.M.; Guo, Y.H.; Jin, Y.X.; Wen, Z.J.; Liu, Y.M. Deep geological disposal of high-level radiocative wastes in China. Rock Mech. Eng. 2006, 25, 649–658. [Google Scholar]
  11. The Role of Underground Laboratories in Nuclear Waste Disposal Programmes; Radioactive Waste Management, OECD Publications, Nucler Energy Agency: Paris, France, 2001; p. 42.
  12. Comino, J.Á.L.; Heimann, S.; Cesca, S.; Claus, M.; Dahm, T.; Zang, A. Automated Full Waveform Detection and Location Algorithm of Acoustic Emissions from Hydraulic Fracturing Experiment. Procedia Eng. 2017, 191, 697–702. [Google Scholar] [CrossRef]
  13. Ren, M.Y.; Zhang, Q.Y.; Liu, C.C.; Wu, D.; Ding, Y.Z. The Elastic-Plastic Damage Analysis of Underground Research Laboratory Excavation for Disposal of High Level Radioactive Waste. Geotech. Geol. Eng. 2019, 37, 1793–1811. [Google Scholar] [CrossRef]
  14. Duan, K.; Ji, Y.; Wu, W.; Kwok, C.Y. Unloading-induced failure of brittle rock and implications for excavation-induced strain burst. Tunn. Undergr. Space Technol. 2019, 84, 495–506. [Google Scholar] [CrossRef]
  15. Deng, J.Q.; Yang, Q.; Liu, Y.R.; Pan, Y.W. Stability evaluation and failure analysis of rock salt gas storage caverns based on deformation reinforcement theory. Comput. Geotech. 2015, 68, 147–160. [Google Scholar] [CrossRef]
  16. Reva, V.N. Stability criteria of underground workings under zonal disintegration of rocks. J. Min. Sci. 2002, 38, 31–34. [Google Scholar] [CrossRef]
  17. Sellers, E.; Klerck, P. Modeling of the effect of discontinuities on the extent of the fracture zone surrounding deep tunnels. Tunn. Undergr. Space Technol. 2000, 15, 463–469. [Google Scholar] [CrossRef]
  18. Guzev, M.A.; Paroshin, A.A. Non-euclidean model of the zonal disintegration of rocks around an underground working. J. Appl. Mech. Tech. Phys. 2001, 42, 131–139. [Google Scholar] [CrossRef]
  19. Kwok, C.; Duan, K.; Pierce, M. Modeling hydraulic fracturing in jointed shale formation with the use of fully coupled discrete element method. Acta Geotech. 2019, 15, 245–264. [Google Scholar] [CrossRef]
  20. Yu, G.; Yang, Q.; Dai, B.; Fu, Z.; Lin, D. Numerical Study on the Characteristic of Temperature Drop of Crude Oil in a Model Oil Tanker Subjected to Oscillating Motion. Energies 2018, 11, 1229. [Google Scholar] [CrossRef] [Green Version]
  21. Duan, K.; Kwok, C.Y.; Zhang, Q.Y.; Shang, J.L. On the initiation, propagation and reorientation of simultaneously-induced multiple hydraulic fractures. Comput. Geotech. 2020, 117, 103226. [Google Scholar] [CrossRef]
  22. Meguid, M.A.; Saada, O.; Nunes, M.A.; Mattar, J. Physical modeling of tunnels in soft ground: A review. Tunn. Undergr. Space Technol. 2008, 23, 185–198. [Google Scholar] [CrossRef]
  23. Ren, M.Y.; Zhang, Q.Y.; Zhang, Z.J.; Zhang, L.Y.; Gao, Q. Study on Mechanism of Segmental Lining-Bolt Combined Support for Deep-Buried Tunnel. Geotech. Geol. Eng. 2019, 37, 3649–3671. [Google Scholar] [CrossRef]
  24. Zhang, Q.Y.; Zhang, Y.; Duan, K.; Liu, C.C.; Miao, Y.S.; Wu, D. Large-scale geo-mechanical model tests for the stability assessment of deep underground complex under true-triaxial stress. Tunn. Undergr. Space Technol. 2019, 83, 577–591. [Google Scholar] [CrossRef]
  25. Zhang, Q.Y.; Ren, M.Y.; Duan, K.; Wang, W.S.; Gao, Q.; Lin, H.X.; Xiang, W.; Jiao, Y.Y. Geo-mechanical model test on the collaborative bearing effect of rock-support system for deep tunnel in complicated rock strata. Tunn. Undergr. Space Technol. 2019, 91, 103001. [Google Scholar] [CrossRef]
  26. Zhang, Q.Y.; Zhang, X.T.; Wang, Z.C.; Xiang, W.; Xue, J.H. Failure mechanism and numerical simulation of zonal disintegration around a deep tunnel under high stress. Int. J. Rock Mech. Min. Sci. 2017, 93, 344–355. [Google Scholar] [CrossRef]
  27. Chen, H.M.; Yu, H.S.; Smith, M.J. Physical model tests and numerical simulation for assessing the stability of brick-lined tunnels. Tunn. Undergr. Space Technol. 2016, 53, 109–119. [Google Scholar] [CrossRef]
  28. Ren, M.Y.; Zhang, Q.Y.; Chen, S.Y.; Yin, X.J.; Li, F.; Xiang, W.; Yu, G.Y. Physical model test study on synergistic action of lining-rock for deep tunnel under complex geological conditions. CEJ 2019, 52, 98–109. [Google Scholar]
  29. Kulatilake, P.H.S.W.; He, W.; Um, J.; Wang, H. A physical model study of jointed rock mass strength under uniaxial compressive loading. Int. J. Rock Mech. Min. Sci. 1997, 34, 165. [Google Scholar] [CrossRef]
  30. He, M.C. Physical modeling of an underground roadway excavation in geologically 45° inclined rock using infrared thermography. Eng. Geol. 2011, 121, 165–176. [Google Scholar] [CrossRef]
  31. Shin, J.H.; Choi, Y.K.; Kwon, O.Y.; Lee, S.D. Model testing for pipe-reinforced tunnel heading in a granular soil. Tunn. Undergr. Space Technol. 2008, 23, 241–250. [Google Scholar] [CrossRef]
  32. Zhu, W.S.; Zhang, Q.B.; Li, Y.; Sun, L.F.; Zhang, L.; Zheng, W.H. Development of large-scale geomechanical model test system under true triaxial loading and its applications. Rock Mech. Eng. 2010, 29, 1–7. [Google Scholar]
  33. Zhu, W.S.; Li, Y.; Li, S.C.; Wang, S.G.; Zhang, Q.B. Quasi-three-dimensional physical model tests on a cavern complex under high in-situ stresses. Int. J. Rock Mech. Min. Sci. 2011, 48, 199–209. [Google Scholar]
  34. Chen, A.M.; Gu, J.C.; Shen, J.; Meiji, Q.; Gu, L.; Lu, Z. Application study on the geomechanical model experiment techniques. Chin. J. Rock Mech. Eng. 2004, 22, 3785–3789. [Google Scholar]
  35. Li, Z.K.; Lu, D.R.; Zhong, S.Y.; Xi, J.H.; Sun, J.S. Development and application of new technology for 3D geomechanics model test of large underground houses. Chin. J. Rock Mech. Eng. 2003, 22, 1430–1436. [Google Scholar]
  36. Rong, F.; Sun, Y.Q.; Wang, H.X. Influence factor analysis on the design of URL general structure. World Nuclear Geosci. 2017, 34, 174–179. [Google Scholar]
  37. Zhang, Q.Y.; Liu, C.C.; Duan, K.; Zhang, Z.J.; Xiang, W. True Three-Dimensional Geomechanical Model Tests for Stability Analysis of Surrounding Rock During the Excavation of a Deep Underground Laboratory. Rock Mech. Rock Eng. 2019. [Google Scholar] [CrossRef]
  38. Zhang, Q.Y.; Li, S.C.; Guo, X.H.; Li, Y.; Wang, H.P. Research and development of new typed cementitious geotechnical similar material for iron crystal sand and its application. Rock Soil Mech. 2008, 29, 2126–2130. [Google Scholar]
  39. Chen, X.G.; Zhang, Q.Y.; Li, S.C. A servo controlled gradient loading triaxial model test system for deep-buried cavern. Rev. Sci. Instrum. 2015, 86, 105114. [Google Scholar] [CrossRef]
  40. Wang, H.P.; Li, S.C.; Zheng, X.F.; Zhu, W.S. Research progress of geomechanical model test with new technology and its engineering application. Chin. J. Rock Mech. Eng. 2009, 28, 2765. [Google Scholar]
  41. Zhao, X.G.; Wang, J.; Cai, M.; Ma, L.K.; Zhong, Z.H.; Wang, X.Y.; Su, R.; Chen, W.M.; Zhao, H.G.; Chen, Q.C.; et al. In-situ stress measurements and regional stress field assessment of the Beishan area, China. Eng. Geol. 2013, 163, 26–40. [Google Scholar] [CrossRef]
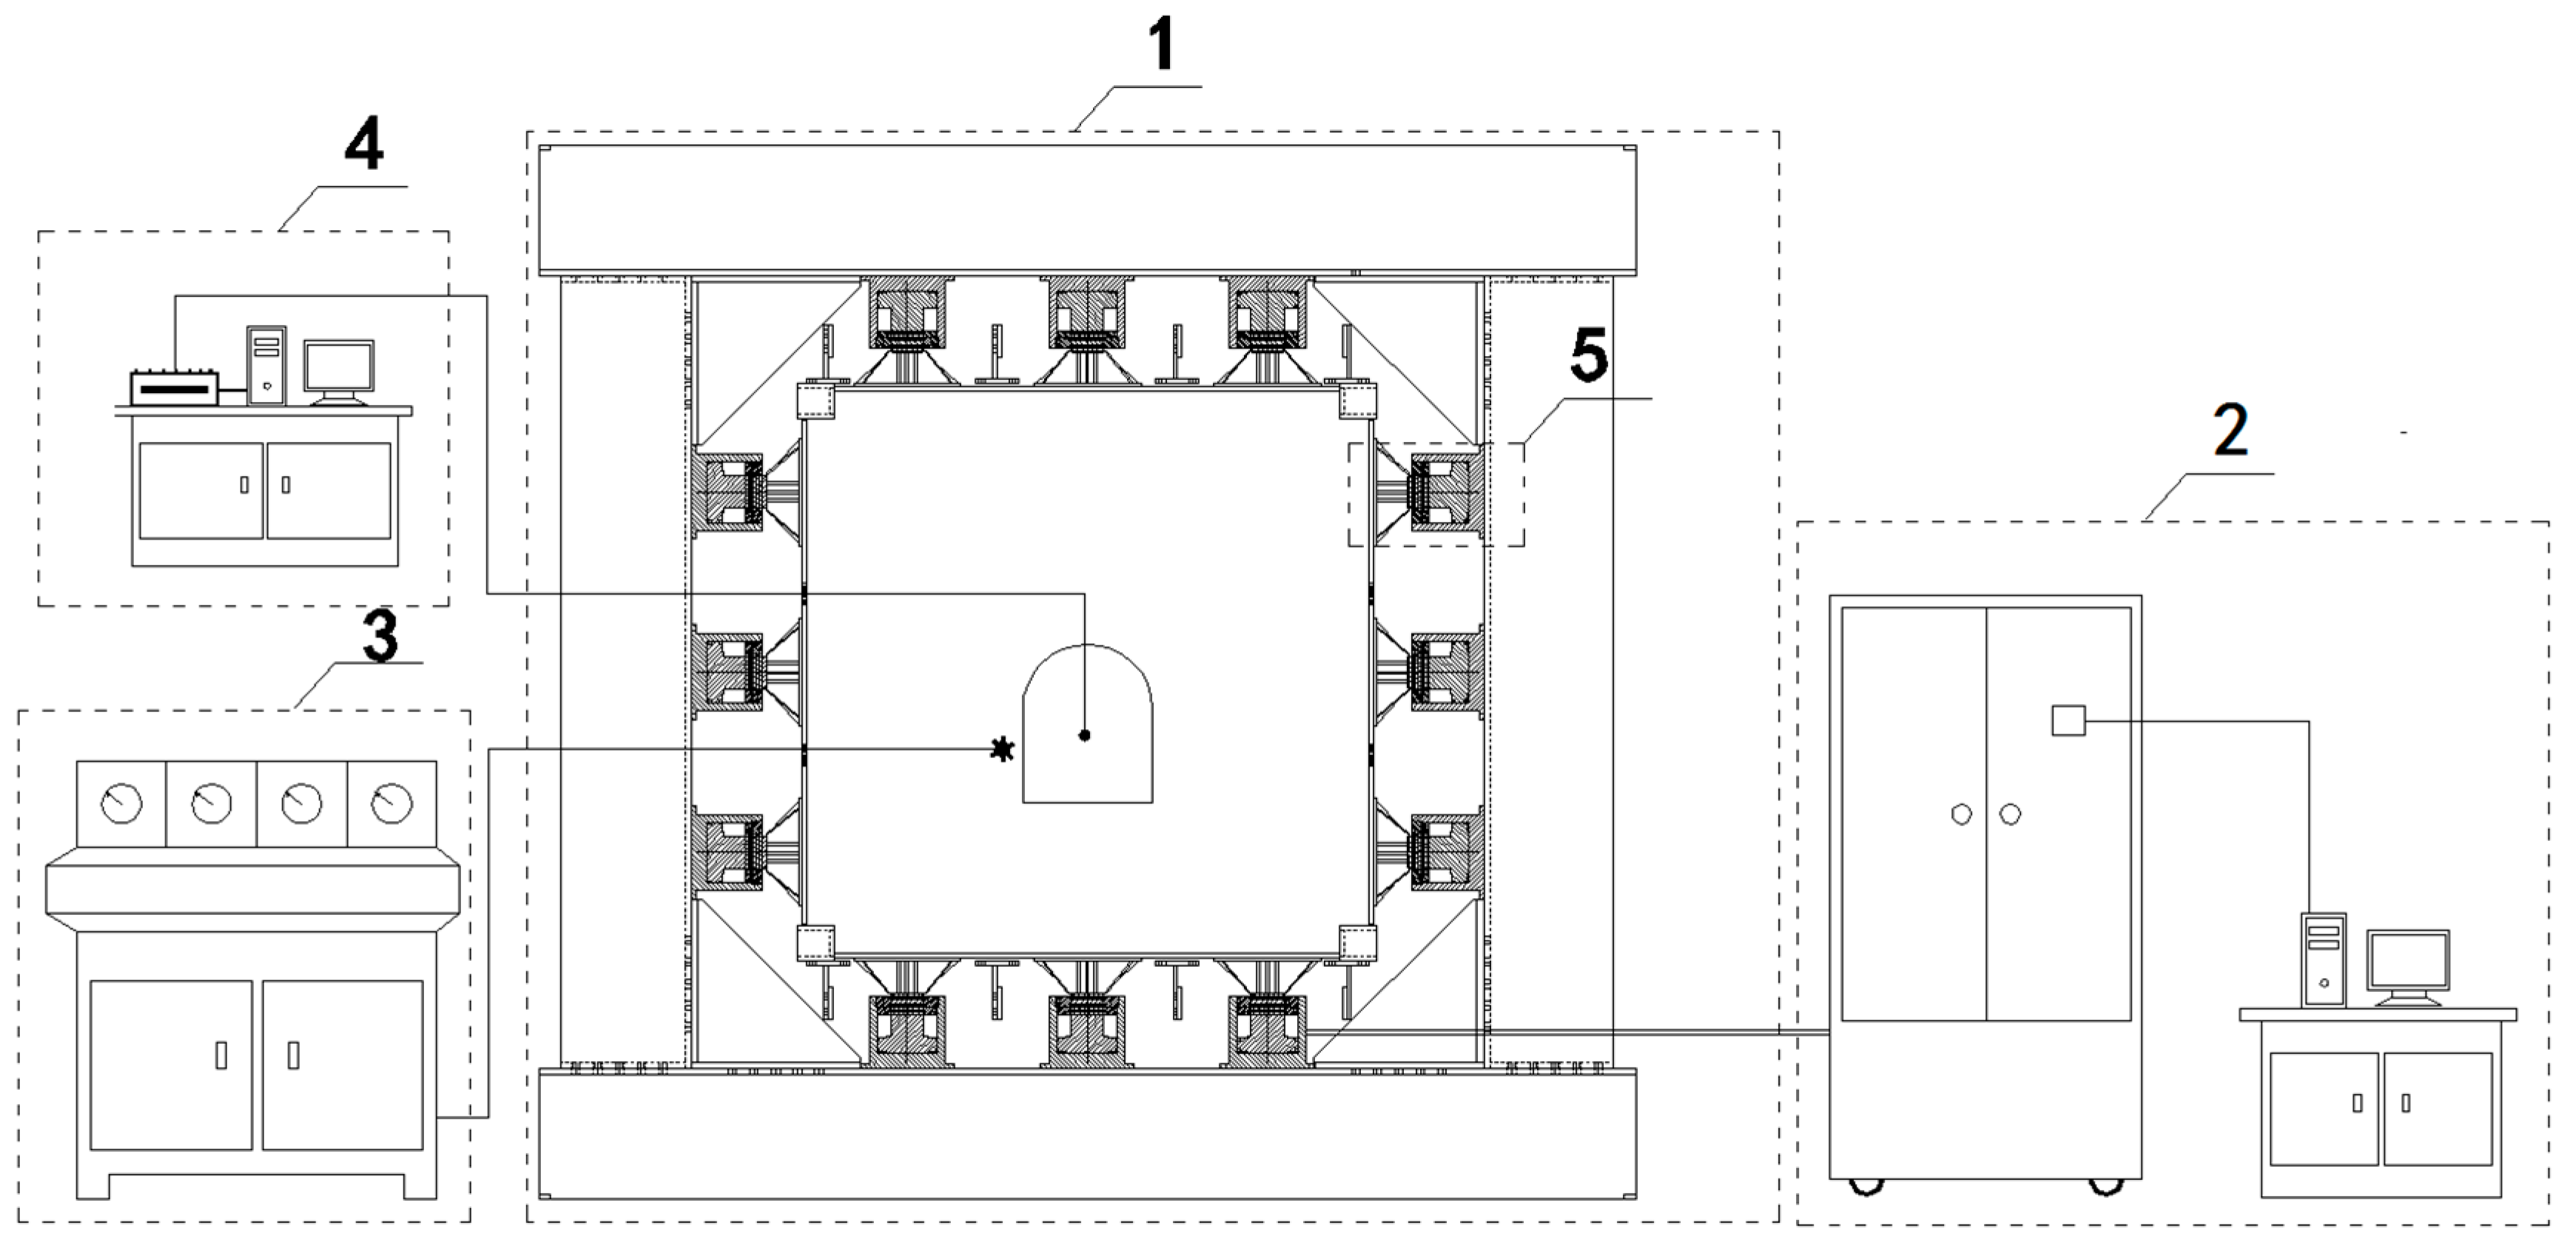
Figure 1. Plane design diagram of the overall model test system. 1: Combined bench counterforce device; 2: intelligent hydraulic loading/unloading control system; 3: automatic model displacement test system; 4: high-definition multi-probe peeping system; and 5: ultrahigh-pressure true triaxial non-uniform loading/unloading device.
Energies 13 00358 g001
Figure 2. Three-dimensional design diagram of the combined bench counterforce device. 1: Box-type top beam; 2: box-type left upright posts; 3: box-type front counterforce wall; 4: box-type bottom beam; 5: box-type rear counterforce wall; and 6: box-type left upright posts.
Energies 13 00358 g002
Figure 3. Three-dimensional design diagram of the true three-dimensional non-uniform loading/unloading device. 1: Model loading steel plate; 2: steel corner fitting; 3: force transfer loading module bottom plate; 4: hydraulic jack; 5: force transfer loading module top plate; and 6: force transfer reinforcing rib plates.
Energies 13 00358 g003
Figure 4. Design diagram of oil way of the system. 1: Personal computer (PC) monitoring system; 2: programmable logic controller (PLC) hydraulic numerical control system; 3: ultrahigh pressure execution system; 4: network cable; 5: cable; 6: oil tank; 7: oil filter; 8: step motor; 9: oil pump; 10: step overflow valve; 11: pressure sensor; 12: O-shaped three-position four-way electromagnetic reversing valve; 13: electromagnetic ball valve pressure retaining valve; 14: collecting valve; and 15: programmable controller.
Energies 13 00358 g004
Figure 5. Design diagram of circuits of the system. 1: Programmable controller; 2: human–machine interface (HMI); 3: sensor system; 4: variable frequency oil pump drive system; 5: step overflow valve drive system; and 6: electromagnetic valve drive system.
Energies 13 00358 g005
Figure 6. Workflow diagram of an automatic model displacement test system.
Energies 13 00358 g006
Figure 7. Picture of the model test system after assembly. 1: Combined bench counterforce device; 2: ultrahigh-pressure true 3D non-uniform loading/unloading device; 3: intelligent hydraulic loading/unloading control system; 4: automatic model displacement test system; and 5: high-definition multi-probe peeping system.
Energies 13 00358 g007
Figure 8. Model test design drawing (the red arrow is the excavation direction, and the number is the excavation sequence). (a) Schematic diagram of caverns layout in model test; (b) Schematic diagram of cavern section size in model test.
Energies 13 00358 g008
Figure 9. Photos of the construction of the physical model. (a) The mixed material is poured evenly into the test system; (b) the material is spread evenly; (c) the material is compacted by the loading system; (d) materials are air-dried with electric fans; (e) the optical displacement sensor is embedded; and (f) the strain sensors are embedded.
Energies 13 00358 g009
Figure 10. Schematic diagram of non-uniform gradient distribution of initial ground stress of the model. (a) Direction of large principal stress and (b) direction of small principal stress.
Energies 13 00358 g010
Figure 11. Working photo of the micro tunnel boring machine (TBM) excavation device.
Energies 13 00358 g011
Figure 12. Displacement curve of different parts in terms of (a) parking lot waist; (b) parking lot vault; (c) main roadway waist; and (d) main roadway vault.
Energies 13 00358 g012
Figure 13. Pictures of excavation completion and overloading process of different parts in terms of (a) parking lot after excavation; (b) intersection of parking lot and main roadway after excavation; (c) intersection under the overloading of 1.6 P; (d) intersection under the overloading of 2.0 P; (e) intersection under the overloading of 2.2 P; and (f) intersection under the overloading of 2.4 P.
Energies 13 00358 g013
Figure 14. Grid graph of a 3D numerical model.
Energies 13 00358 g014
Figure 15. The displacement curves of the experimental results compared with the numerical simulation in different parts. (a) The main roadway waist; (b) the main roadway vault; (c) the parking lot waist; and (d) the parking lot vault.
Energies 13 00358 g015