1. Introduction
Currently, the economy and consumers expect a reduction of energy consumption of electric motors and equipment. This is due to the desire to both limit the operating costs of electrical machines and prevent climate change by reducing gas emissions that occur in the electricity production process. This trend is particularly visible in the case of new designs of induction motors, but in general, it should be extended to all types of electric motors (including synchronous reluctance and permanent magnet motors) [
1,
2,
3,
4,
5]. Expectations for reducing energy consumption are particularly important for low-power electric motors with relatively small geometric dimensions. Fractional kilowatt motors have an efficiency in range of 60–80% only, which significantly differs from the efficiency of higher-power motors. However, their widespread use, e.g., in household appliances, makes it worth dealing with the problem of improving their efficiency. That is why it is particularly important to include, in the design process, all the important reasons affecting efficiency reduction. Among them, the shaping process, carried out by technological processes such as punching, laser or water jet cutting, or spark erosion, plays an important role. Another one is the stator core assembling process. In electric motor mass production, the unit cost of technological operations as well as the time of their implementation is important. Two cutting technologies are attractive from this point of view: punching and laser cutting. Unfortunately, both degrade material properties in the area close to the cut edge. The core assembly technologies used also have an impact on the final motor efficiency. Commonly used assembly technologies such as clamping, welding and gluing, worsen the material characteristics of the finished core, affecting the core loss, but mainly on the current consumed by the electric motor. However, their impact is less important than those resulting from the cutting process. Studies on the material properties of specimens subjected to punching and laser cutting have been carried out by various scientists for many years. In the literature, we find many valuable papers presenting results of the observed changes [
6,
7,
8,
9]. Modeling of ferromagnetic having areas with degraded properties is the next area of research. In the literature, we find a description of many algorithms that allow for determining the local properties of ferromagnetic materials (based on macroscopic measurements) and their implementation in FEM models [
10,
11,
12,
13,
14].
An important goal of the work carried out by the authors is to show that for electric motors with relatively small geometrical dimensions, it is necessary to take into account the impact of the technological process on the change in the properties of the magnetic material used in the motor core. Conclusions resulting from the research analysis allow designers to introduce constructional changes, compensating the negative impact of technological processes on electric motor efficiency. The authors present the results of new studies which are a continuation and extension of the research conducted to date in this field.
The paper contains several chapters: in the first part, the reason for undertaking research is explained; the second part describes the measurement method and system in which the necessary measurements were carried out; the third part contains the concept of the zone model, allowing to include the damaged area in the FEM motor model; the fourth part describes the FEM motor model, while in the fifth part, the results of numerical calculations are presented. The whole work is discussed and summarized in the last two sections.
2. The Measuring System and the Measurement Method
Measurements of the magnetic materials properties are carried out in accordance with standards, describing both the measuring system and the measurement method. The most popular measuring systems are Epstein frame and Single Sheet (Strip) Tester. For these systems, international standards include both a structure description and measurement methods [
15,
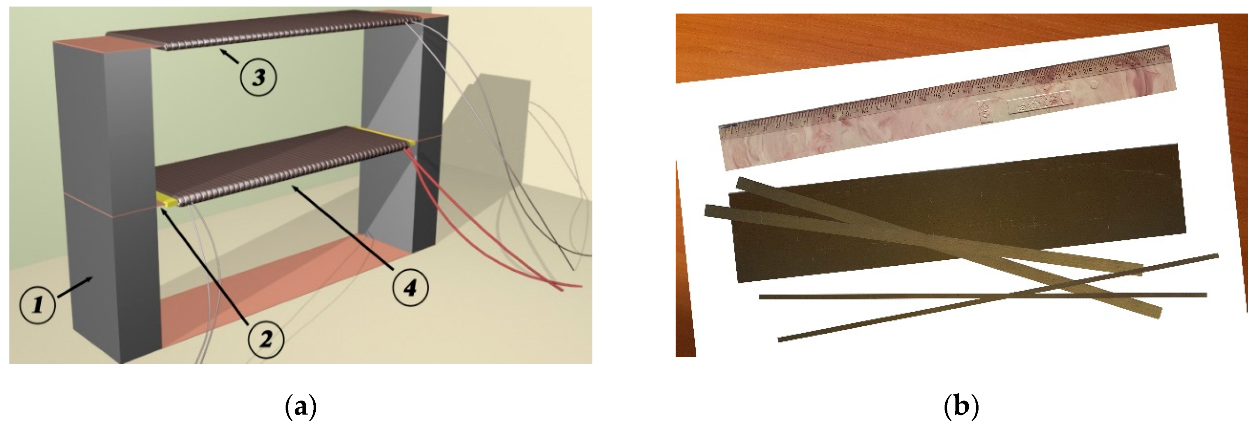
16]. In many cases related to the implementation of engineering measurements, there is a need to use other non-standard solutions and measurement methods. The lack of correlation with standards applies primarily to the dimensions of measuring systems. They are different (generally smaller) than those defined in international standards. When testing the properties of magnetic materials subjected to a cutting process, two types of measuring systems are commonly used: the first using toroidal cores and the second using rectangular-shaped specimens. The authors of this paper used such a non-standard SST solution, which is described in detail in the literature [
17]. The measuring system used can be adapted to the geometric sizes of the measured samples (within specified limits) and consists of the separate elements shown in
Figure 1. Using this SST system, measurements of
B-H curves and specific iron loss for M600-50A material (the motors analyzed later in the paper have a core made of this material) were carried out. The measurements were executed for three cases. The first one concerned measurements conducted on a rectangular specimen, previously subjected to heat treatment to minimize the change in material properties resulting from specimen cutting. Its geometric dimensions are 60 mm width, 300 mm length, and 0.5 mm thickness. The second one was executed for four 8 mm wide strips, in which a part of the material was damaged by the cutting process. The third case is eight 4 mm-wide strips, for which only degraded material has been assumed. Measurements were performed for many flux density values, maintaining the sinusoidal shape of the magnetic flux waveform. The voltage induced in the secondary winding and the current in the magnetizing winding were recorded.
Using the induced voltage waveforms in the secondary winding recorded during measurements, the maximum value of flux density in the tested laminations can be calculated according to the relationship (1),
where
N2,
Aspec,
u2 are the number of secondary winding turns, the lamination cross-section and the instantaneous value of the voltage induced in the secondary winding, respectively.
An evaluation of maximum magnetic field strength corresponding to the maximum flux density in the investigated ferromagnetic strip was conducted on the basis of the recorded magnetizing current waveform. In accordance with Ampere’s law, using Equation (2), in which all magnetic voltage drops (measured or obtained from SST FEM model) were taken into account, the maximum magnetic field strength was calculated.
where
imag is the magnetizing current,
N1 is the turn number of magnetizing winding,
Hmax,
Hyoke,
HFerrite are the magnetic field strength in the investigated lamination, yoke strip and ferrite, respectively, and
lspec,
lyoke,
lFerrite are the corresponding path lengths; ∆
Uair is the magnetic voltage drop across all air gaps calculated in the FEM model of the SST system.
The total iron loss measured in the system are defined by the relationship (3)
where
Pt is the sum of the iron losses (in the specimen and yokes),
T is the period.
Iron loss in ferrites was omitted due to the significant difference between amplitudes of the flux density in the ferrite in the specimen tested and yokes of the SST system, as well as in specific iron loss of the ferrite and the magnetic strips used. Finally, the
pspec specific iron loss in the investigated lamination was computed according to (4)
where
k is the yoke number,
Pyoke(
Byoke) is the yoke iron losses (for a specified
Byoke flux density) and
mspec is the specimen mass. The
Byoke flux density was calculated according to (1) using the induced voltage waveform (in the secondary winding for upper yoke) and the upper yoke cross-section.
3. The Method for Determining the Width of a Damaged Material Zone
Determination of the width of the damaged material zone is a challenge for many authors. In the available literature, this width is evaluated using specific assumptions or estimated without any assumptions. The authors of this paper propose an engineering method, estimating this zone width, in other way than those previously described in the literature. For this purpose, the results of the simple measurements carried out for the undamaged material and the partly degraded material are sufficient. This method is based on the statement that in the tested specimen, there is an area of non-degraded material and a zone of damaged material having another properties; those depend on the distance from the cut edge. The proposed method assumes that the area of the material with heterogeneously degraded properties is replaced by the area with the same width and homogeneous properties. These properties (a magnetic permeability and a specific iron loss) are unknown and must be determined in the proceeding algorithm used. The division of the material into these two areas (marked as
D and
ND) is shown in
Figure 2, and the measured material characteristics of the tested specimen subjected to the punching process are shown in
Figure 3a,b.
By accepting the division of the tested specimen into two types of zones having specific geometrical sizes (marked as
D and
ND in
Figure 2), for a given
H field strength, we can write the equation of the total magnetic flux flowing through the specimen.
where Φ
t is the total magnetic flux flowing in the specimen, Φ
D is the magnetic flux in the damaged zone, Φ
ND is the magnetic flux in the non-damaged part of the specimen. This equation can be converted into following relation
where
B is the magnetic flux density (measured for given
H magnetic field strength—see
Figure 3a),
h is the specimen height,
A is the specimen width,
Bx is the average flux density in damaged region (unknown),
x is the width of damaged zone,
B1 is the flux density in non-degraded part of the specimen (for given
H magnetic field strength—see
Figure 3a).
Similarly, it is possible to write the equation of iron loss into the specimen.
where
p is specific iron loss in the specimen (measured for given
B flux density—see
Figure 3b),
px is the specific iron loss for the damaged part of the specimen (unknown),
p1 is the specific iron loss for non-degraded specimen material (measured for given
B flux density),
l is the specimen length.
In Equations (6) and (7), there is an unknown width of the damaged material zone, while its estimation is a key point of the rapid engineering algorithm proposed by the authors. The algorithm uses the curve B = f(d) for H = const, where B is the average flux density in the specimen tested, and d is the width of the strip. The range of changes in a specimen width, existing in mentioned relation, should include:
specimens in which the impact of the damaged material zones is small (it would be the best to have a thermally treated strips, in which the material properties have been restored),
specimens in which the influence of damaged material zones is visible,
specimens which practically have no undamaged material.
In practice, this means that the d size should be in the range from 100 mm to several mm (according to our knowledge, the optimal have strips width is of 3–5 mm). The authors of this paper investigated 60-mm wide strips (subjected to heat treatment), 8 mm-wide strips where the impact of degraded areas is visible, and a 4 mm-wide strip for which only degraded material exists (this assumption should be verified by the estimated width of the damaged zone).
As a result of the measurements executed for the given
H value (see
Figure 3a), the magnetic flux densities were read:
B1 for a 60 mm wide sample,
B for a 8 mm wide sample, and
Br for a 4 mm wide strip. The measurements were carried out for several preset
H values (it is the best to choose such magnetic field strength for which the
B1-
B difference is the largest). Using Formula (6), it became possible to determine the width of the area of damaged material. Similar considerations can be made using Equation (7).
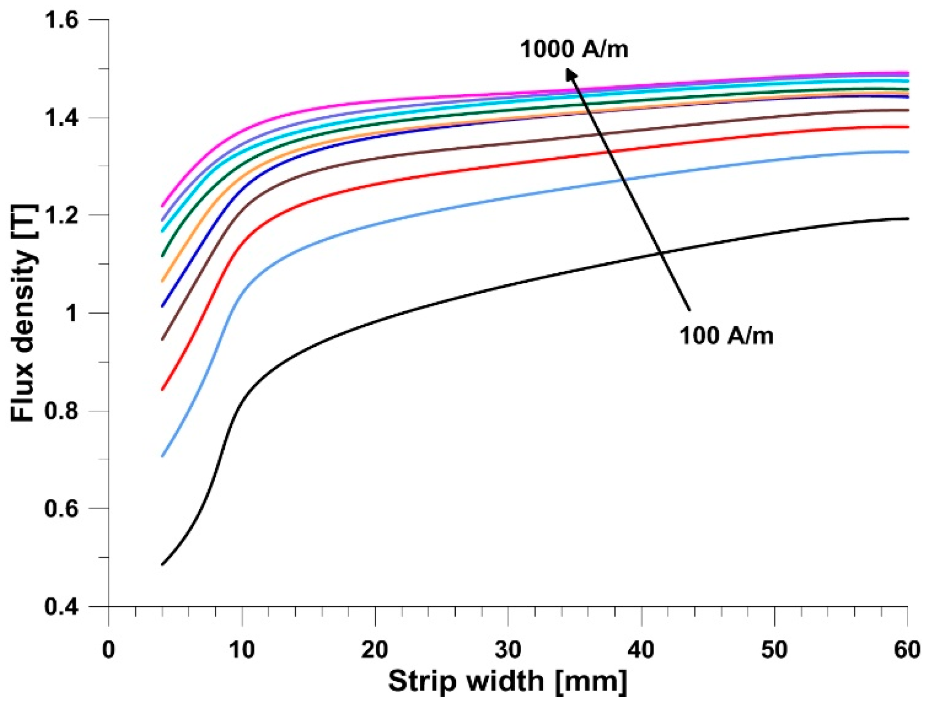
The lack of an appropriate number of strips with various widths meant that the authors decided to use the data available in the literature. For a material with similar magnetic properties, the
B = f (
d) curves, were determined [
18]—see
Figure 4. Their analysis leads to the conclusion that a very visible impact of damaged areas on the properties of the tested specimen, occurs for widths smaller than 10–15 mm. This confirms the initial authors’ thesis regarding the need to take into account the punching process influence on the operating parameters of an electric motors with relatively small geometric dimensions of the core.
4. The FEM Models and Numerical Simulations
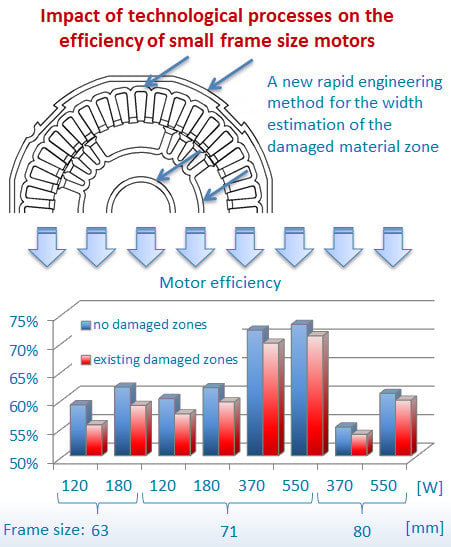
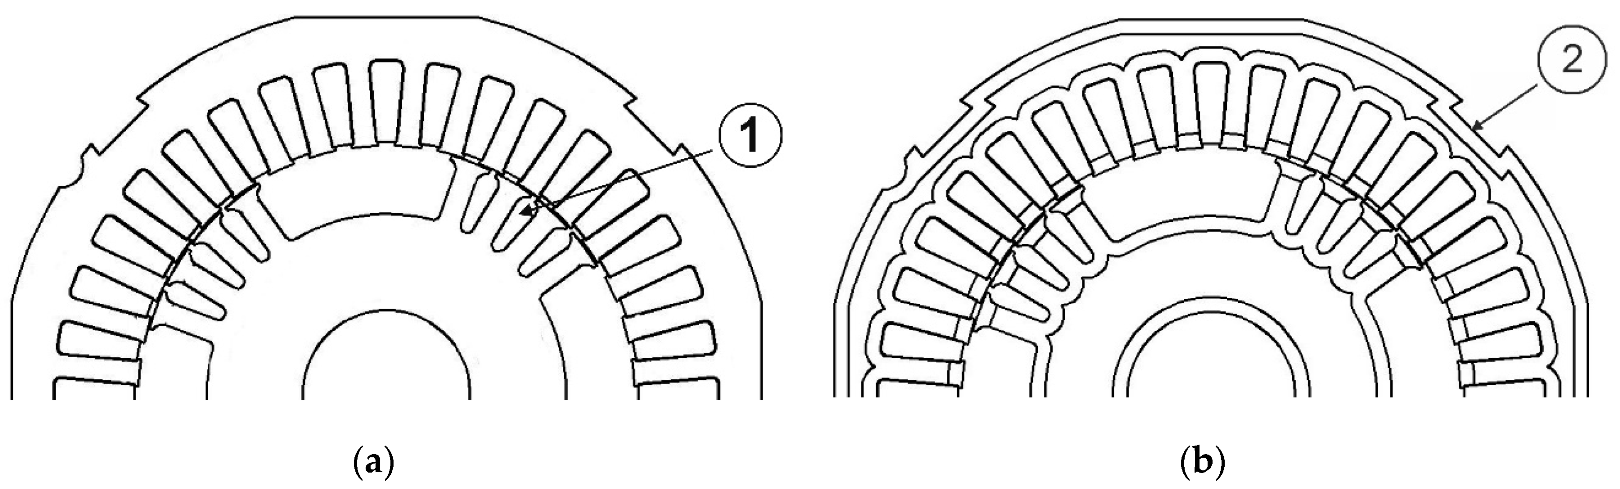
The objects of the research were three-phase, four-pole, 400 V/50 Hz, line-start SynchRel motors with a nominal power below 750 W, made in various frame sizes. The geometry of the mass-produced SynchRel motor is shown in
Figure 5a. The rotor slots visible in this figure are part of the rotor cage enabling motor start-up, which has been removed in the conducted tests. For the motors tested, Joule losses in the stator winding predominate over other motor loss components. For this reason, a small change in the current consumed, caused e.g., by a change in the core material properties, affects the efficiency of the motor.
Estimation of consumed current was carried out using 2D-FEM models, whose geometry is presented in
Figure 5. The first of them (
Figure 5a) does not take into account the negative cutting effects (in the form of an area having different material properties), while the second (
Figure 5b) has both areas: non-damaged and damaged materials. The authors decided to use both the measurement results and the method described above to determine the width of the damaged material zone as well as its equivalent material properties. Modeling of a damaged material zone as a homogeneous area with specified equivalent properties and width is acceptable in the light of the work of other authors. Built numerical models had a properly selected FEM mesh, compacted in the air-gap area. Particular attention was paid to the air-gap mesh, where three layers of elements were generated, enabling the rotor movement. The FEM mesh of each model contained 180 thousand first order elements. A proper solver enabling the motor start was used (simulation was conducted under 50 Hz sinusoidal voltage supply), as well as free rotor rotation with relation to the magnetic field generated by the stator winding. In addition, at the same time, the solver used a coupled circuit model for stator windings, where the resistance and reactance of the windings were calculated numerically. Prepared FEM models allowed to determine both the consumed current as well as iron losses in the stator core. These data, supplemented with mechanical losses indicated by the manufacturer, were the basis for determining the motors efficiency and demonstrating the negative impact of the punching process on the motors efficiency.
The tests were carried out for four-pole motors with frame size (in mm): 63 (120 W and 180 W motors), 71 (120 W, 180, 370 and 550 W motors), 80 (370 W and 550 W motors).
5. The Calculation Results
5.1. Determination of the Width of the Material Zone Damaged by Cutting Operations
The authors executed a series of measurements for investigated strips with dimensions described in
Section 3. The results are presented in
Table 1.
In further analyzes and calculations, the average x width of the damaged area was assumed to be equal to 2.3 mm. For this area width, material characteristics were determined using Equations (6) and (7), and then used in the FEM models.
The determination of the material characteristics turned out to be necessary because the estimated double width of the damaged zone was slightly larger than the width of the tested 4 mm strip.
5.2. Determination of the SynchRel Motor Efficiency
The following power balance can be written for the SychRel motors tested:
where
Pin is the power consumed by the motor,
Pout is the power output,
Psc is the stator iron loss,
Psw is the Joule loss in stator winding,
Pm is the mechanical loss.
The motor efficiency is therefore defined in a known manner:
The iron loss in the stator core was determined based on the results of numerical simulation, adding up the product of the specific iron loss and the mass of the elemental material of the area in the FEM model. In Equation (10),
Psc is the stator core total loss,
mi is the mass of
i-th elemental core region,
p(
Bi) is the specific iron loss at
Bi maximum flux density determined for the
i-th elemental core region. The
Bi value was determined by postprocessor, where the maximum value (at elemental area) was sought during the period (20 ms for the analyzed cases). When determining iron loss in the stator core, rotational magnetization and the resulting core loss increase were not taken into account.
For each case examined, iron losses in the stator core and in the stator winding were determined twice: the first time for the core without damaged zones, the second time for the core with damaged material zones. The data necessary to determine the efficiency calculated at the nominal torque, along with the designated efficiency are presented in
Table 2,
Table 3 and
Table 4. The mechanical loss, used when calculating efficiency, have been made available by the manufacturer:
frame size 63 mm—12 W for 120 W motor, 16 W for 180 W,
frame size 71 mm—15 W for 120 W motor, 20 W for 180 W motor, 32 W for 370 W motor, 40 W for 550 W motor,
frame size 80 mm—41 W for 370 W motor, 51 W for 550 W motor.
6. Discussion
In the presented paper, there are several threads that require discussion, as well as comparisons with the results obtained by other researchers dealing with the same problem. The first thread concerns the selection of the zone model containing material degraded as a result of the punching process. The available literature describes two zone models: the first with homogeneous material properties, and the second with heterogeneous material properties depending on the distance from the cut edge. In the model with homogeneous properties, equivalent material characteristics
B = f (
H) and
p = f (
B) are sought. These material characteristics give the same result in magnetic flux and iron loss for the entire area, as for the non-homogeneous area described by the family of material characteristics. The model of the zone having homogeneous material properties has been proposed by the authors for years [
6]. This zone model is useful in a FEM models, where it is not possible to interfere in the parameters describing a single FEM mesh cell. In the model with heterogeneous material properties, an analytical relationship is sought, which describes changes in properties as a function of distance from the cut edge. For example, we can indicate Bali and Muetze studies [
10], where the analytical dependence on degradation profile is assumed. This profile determines material magnetic properties. In the FEM model built by Bali and Muetze, the entire degraded area was divided into several sub-areas with fixed properties. In [
11], we found a zone model containing heterogeneous material, along with interference in the FEM mesh model parameters. In this case, the authors had the opportunity to define the parameters of individual FEM triangular mesh elements and change their properties according to the analytical dependence. The problem these researchers faced was to find an analytical relationship between specific iron loss and the degree of material degradation—a topic that requires further study.
Another problem is the estimation method of the degraded material zone width. The authors of this paper, in previously published papers, proposed the estimation method of this width, adopting specific assumptions. This method used both
B = f (
H) and
p = f (
B) curves, measured for a specimen without degraded material zones and a specimen containing such a zone. In the presented paper, the authors propose a new rapid engineering method that exploits the results of a smaller test number. The obtained result is in line with the results of other researchers, estimating this size using completely different methods and tools. We can indicate works where the zone width is estimated up to 3.5 mm [
18,
19], in range 1.5–2.5 mm [
20] or up to 3 mm [
21].
The authors face another challenge, consisting in developing a similar rapid engineering algorithm for zone width estimation, useful for laser cutting technology. In this case, there are completely different reasons for the degradation of the material, and the method proposed in this paper should be developed and tested.
7. Conclusions
The authors presented the results of work on determining the impact of the punching process on the efficiency of SynchRel motors having relatively small geometric dimensions. It should be emphasized that new, extended research results were presented, which are a continuation of earlier work carried out by the authors [
22].
A new rapid engineering method for the width estimation of the damaged material zone was presented, and the obtained result was compared with the results of other researchers, obtaining a high convergence. The selection of this zone model (containing homogeneous material with equivalent properties) was discussed, indicating the equivalence of results obtained from the model used and models with heterogeneous material properties. Obviously, the local magnetic flux or iron loss will vary being dependent on the model used. However, macroscopic results, e.g., a magnetic flux density in a yoke or motor tooth cross-section, will be equivalent.
Reluctance motors with three frame sizes and specific rated powers were used in the tests. Unfortunately, some motors with the same nominal power and different frame sizes had various stator windings, which made it impossible to generalize the results obtained. The negative impact of the punching process on these motor efficiencies was demonstrated. The resulting reduction in efficiency depends on the motor frame size. The smaller the frame size, the greater the efficiency reduction. For example, for 63 mm frame size it was 3.5–4%, while for 80 mm frame size, the reduction was about 1%. It should therefore be expected that the designers of larger frame size motors may ignore the impact of punching on motor efficiency. However, this does not mean that local iron loss or Joule loss in the stator winding will not significantly increase. Therefore, for small frame size motors, structural design changes should be taken to balance the negative effect in the form of reduced motor efficiency.


