Article

Analysis of Climate Mitigation Technology and Finance in Relation to Multilateral Development Banks

Division of Policy Research, Green Technology Center, Seoul 04554, Korea
*
Author to whom correspondence should be addressed.
Energies 2020, 13(2), 311; https://doi.org/10.3390/en13020311
Submission received: 11 December 2019 / Revised: 27 December 2019 / Accepted: 7 January 2020 / Published: 8 January 2020

Abstract

:
This paper looks at the current state of multilateral development banks (MDBs) for climate change measures and the funding status of those invested in mitigation technology in order to briefly review the current outcome of the technology transfer and financial support. In other words, the aim of this study is to collect and analyze information about the current status of total investment in the field of technology for mitigating GHGs (Greenhouse Gases) from MDBs and identify implications of the status. In this study, a screening technique has been used three times to make a database for project information in the field of mitigation of climate change. So far, based on the finalized DB (Database), mitigation technology projects supported by MDBs have been investigated; based on the result, a connected analysis has been conducted between MDBs, mitigation technology, and countries. According to the derived current status, project support in renewable energy and energy demand areas turned out to be the highest at 75% of the entire mitigation technology. Rather than the renewable energy and energy demand areas where climate technology projects have frequently been performed throughout the world, it was confirmed that long-term climate technology projects for GHG fixation were being performed. According to the results of comparison and analysis of countries with high GHG emissions and their centrality, centrality turned out to be high in the field of GHG fixation in China, the country with the highest GHG emissions. This seems to indicate that countries emitting a substantial amount of GHGs will invest more on projects in the field of GHG fixation as well as on projects on renewable energy. Thus, this study is expected to contribute to understanding the trends of climate technology projects for coping with climate change and using them in establishing future policies on climate technology. In addition, it is expected to be used as a reference for countries with insufficient investment in climate technology despite the high Climate Risk Index (CRI).

1. Introduction

As a global issue, climate change has led to the United Nations Framework Convention on Climate Change (UNFCCC) through the agreement of international society. The post-2020 framework, which emerged through the Paris Agreement, focuses on the financing, technology development and transfer, and capacity-building for the purpose of mitigating and adapting to GHGs. Among these, two important measures for responding to climate change are the technical mechanisms established for the development and transfer of climate technology between the parties under the UNFCCC and the financial mechanisms established based on the importance of finance. In the eighth edition of the Joint Report on Multilateral Development Banks’ Climate Finance (2019), the multilateral development banks (MDBs) announced the results of total climate finance, adaptation finance, and mitigation finance. The tracking methodology of MDB climate finance is based on the harmonized principles and jointly agreed methodologies. In this publication, the term “MDB climate finance” refers to the amounts committed by MDBs to finance climate change mitigation and adaptation activities in the development projects they undertake in developing economies and emerging economies in transition [1]. Overseas Development Institute (ODI) created Climate Funds Update, an independent website providing information and data on the growing number of multilateral climate finance initiatives designed to help developing countries address the challenges of climate change. They first seek information from ⅰ. the fund website, ⅱ. official reporting to international organizations from funds and by contributor organizations, and ⅲ. documents such as press releases, key decisions taken at conferences or meetings, and information from civil society organizations [2]. As such, research on collecting and providing information on climate finance is being actively conducted. However, there is no previous research on comprehensive analysis and current status information linked with climate technology. Based on the importance of these technologies and finances, this study identifies the financial flows supported in the field of climate technology and analyzes the current state of mitigation technology to respond to climate change. There are various forms of funding to support climate technology, including Climate Fund and MDBs. Among them, this study is conducted with MDBs [3]. In other words, the aim of this study is to collect and analyze information about the current status of total investment in the field of technology for mitigating GHGs from MDBs and identify implications of the status.

2. Materials and Methods

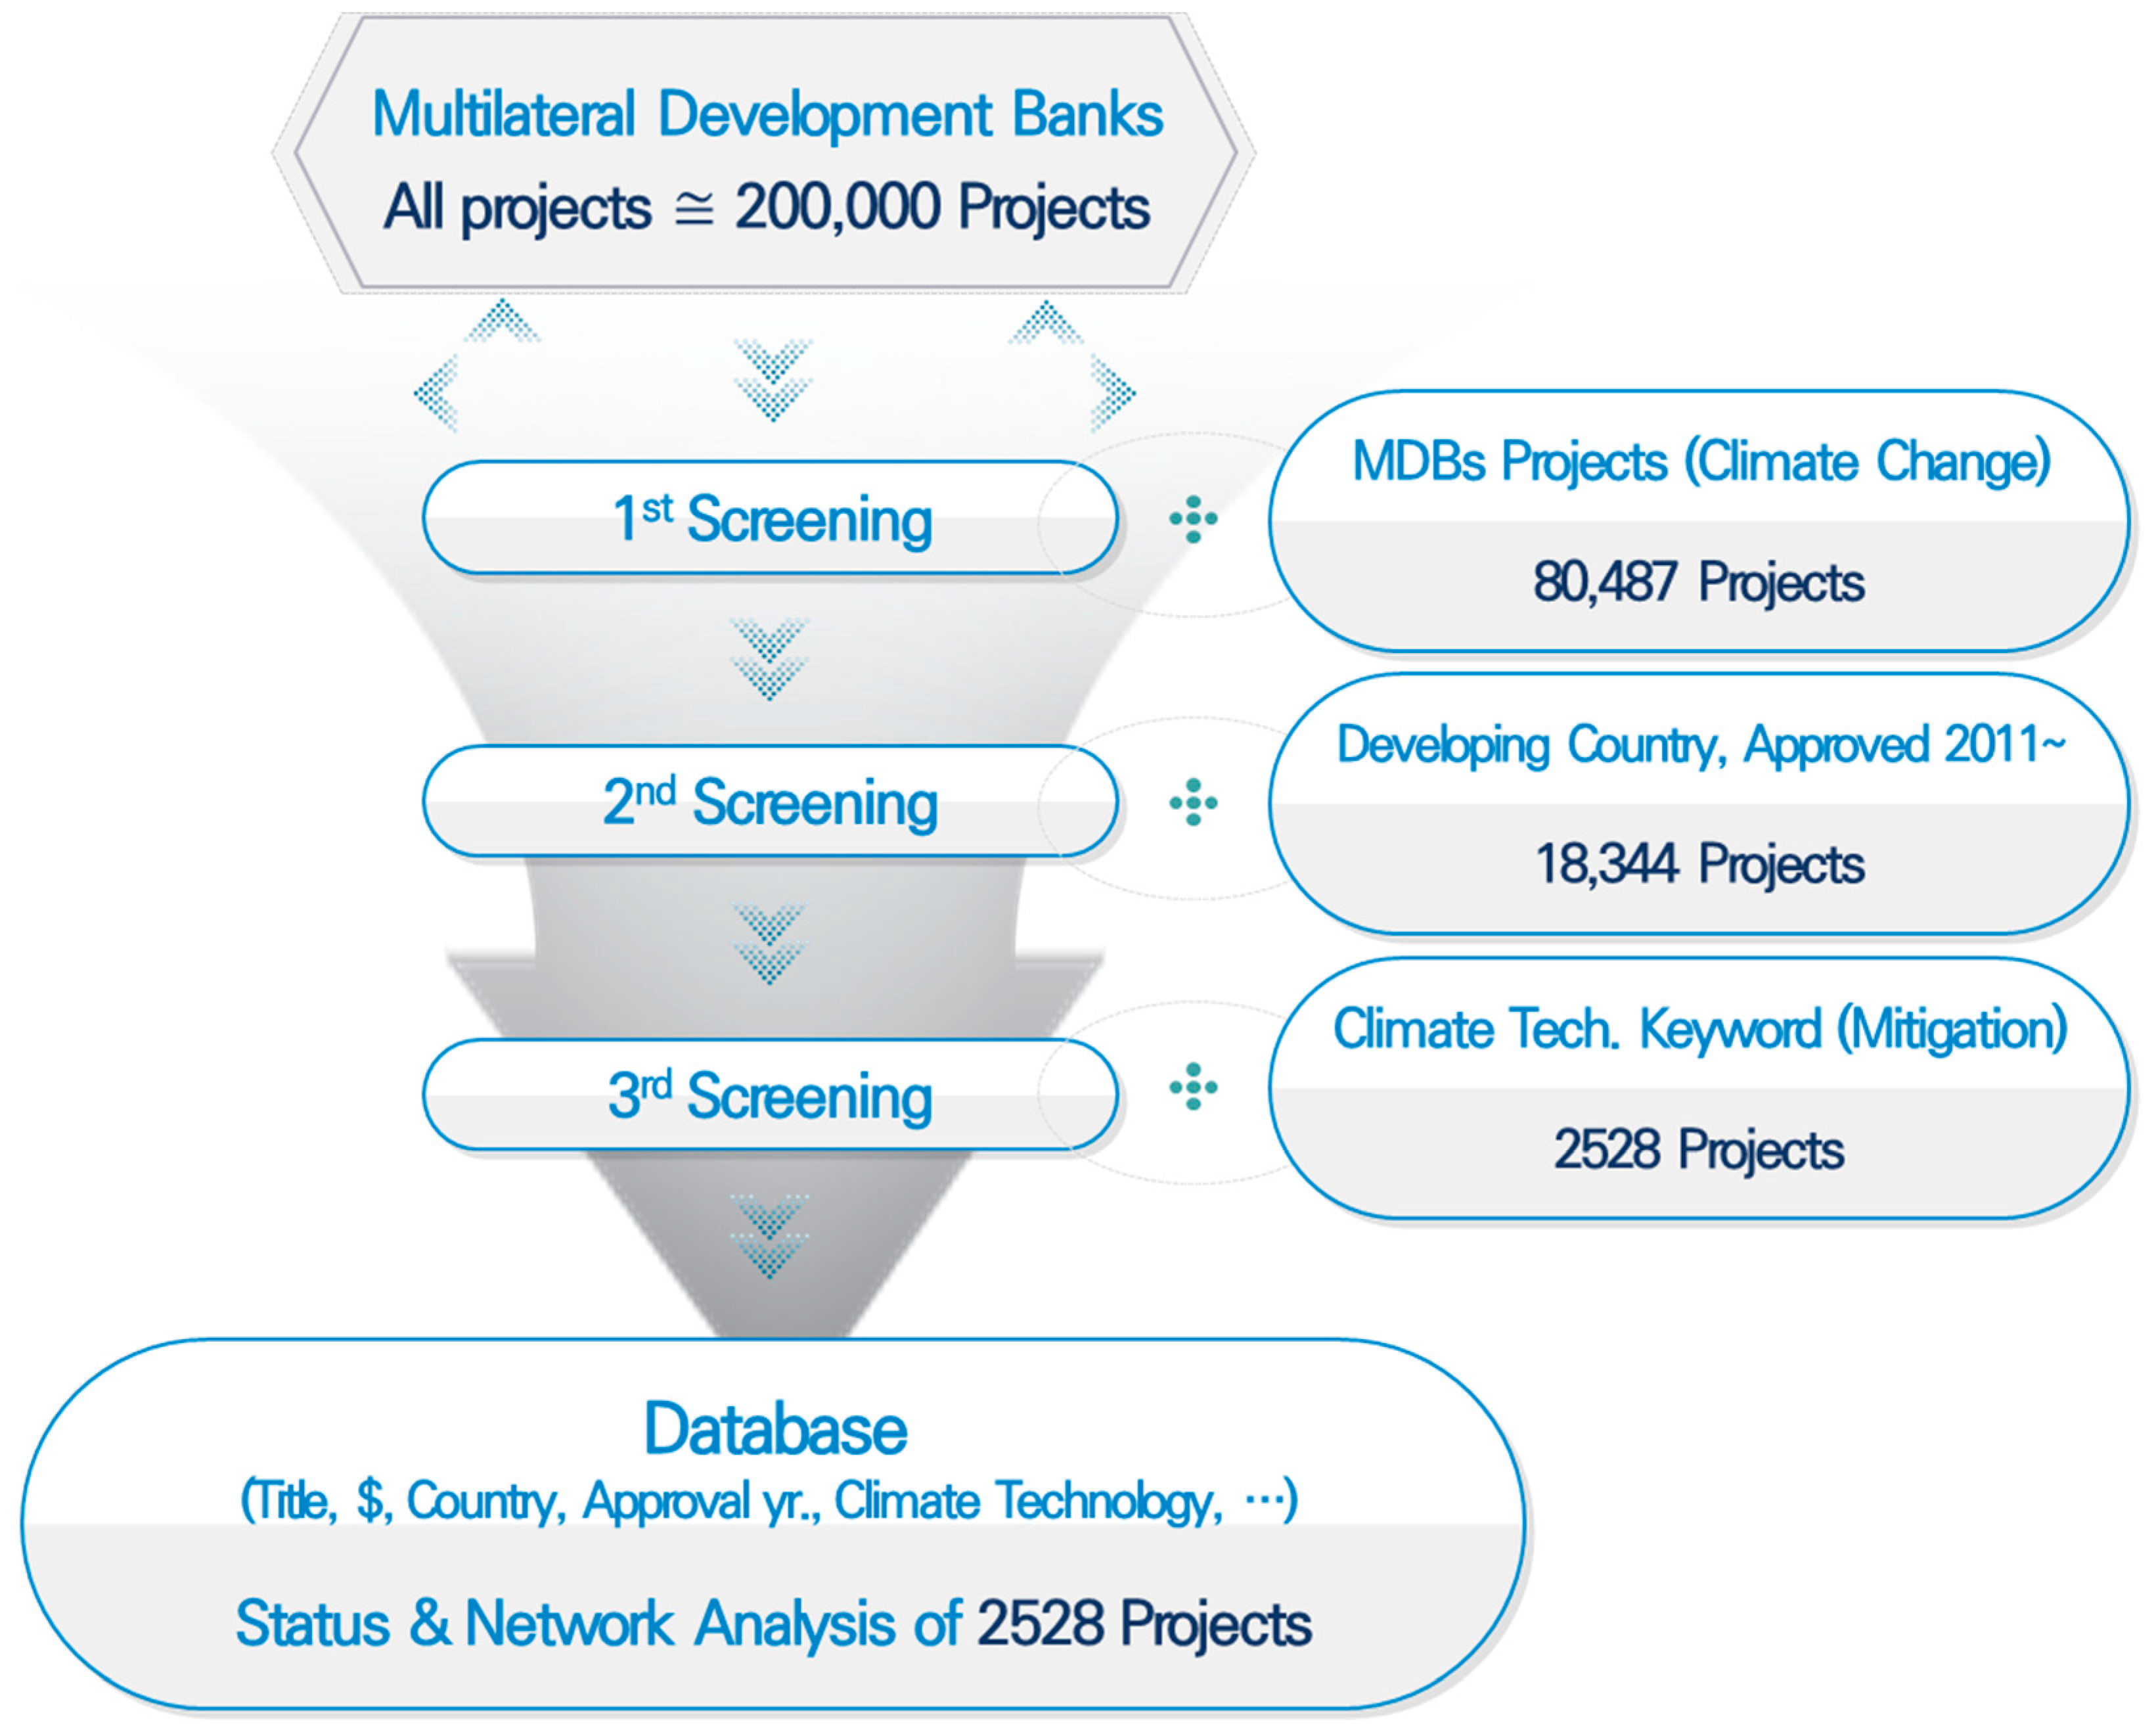
2.1. Data Collection for Climate Technology Projects of Multilateral Development Banks

In this study, climate technology-related projects supported by MDBs have been analyzed. There are many ways to cope with climate change. However, this study has selected projects for climate technologies supported by MDBs as the subject of the research and analyzed them. There are many systems for climate technology classification all over the world. According to the glossary of Intergovernmental Panel on Climate Change (IPCC) (2012), the meanings of mitigation and adaptation were suggested. The term “mitigation” was defined as “the activity of adjustment of mankind to reduce the use of resources or to increase the absorbing source of GHG.” The term “adaptation” expresses “a course for controlling the influence that has occurred or is expected to occur in the human system or nature system with climate change in order to control risks from climate change or utilize an opportunity for profit” [4]. With them, working group 3 in IPCC (2007) has classified the fields of mitigation for GHG and adaptation of climate change in regard to coping with climate change into two main categories of mitigation options and adaptation options while suggesting technology and policies for performing them. IPCC’s Fourth Assessment Report (2007) has classified the fields of GHG mitigation into seven areas [5]. UNFCCC has not specified the scope of climate technology in particular, but it provides information related to climate technology through <TT: Clear> [6]. The Ministry of State and Cabinet in Japan has classified climate technologies into four main categories of production: supply, consumption—demand, distribution—order, and other technologies [7]. Plus, CTCN (Climate Technology Center and Network) and TNA (Technology Needs Assessment) have suggested climate technology classification systems [8]. MDBs (2017) have classified climate technologies in 31 subcategories under 10 main categories [9]. Green Technology Center in Korea has established a climate technology classification system based on previous studies in Korea and abroad—comparative analyses and keyword analyses, collection of reviews from a professional advisor group, and modification/supplementation. This comprises 3 main categories, 14 mid-categories, and 45 subcategories [10]. Based on this classification system, the climate technology classification system standardization business is currently in progress through the Memorandum of Understanding (MOU) concluded with United Nations Environment Program under the legal entity the Technical University of Denmark (UNEP-DTU). Among the 14 mid-categories of climate technology in this classification system, a search for project keywords has been conducted in seven areas of mitigating technologies (Table 1).
Subjects of analysis in this study are as follows. Seven multilateral development banks were chosen as a subject except for Islamic Development Bank (IsDB), where it was not possible to obtain climate technology project documents, among eight multilateral development banks that participated in preparation for the Joint Report issued by MDBs every year. Subjects of analysis were Asian Development Bank (ADB), African Development Bank (AfDB), Asian Infrastructure Investment Bank (AIIB), European Bank for Reconstruction and Development (EBRD), European Investment Bank (EIB), Inter-American Development Bank (IDB), and World Bank (WB) [9].
In this study, a screening technique was used three times to make a database for project information in the field of mitigation of climate change. The following Figure 1 represents a schematic image of the establishment of the database for analyzing the current status in regard to MDBs and climate technology (field of mitigation).
First of all, according to the first screening process on all the completed or ongoing projects among the subjects in the analysis, there were a total of 80,487 subjects. Among them, the second screening process was conducted on projects in progress in developing countries and projects approved after 2011, and a total of 18,344 projects were filtered out. In order to enhance the reliability of screening results, a duplicated examination was conducted. A duplicated examination was directly conducted on the areas of agriculture and natural resources of Asia Development Bank (ADB), areas of agriculture and rural development of Africa Development Bank (AfDB), areas of agriculture, fisheries, and forestry of Europe Development Bank (EIB), and areas of agriculture and rural development and science and technology of Inter-America Development Bank (IDB). According to the results of the third screening process through climate technology project keywords derived from the second screening projects earlier (including the projects with high frequency when establishing the first database or the projects included in the subjects of research), a total of 2528 climate technology projects were confirmed as final subjects. Based on the documents of confirmed climate technology projects, information such as project title, country, region, support amount, approval year, period, climate technology class, support type, and beneficiary was collected [11,12,13,14,15,16,17].
While collecting relevant information, an investigation was conducted to see which climate technology projects were related to which climate technology classification system. The classification system used in this investigation is the mid-category stage of the climate technology classification system established by the Green Technology Center in 2017 [10]. According to the results from the third screening where keywords in each technology were applied and opinions of experts in each area of technology, the numbers of projects are shown in Table 2.
So far, based on the finalized DB, mitigation climate technology projects supported by MDBs have been investigated; based on the result, a connected analysis was conducted between MDBs, climate technology of mitigation, countries, and so on.

2.2. How to Analyze Networks

A social network analysis provides a new perspective on various social phenomena with methods attracting attention in the social sciences and natural science fields.
In this study, NetMiner 4.0 Semantic Network Edition software made by CYRAM Inc. (Seongnam, Korea) for Network Analysis was used to perform the network analysis for the analysis of connection among MDBs, supporting countries, and technological areas. Data showing the relationships among different forms such as technologies and countries are called two-mode data, as the connection among different forms is the only focus. In addition, centrality is defined as the number of connected relationships among adjacent nodes. Therefore, two-mode normalized degree centrality was used to analyze degree centrality of climate technology mitigating fields of MDBs and supporting countries.
In a two-mode network, the nodes within the network can only have connections with nodes in the relative mode, so the maximum possible number of connections is limited to the number of relative modes. Thus, within climate fund projects, the maximum possible number of linkages for a technology is the number of active countries, and the maximum number of linkages for a country is the number of projects in the technology sector.
Standardized connection centrality in a two-mode network can be expressed by the following equation [18,19,20]:
C D ( N i ) = C D ( N i ) n 2 ,   f o r   N i A
where C D ( N i ) : Normalized Degree Centrality of Node, N i n 2 : Number of Node of set A.

3. Results and Discussion

In this study, comprehensive supporting status was researched and analyzed in the field of climate technology mitigation of MDBs. The current status of connection among MDBs, climate technology, and supporting countries was specifically analyzed. Based on the results of establishing the DB for the identification of the current status, a comprehensive supporting status was suggested. At the same time, results of analysis of centrality of technologies and countries were suggested from the network analysis. In addition, implications were derived from the comparison and analysis of the top 100 countries for centrality–climate risk index (CRI) and the top 30 countries for centrality of climate technology–Organization for Economic Cooperation and Development (OECD) country GHG emission (as of 2016) [21]. CRI is an index suggested by Germanwatch every year, comprehensively evaluating the casualties and property damage from natural disasters occurring due to climate change and representing the rank of countries that are weak against climate change. The higher the rank, the weaker a country is against climate change [22].

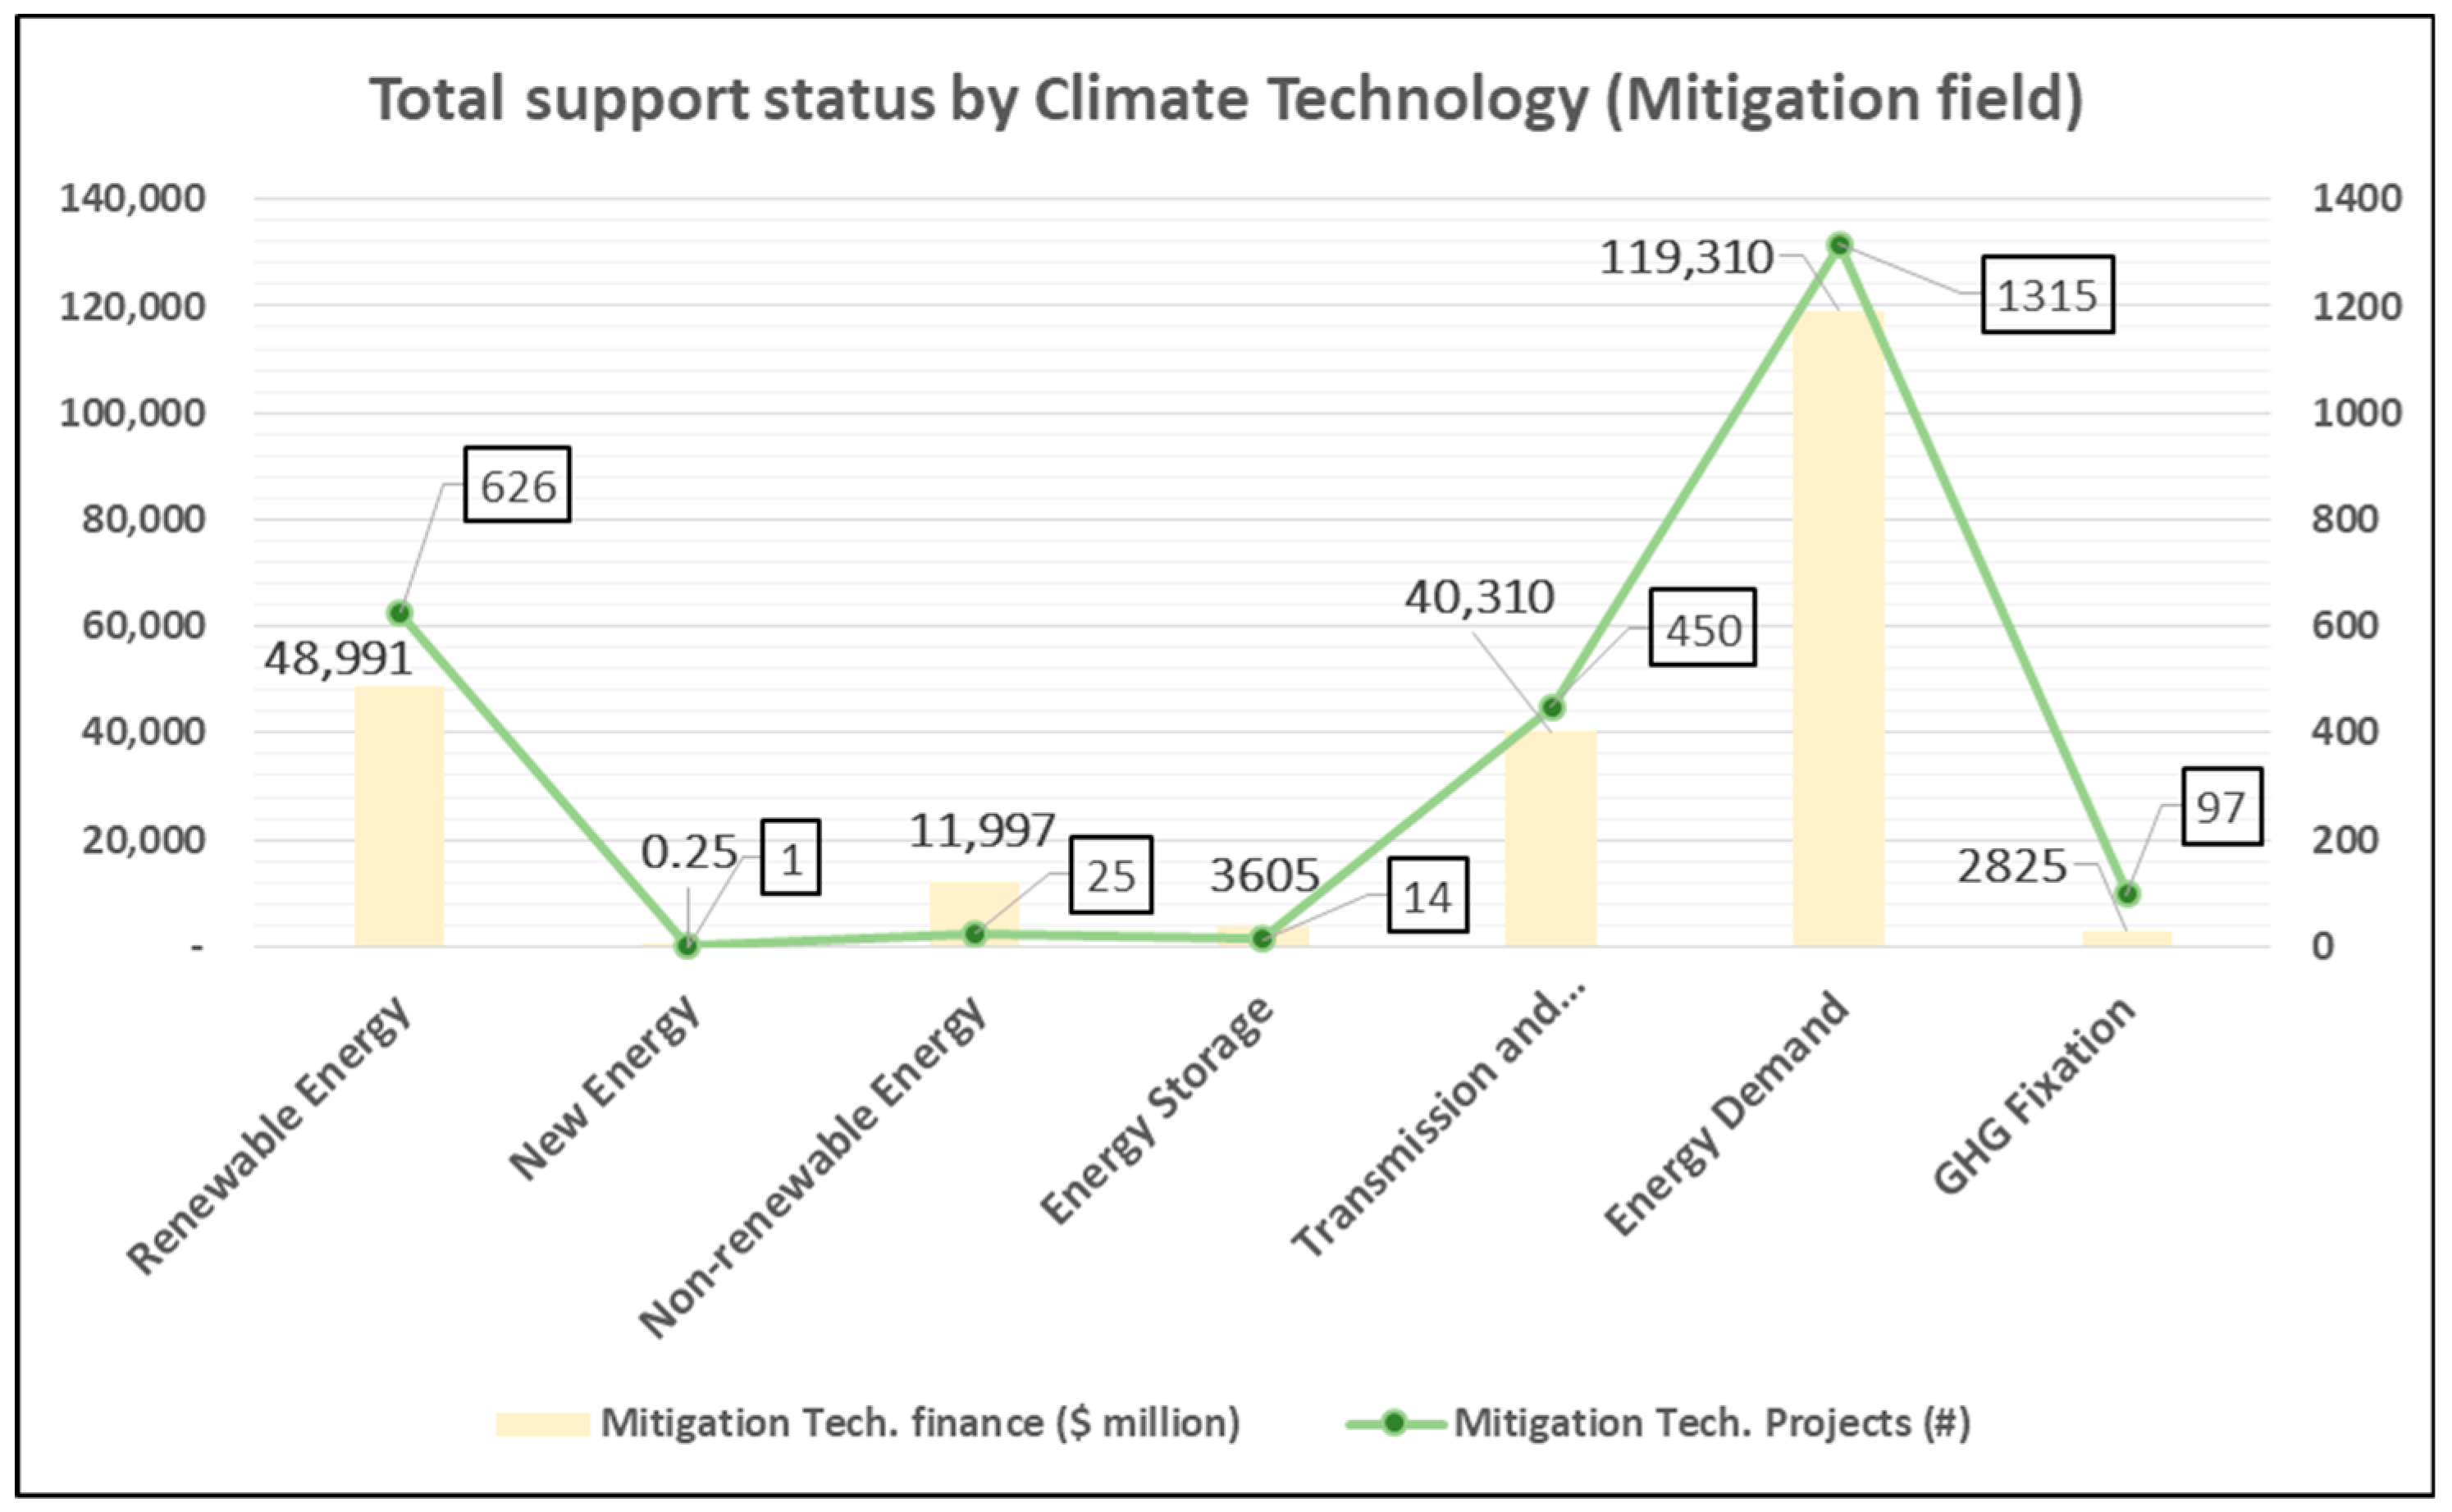
3.1. Support from Multilateral Development Banks

According to the results of comprehensive status in the field of MDB climate technology mitigation, the total supported amount was US$ 227 billion. There were a total of 2528 cases of support for climate technology projects. Figure 2 represents the current status of each climate technology in the field of mitigation. According to the derived current status, project support in renewable energy and energy demand areas turned out to be the highest at 75% of the entire mitigation technology. Given this, it is shown that climate technology projects have actively been performed on renewable energy, which is a core element of GHG mitigation technology, and energy demand in the areas of transportation, industry, and building efficiency, Appendix A, Table A1, which are relevant to renewable energy sources. The average support amount in the field of mitigation technology was US$ 90 million/project. The renewable energy and energy demand fields show the greatest scale of support with US$ 78 million/project and US$ 91 million/project, respectively, and the average amount of them was 87% and 101% of the entire average, respectively. On the other hand, the support amount of nonrenewable energy and energy storage fields turned out to be U$ 477 million/project and US$ 258 million/project, respectively, and the average amount in the field of mitigation turned out to be 531% and 287%, respectively, which are the projects of the largest scale of amount.
Results derived from the investigation of the current status of the number of projects and the total amount of support in each climate technology after classifying the period of project performance into three stages of short-term, mid-term, and long-term are shown in Table 3. Support amount turned out to be the highest at 84% for the projects of 4–9 years (mid-term), and the proportion of projects turned out to be 49% and 50% in short-term and mid-term projects, respectively. Therefore, it is shown that short-term and small-scale projects were performed in abundance. In addition, most of the short-term and mid-term project support amounts were used for renewable energy (16%, 22%, respectively), power supply/electricity IT (27%, 18%, respectively), and energy demand (54%, 50%, respectively) areas, Appendix A, Table A2.
As for long-term (more than 10 years) projects, there were 10 cases for renewable energy, 6 cases for energy demand, and 2 cases for GHG fixation, and the average support amount of each project turned out to be US$ 220 million, which was 140% of the mid-term projects. Rather than the renewable energy and energy demand areas where climate technology projects have frequently been performed throughout the world, it was confirmed that long-term climate technology projects for GHG fixation were being performed.

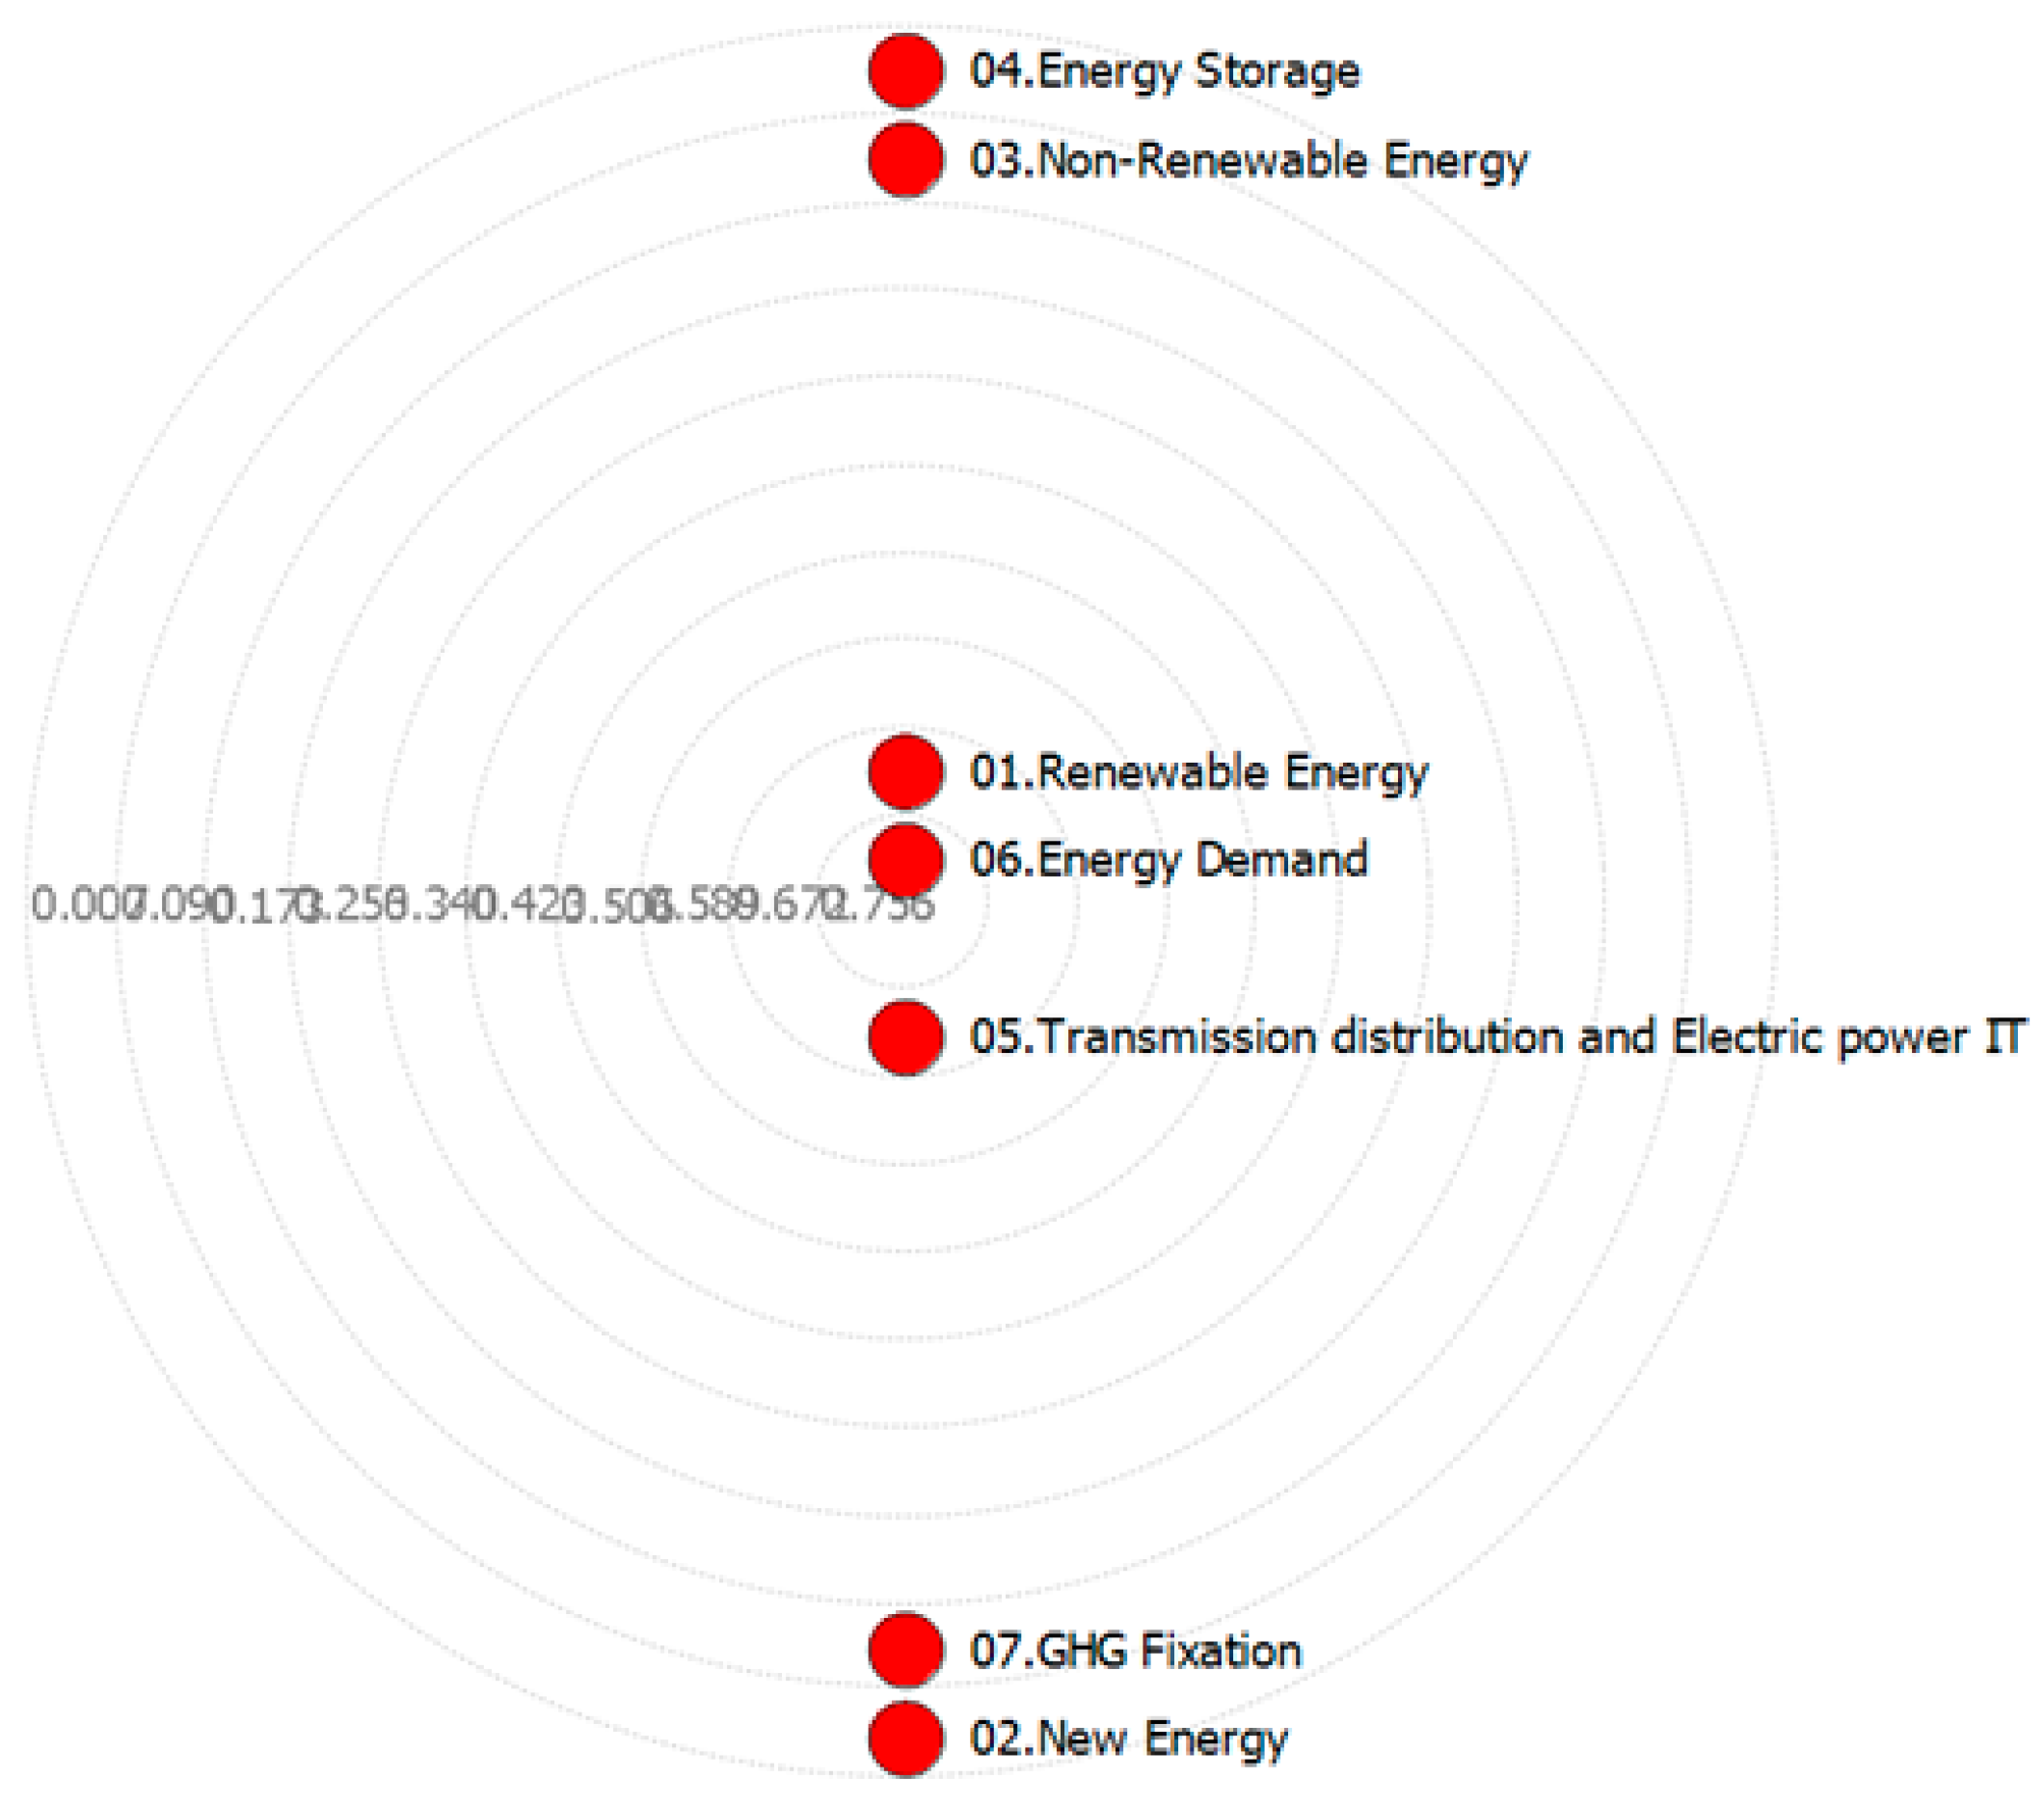
3.2. Results of Analysis of MDB, Country, and Technology Network

A total of 149 countries were supported in the project conducted by MDBs, related to climate technology, and the investment was distributed in seven technology fields. According to the results of the analysis of centrality, technology centrality turned out to be the highest in the field of energy demand, renewable energy, transmission distribution, and electric power IT (Figure 3).
Centrality indicates that the more nodes in the connection, the more autonomy and power there will be, which means that such technology has more connection between a country and technology. In addition, it turned out that centrality was high in countries such as Colombia, Philippines, Mongolia, Vietnam, and Turkey. Table 4 shows that the result of two-mode normalized degree centrality (Top 30 countries).

3.3. Results of Network Analysis, CRI, and Comparison and Analysis of National GHG Emission

According to the results of centrality of performing countries and comparison and analysis of the top 100 countries of CRI provided by Germanwatch [20], 64 countries among 100 (64%) were included in the result of centrality of MDBs supporting climate technology projects. This indicates that many countries are making investments and efforts in activities in coping with climate change as well as their awareness of risk. On the other hand, 36 countries among 100 (36%) were not included in the results of centrality with projects of climate change supported by MDBs. This indicates that these countries were classified to be weak against climate change, but climate technology projects have not been seamlessly performed through MDBs.
Table 5 indicates whether a country was included in the centrality results after comparing the results of national centrality analysis with CRI; shaded countries are not included in the centrality results. In other words, despite the high ranking of CRI, the centrality of climate technology is less.
Next, OECD countries with large amounts of GHG emissions and their centrality of technology were compared and analyzed. According to the results of centrality analysis in each field of mitigation for climate technology, there were 100 countries for renewable energy, 17 countries for nonrenewable energy, 10 countries for energy storage, 108 countries for power supply/electricity IT, 125 countries for energy demand, and 25 countries for GHG fixation. It was confirmed that areas of major climate technology projects were clearly represented (renewable energy, energy storage, power supply/electricity IT, and energy demand). According to the results of technology centrality of the top 30 countries based on the data of OECD national GHG emissions, most of the countries were confirmed to have been conducting climate technology projects in the fields of renewable energy, power supply/electricity IT, and energy demand.
In particular, centrality turned out to be high in the field of GHG fixation in China, the country with the highest GHG emissions; Brazil ranked as the 13th country for GHG emissions and Colombia ranked as the 41st country for GHG emissions. China had 18 cases, Brazil had 15 cases, and Colombia had 11 cases of climate technology projects in the field of GHG fixation, which shows their efforts to mitigate GHGs. This seems to be a result indicating that countries emitting a substantial amount of GHGs will invest more on projects in the field of GHG fixation than on projects on renewable energy.

4. Conclusions

In this study, projects related to climate technology supported by MDBs were selected and analyzed as the subject for the research among many methods in coping with climate change. For the database of project information in the field of mitigation for climate technology, screening techniques were employed three times.
Total support amount in the field of climate technology mitigation from MDBs was US$ 227 billion, and there were a total of 2528 cases of support. Project support turned out to be the highest at 75% in the renewable energy and energy demand areas among the entire mitigation technologies. Given the results, it is shown that climate technology projects related to renewable energy, which is a core element of GHG mitigation technology, and energy demand relevant to renewable energy sources have been actively performed.
Most of the short-term and mid-term project support amounts were used in the renewable energy (16%, 22%, respectively), power supply/electricity IT (27%, 18%, respectively), and energy demand (54%, 50%, respectively) areas. It was confirmed that long-term projects have been performed in the GHG fixation areas rather than the fields where climate technology projects were actively performed.
In the projects conducted by MDBs in regard to climate technology, 149 countries were supported, and investment was made in seven technology areas. According to the results of analysis of centrality, centrality of technology turned out to be high in the fields of energy demand, renewable energy, transmission distribution, and electric power IT. In addition, centrality of countries including Colombia, Philippines, Mongolia, Vietnam, Turkey and others turned out to be high in terms of countries.
According to the results of comparison and analysis of centrality of the top 100 countries of CRI, 64 countries among 100 (64%) were included in the results of centrality with projects for climate technology supported by MDBs. This indicates that many countries have been making investments and efforts in activities for coping with climate change as well as awareness of risk of climate change. On the other hand, 36 countries among 100 (36%) were not included in the results of centrality with projects for climate technology supported by MDBs. This indicates that relevant countries were classified to be weak against climate change, but projects for climate technology through MDBs were not actively performed.
According to the results of comparison and analysis of countries with high GHG emissions and their centrality, centrality turned out to be high in the field of GHG fixation in China, the country with the highest GHG emission; Brazil ranked as the 13th country for GHG emissions and Colombia ranked as the 41st country for GHG emissions. China had 18 cases, Brazil had 15 cases, and Colombia had 11 cases of climate technology projects in the field of GHG fixation, which showed their efforts to mitigate GHGs. This seems to indicate that countries emitting a substantial amount of GHGs will invest more on projects in the field of GHG fixation as well as projects on renewable energy.
Thus, this study is expected to contribute to understanding the trends of climate technology projects for coping with climate change and using them in establishing future policies on climate technology. In addition, it is expected to be used as a reference for countries with insufficient investment in climate technology despite the high Climate Risk Index (CRI). In this study, we analyzed MDBs’ projects on climate technology mitigation only. Currently, the Green Technology Center is collecting and analyzing data on MDBs’ climate technology adaptation projects (agriculture, animal husbandry, marine, etc.) and plans to carry out continuous research in the future as well as in the adaptation field and social sectors.

Author Contributions

Conceptualization, J.Y.L. and S.H.H.; methodology, J.Y.L. and S.H.H.; software, S.H.H.; validation, J.Y.L. and S.H.H.; formal analysis, S.H.H.; investigation, J.Y.L.; data curation, J.Y.L.; writing—original draft preparation, J.Y.L.; writing—review and editing, J.Y.L. and S.H.H.; visualization, J.Y.L.; supervision, S.H.H. All authors have read and agreed to the published version of the manuscript.

Funding

This research has been performed with the support of the unique assignment of Green Technology Center Korea [Publication of the White Paper 2019 on Green Climate Technology (R18123)].

Conflicts of Interest

The authors declare no conflict of interest.

Appendix A

The current status of the amount supported in each MDB/approval year and technology as well as the number of projects have been summarized in Table A1 and Table A2.
Table A1. Total support status by MDBs.
MDBADBAfDBAIIBEBRDEIBIDBWBTotal
Technology
Renewable Energy47471865124620453292222433,57148,991
1174045855198154626
New Energy 0.25 0
1 1
Nonrenewable Energy50410111,24057 19611,927
4141 8725
Energy Storage 4842330983605
34714
Transmission and Distribution/Electric Power IT12,6804636162920611949273314,62340,310
12886540296597450
Energy Demand38,75896399344749910,464973133,874119,310
444145181181572791541315
GHG Fixation1048 190565950732825
39 4250297
Total57,73716,24123,46011,85116,75415,68185,245226,967
732272312212466054212528
Unit: US $ million/# of projects.
Table A2. Total support status by year of approval.
Approval Year20112012201320142015201620172018Total
Technology
Renewable Energy89364919364111,840333043285607639148,991
79818881110769020625
New Energy 0.25 0
1 1
Nonrenewable Energy1 1011 91210,39252011,927
1 12 610525
Energy Storage 484022324193828183605
314111314
Transmission and Distribution/Electric Power IT6010491834373513478879275319340339,314
5947745952666922448
Energy Demand13,92911,87012,16014,91320,61716,21417,3127250114,264
177168192177196184151611306
GHG Fixation100221695239477288312332825
1014121910720597
Total28,97622,41120,03530,72929,23529,42739,49920,615220,927
3263133683423693403421162516
Unit: US $ million/# of projects.

References

  1. A Group of Multilateral Development Banks (MDBs); Joint Report on Multilateral Development Banks’ Climate Finance; European Bank for Reconstruction and Development: London, UK, 2019; pp. 3–8.
  2. Climate Funds Update. Available online: https://climatefundsupdate.org/about-us/notes-and-methodology/ (accessed on 29 August 2018).
  3. Green Technology Center; White Paper 2019 on Green Climate Technology. Green Technology Center: Seoul, Korea, 2019. Available online: https://gtck.re.kr/frt/center/en/publications/reports_books.do?pageMode=View&nttId=25734&nowNum=3 (accessed on 8 January 2020).
  4. Glossary of terms. In Managing the Risks of Extreme Events and Disasters to Advance Climate Change Adaptation—A Special Report of Working Groups I and II of the Intergovernmental Panel on Climate Change (IPCC); Field, C.B.; Barros, V.; Stocker, T.F.; Dahe, Q.; Dokken, D.J.; Ebi, K.L.; Mastrandrea, M.D.; Mach, K.J.; Plattner, G.K.; Allen, S.K.; et al. (Eds.) Cambridge University Press: Cambridge, UK; New York, NY, USA, 2012; pp. 555–564. Available online: https://www.ipcc.ch/site/assets/uploads/2018/03/SREX_Full_Report-1.pdf (accessed on 7 January 2020).
  5. Climate Change 2007 Impacts, Adaptation and Vulnerability. Contribution of Working Group II to the Fourth Assessment Report of the Intergovernmental Panel on Climate Change; Cambridge University Press: Cambridge, UK, 2007; p. 60. Available online: https://www.ipcc.ch/site/assets/uploads/2018/03/ar4_wg2_full_report.pdf (accessed on 7 January 2020).
  6. TT: Clear. Available online: https://unfccc.int/ttclear/about (accessed on 7 January 2019).
  7. Climate Change and Its Impacts in Japan, 2009, Japan Ministry of Education, Culture, Sports, Science and Technology (MEXT); Japan Meteorological Agency (JMA); Ministry of the Environment (MOE). Available online: https://www.env.go.jp/en/earth/cc/report_impacts.pdf (accessed on 7 January 2020).
  8. Shin, K.N.; Jang, C.S.; Yang, R.W.; Lee, S.K.; Park, I.H.; Kim, Y.I.; Kim, J.M. Climate Technology Center Network and Technical Assistance Guideline; Green Technology Center: Seoul, Korea, 2018; pp. 2–7. Available online: https://gtck.re.kr/frt/center/insight/researchall.do (accessed on 8 January 2020).
  9. A Group of Multilateral Development Banks (MDBs); Joint Report on Multilateral Development Banks’ Climate Finance; European Bank for Reconstruction and Development: London, UK, 2018; pp. 27–33.
  10. In-Hwan, O. A Study on the Classification of Climate Technology; Green Technology Center: Seoul, Korea, 2017; Available online: https://gtck.re.kr/frt/center/insight/researchall.do (accessed on 8 January 2020).
  11. Asian Development Bank. Available online: https://www.adb.org/data/statistics (accessed on 7 January 2020).
  12. African Development Bank. Available online: https://www.afdb.org/en/projects-and-operations (accessed on 7 January 2020).
  13. Asian Infrastructure Investment Bank. Available online: https://bankwatch.org/what-we-do#projects (accessed on 7 January 2020).
  14. European Bank for Reconstruction and Development. Available online: https://www.ebrd.com/work-with-us/project-finance/project-summary-documents.html (accessed on 7 January 2020).
  15. European Investment Bank. Available online: https://www.eib.org/en/projects/index.htm (accessed on 7 January 2020).
  16. Inter-American Development Bank. Available online: https://www.iadb.org/en/projects (accessed on 7 January 2020).
  17. World Bank Group. Available online: https://projects.worldbank.org/ (accessed on 7 January 2020).
  18. Kwahk, K.Y. Social Network Analysis, 2nd ed.; Chungram Publishing Co., Ltd.: Seoul, Korea, 2017; pp. 417–438. [Google Scholar]
  19. John, S. Social Network Analysis: A Handbook, 2nd ed.; SAGE Publications: Los Angeles, CA, USA, 2000; p. 224. [Google Scholar]
  20. NetMiner, version 4.4; Cyram Inc.: Seoul, Korea, 2018.
  21. Organisation for Economic Co-operation and Development. Available online: https://data.oecd.org/air/air-and-ghg-emissions.htm (accessed on 7 January 2020).
  22. Eckstein, D.; Hutfils, M.L.; Winges, M. Global Climate Risk Index 2019—Who Suffers Most from Extreme Weather Events? Weather-Related Loss Events in 2017 and 1998 to 2017; Germanwatch: Bonn, Germany, 2018; Available online: https://germanwatch.org/files/Global%20Climate%20Risk%20Index%202019_2.pdf (accessed on 7 January 2020).
Figure 1. Flow Chart of developing Database (MDB Mitigation Technology).
Energies 13 00311 g001
Figure 2. Total support status by climate technology (mitigation field).
Energies 13 00311 g002
Figure 3. Climate technology degree centrality.
Energies 13 00311 g003
Table 1. Keywords in each mitigating technology field in mid-categories of climate technology.
Classification of Climate Technology (Korea)Keyword for 3rd Screening
(Mitigation Technology)
CategoryTechnology Scope
(1) Renewable EnergyHydropower/Photovoltaic/Solar thermal/Geothermal/Wind power/Ocean energy/Bioenergy/Wastehydropower, solar, photovoltaic, geothermal, wind power, wind turbine, tidal, wave power, biomass, bioenergy, biogas, waste energy, waste to energy, renewable energy, biofuel, biorefinery (16)
(2) New EnergyHydrogen manufacturing/
Fuel cell
hydrogen production, hydrogen generation,
fuel cell (3)
(3) Nonrenewable EnergyNuclear power generation/Fusion power generation/Clean power generation and efficiencynuclear, atomic, fusion, coal, gasification (5)
(4) Energy StoragePower storage/
Hydrogen storage
energy storage, power storage, hydrogen storage, battery (4)
(5) Transmission and Distribution/
Electric Power IT
Transmission and distribution
systems/
Electric intelligence devices
smartgrid, microgrid, energy management, power transmission, demand response (5)
(6) Energy DemandEfficient transport/
Industrial efficiency/
Building efficiency
transport, engine, industry, energy efficiency, vehicle, traffic, building, light-emitting diode, life cycle (9)
(7) GHG FixationCCUS/
Non-CO2 reduction
sequestration, carbon capture, mineralization, combustion capture, geological storage, biological conversion, chemical conversion, nitrous oxide, hydrofluorocarbon, perfluorocarbon, sulfur hexafluoride, nitrogen fluoride three, methane, landfill gas (14)
Table 2. Number of projects supported by MDBs in each mid-category of climate technology.
Category of Climate Technology (Mitigation)# of Projects
(1) Renewable Energy626
(2) New Energy1
(3) Nonrenewable Energy25
(4) Energy Storage14
(5) Transmission and Distribution/
Electric Power IT
450
(6) Energy Demand1315
(7) GHG Fixation97
Total2528
Table 3. Current status of support on each project period—area of climate technology mitigation.
MDBShort-Term (~3 year)Mid-Term (4~9 year)Long-Term (more than 10 year )Total
Renewable Energy336027,934213233,427
16516510340
New Energy0000
0000
Nonrenewable Energy13947009483
154019
Energy Storage225283603061
4408
Transmission and Distribution/Electric Power IT569822,815028,513
1321960328
Energy Demand11,39164,318176577,474
4324386876
GHG Fixation506679621248
526260
Total21,193128,0533960153,206
800813181631
Unit: US $ million/# of project.
Table 4. Two-mode normalized degree centrality of country (top 30).
RankCountryDegree CentralityRankCountryDegree CentralityRankCountryDegree Centrality
1Colombia0.85714311Guatemala0.57142921Uruguay0.571429
2Regional0.85714312Cyprus0.57142922Cote d’Ivoire0.571429
3Philippines0.71428613Russian Federation0.57142923South Africa0.571429
4Mongolia0.71428614Estonia0.57142924Brazil0.571429
5Vietnam0.71428615Kazakhstan0.57142925Rwanda0.571429
6Turkey0.71428616Serbia0.57142926Peru0.571429
7Costa Rica0.71428617Ecuador0.57142927Morocco0.571429
8Indonesia0.71428618Dominican Republic0.57142928Nigeria0.571429
9China0.71428619Kyrgyz Republic0.57142929Pakistan0.571429
10Guyana0.57142920Argentina0.57142930Azerbaijan0.571429
Table 5. Analysis result of comparing CRI—country degree centrality.
CRICountryO/X *CRICountryO/X *CRICountryO/X *CRICountryO/X *CRICountryO/X*
1Puerto RicoX21Costa RicaO41Czech RepublicX61St. Kitts and NevisX81Solomon IslandsO
2Sri LankaO22LatviaO42AustriaX62IrelandX82BelgiumX
3DominicaX23South AfricaO43CanadaX63RomaniaO83Côte d’IvoireO
4NepalO24AlbaniaO44MalaysiaX64MexicoO84Papua New GuineaO
5PeruO25NicaraguaO45KenyaO65Slovak RepublicO85Korea, Republic ofX
6VietnamO26HaitiO46EthiopiaO66Republic of YemenX86UgandaO
7MadagascarO27AfghanistanO47SpainX67KazakhstanO87RwandaO
8Sierra LeoneO28MozambiqueO48Lao People’s Democratic RepublicX68ParaguayO88Saudi ArabiaX
9BangladeshO29PolandX49ArgentinaO69MyanmarO89JamaicaO
10ThailandO30GreeceX50IndonesiaO70New ZealandX90Chinese TaipeiX
11PortugalX31ChinaO51ZimbabweX71RussiaX91SloveniaO
12USAX32SerbiaO52Kyrgyz RepublicO72TurkeyO92TanzaniaO
13Antigua and BarbudaX33PakistanO53BulgariaO73GuatemalaO93GhanaO
14IndiaO34HondurasO54CroatiaO74The BahamasX94LiberiaO
15NigerO35ItalyX55SwitzerlandX75BotswanaX95TunisiaO
16ChileX36JapanX56Democratic Republic of CongoO76BurundiO96Central African RepublicX
17EcuadorO37Dominican RepublicO57MalawiO77PanamaO97FijiO
18AustraliaX38IranX58Bosnia and HerzegovinaO78MauritaniaX98AngolaO
19ColombiaO39BoliviaO59FranceX79BrazilO99El SalvadorO
20PhilippinesO40GermanyX60SudanX80NigeriaO100CyprusO
CRI: Climate Risk Index, * (O/X): Climate technology degree centrality inclusion.

