Article

Testing the Durability of Anti-Soiling Coatings for Solar Cover Glass by Outdoor Exposure in Denmark

1
CREST, Wolfson School of Mechanical, Electrical and Manufacturing Engineering, Loughborough University, Loughborough, Leicestershire LE11 3TU, UK
2
Department of Mechanical Engineering, Colorado State University, Fort Collins, CO 80523, USA
*
Author to whom correspondence should be addressed.
Energies 2020, 13(2), 299; https://doi.org/10.3390/en13020299
Submission received: 5 November 2019 / Revised: 31 December 2019 / Accepted: 6 January 2020 / Published: 7 January 2020
(This article belongs to the Section D1: Advanced Energy Materials)

Abstract

:
The presence of soiling on photovoltaic modules reduces light transmission through the front cover glass to the active absorber, thereby reducing efficiency and performance. Current soiling mitigation techniques are expensive and/or ineffective. However, anti-soiling coatings applied to the solar cover glass have the potential to reduce soiling for long periods of time without continuous maintenance. This paper reports the performance of two transparent hydrophobic coatings (A and B) exposed to the outdoor environment of coastal Denmark for 24 weeks. A comparison was made between the performance of coated and uncoated glass coupons, periodically cleaned coupons, and accelerated laboratory tests. Although initial results were promising, water contact angle and transmittance values were found to decline continuously for all coated and uncoated coupons. Surface blisters, film thickness reduction, changes in surface chemistry (fluorine loss), and abrasion damage following cleaning were observed. Coupons cleaned every 4 weeks showed a restoration in transmittance. Cycles of light rainfall and evaporation combined with a humid and salty environment led to cementation occurring on all coupons. The development of an abrasion-resistant, super-hydrophobic coating with a low roll-off angle and high water contact angle is more likely to provide an anti-soiling solution by reducing the build-up of cementation.

Graphical Abstract

1. Introduction

Much research effort has focused on improving the efficiency of photovoltaic (PV) modules, and the conversion efficiency of most device technologies has steadily improved. By contrast, much less effort has been applied to the serious losses that occur on the module cover glass. One such problem is the accumulation of dust and other soiling on the glass surface. Soiling attenuates the light into the PV absorber, causing a direct reduction in power output. Losses of up to 50% in transmittance and associated power reductions have been reported due to dust accumulation [1]. A typical example of soiling is shown in Figure 1. As the deployment of solar modules at utility scale grows, asset managers are increasingly concerned with the costs of maintenance and module cleaning.
Research has recently focused on characterizing dust and understanding how it is deposited onto the surface, accumulated over time, and how it can be removed efficiently [2]. The dust composition is region-specific, and the effect of soiling varies according to the local environment and climate. Bhaduri et al. studied dust deposition on PV modules in two locations in India. Soiling losses varied with location and time as the dust composition changed [3]. This poses challenges in developing a single effective anti-soiling coating applicable worldwide. The deserts in the Middle East experience dust in the form of clays and sand, where dust storms exacerbate dust accumulation. On the other hand, regions where rainfall or snow is prevalent can result in the cover glass being naturally cleaned, thereby partially restoring transmittance.
Sarver et al. considered various mitigation strategies, categorizing them as restorative or preventative [2]. Restorative refers to using water, chemical detergent, or mechanical means to restore the surface back to its original condition after dust settlement has occurred. Active preventative measures can include stowing for protection during a sandstorm, vibrating the surface, or electrostatic repulsion. These measures can be expensive, damaging, or simply ineffective. This work has examined the use of low-energy hydrophobic coatings applied to the PV module cover glass. Hydrophobic coatings have the potential to minimise soiling and make the surfaces easier to clean. Durability is a key issue to be resolved, but these coatings could provide a low-cost, sustainable medium- to long-term solution.
Hydrophobic coatings are of interest due to their high water contact angles (>90°) and low surface energy. Low surface energy reduces the adhesion force of the dust to the coating. The water contact angle (WCA) is the angle at the edge of the water droplet between the solid surface and liquid–vapor boundary. Water in contact with the coating will have a tendency to roll or slide off the surface, carrying dust along the way. Hence, hydrophobic coatings are considered ‘self-cleaning.’ The roll-off angle (ROA) is also an important parameter and should ideally be below the tilt angle of the solar panel.
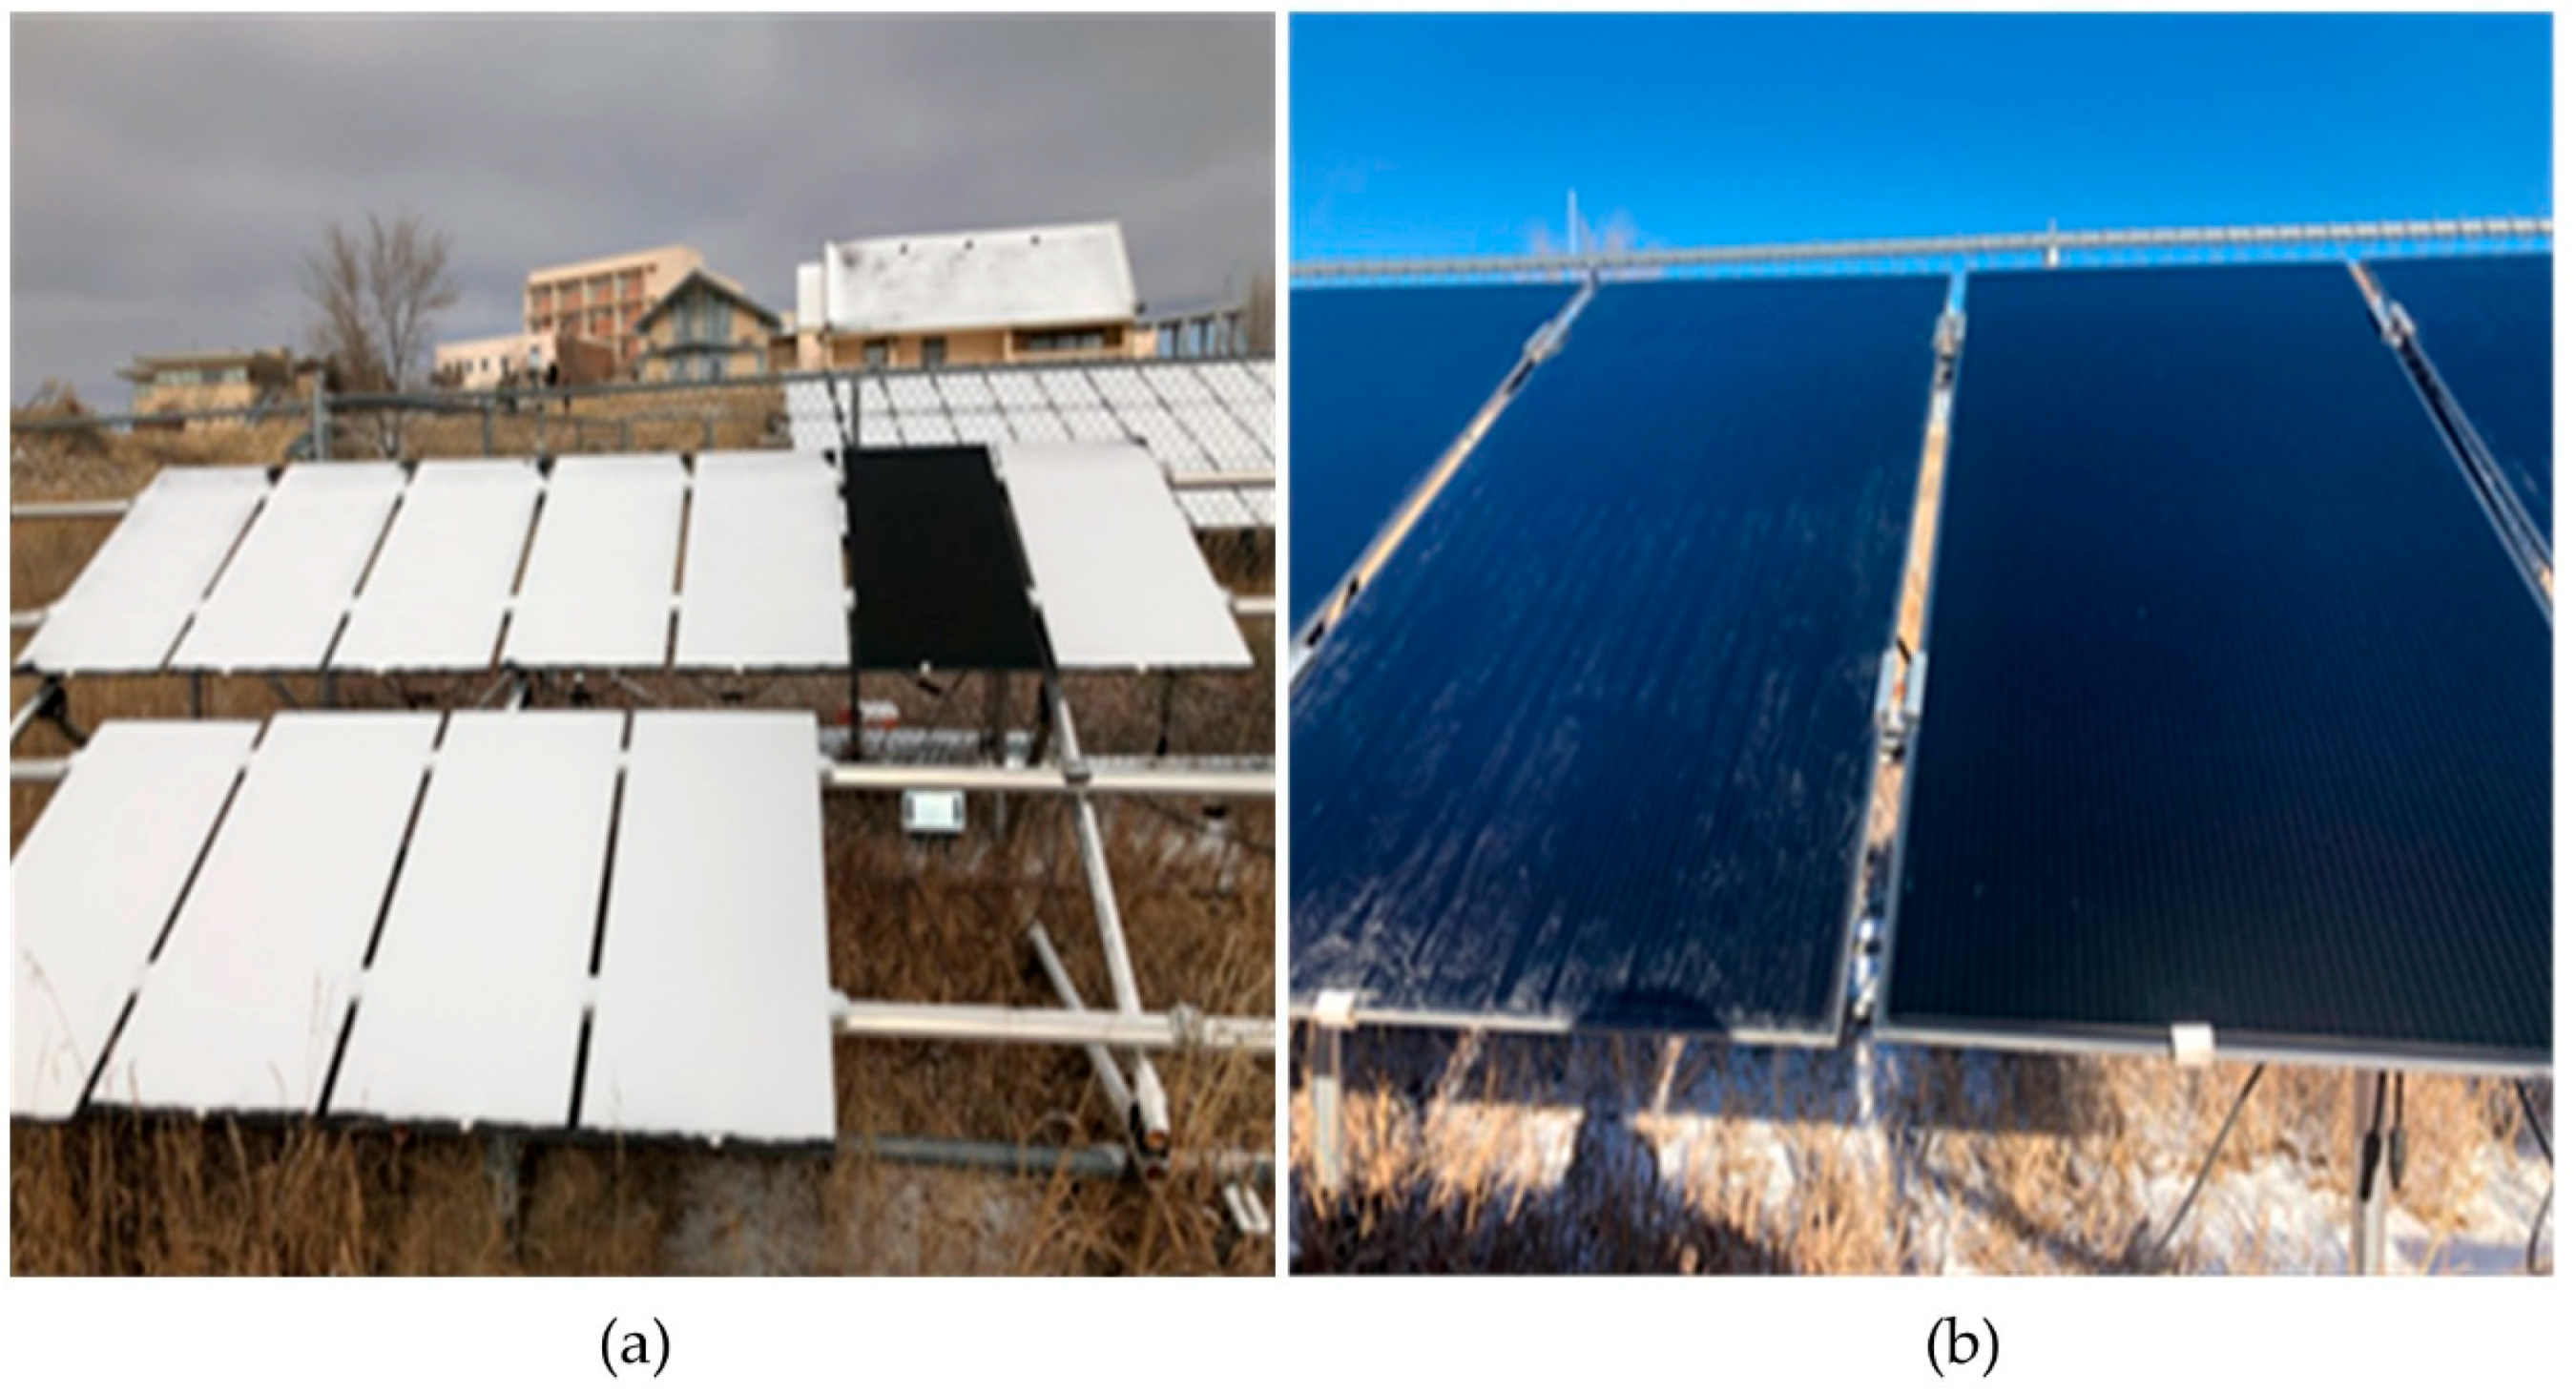
Solar panels with a hydrophobic coating have been shown to outperform panels with no coating [4,5]. The potential of a candidate coating (A) was demonstrated on solar modules in an outdoor solar field maintained at Colorado State University in Fort Collins, Colorado. After snowfall, the coated module was fully operational while all the other panels retained snow coverage and thus produced no power (Figure 2a). The self-cleaning property of the coating was also evident after snow melt, where dirty residues were clearly visible on the uncoated adjacent panels (Figure 2b). These results confirmed the exciting potential of hydrophobic coatings for anti-soiling.
There are two ways to produce hydrophobicity: altering surface chemistry and/or increasing surface roughness. Polizos et al. tailored nanostructured coatings (surface roughness) with fluorocarbons (surface chemistry) and noticed that the transmittance values for coated glass were 20% higher than those of uncoated glass after a soiling test (falling sand abrasion test ASTM D968) [6]. Quan et al. observed that a hydrophobic surface (regardless of the degree of hydrophobicity) made of silica sol and SiO2 nanoparticles exhibited anti-soiling behaviour and a higher optical transmittance than uncoated glass [7].
Other research has focused on commercially available hydrophobic coatings used in other applications and industries. One example is the hydrophobic coating used in the ophthalmic industry on spectacle lenses to make them easier to clean. Isbilir et al. exposed these coatings to rigorous accelerated laboratory experiments to induce degradation [8,9]. UV exposure tests in the laboratory correlated with outdoor exposure, showing similar signs of coating degradation. These accelerated aging tests can uncover the degradation mechanisms at work and help to predict the coating lifetime. However, further testing of different stresses is needed to compare the accuracy of these accelerated aging tests with the results of real outdoor exposure.
In this work, we report the performance of two hydrophobic coatings (one commercial and one non-commercial) compared to uncoated glass through outdoor exposure in Denmark. We also compare the results to laboratory accelerated environmental tests. The objectives of the work were as follows:
  • To compare the anti-soiling properties of hydrophobic-coated and uncoated glass coupons when exposed to outdoor conditions for 24 weeks.
  • To compare soiling of coupons that are manually cleaned every 4 weeks against coupons that are not cleaned.

2. Materials and Methods

2.1. Materials

Two different hydrophobic coatings on glass coupons were subject to outdoor exposure. The exposure comprised of 6 uncoated coupons, 6 coated coupons, and 6 (5 for coating B) coated coupons where the entire surface was cleaned every 4 weeks. One uncoated coupon and two coated (cleaned and uncleaned) coupons were removed for analysis every 4 weeks (up to 24 weeks) from 18/2/19 to 5/8/19, as shown in Figure 3.
Coating A (referred hereafter as A) is a commercial coating composed of a perfluorinated silane layer [10]. The silane head is bonded with the glass substrate, while the fluorinated tail orientates itself outwards, creating the outer hydrophobic layer. The solvent used was parachlorobenzotrifluoride. A was applied by spray coating onto one side of the glass coupon with dimensions of 10.3 cm × 10.3 cm × 0.3 cm (width × length × thickness).
Coating B (referred henceforth as B) is a non-commercial, research coating composed of hexamethyldisilazane and functionalised silica nanoparticles [11]. The coating was designed to be of uniform chemical composition and would remain hydrophobic even if the coating’s surface was damaged. B was applied using the sol-gel dip coating method, depositing the coating on both sides of the glass coupon with dimensions of 5 cm × 5 cm × 0.1 cm (width × length × thickness). The hydrophobicity is caused by the presence of functionalised nanoparticles, which increase the surface roughness.

2.2. Outdoor Exposure

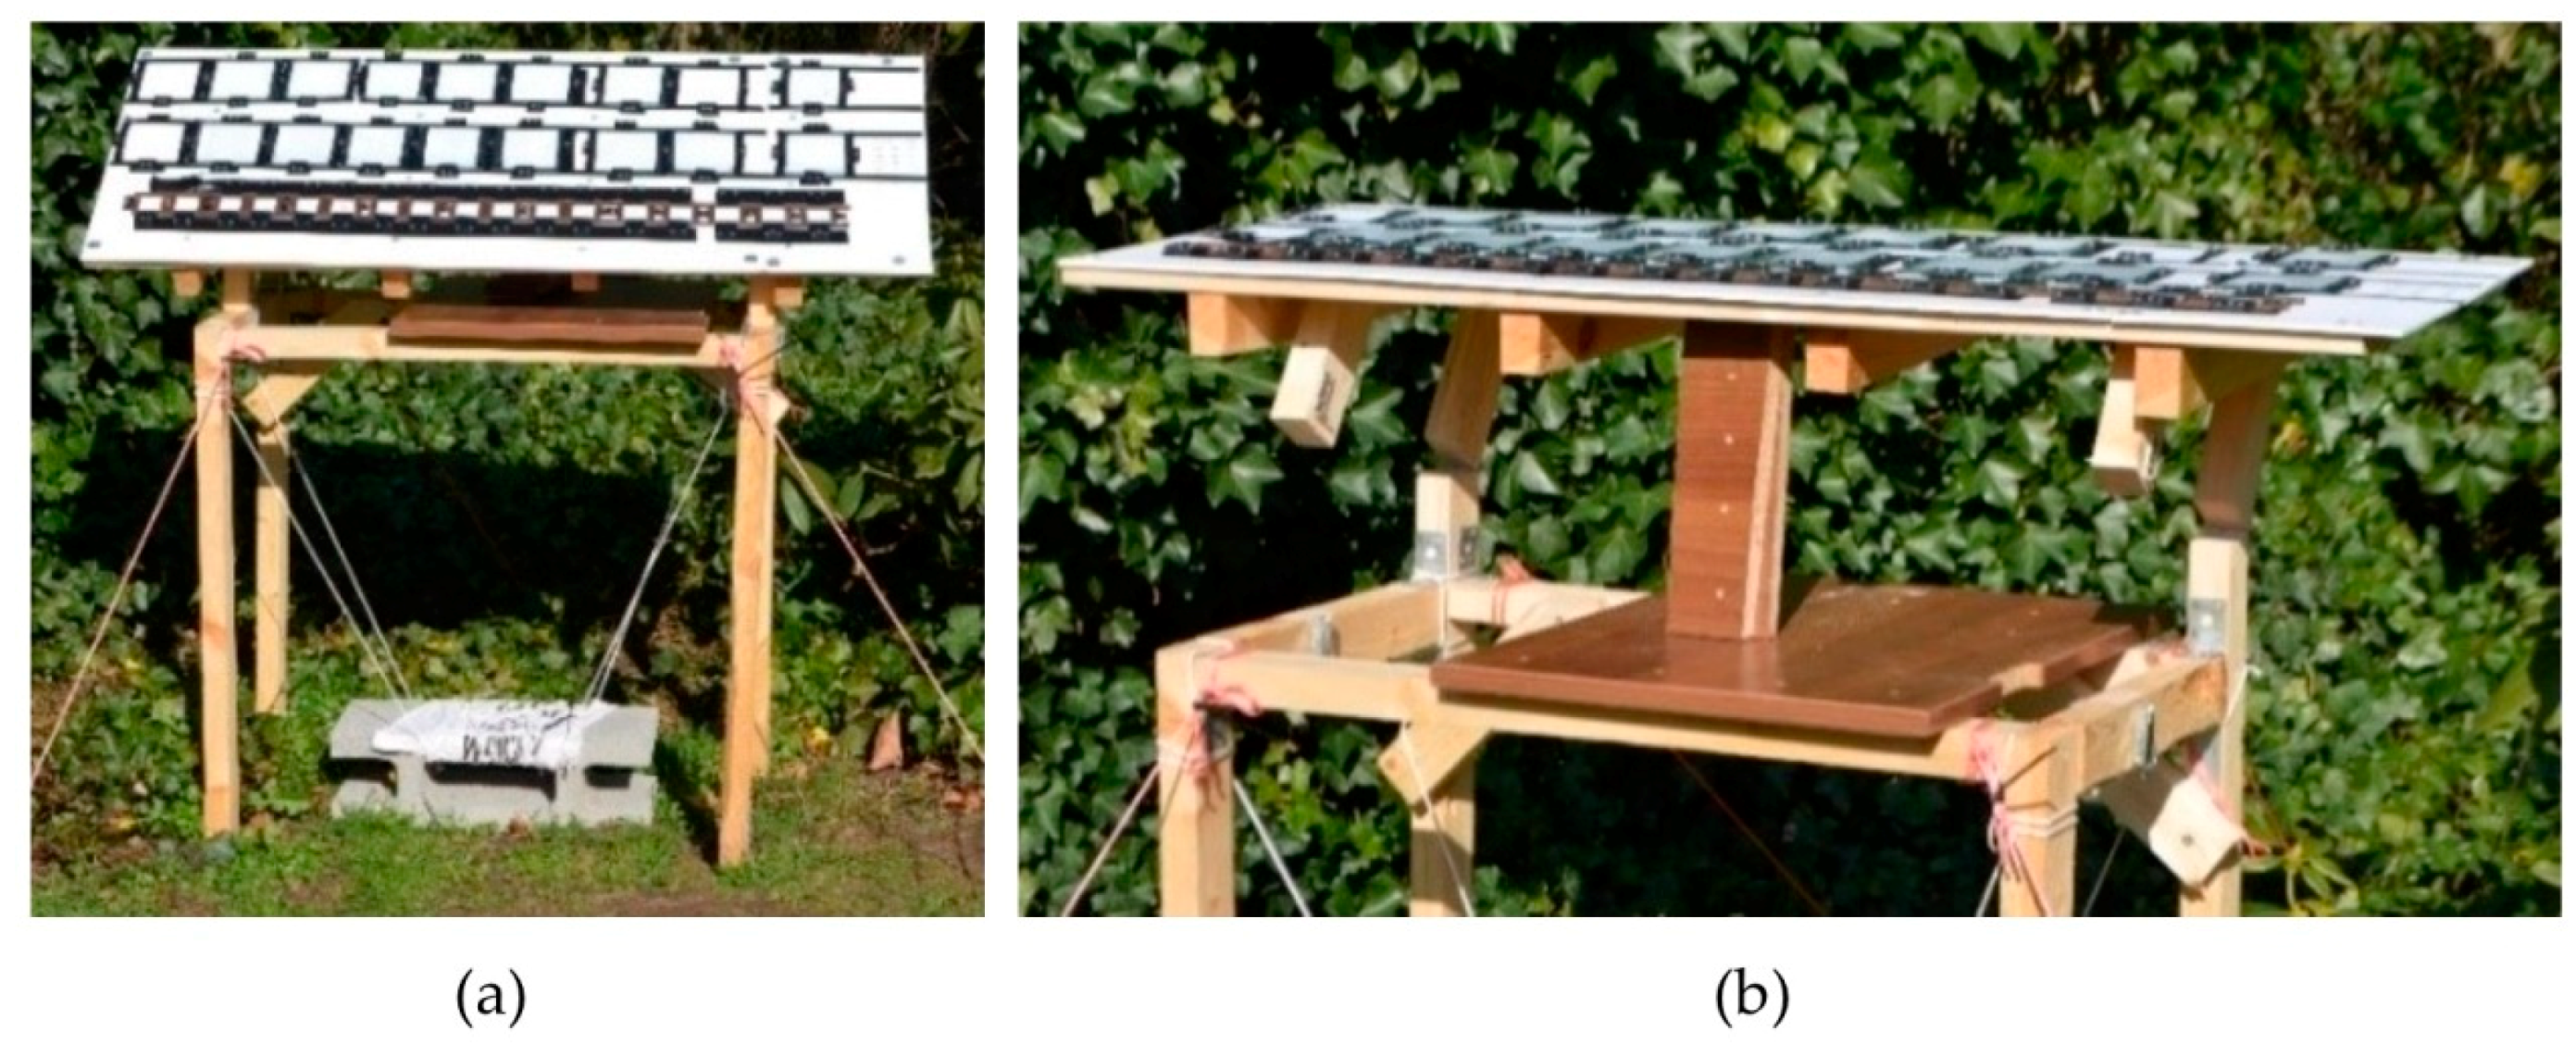
Exposure of the glass coupons took place at the coastal city of Esbjerg, Denmark (latitude 55.48° N, longitude 8.46° E). The coupons were mounted on a rack facing south at a 36° tilt angle as recommended for Denmark [12]. The setup is shown in Figure 4a. During exposure, images of the coupon surface were obtained at least twice a week to record the soiling and the effects of coating degradation.
Cleaning of coupons was achieved by spraying with deionised water (DI H2O) at low pressure to remove coarse particles and dissolve water-soluble particles and then sprayed with isopropanol (IPA) at low pressure to remove organic particles. This was followed by a gentle wiping of the coupon with a microfiber cloth to remove any strongly adhered particles. Cleaning took place every four weeks.
The WCA was measured once per week on coupons from each coating (A and B). An additional measurement was made after weather events, such as frost. For the WCA, the bottom corner of the coupon was cleaned prior to measurement. The rack was then tilted to a 0° angle (Figure 4b), and a drop of DI H2O was applied on the cleaned surface of the coating. Images of the droplet were obtained from different perspectives, and these images were then analysed using the Contact Angle Plugin of the ImageJ software to obtain the WCA. At least two images of the droplet were used to calculate the average WCA.
After the coupons were removed, transmittance was measured using an Agilent Cary 50 UV-Vis spectrophotometer at Aalborg University, Denmark. The transmittance of coated coupons was measured and compared to an uncoated, unexposed reference coupon in the wavelength range of 350–800 nm. Typically, 4–8 measurements were performed across the surface of the coupon, and they were then averaged. Only two measurements were performed on the uncoated uncleaned coupon at week 24, as only a small part of this coupon was cleaned. Coupons were then sent at monthly intervals to Loughborough University for analysis using scanning electron microscopy (SEM), energy-dispersive X-ray spectroscopy (EDX), and X-ray photoelectron spectroscopy (XPS). Laboratory testing methods such as UV exposure and damp heat were performed at Loughborough University using methods described by Isbilir et al. [8,9]. Abrasion tests were also performed according to the following standards: ISO 11998 and 9211-4, ASTM D2486, D24213, D4828 and D3450, and BS EN 1096-2. The results of these laboratory-based tests and the degradation mechanisms observed will be presented elsewhere.

2.3. Weather and Environment

Esbjerg in Denmark is classified as having an oceanic climate (Köppen climate Cfb), experiencing mild temperatures and precipitation throughout the year. During the 24 weeks of exposure, Esbjerg experienced temperatures from −4.3 to +31.8 °C, average relative humidity (RH) of 80.1% ± 10.5%, 289.9 mm of rainfall (87 rainy days), 1121.9 h of sunshine, 5.23 m/s of average wind speed, <20 min of hail, and 0.5 cm of snow. Rain occurred regularly at a low intensity but was fleeting due to passing clouds. Weather data were taken from the Danish Meteorological Institute, where measurements were taken about 11 km away from the exposure site [13]. The coupon rack was placed at the corner of a yard in direct proximity to plants and bushes in an urban area located 2 km away from the coast. A high wall of bushes surrounding the yard caused shading and reduced wind speeds. Therefore, the weather conditions referred to above are maximum values.

3. Results and Discussion

3.1. Coating Durability

3.1.1. Coating Defects and Coating Failure

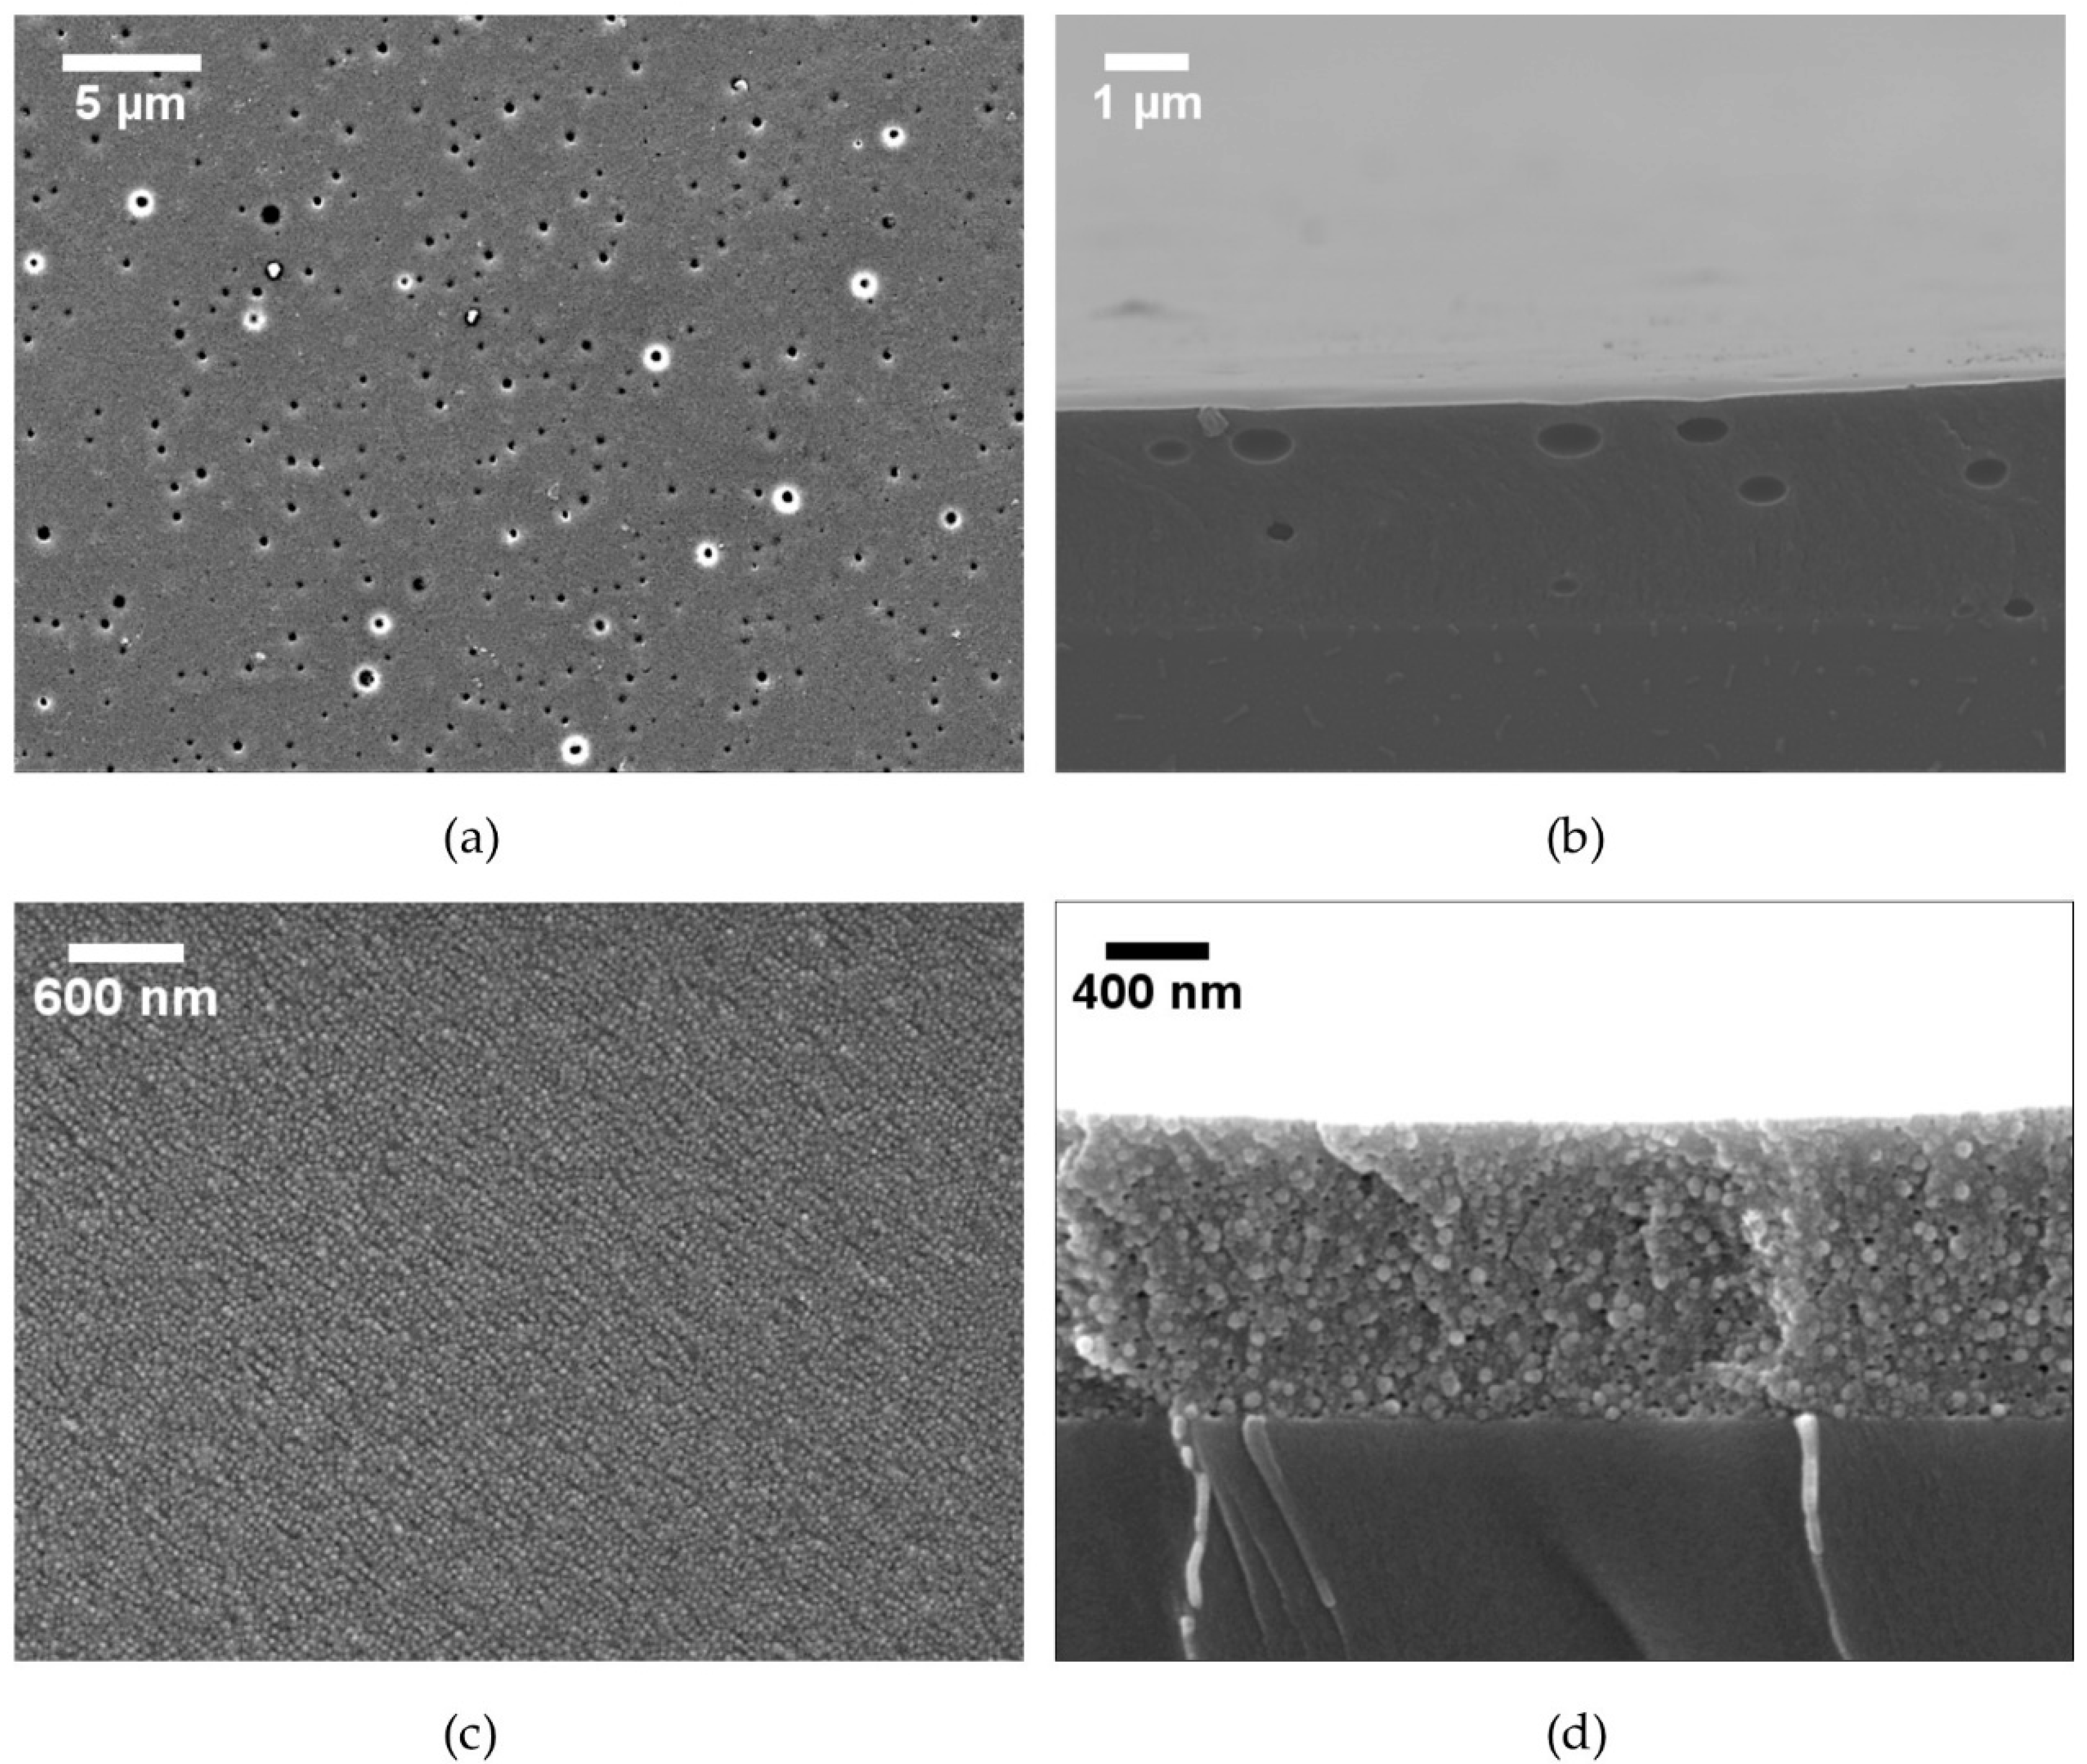
The SEM analysis of the as-received coating A revealed some defects in the surface. Figure 5a shows the presence of several pits along the surface. The coating contained voids visible in the cross-section shown in Figure 5b. Coating defects prior to exposure, as observed on as-received coating A (Figure 5a,b), may lead to early coating failure. SEM images of as-received coating B are shown in Figure 5c,d. Coating B did not show any initial defects.
Figure 6a shows that A began to blister after 4 weeks of outdoor exposure, where it experienced ~100 h of sunlight and ~670 h of high humidity. This is comparable to the laboratory exposure time for blisters to appear at 100 h of UV exposure and at 500 h of damp heat exposure [14]. Although the laboratory exposure times appear to correlate directly with outdoor testing, laboratory coupons were subject to constantly high irradiation (UV) and high temperatures (damp heat), which represent accelerated outdoor conditions. Therefore, the combined stresses of UV and high humidity during outdoor exposure accelerated the failure mechanism, leading to blistering much earlier than expected.
The presence of salts or residual solvents within or under the coating can cause blistering. Water adsorbed on the coating can permeate through the coating, dissolving water-soluble particles beneath. Grant et al. has shown that water can nucleate below 25% RH within surface asperities, such as scratches, cracks, or pits [15]. A solution with a high concentration of dissolved salts is produced beneath the coating, while a low-concentration solution occurs above the coating. The concentration difference produces an osmotic effect, driving more water beneath the coating to dilute the high-concentration solution, producing a liquid-filled blister.
Laboratory tests have revealed that the formation of blisters and subsequent rupture of these blisters can lead to transmission loss [14]. The application of A by spraying was not performed in a clean room; therefore, contaminants, such as water-soluble particles, may have been present on the glass surface prior to coating application. Moreover, the curing may have been insufficient to fully cure the coatings. Traces of solvent were still present in the coating after the curing process, which eventually led to blistering [14].
Figure 6b identifies a dark cracked area of A above a pit on the left and a partially covered exposed pit on the top right of the image at 12 weeks. On another coupon removed 3.3 weeks later (15.3 weeks of exposure), Figure 6c reveals a newly exposed pit on A. Cracks are evident along the edges of the pit. These newly exposed pits could also be due to leaching solvent, which caused A to reduce in coating thickness. Laboratory tests have shown that more pits became visible on the coating after 1000 h of UV exposure [14]. No defects such as pits or blisters were detected by SEM on coating B during its outdoor exposure.
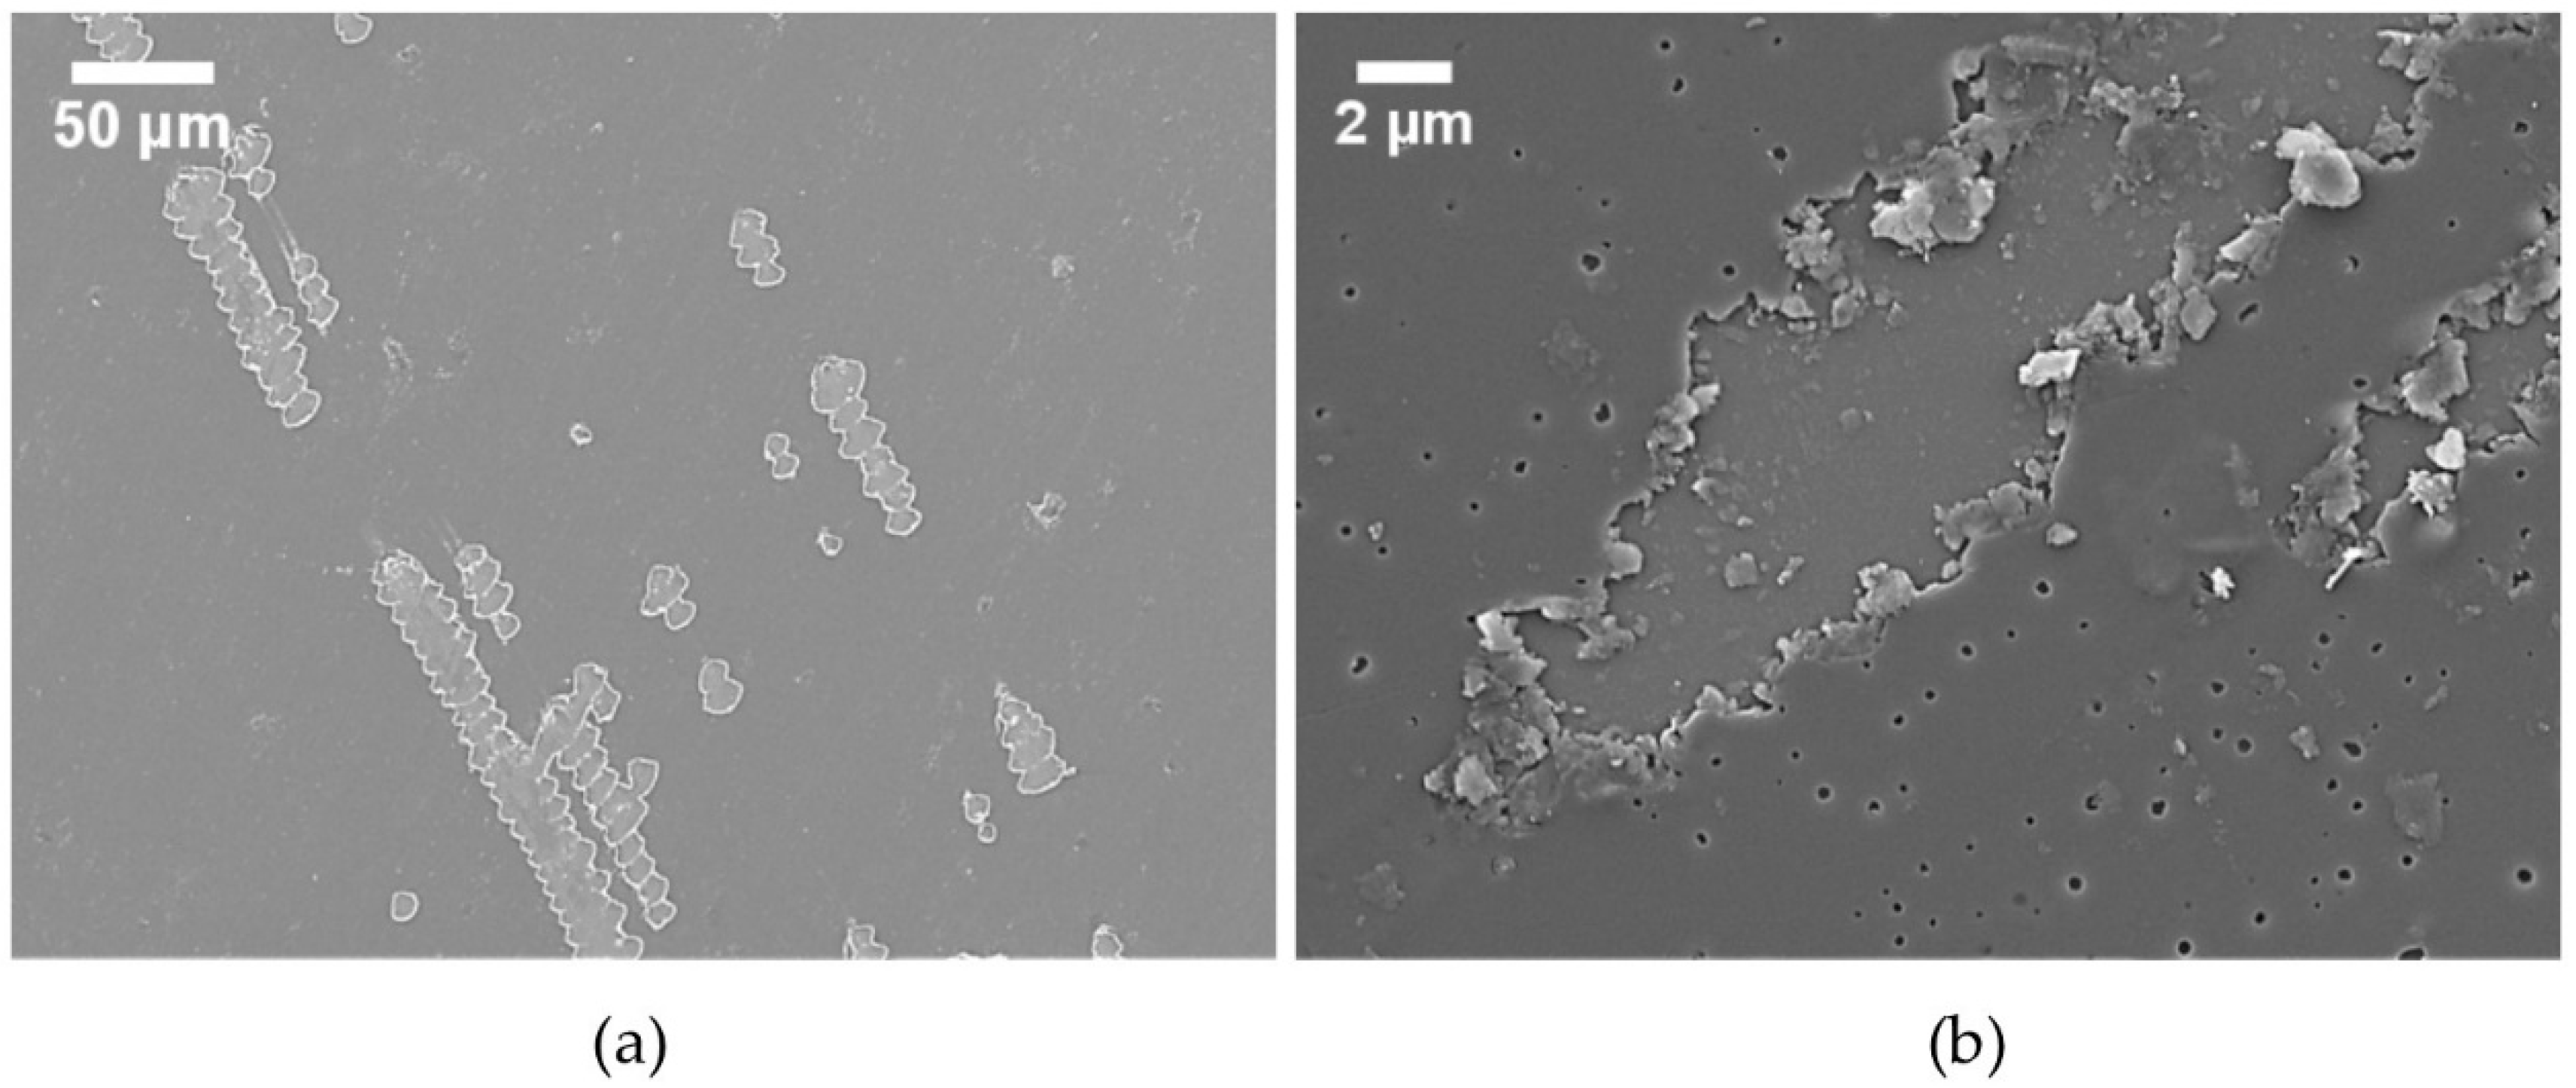
Abrasion damage on a cleaned B coupon was evident after the first cleaning (4 weeks), as shown in Figure 7a. It appears as if a particle was being rolled or dragged linearly across the surface by the microfiber cloth. Coating A also showed abrasion damage, which occurred later than B, at week 15.3 (Figure 7b). These observations suggest that great care must be taken over the coating application method and the choice of cleaning materials and appliances for module cover glass.

3.1.2. Water Contact Angle

Reduction in the WCA is indicative of coating degradation, and the accuracy of the WCA measurement is dependent on the cleanliness of the surface. Cleaning the surface using DI H2O, IPA, and a microfiber cloth proved to be the most effective method to remove soiling because simple cloth-cleaned areas had a WCA up to 25° higher than that of uncleaned areas.
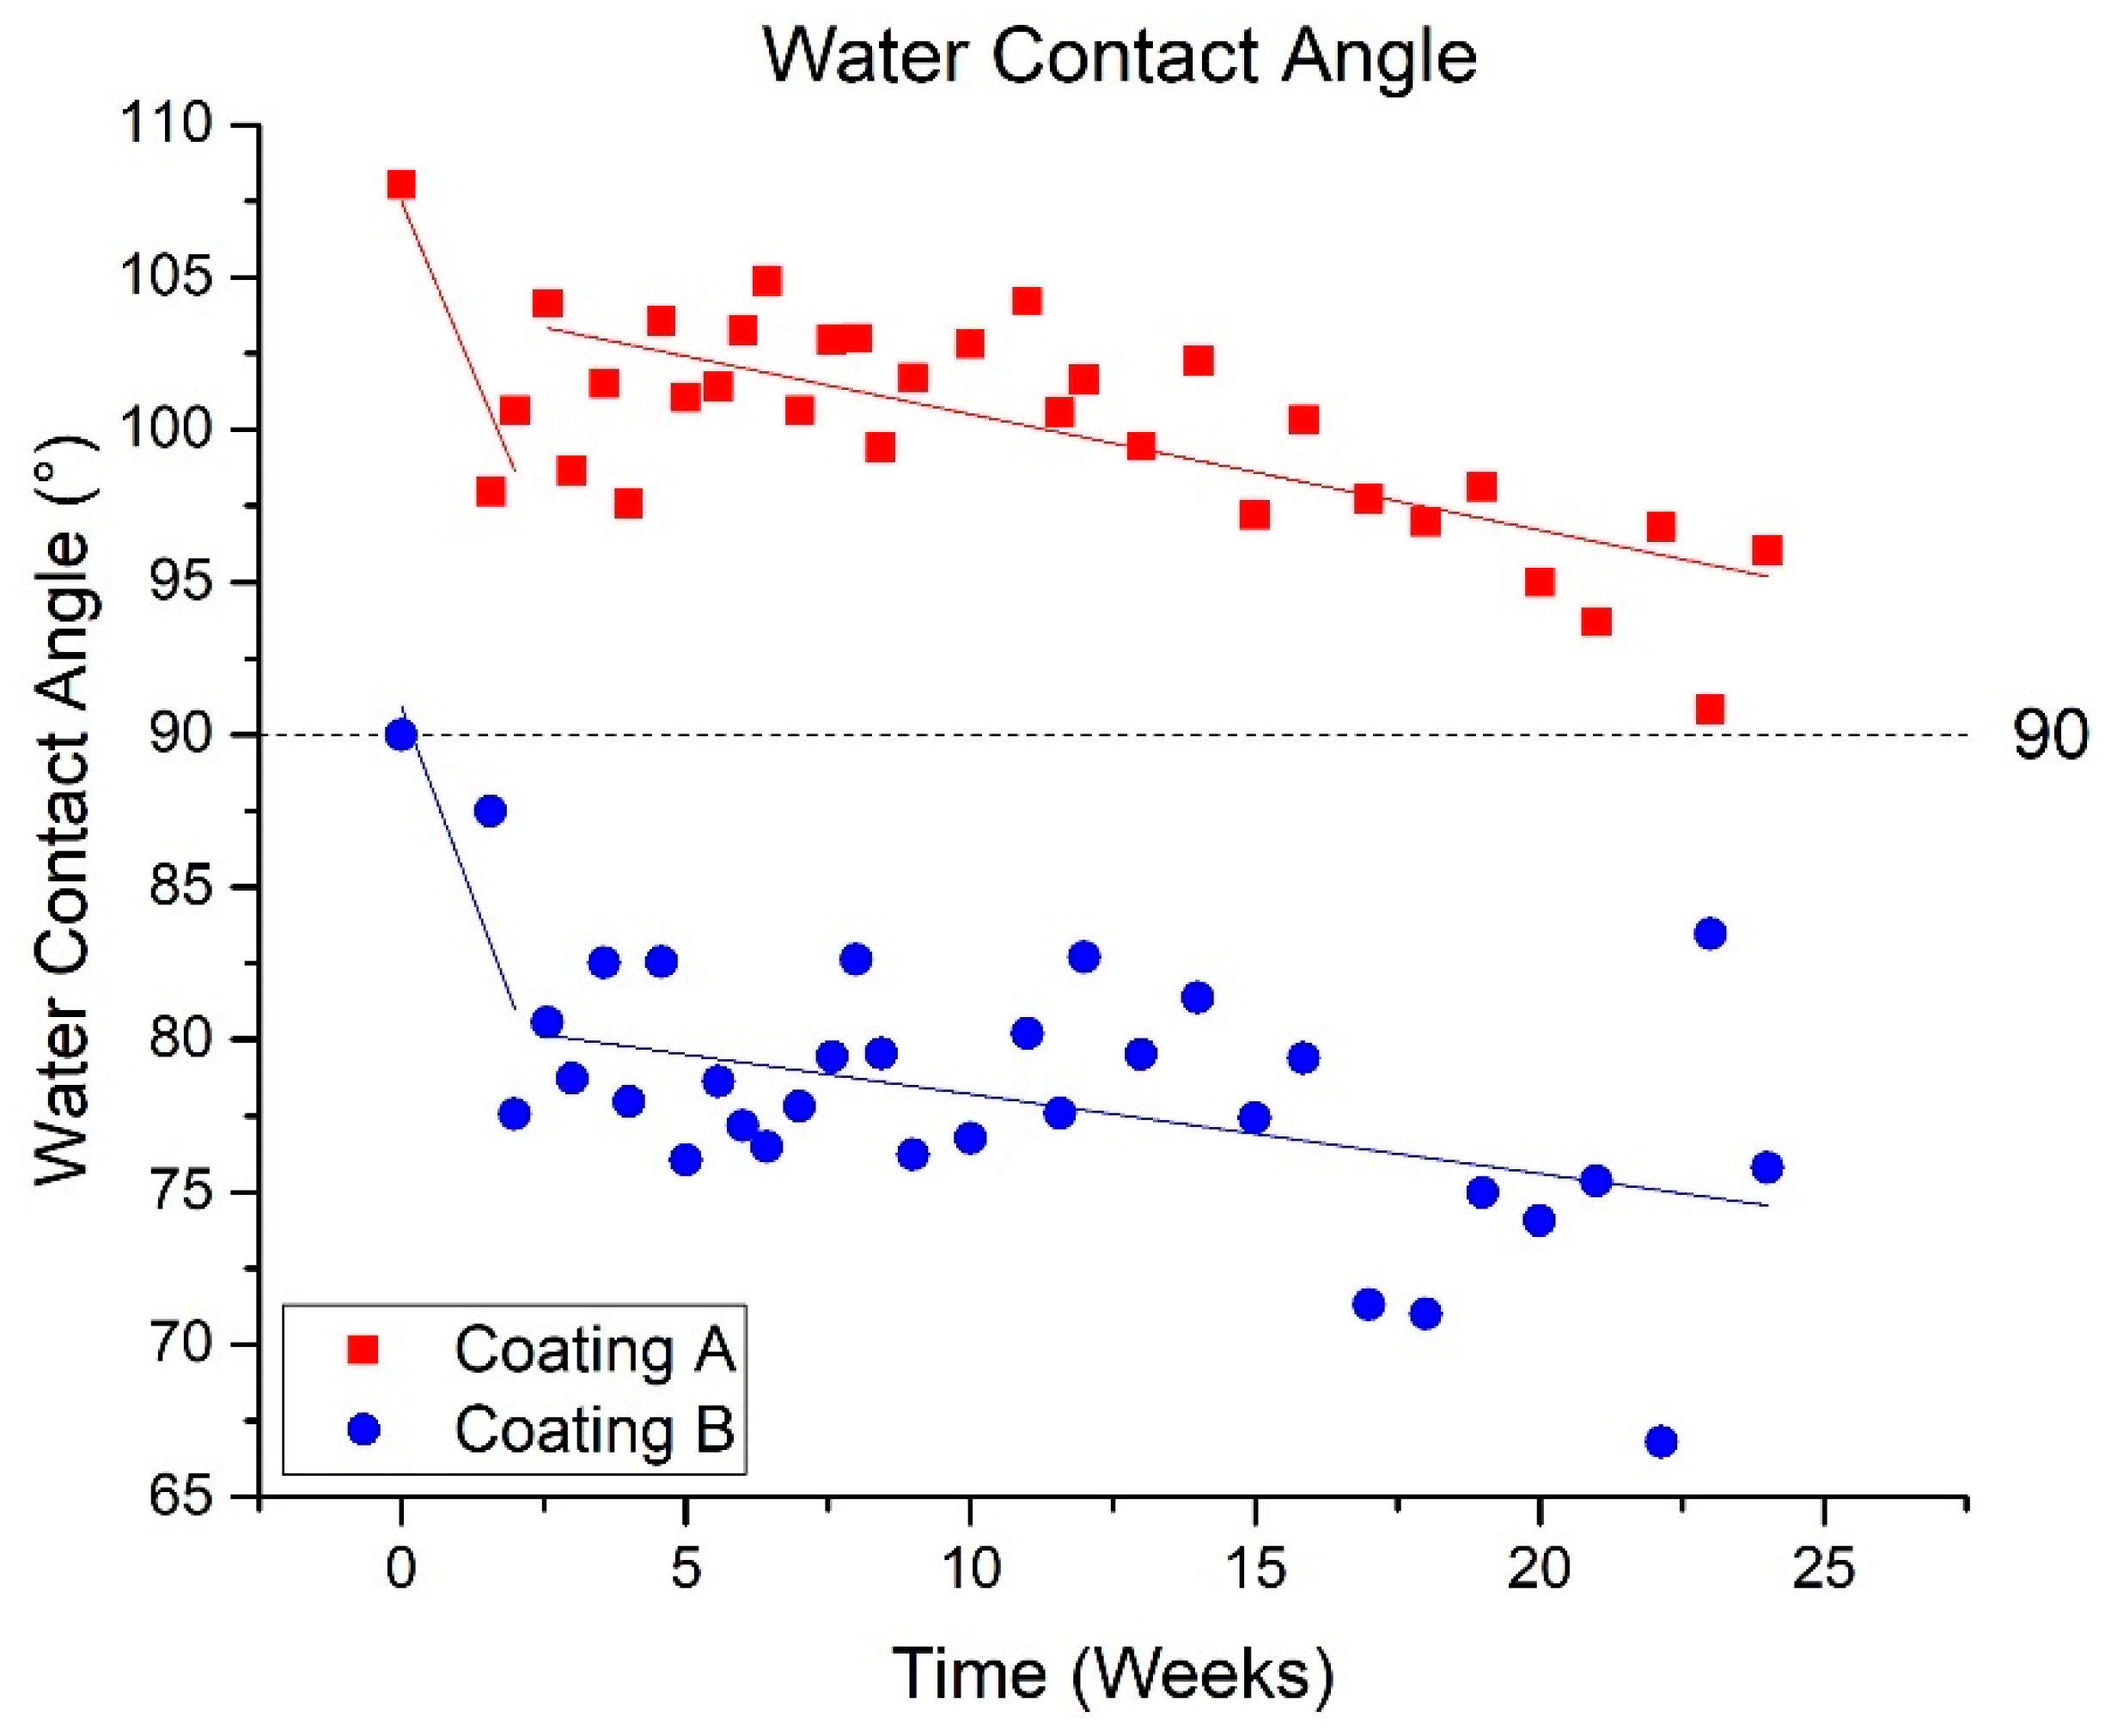
Figure 8 shows the reduction in the WCA measured over outdoor exposure time. The reduction corresponds to gradual coating degradation. A steep reduction in WCA was observed for both A and B following the first two weeks of exposure, and further degradation continued throughout the entire exposure period. It is important to note that these coupons began exposure during the winter month of February where temperatures were often below 0 °C.
Average standard deviations for WCA values in Figure 8 were 2° (1.9%) for A and 4.6° (5.2%) for B. Deviations in WCA measurements are due to several factors including the presence of contamination on the coated surface, variations in coating topography, or errors in imaging and image analysis. The higher standard deviation with B may be caused by the variation in the WCA droplet shape. The droplet shape was not always spherical, resembling an ellipse, which resulted in differing WCA measurements at different perspectives.
The most significant WCA reduction occurred within the first two weeks of exposure for A and B, dropping by 7.4° (6.9%) and 12.4° (13.8%), respectively. The weather in the first two weeks consisted of high humidity, sub-zero temperatures, and rainfall. Rainfall and high humidity caused water to condense on all surface asperities within the coating. When the temperature dropped below 0 °C, the water within these asperities froze and expanded, causing stresses within the coating. Farhadi et al. has shown that cycles of icing/de-icing on superhydrophobic surfaces can decrease WCA [16]. However, sub-zero temperatures persisted throughout the first 8 weeks of exposure, and the sharp decline was observed only in the first two weeks.
Surface analysis measurements using XPS (Table 1) were performed on A. After 24 weeks of exposure, fluorine was reduced by 43.2% relative to the initial value. Fluorine loss on A caused the WCA to decrease over time. Fluorine loss may have been caused by the combined effects of high humidity and UV exposure. A similar decline in WCA was observed for the outdoor exposure of B. However, the only surface damage observed on B was the abrasion caused by cleaning. The presence of Cl on the exposed coatings indicates that Cl is a surface contaminant, likely deposited by wind from the nearby ocean. Cleaning the coupons failed to remove all traces of Cl.

3.2. Soiling

3.2.1. Transmittance

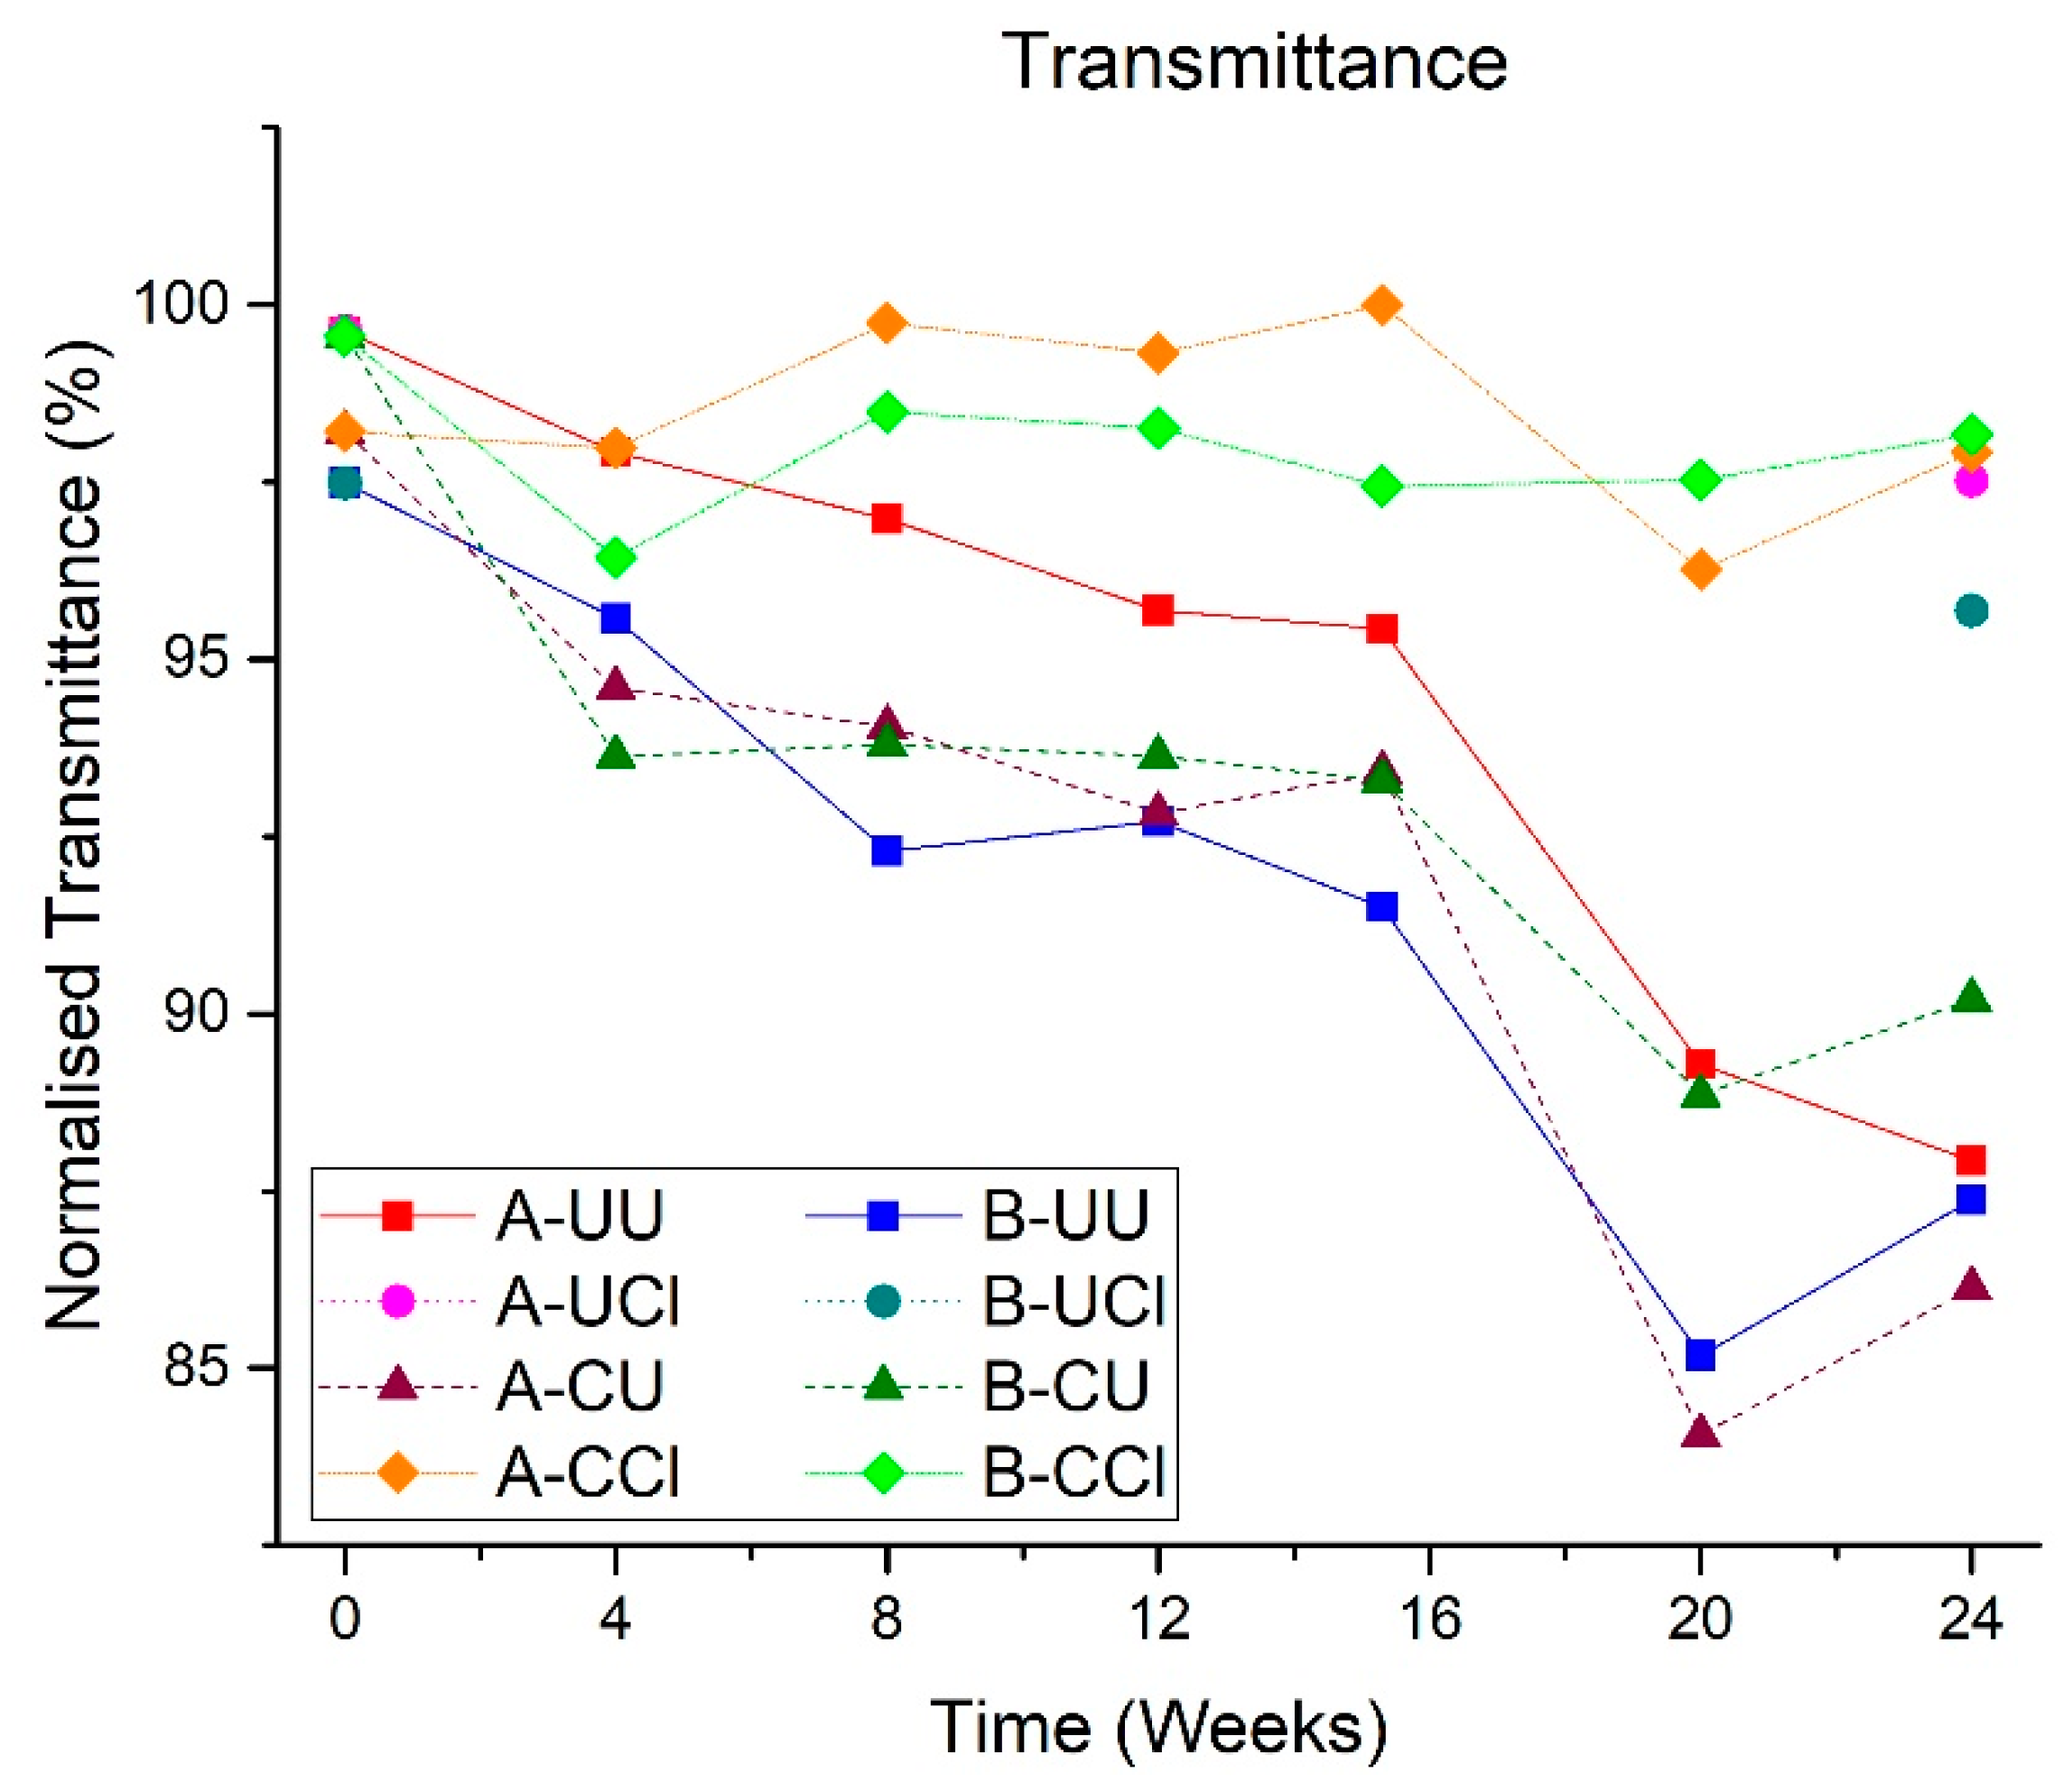
Soiling was observed on all coupons throughout the entire exposure period. Figure 9 shows the progressive decrease in transmittance of the coupons over time. The data are normalised against the maximum value of transmittance for each coating. The glass coupons used for A and B were different in glass type, thickness, and dimensions because each coating source had a preferred glass substrate for the optimum coating application and curing. As a consequence, A and B had different initial transmittances. The average standard deviation in measured transmittance was 1.7% for each type of coupon, with the highest standard deviation at week 24 where the soiling accumulation was the most significant (maximum standard deviation of 5.9% for soiled and 2.5% for cleaned coupons). Prior to exposure, coated A coupons were 1.4% lower in transmittance compared to the corresponding uncoated coupon. This may be due to absorption in the coating.
Coated B coupons began with a higher transmittance compared to their uncoated coupon due to an anti-reflective effect of the coating. The refractive index of B is below that of glass (n = 1.5) and this may be another useful feature of an anti-soiling coating.
At week 20, a rapid deterioration in transmittance occurred for all coupons possibly due to weather changes and the associated release of pollen. In the week prior to removal, higher wind speeds occurred, carrying more dust, and this was associated with a significant decline in transmittance.
At week 24, all A and B coupons showed a slight improvement in transmittance compared to week 20. Typically, there was a maximum rainfall of 2.5 mm per hour throughout exposure. However, in the week prior to removal, there occurred 9 mm of rainfall for one hour. This severe amount of rainfall may have been sufficient to remove loosely adhered soiling and some cementation to increase transmittance, so that only strongly adhered cementation remained on the coupons. In the following days, little to no rainfall occurred, which allowed more dust to settle and cause staining.
All uncleaned coated and uncoated coupons showed a similar rate of decline in transmittance. A 12.1% reduction in the transmittance of coating A occurred, while the reduction for B was 9.4% after 24 weeks without cleaning. Similarly, the transmittance of uncoated coupon A decreased by 11.7%, and uncoated coupon B by 10.1% after 24 weeks without cleaning. The similar decline in transmittance for both uncoated and coated coupons demonstrates their ineffectiveness for anti-soiling in these outdoor conditions.
Cleaned A and B coated and uncoated coupons accumulated considerable amounts of soiling by week 24. The transmittance of periodically cleaned coupons was relatively constant over time, oscillating between 96 and 100% for A and 96.5 and 98.5% for B. However, A exceeded the initial transmittance at week 8, which is possibly due to a coating thickness reduction. Cleaned uncoated coupons were found to have a transmittance 2.1% lower than the initial transmittance for coupon A and 1.8% lower for coupon B, which meant that a single cleaning step after 24 weeks of exposure was enough to increase the transmittance significantly.

3.2.2. Droplet Retention

Rainfall is a natural cleaner. A minimum amount of rainfall is needed to assist the cleaning of a solar panel, and this is clearly site-specific [17,18,19]. During light rain, many droplets were retained on the surface of both coupons, resisting to slide or roll down. This was not expected for coated A coupons, as the ROA in laboratory testing was measured to be 16.3° [14], while the rack was mounted at a 36° tilt angle.
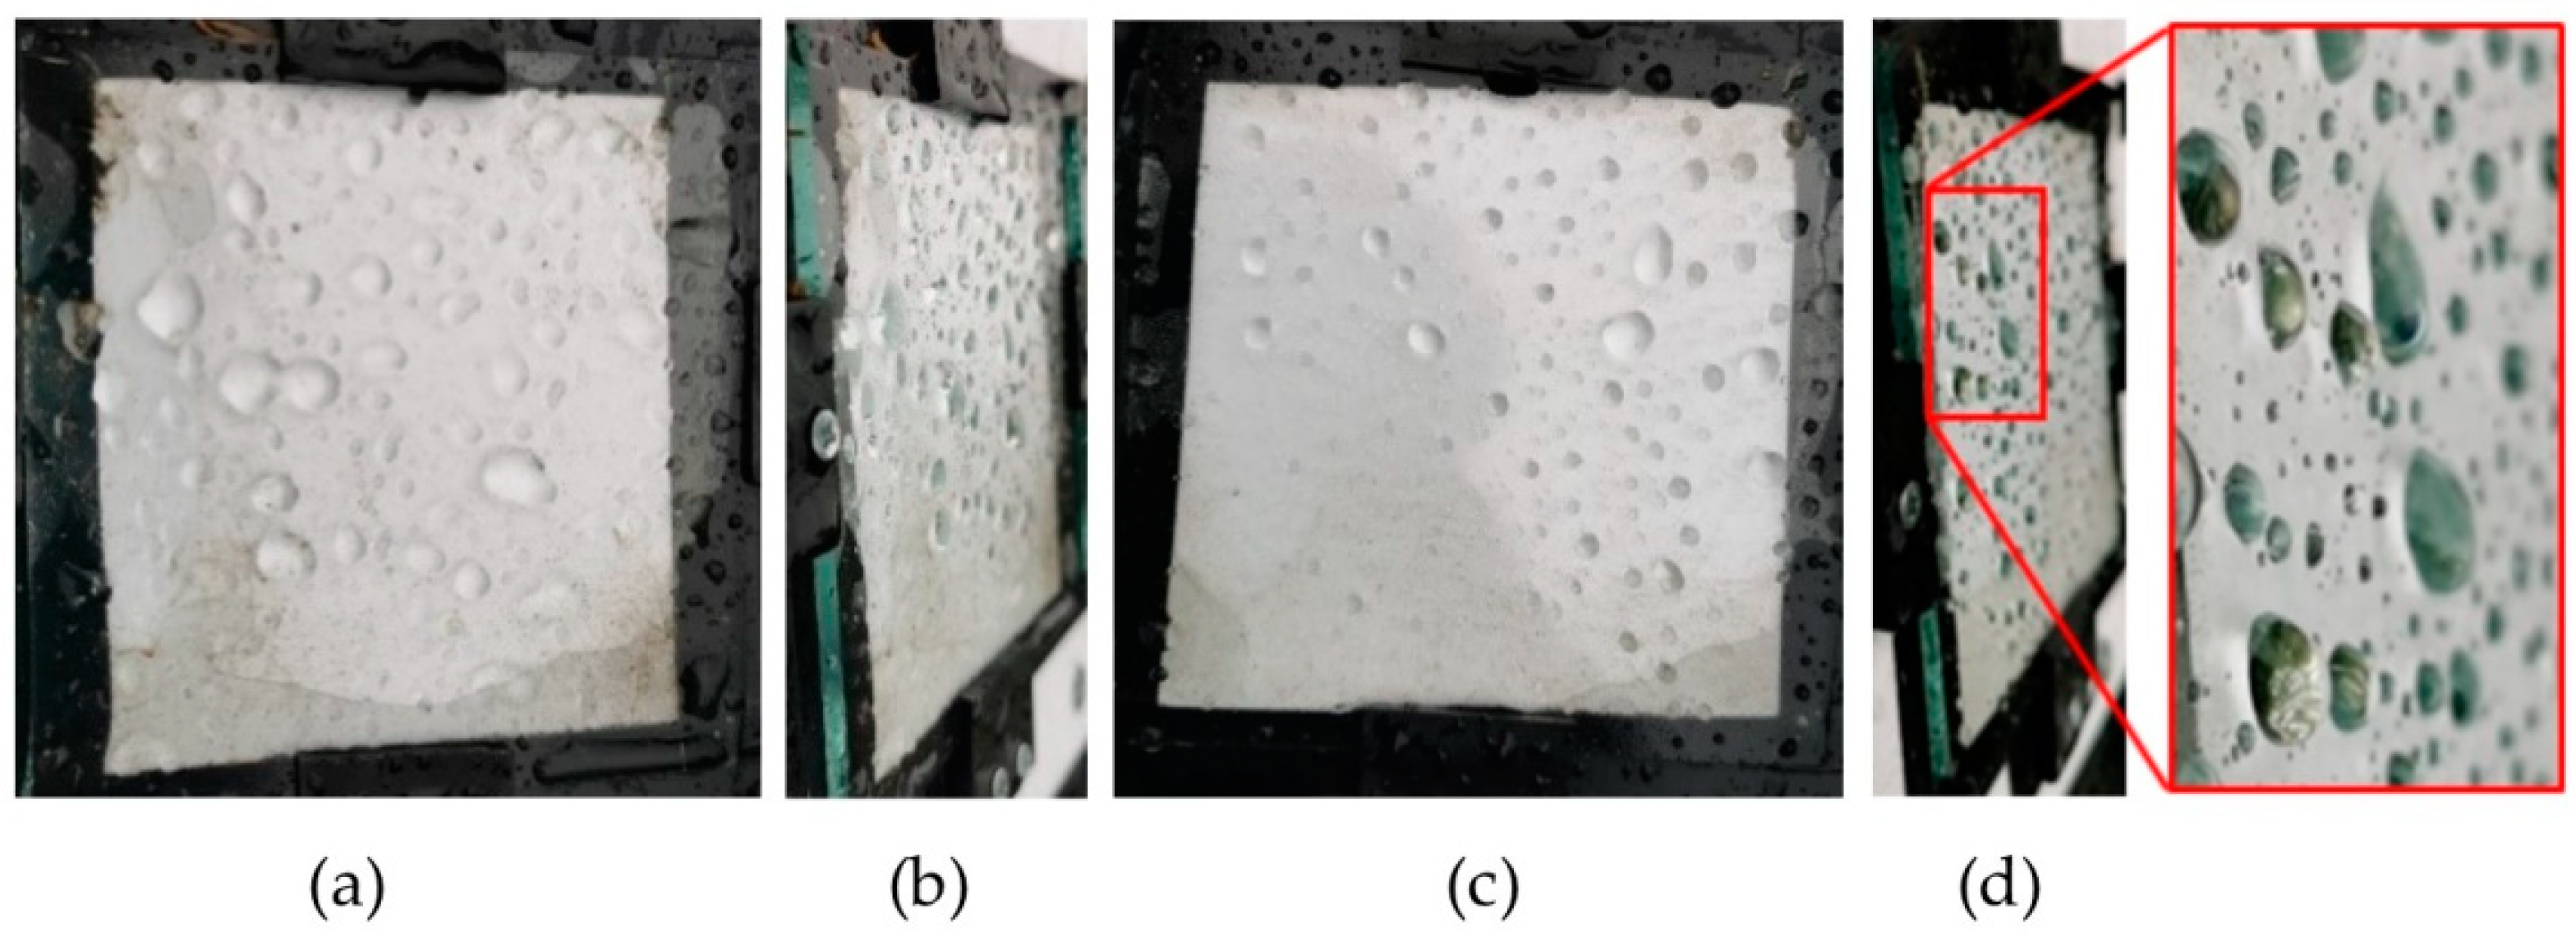
Early in the exposure, droplets on hydrophobic coatings were spherical in shape and appeared small in volume, while droplets on uncoated coupons spread and were flat. Droplets on uncleaned B coupons began to resemble droplets on uncoated uncleaned coupons by week 7.6, and for A by week 12.6. This was due to the lower initial WCA for coating B of 90°. Soiled surfaces reduced the contact area between the droplet and the coating interface, making the coating less effective. This caused the droplets to accumulate over a larger area before sliding down (Figure 10a,b).
Figure 10a,b show an uncleaned coated A coupon that was exposed for 12.6 weeks. For comparison, Figure 10c,d also shows an A coupon at 12.6 weeks, but this coupon was subject to cleaning every 4 weeks, where the last cleaning step took place only 4 days prior to obtaining this image. By cleaning the surface, a layer of soiling is removed, allowing the coating to interact directly with the droplets, as shown in Figure 10c,d. The droplets on the cleaned coupon have a more defined spherical shape (Figure 10c) and a larger outward profile (Figure 10d) compared to the uncleaned A coupon, which resembled the initial condition. However, by week 14.4 (2.4 weeks after the most recent cleaning step), the droplets on the cleaned coupon resembled those in Figure 10a,b, losing shape and profile.
The droplets eventually evaporated, leaving behind dissolved salts and insoluble particles adhered to the coupon. Uncleaned coated and uncoated A coupons at week 8 and 24 are compared in Figure 11. The staining observed at weeks 8 and 24 is attributed to little or no rainfall, while the coupons at other times showed little staining due to rainfall occurring in the days prior to removal.
At week 8, dark droplet outlines are visible on the coated coupon (Figure 11b) compared to the uncoated coupon (Figure 11a). The outlines are not fully rounded in shape but have definition. A difference in the distribution of the staining is also observed between the coated (more concentrated and visible) and the uncoated coupons (more uniformly spread). When small droplets evaporate, the small surface area beneath is left with high concentrations of salts and insoluble particles. The uncoated coupons are hydrophilic, causing the droplets to spread over a larger area. When the water evaporates, the salts and insoluble particles are less concentrated, but occupy a larger area so the staining contrast appears less pronounced.
At week 24, the coated coupon (Figure 11d) and the uncoated coupon (Figure 11c) show a very similar staining pattern. Unlike Figure 11b, the stains are not defined, but they also non-uniformly cover the entire surface. The dark stain near the left side in Figure 11c is a bird dropping. The 24 week coupons have more visible staining than all previous weeks due to the continuous accumulation of soiling. The long-time exposure resulted in a build-up of cementation which eventually overcame the anti-soiling effect of the hydrophobic coating. This explains the similarity in the staining pattern between the uncoated (Figure 11c) and coated coupons (Figure 11d). Droplet retention is undesirable as it prevents the droplet cleaning action from occurring. ROA is more important than WCA in determining the efficacy of hydrophobic coatings for anti-soiling.

3.2.3. Cementation

Cementation occurs when droplets containing dissolved salts and insoluble particles leave precipitated salt anchored to the surface when dried [20]. This process is illustrated schematically in Figure 12. Cementation has also been observed in desert environments where cool nights cause dew formation, trapping any dust within the condensed area [2,21,22]. High temperatures during the daytime then cause evaporation, leaving cementation to form on the surface.
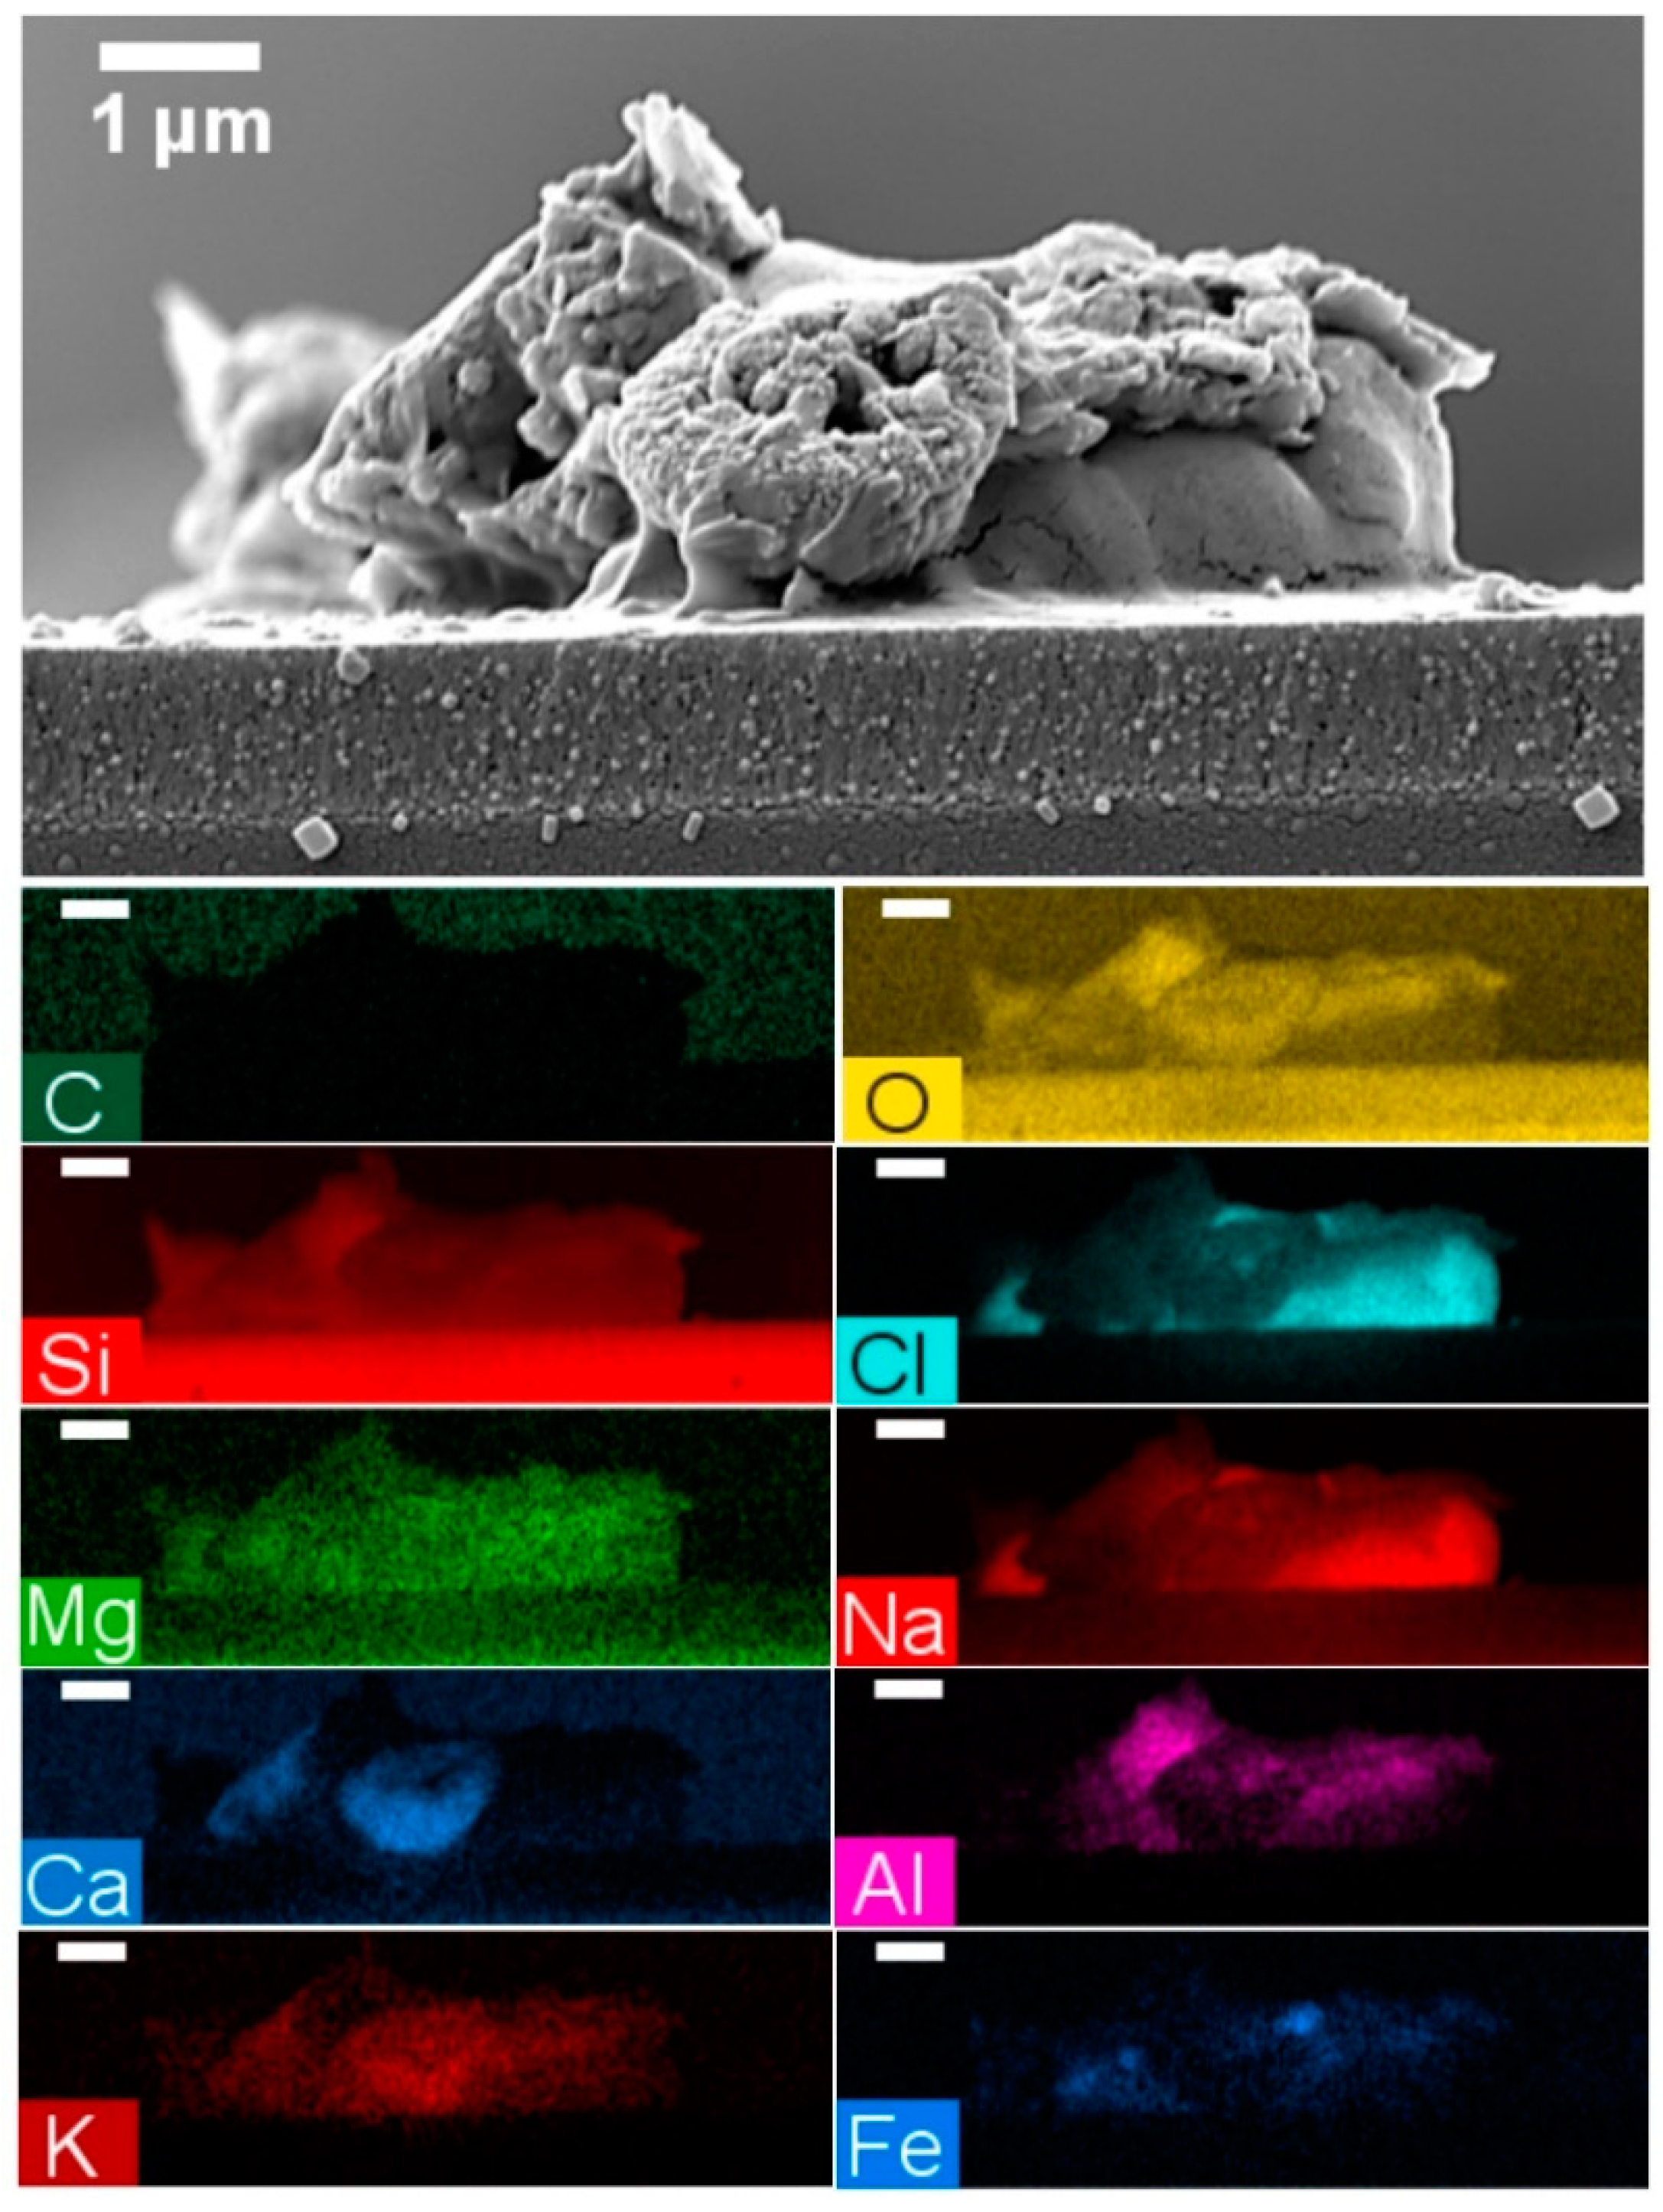
Although Esbjerg does not experience large temperature differences, the highly humid coastal environment promotes condensation in the absence of rain. Salts (hygroscopic species) act as a nucleation point for condensation [23], and have been found to dissolve at 76% RH [20]. Naturally occurring species can dissolve at 70% RH [24]. During the 24 weeks of outdoor exposure, the average humidity was 80%, resulting in repeated wet and dry cycles. High humidity causes water (including soluble particles) to condense between the insoluble particles and the surface. Capillary adhesion forces are most dominant at high humidity [25], which are caused by surface tension at the liquid–solid interface and the Laplace pressure (pressure between the atmosphere and liquid meniscus) [24]. When the liquid evaporates, particles compact together due to surface tension. Soluble particulates, such as salts, solidify forming a bridge between the insoluble particle and the surface, as seen in Figure 13.
EDX elemental analysis of the particle revealed that NaCl acts as the bridge between the dust and the coating surface. The remaining body is composed of elements such as C, O, Si, Mg, C, Al, K, and Fe. Table 2 summarises the elemental composition of various cemented particles and pollen, which were observed on the coatings and correspond to the features shown in Figure 13 and Figure 14a–d. There are high densities of organic particles and several inorganic particles.
In addition to salts, SEM analysis and EDX revealed a number of elements present in the cementation (Table 2). It is important to note that caution should be taken when EDX is used to compare different samples. Its depth of analysis can penetrate below the particles and into the coating and glass. Therefore, the values shown in Table 2 simply indicate the presence of various elements of the sample. Hovmand and Kystol have reported that Na, Mg, Ca, and K originate from sea spray particles, while other elements such as Mg, Ca, Al, and Fe are native to soil dust in southern Scandinavia [26]. Silicon and oxygen are present in the glass, chlorine originates from proximity to the ocean, and fluorine is contained in coating A.
Figure 14 shows a variety of cemented particles observed at different times of outdoor exposure. Particle length, width, and height varied typically in the range of 10–40 µm. Figure 14a shows salt crystals surrounding an unidentified pollen. Figure 14b may be mugwort pollen. Figure 14c shows that even a small contact area between the particle and the coating surface is sufficient for cementation to occur. Figure 14d–f show a variety of particle clusters occupying large areas. Clusters could cover areas up to 0.04 mm2. The structures were complex and showed no resemblance to each other. Figure 14d appears as if many small particulates melded into one structure, whereas Figure 14e appears to be a conglomeration of plant material and dust particles. Figure 14f shows crystallised salt branching out in many directions. No distinct trend was observed between time and cementation size, cementation size between uncoated and coated coupons, and pollen size between uncoated and coated coupons. There also appeared to be no difference between the type of cementation observed on A- and B-coated coupons or uncoated coupons. Each coupon examined revealed new structures and shapes.
Cementation clusters were observed on A and B after one month of exposure and formed over cycles of condensation (through high humidity and rain) and evaporation. Ilse et al. have found that these frequent cycles increase the surface adhesion of dust particles [27]. Even wind speeds up to 10 m/s were unable to remove cemented particles [18]. Wiping the surface was the only effective method to remove most of the cementation. However, even the gentle use of a microfiber cloth is not sufficient to remove all the soiling, as shown in Figure 14c. More work is needed to understand the formation of cementation and its removal to help design an anti-soiling coating suitable for humid environments.

4. Conclusions

The use of transparent hydrophobic coatings has been shown to be a potential solution to the important problem of soiling of solar panels. Their effectiveness to counter the effects of snowfall is demonstrated dramatically in Figure 2. These coatings are used in many applications in other industries including their use on displays and spectacle lenses to make the surfaces easier to clean. However, such applications do not require the coating to be exposed outdoors 24/7, all year round. For outdoor use, the coatings must resist a number of stresses simultaneously. These include temperature cycling, intense UV exposure, humidity, sub-zero temperatures, hail, and abrasion caused naturally by particles or by the action of mechanical cleaning. Outdoor conditions can be very aggressive, and the requirements for durability for solar modules exceed those for all other applications. Outdoor testing is essential before these coatings can be deployed with confidence at scale.
We are also conducting accelerated environmental tests in the laboratory according to IEC test protocols for solar modules. These tests use controlled conditions to determine the vulnerability of a coating to a particular environmental stress. We have previously reported on the development of the tests for hydrophobic coatings [9] and the use of these tests on different types of anti-reflection coatings [28,29,30]. These tests are now being used on candidate hydrophobic coatings to discover the degradation mechanisms that must be addressed before the coatings can be used in the field.
In this paper, we have exposed candidate coatings for up to 24 weeks outdoors in a coastal location in Denmark. Surprisingly, the coatings began to degrade quickly, and the effect was clear after only two weeks of exposure. Degradation resulted in decreasing water contact angle and increasing roll-off angles. As observed by Bhaduri et al., the degradation was much faster than anticipated because the outdoor environment combines the stresses tested in the laboratory [31]. Degradation was caused by a number of mechanisms including solvent release, fluorine loss, thinning of the coating, and increasing surface macro-roughness.
Cycles of light rainfall and evaporation combined with a humid and salty environment led to the formation of well-adhered cementation on all coated and uncoated coupons. The onset of cementation was linked to raindrops being retained on the coating surface. As the droplets evaporate, salts are deposited to nucleate the cementation structure. Hence, to avoid this process, the roll-off angle must be much lower than the module tilt angle. The roll-off angle is much more important than the water contact angle, although the two measurements are related. We did not observe any consistent structure or size of the cementation, but the presence of inorganic salts was a common feature. It may be that this phenomenon was exacerbated by the coastal location of the tests. The cementation was strongly adhered to the surfaces, and cleaning with a microfiber cloth was necessary to remove it and regain almost full transmittance. The use of a microfiber cloth and the presence of cementation debris did cause abrasion of the coating.
Although the coatings tested here showed satisfactory self-cleaning properties only for a short time, their potential as a solution to the module soiling problem is clear. These outdoor tests indicate that the coatings should be super-hydrophobic with a much higher water contact angle (>130°) and a roll-off angle substantially less than the tilt angle of the module and ideally <10°. Abrasion resistance is also a requirement to prevent scratching during cleaning. Super-hydrophobic coatings have very low surface energy to minimise adhesion. Low-energy surfaces may be cleaned using compressed air, which would be ideal for near-equatorial regions where solar panels are held close to horizontal and water is a scarce resource. The results of outdoor testing, as reported here, will inform the ongoing development and specification of viable anti-soiling coatings for solar modules.

Author Contributions

G.C.O. performed WCA and transmittance measurements and wrote the original draft; F.L. performed SEM, EDX, and XPS analysis; F.B. conducted laboratory tests (e.g., damp heat, UV exposure); S.U. performed SEM and XPS analysis and edited; B.S. and K.L.B. deposited coating A and demonstrated use in snowfall conditions; J.M.W. supervised, reviewed, and edited. All authors have read and agreed to the published version of the manuscript.

Funding

Innovate UK project ‘Always Clean’ (103501).

Acknowledgments

The authors are grateful to Aalborg University for use of the UV-vis spectrophotometer and to Mike C. Oehler for building the coupon support structure.

Conflicts of Interest

The authors declare no conflict of interest.

References

  1. Sayyah, A.; Horenstein, M.N.; Mazumder, M.K. Energy yield loss caused by dust deposition on photovoltaic panels. Sol. Energy 2014, 107, 576–604. [Google Scholar] [CrossRef]
  2. Sarver, T.; Al-Qaraghuli, A.; Kazmerski, L.L. A comprehensive review of the impact of dust on the use of solar energy: History, investigations, results, literature, and mitigation approaches. Renew. Sustain. Energy Rev. 2013, 22, 698–733. [Google Scholar] [CrossRef]
  3. Bhaduri, S.; Zachariah, S.; Kazmerski, L.L.; Kavaipatti, B.; Kottantharayil, A. Soiling loss on PV modules at two locations in India studied using a water based artificial soiling method. In Proceedings of the IEEE 44th Photovoltaic Specialist Conference (PVSC 2017), Washington, DC, USA, 25–30 June 2017; pp. 2799–2803. [Google Scholar]
  4. Piliougine, M.; Cañete, C.; Moreno, R.; Carretero, J.; Hirose, J.; Ogawa, S.; Sidrach-de-Cardona, M. Comparative analysis of energy produced by photovoltaic modules with anti-soiling coated surface in arid climates. Appl. Energy 2013, 112, 626–634. [Google Scholar] [CrossRef]
  5. Brophy, B.; Abrams, Z.; Gonsalves, P.; Christy, K. Field performance and persistence of anti-soiling coatings on photovoltaic glass. In Proceedings of the 31st European Photovoltaic Solar Energy Conference and Exhibition (EU PVSEC 2015), Hamburg, Germany, 14–18 September 2015; pp. 2598–2602. [Google Scholar]
  6. Polizos, G.; Sharma, J.K.; Smith, D.B.; Tuncer, E.; Park, J.; Voylov, D.; Sokolov, A.P.; Meyer, H.M., III; Aman, M. Anti-soiling and highly transparent coatings with multi-scale features. Sol. Energy Mater. Sol. Cells 2018, 188, 255–262. [Google Scholar] [CrossRef]
  7. Quan, Y.Y.; Zhang, L.Z. Experimental investigation of the anti-dust effect of transparent hydrophobic coatings applied for solar cell covering glass. Sol. Energy Mater. Sol. Cells 2017, 160, 382–389. [Google Scholar] [CrossRef]
  8. Isbilir, K.; Lisco, F.; Womack, G.; Abbas, A.; Walls, J.M. Testing of an Anti-Soiling Coating for PV Module Cover Glass. In Proceedings of the 2018 IEEE 7th World Conference on Photovoltaic Energy Conversion (WCPEC 2018) (A Joint Conference of 45th IEEE PVSC, 28th PVSEC & 34th EU PVSEC), Waikoloa Village, HI, USA, 10–15 June 2018. [Google Scholar]
  9. Isbilir, K.; Maniscalco, B.; Gottschalg, R.; Walls, J.M. Test Methods for Hydrophobic Coatings on Solar Cover Glass. In Proceedings of the 44th IEEE Photovoltaic Specialist Conference (PVSC 44), Washington, DC, USA, 25–30 June 2017; pp. 2827–2832. [Google Scholar]
  10. Strauss, B.; Lisco, F.; Bukhari, F.; Walls, J.M.; Barth, K.L. Novel Hydrophobic Coatings for Soiling Mitigation in the PV Industry: Durability and Anti-Soiling Demonstrations. In Proceedings of the 46th IEEE Photovoltaic Specialists Conference (PVSC 46), Chicago, IL, USA, 16–21 June 2019. [Google Scholar]
  11. Bukhari, S.F.; Lisco, F.; Bozorgzad Moghim, T.; Taylor, A.; Walls, J.M. Development of a Hydrophobic, Anti-soiling coating for PV Module Cover Glass. In Proceedings of the 46th IEEE Photovoltaic Specialists Conference (PVSC 46), Chicago, IL, USA, 16–21 June 2019. [Google Scholar]
  12. Jacobson, M.Z.; Jadhav, V. World estimates of PV optimal tilt angles and ratios of sunlight incident upon tilted and tracked PV panels relative to horizontal panels. Sol. Energy 2018, 169, 55–66. [Google Scholar] [CrossRef]
  13. Danmarks Meteorologiske Institut. Vejrarkiv. Available online: https://www.dmi.dk/vejrarkiv/ (accessed on 23 August 2019).
  14. Strauss, B. Investigating the Suitability of Existing Commercial Hydrophobic Coatings for Soiling Mitigation in the Photovoltaic Industry. Master’s Thesis, Colorado State University, Fort Collins, CO, USA, 2019. [Google Scholar]
  15. Grant, D. The Surface Resistivity of a Cooled Glass Surface at the Onset of Water Vapour Condensation. Ph.D. Thesis, Durham University, Durham, UK, May 1974. [Google Scholar]
  16. Farhadi, S.; Farzaneh, M.; Kulinich, S.A. Applied Surface Science Anti-icing performance of superhydrophobic surfaces. Appl. Surf. Sci. 2011, 257, 6264–6269. [Google Scholar] [CrossRef]
  17. Elminir, H.K.; Ghitas, A.E.; Hamid, R.H.; El-Hussainy, F.; Beheary, M.M.; Abdel-Moneim, K.M. Effect of dust on the transparent cover of solar collectors. Energy Convers. Manag. 2006, 47, 3192–3203. [Google Scholar] [CrossRef]
  18. Ilse, K.K.; Figgis, B.W.; Naumann, V.; Hagendorf, C.; Bagdahn, J. Fundamentals of soiling processes on photovoltaic modules. Renew. Sustain. Energy Rev. 2018, 98, 239–254. [Google Scholar] [CrossRef]
  19. Kimber, A.; Mitchell, L.; Nogradi, S.; Wenger, H. The effect of soiling on large grid-connected photovoltaic systems in California and the Southwest Region of the United States. In Proceedings of the Conference Record of the 2006 IEEE 4th World Conference on Photovoltaic Energy Conversion (WCPEC 4), Waikoloa, HI, USA, 7–12 May 2006. [Google Scholar]
  20. Cuddihy, E.F. Theoretical Considerations of Soil Retention. Sol. Energy Mater. 1980, 3, 21–33. [Google Scholar] [CrossRef]
  21. Ilse, K.K.; Figgis, B.; Khan, M.Z.; Naumann, V.; Hagendorf, C. Dew as a Detrimental Influencing Factor for Soiling of PV Modules. IEEE J. Photovolt. 2019, 9, 287–294. [Google Scholar] [CrossRef]
  22. Ilse, K.K.; Figgis, B.; Werner, M.; Naumann, V.; Hagendorf, C.; Pöllmann, H.; Bagdahn, J. Comprehensive analysis of soiling and cementation processes on PV modules in Qatar. Sol. Energy Mater. Sol. Cells 2018, 186, 309–323. [Google Scholar] [CrossRef]
  23. Lombardo, T.; Ionescu, A.; Chabas, A.; Lefèvre, R.-A.; Ausset, P.; Candau, Y. Dose-response function for the soiling of silica-soda-lime glass due to dry deposition. Sci. Total Environ. 2010, 408, 976–984. [Google Scholar] [CrossRef] [PubMed]
  24. Figgis, B.; Nouviaire, A.; Wubulikasimu, Y.; Javed, W.; Guo, B.; Ait-Mokhtar, A.; Belarbi, R.; Ahzi, S.; Rémond, Y.; Ennaoui, A. Investigation of factors affecting condensation on soiled PV modules. Sol. Energy 2018, 159, 488–500. [Google Scholar] [CrossRef]
  25. Isaifan, R.J.; Johnson, D.; Ackermann, L.; Figgis, B.; Ayoub, M. Evaluation of the adhesion forces between dust particles and photovoltaic module surfaces. Sol. Energy Mater. Sol. Cells 2019, 191, 413–421. [Google Scholar] [CrossRef]
  26. Hovmand, M.F.; Kystol, J. Atmospheric element deposition in southern Scandinavia. Atmos. Environ. 2013, 77, 482–489. [Google Scholar] [CrossRef]
  27. Ilse, K.K.; Rabanal, J.; Schönleber, L.; Khan, M.Z.; Naumann, V.; Hagendorf, C.; Bagdahn, J. Comparing indoor and outdoor soiling experiments for different glass coatings and microstructural analysis of particle caking processes. IEEE J. Photovolt. 2018, 8, 203–209. [Google Scholar] [CrossRef]
  28. Womack, G.; Isbilir, K.; Lisco, F.; Durand, G.; Taylor, A.; Walls, J.M. The performance and durability of single-layer sol-gel anti-reflection coatings applied to solar module cover glass. Surf. Coat. Technol. 2019, 358, 76–83. [Google Scholar] [CrossRef] [Green Version]
  29. Womack, G.; Kaminkski, P.M.; Abbas, A.; Isbilir, K.; Gottschalg, R.; Walls, J.M. Performance and durability of broadband antireflection coatings for thin film CdTe solar cells. J. Vac. Sci. Technol. A 2017, 35, 021201. [Google Scholar] [CrossRef] [Green Version]
  30. Kaminski, P.M.; Womack, G.; Walls, J.M. Broadband anti-reflection coatings for thin film photovoltaics. In Proceedings of the 40th IEEE Photovoltaic Specialist Conference (PVSC 2014), Denver, CO, USA, 8–13 June 2014; pp. 2778–2783. [Google Scholar]
  31. Bhaduri, S.; Alath, A.; Mallick, S.; Shiradkar, N.S.; Kottantharayil, A. Identification of stressors leading to degradation of anti-soiling coating in warm and humid climate zones. IEEE J. Photovolt. 2019, 10. [Google Scholar] [CrossRef]
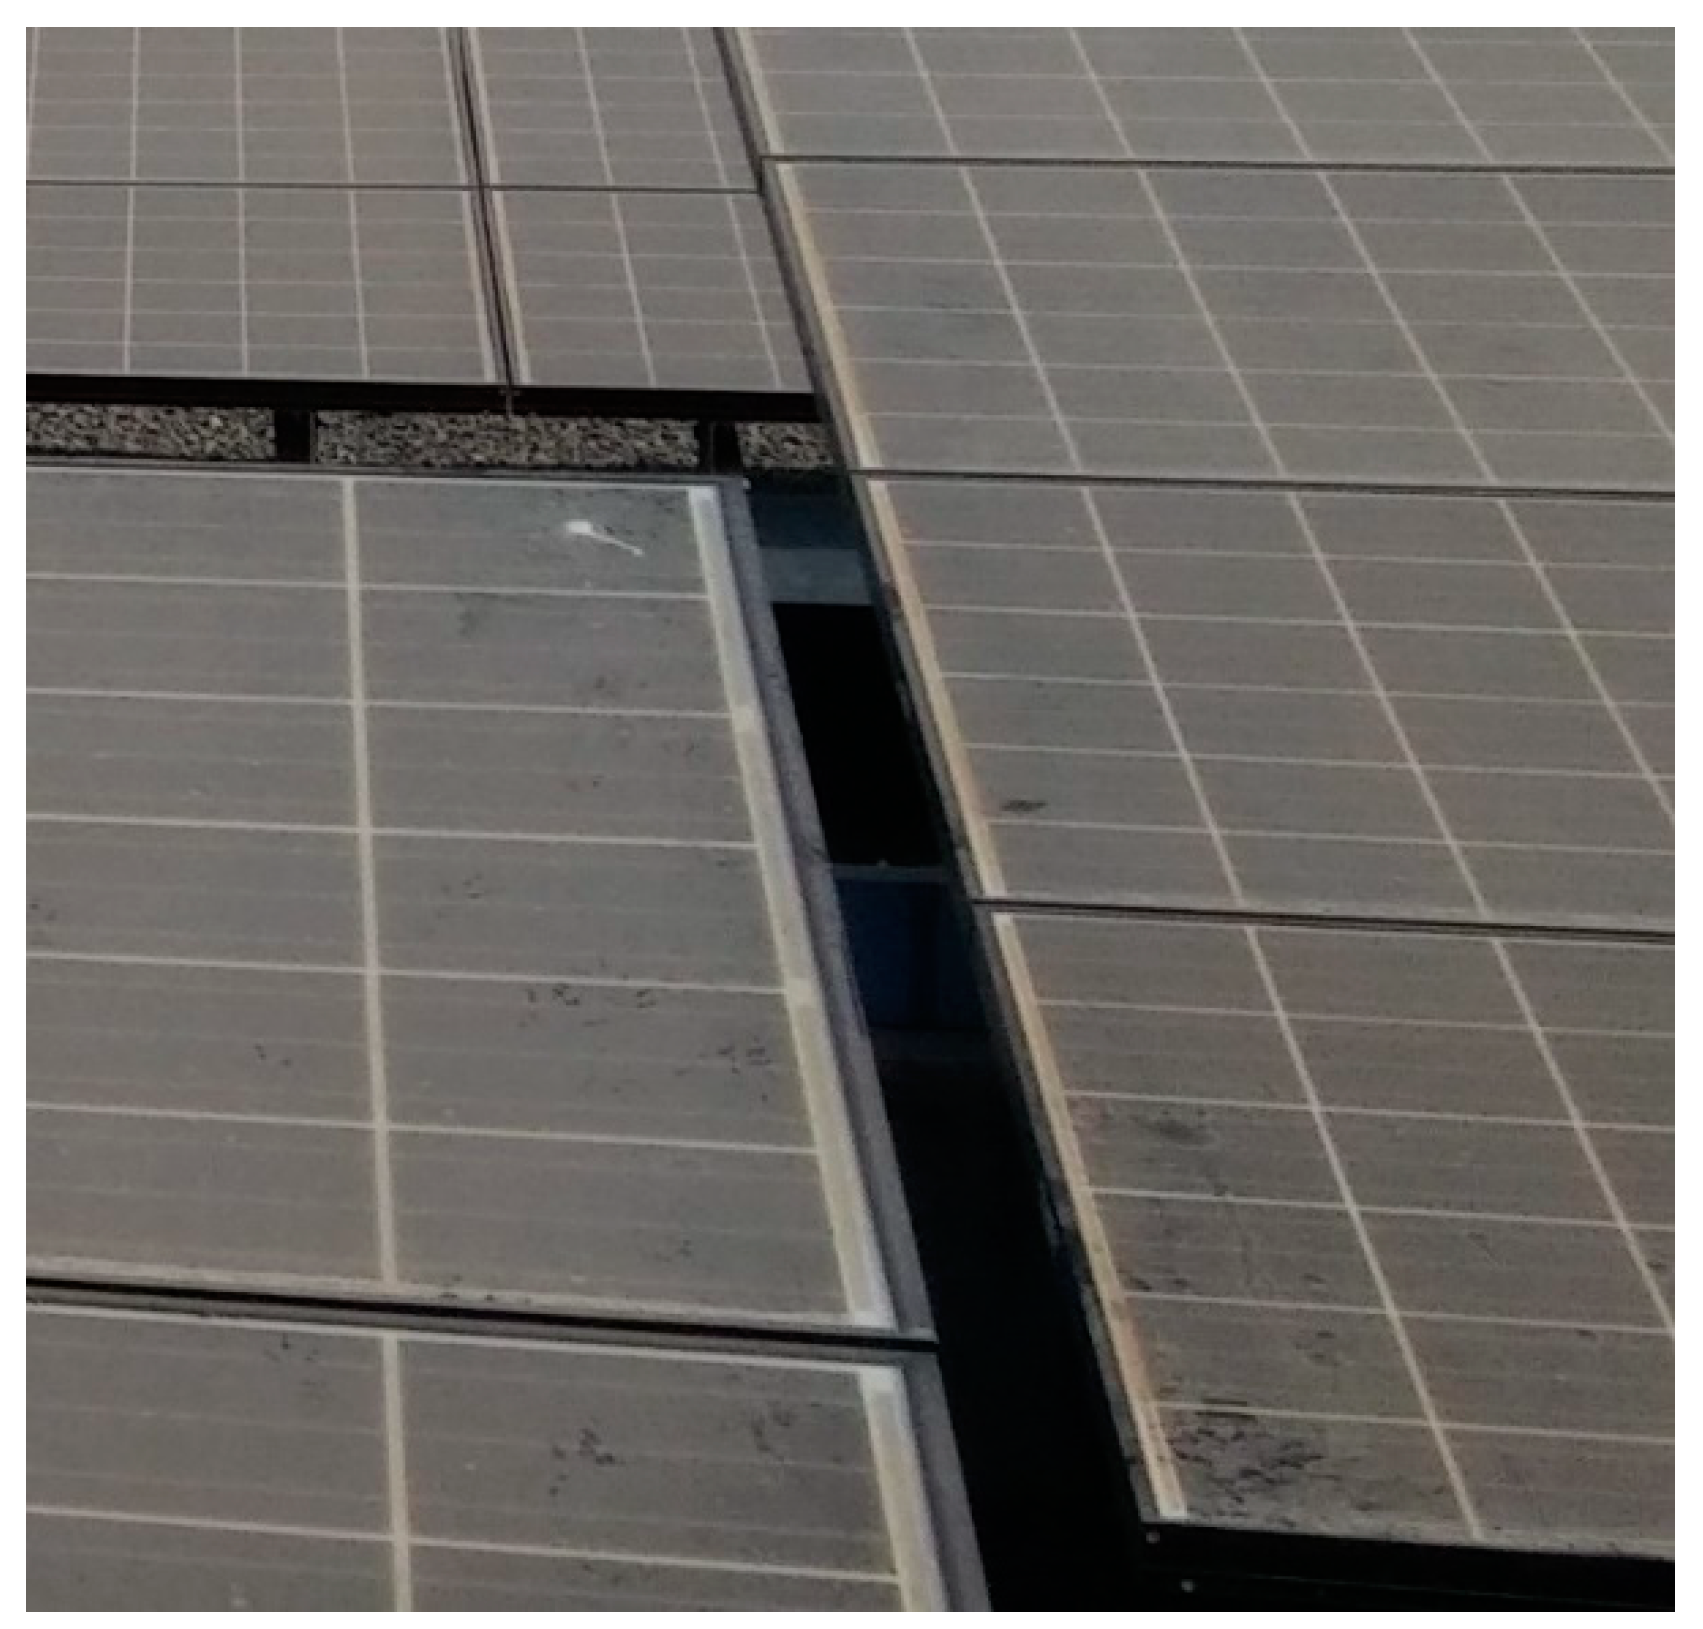
Figure 1. Soiling causes significant losses in the power output of solar modules.
Energies 13 00299 g001
Figure 2. (a) The black panel was coated with a hydrophobic coating (coating A) and continued to produce power after snowfall. All other panels were covered in snow. (b) Following the snow melt, residues were deposited on the uncoated panel (left), while the coated panel (right) remained clean. The anti-soiling effect gradually degraded over a few weeks.
Energies 13 00299 g002
Figure 3. Timeline for coupon removal.
Energies 13 00299 g003
Figure 4. Rack containing the coupons at (a) 36° tilt angle and (b) 0° tilt angle.
Energies 13 00299 g004
Figure 5. SEM images of as-received coupons with A in (a) planar view revealing surface defects and (b) cross-sectional view showing the presence of voids, and B in (c) planar view and (d) cross-sectional view showing no defects.
Energies 13 00299 g005
Figure 6. SEM images of coating A (a) cleaned coupon at 4 weeks, (b) cleaned coupon at 12 weeks, and (c) uncleaned coupon at 15.3 weeks. The arrows point to partially and newly exposed pits.
Energies 13 00299 g006
Figure 7. Abrasion damage caused by cleaning of (a) cleaned B coupon at 4 weeks and (b) cleaned A coupon at 15.3 weeks.
Energies 13 00299 g007
Figure 8. Water contact angle measurements for coated coupons over time. Trendlines are shown as solid lines with corresponding colours. Values above the black dashed line are hydrophobic (>90°) and below this line are hydrophilic (<90°).
Energies 13 00299 g008
Figure 9. Reduction in normalised transmittance for coated and uncoated A and B is shown as a function of outdoor exposure time. Abbreviations: UU—Uncoated uncleaned, UCl—Uncoated cleaned, CU—Coated uncleaned, CCl—Coated cleaned.
Energies 13 00299 g009
Figure 10. Droplet retention on coated A coupon at week 12.6 for uncleaned (a) planar view and (b) side view and for cleaned (c) planar view and (d) side view with close-up.
Energies 13 00299 g010
Figure 11. Uncleaned A coupons after removal at week 8 (a) uncoated, (b) coated, and at week 24 (c) uncoated and (d) coated. Images had contrast enhanced by 2% to make the staining more visible. The circled feature is a bird dropping. The soiling becomes more visible with increasing time of outdoor exposure.
Energies 13 00299 g011
Figure 12. Illustration of the cementation process adapted from Cuddihy [20] and Ilse et al. [18].
Energies 13 00299 g012
Figure 13. SEM and energy-dispersive X-ray spectroscopy (EDX) (coloured elemental images) of cementation on an uncleaned B coupon at week 8. Elements detected are C, O, Si, Cl, Mg, Na, Ca, Al, K, and Fe. The white scale bar represents 1 µm in each image.
Energies 13 00299 g013
Figure 14. A variety of cementation structures have been observed. (a) Pollen with salt crystals on uncleaned uncoated A coupon at week 12, (b) pollen on uncleaned coated A at week 15.3, (c) dust on coated A cleaned at week 8, (d) cluster on coated uncleaned B coupon at week 24, (e) cluster on uncleaned coated B at week 20, and (f) cluster on coated uncleaned A at week 12.
Energies 13 00299 g014
Table 1. X-ray photoelectron spectroscopy (XPS) measurement on cleaned A showing changes in elemental composition.
WeekComposition of Cleaned A (at%)F reduction
F1sO1sC1sSi2pN1sCl2pK2p
028.222.936.410.81.7--
423.123.438.511.21.91.10.918.1%
2416.027.241.013.02.00.8-43.2%
Table 2. EDX analysis showing the elemental composition of soiling corresponding to the images shown in Figure 13 and Figure 14.
FigureDescriptionComposition (at%)
COSiFNaClMgCaAlKFe
Figure 13Dust72.023.62.4 1.20.30.10.10.1
Figure 14aPollen44.734.512.3 4.50.91.61.60.4 0.1
Figure 14bPollen69.520.52.96.00.20.50.10.10.2
Figure 14cDust64.724.83.25.20.70.20.10.10.90.10.1
Figure 14dCluster62.928.65.8 1.7 0.40.30.20.1