Micro Nuclear Reactors: Potential Replacements for Diesel Gensets within Micro Energy Grids


Abstract
1. Introduction
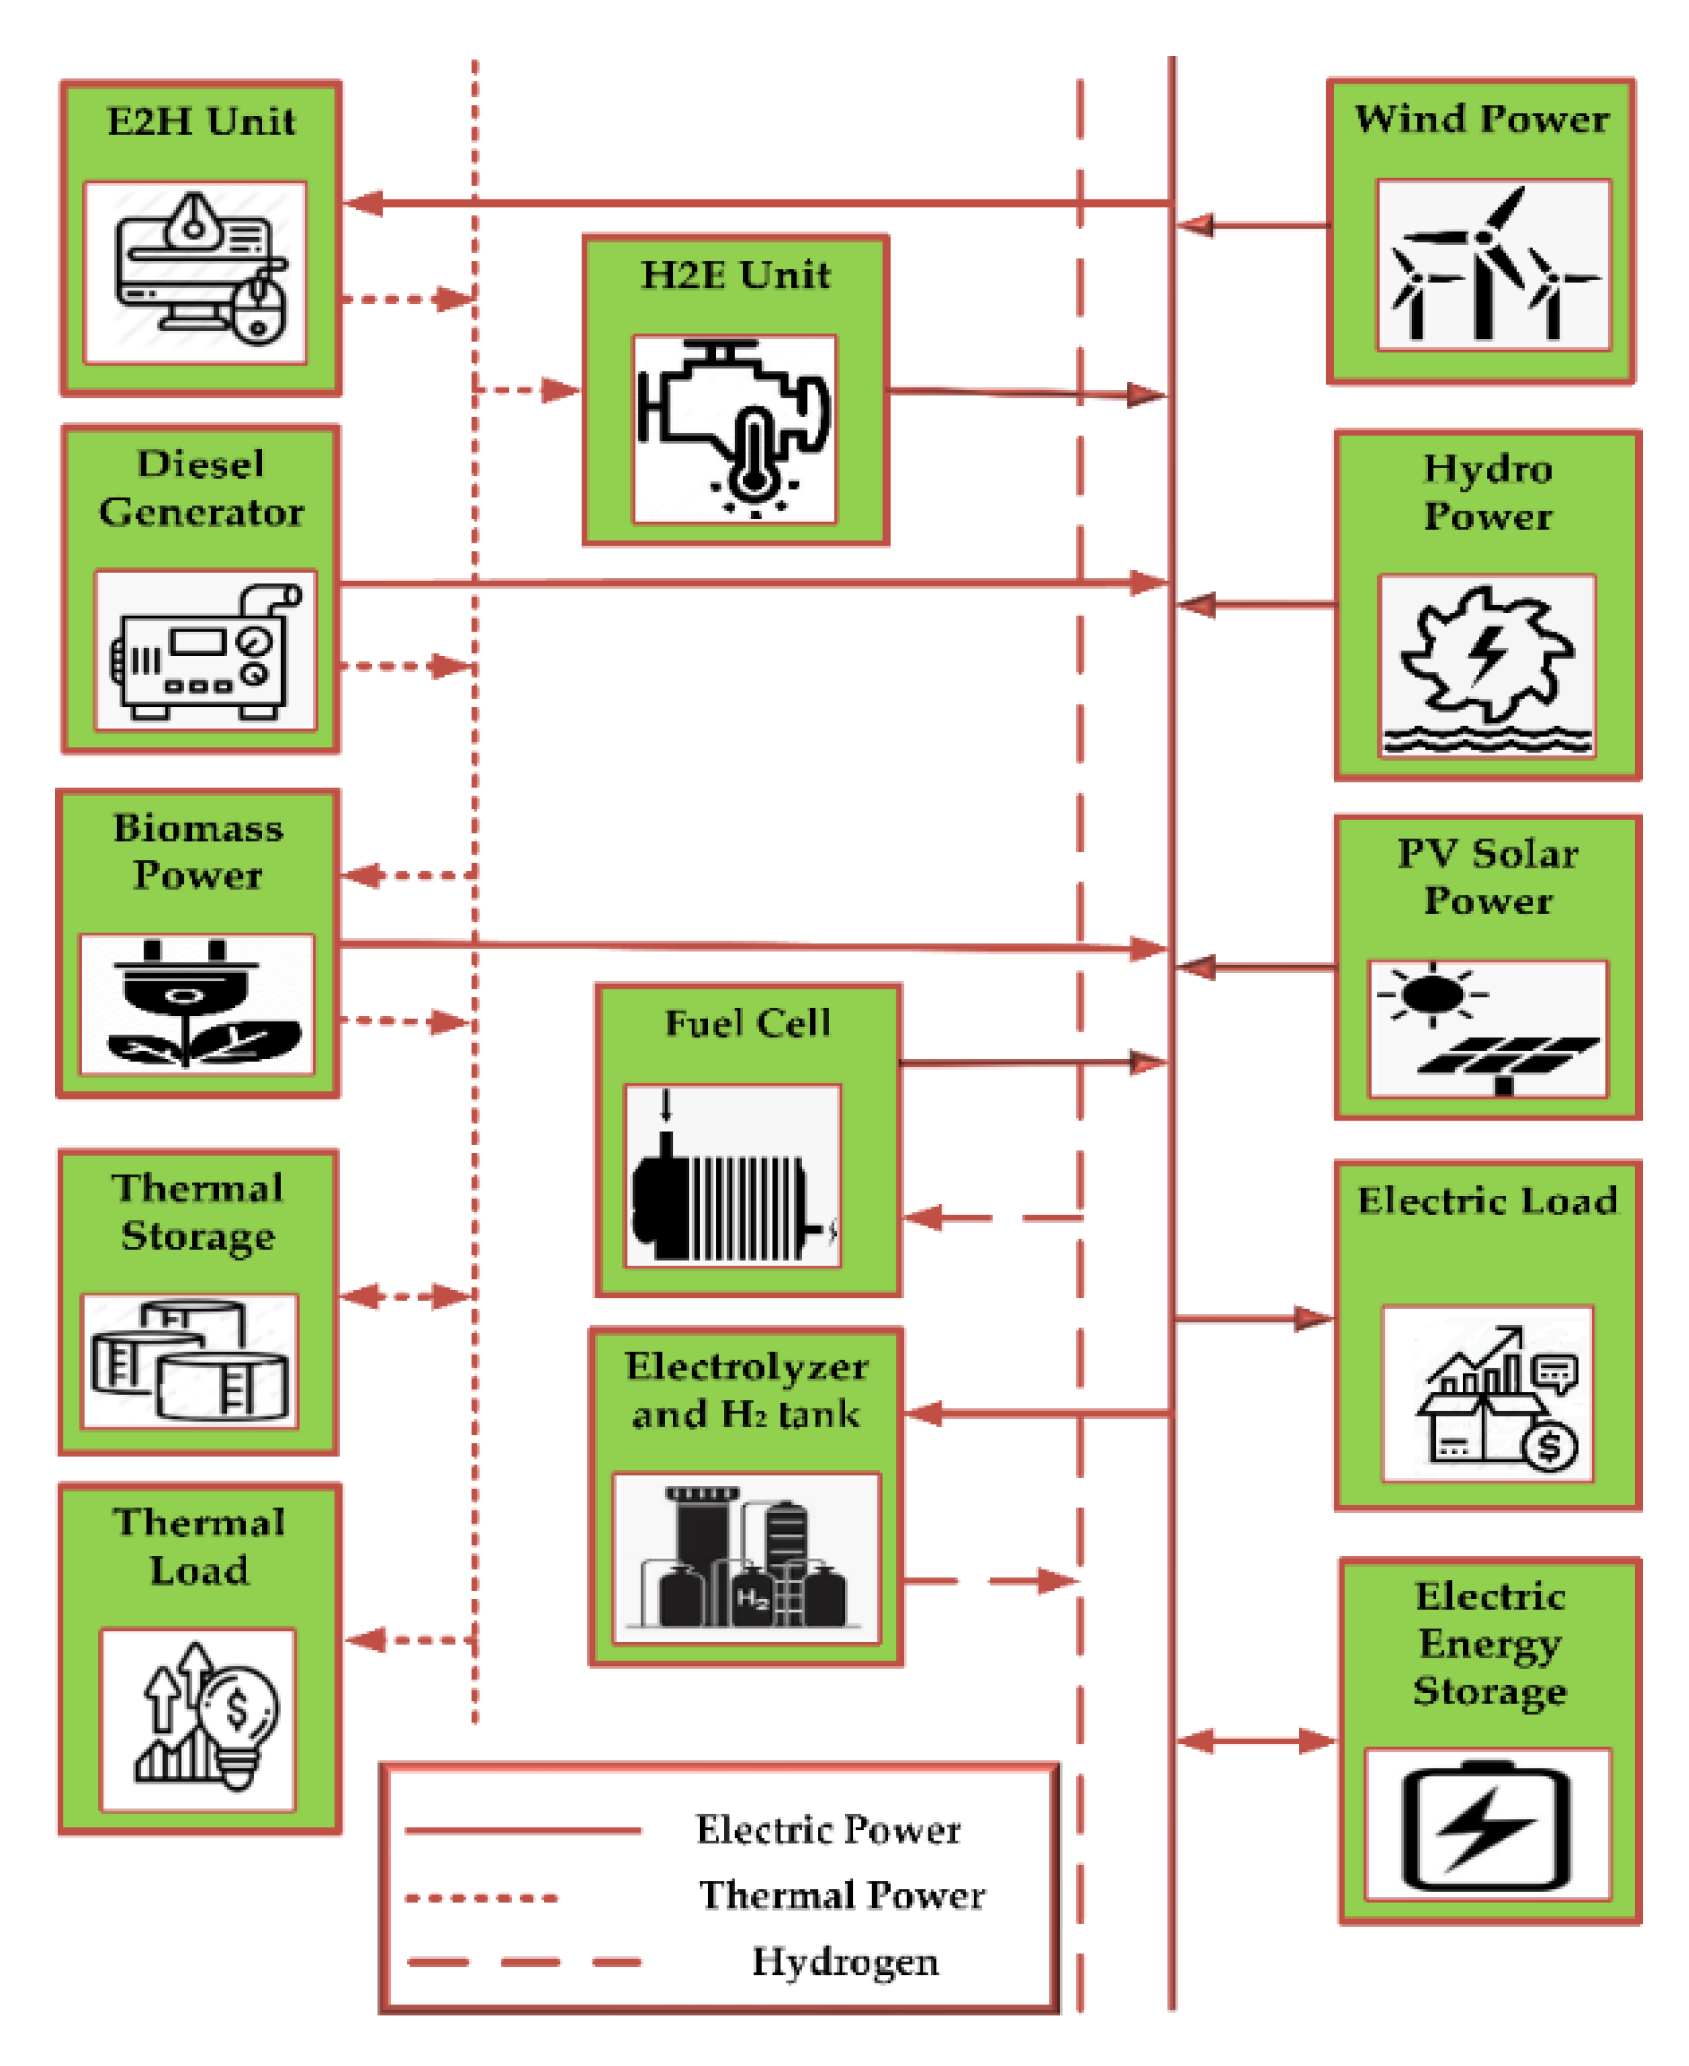
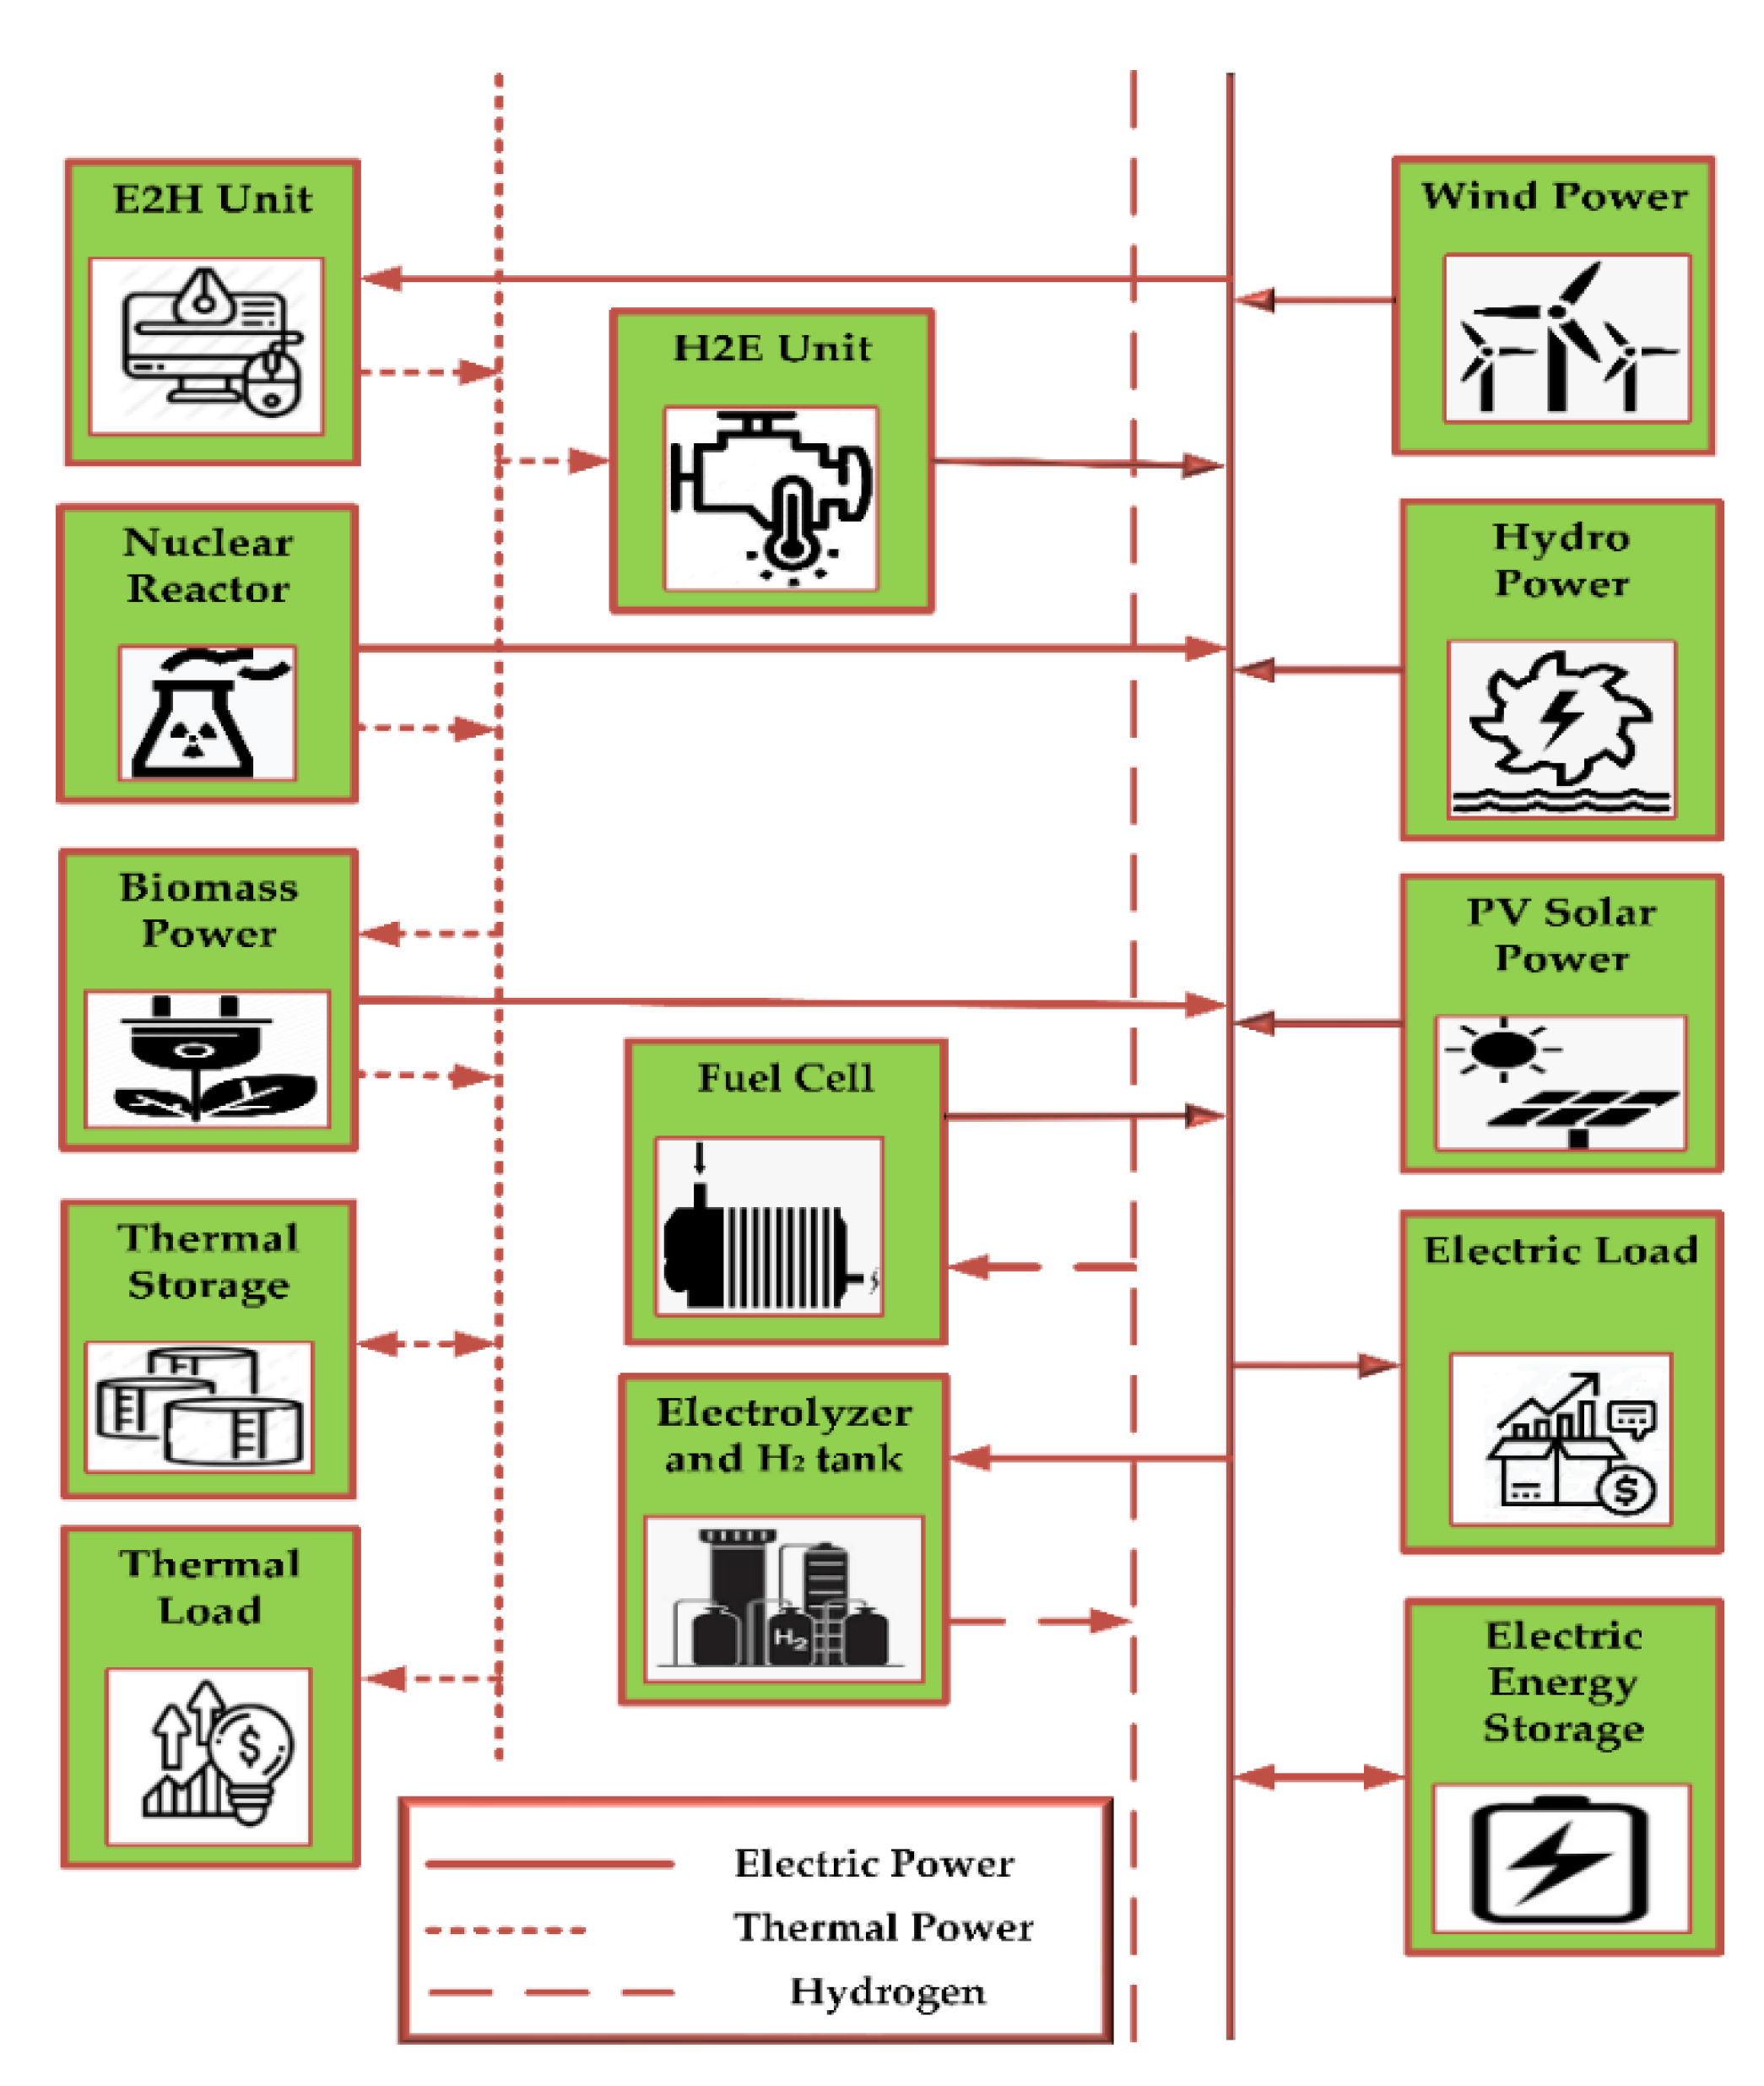
2. Proposed Micro Energy Grid
3. System Modeling
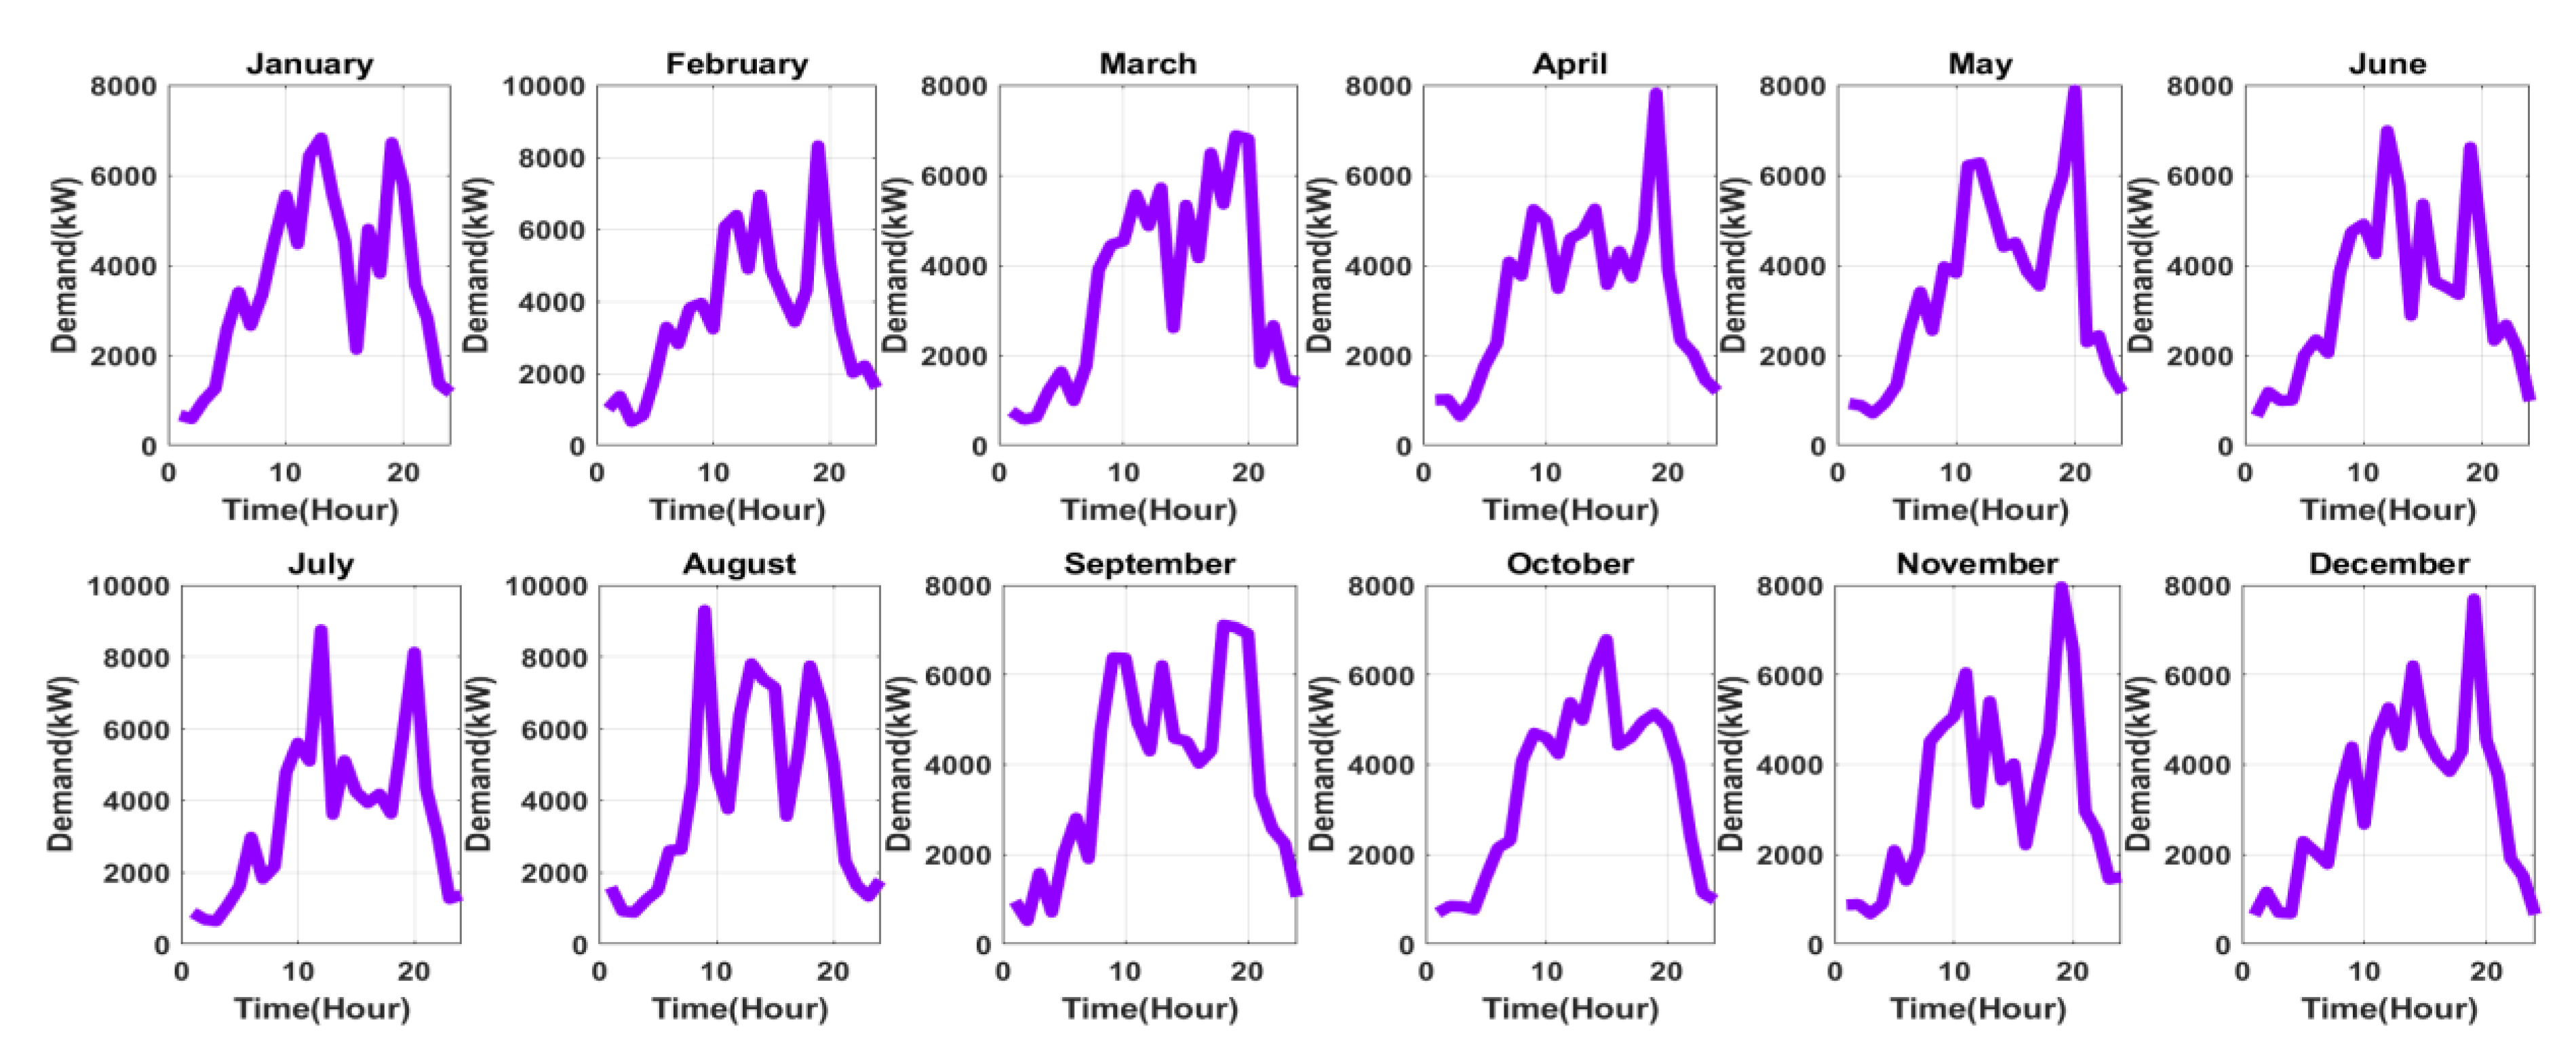
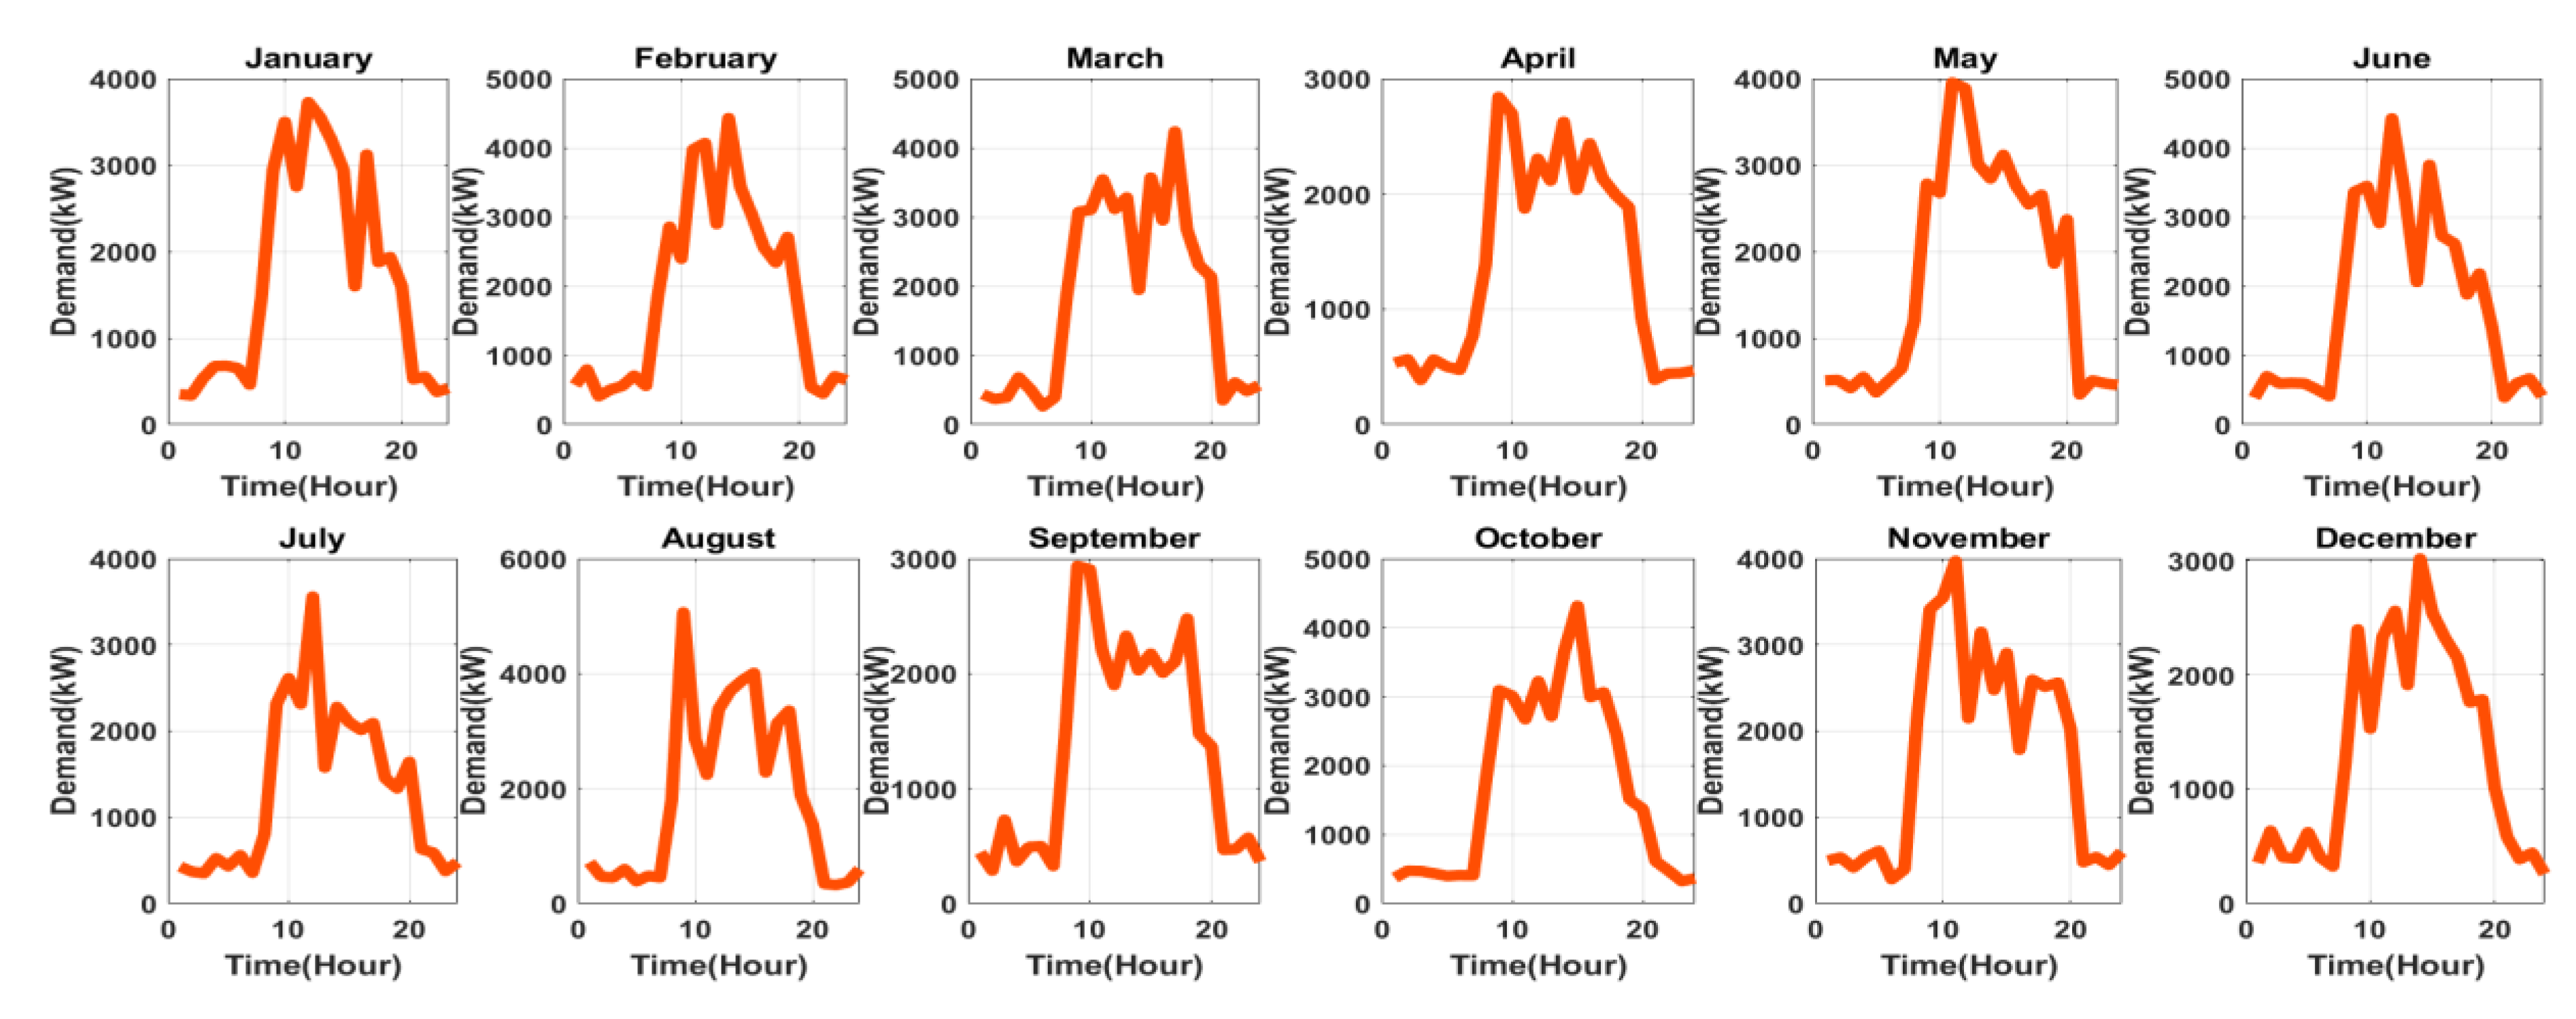
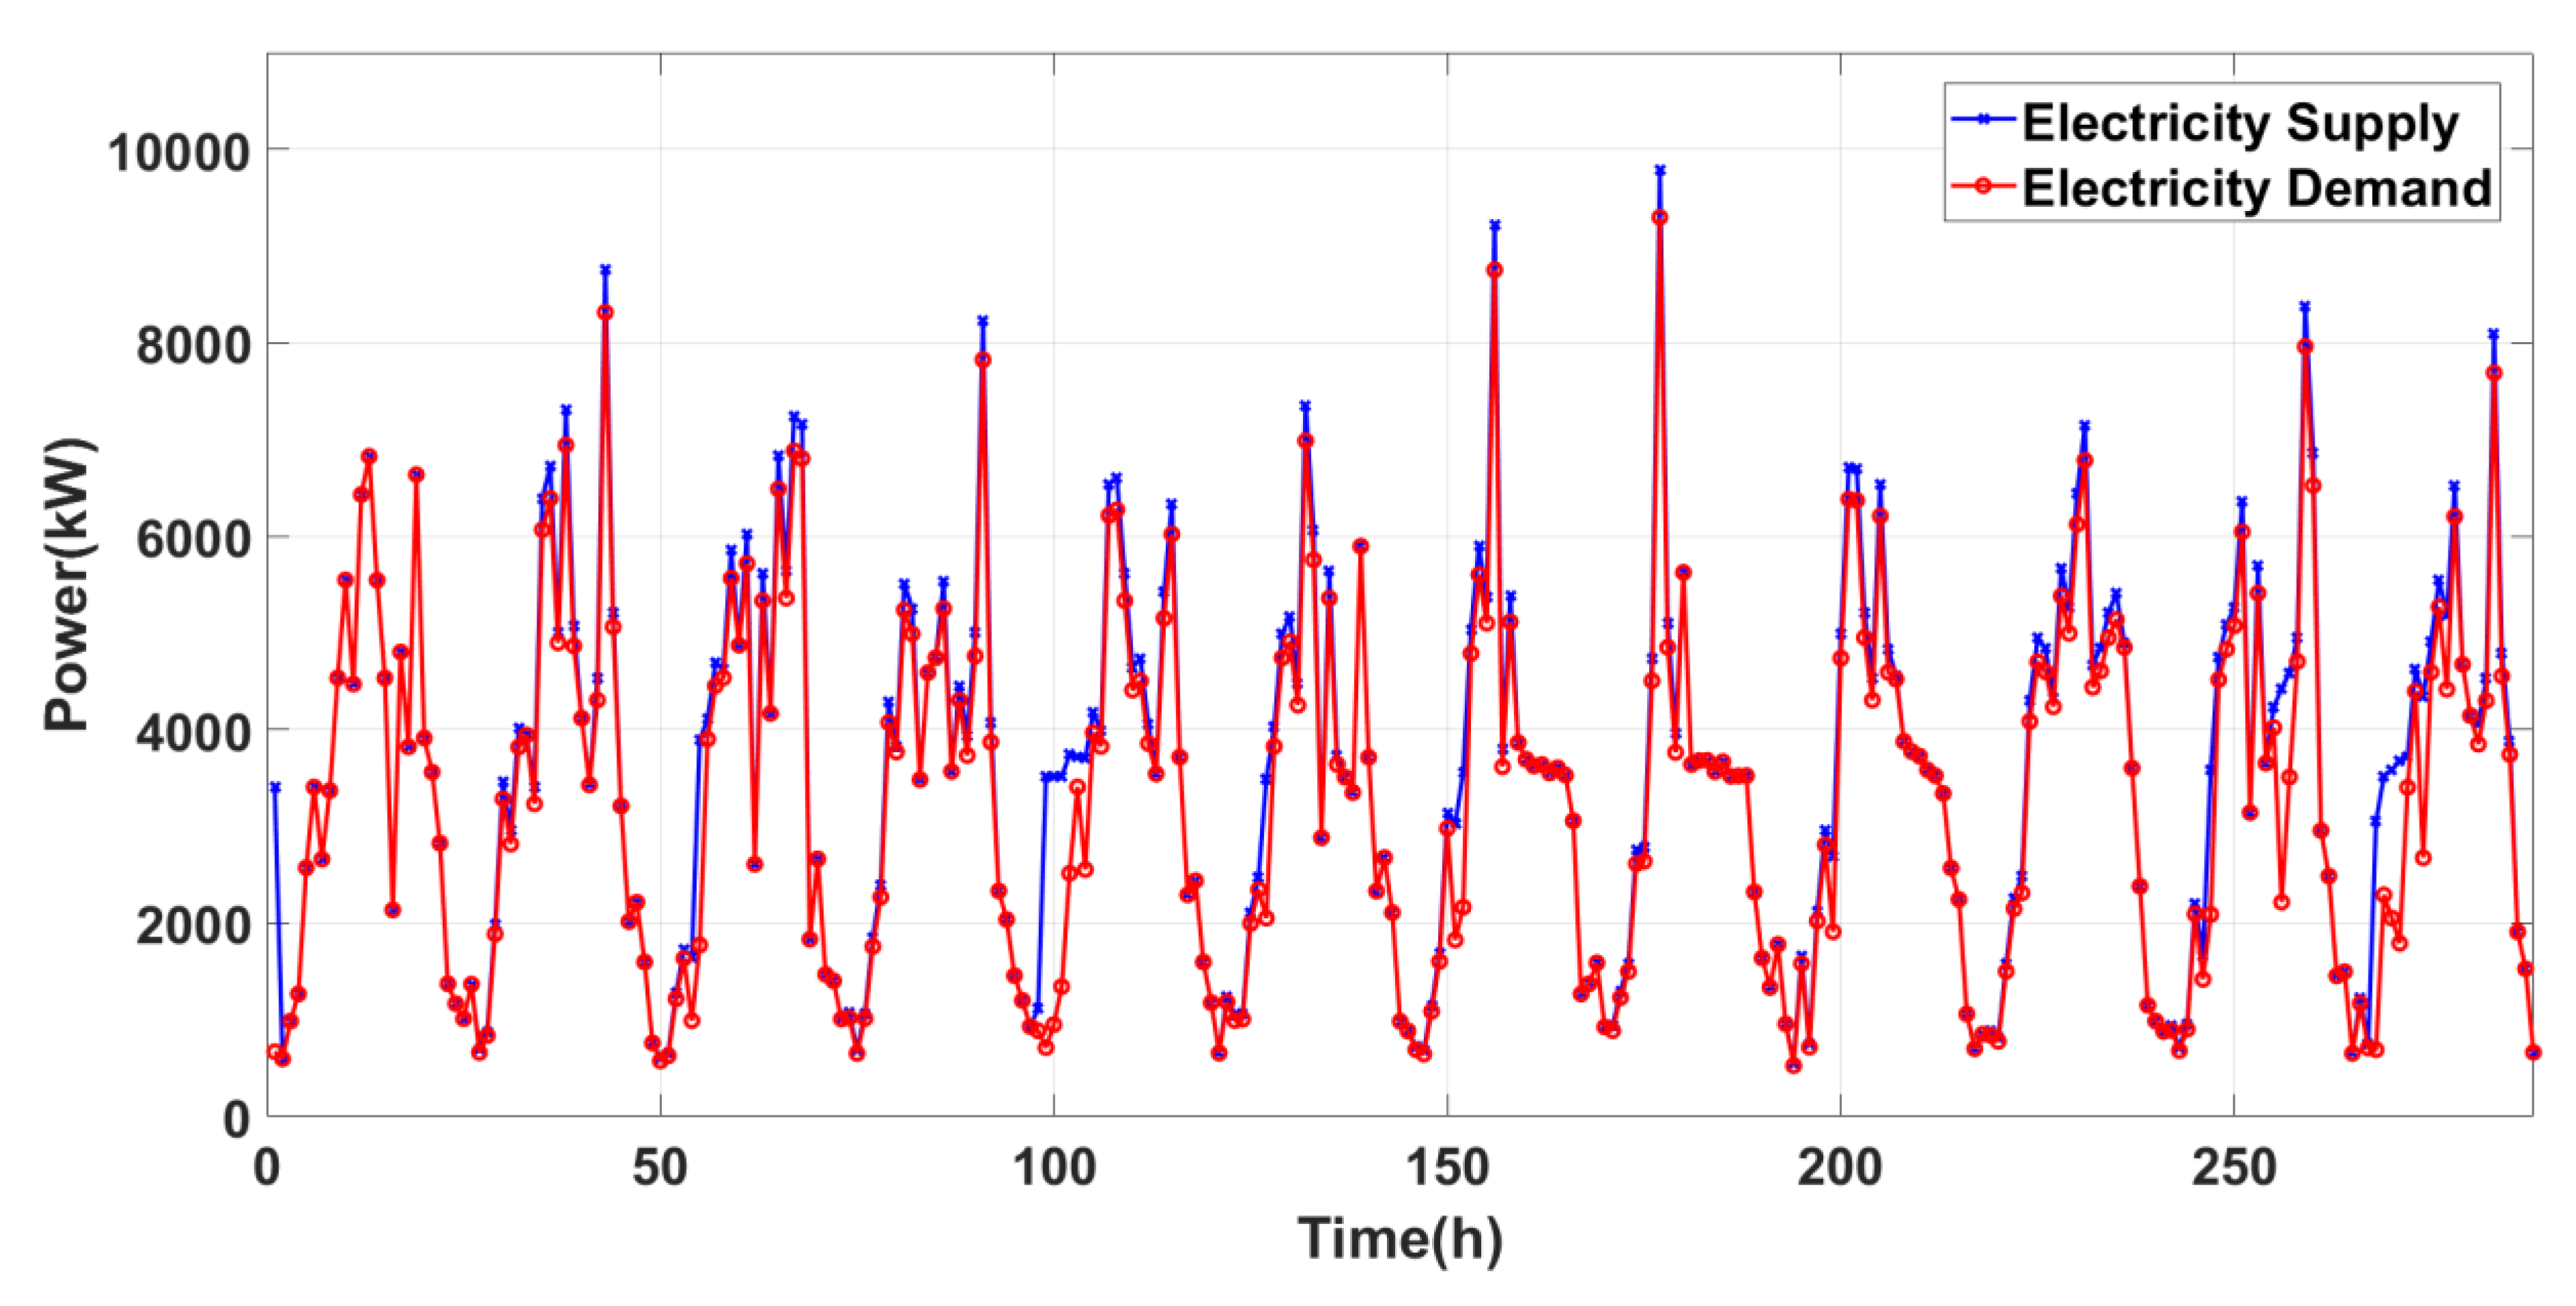
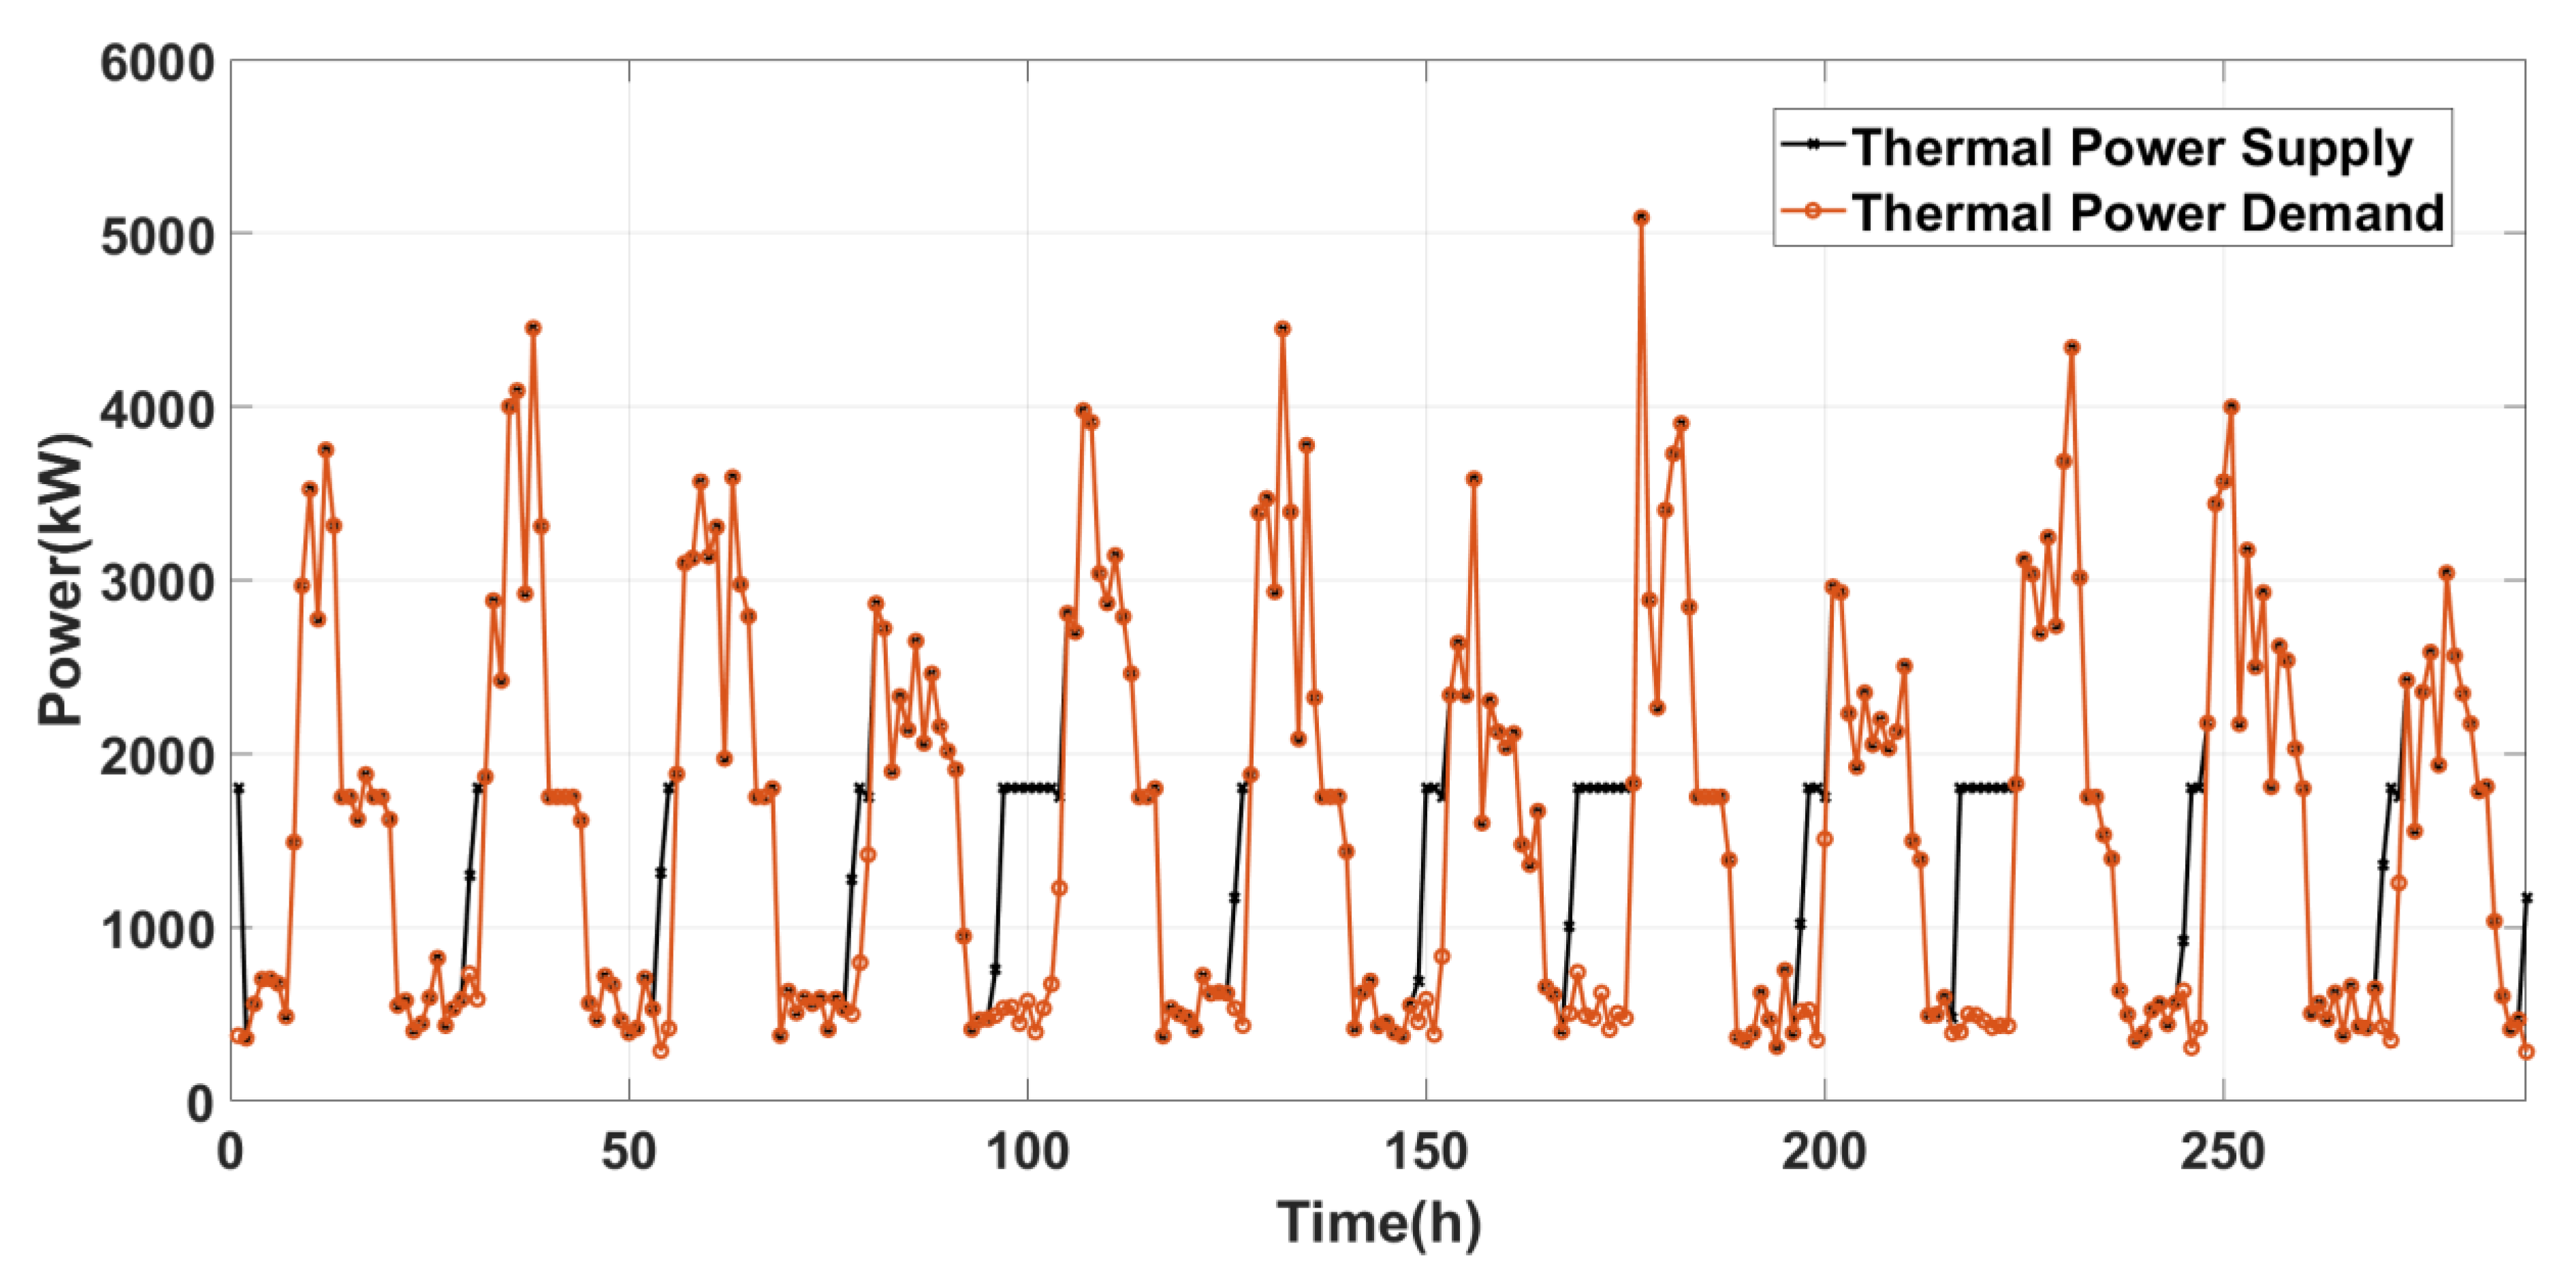
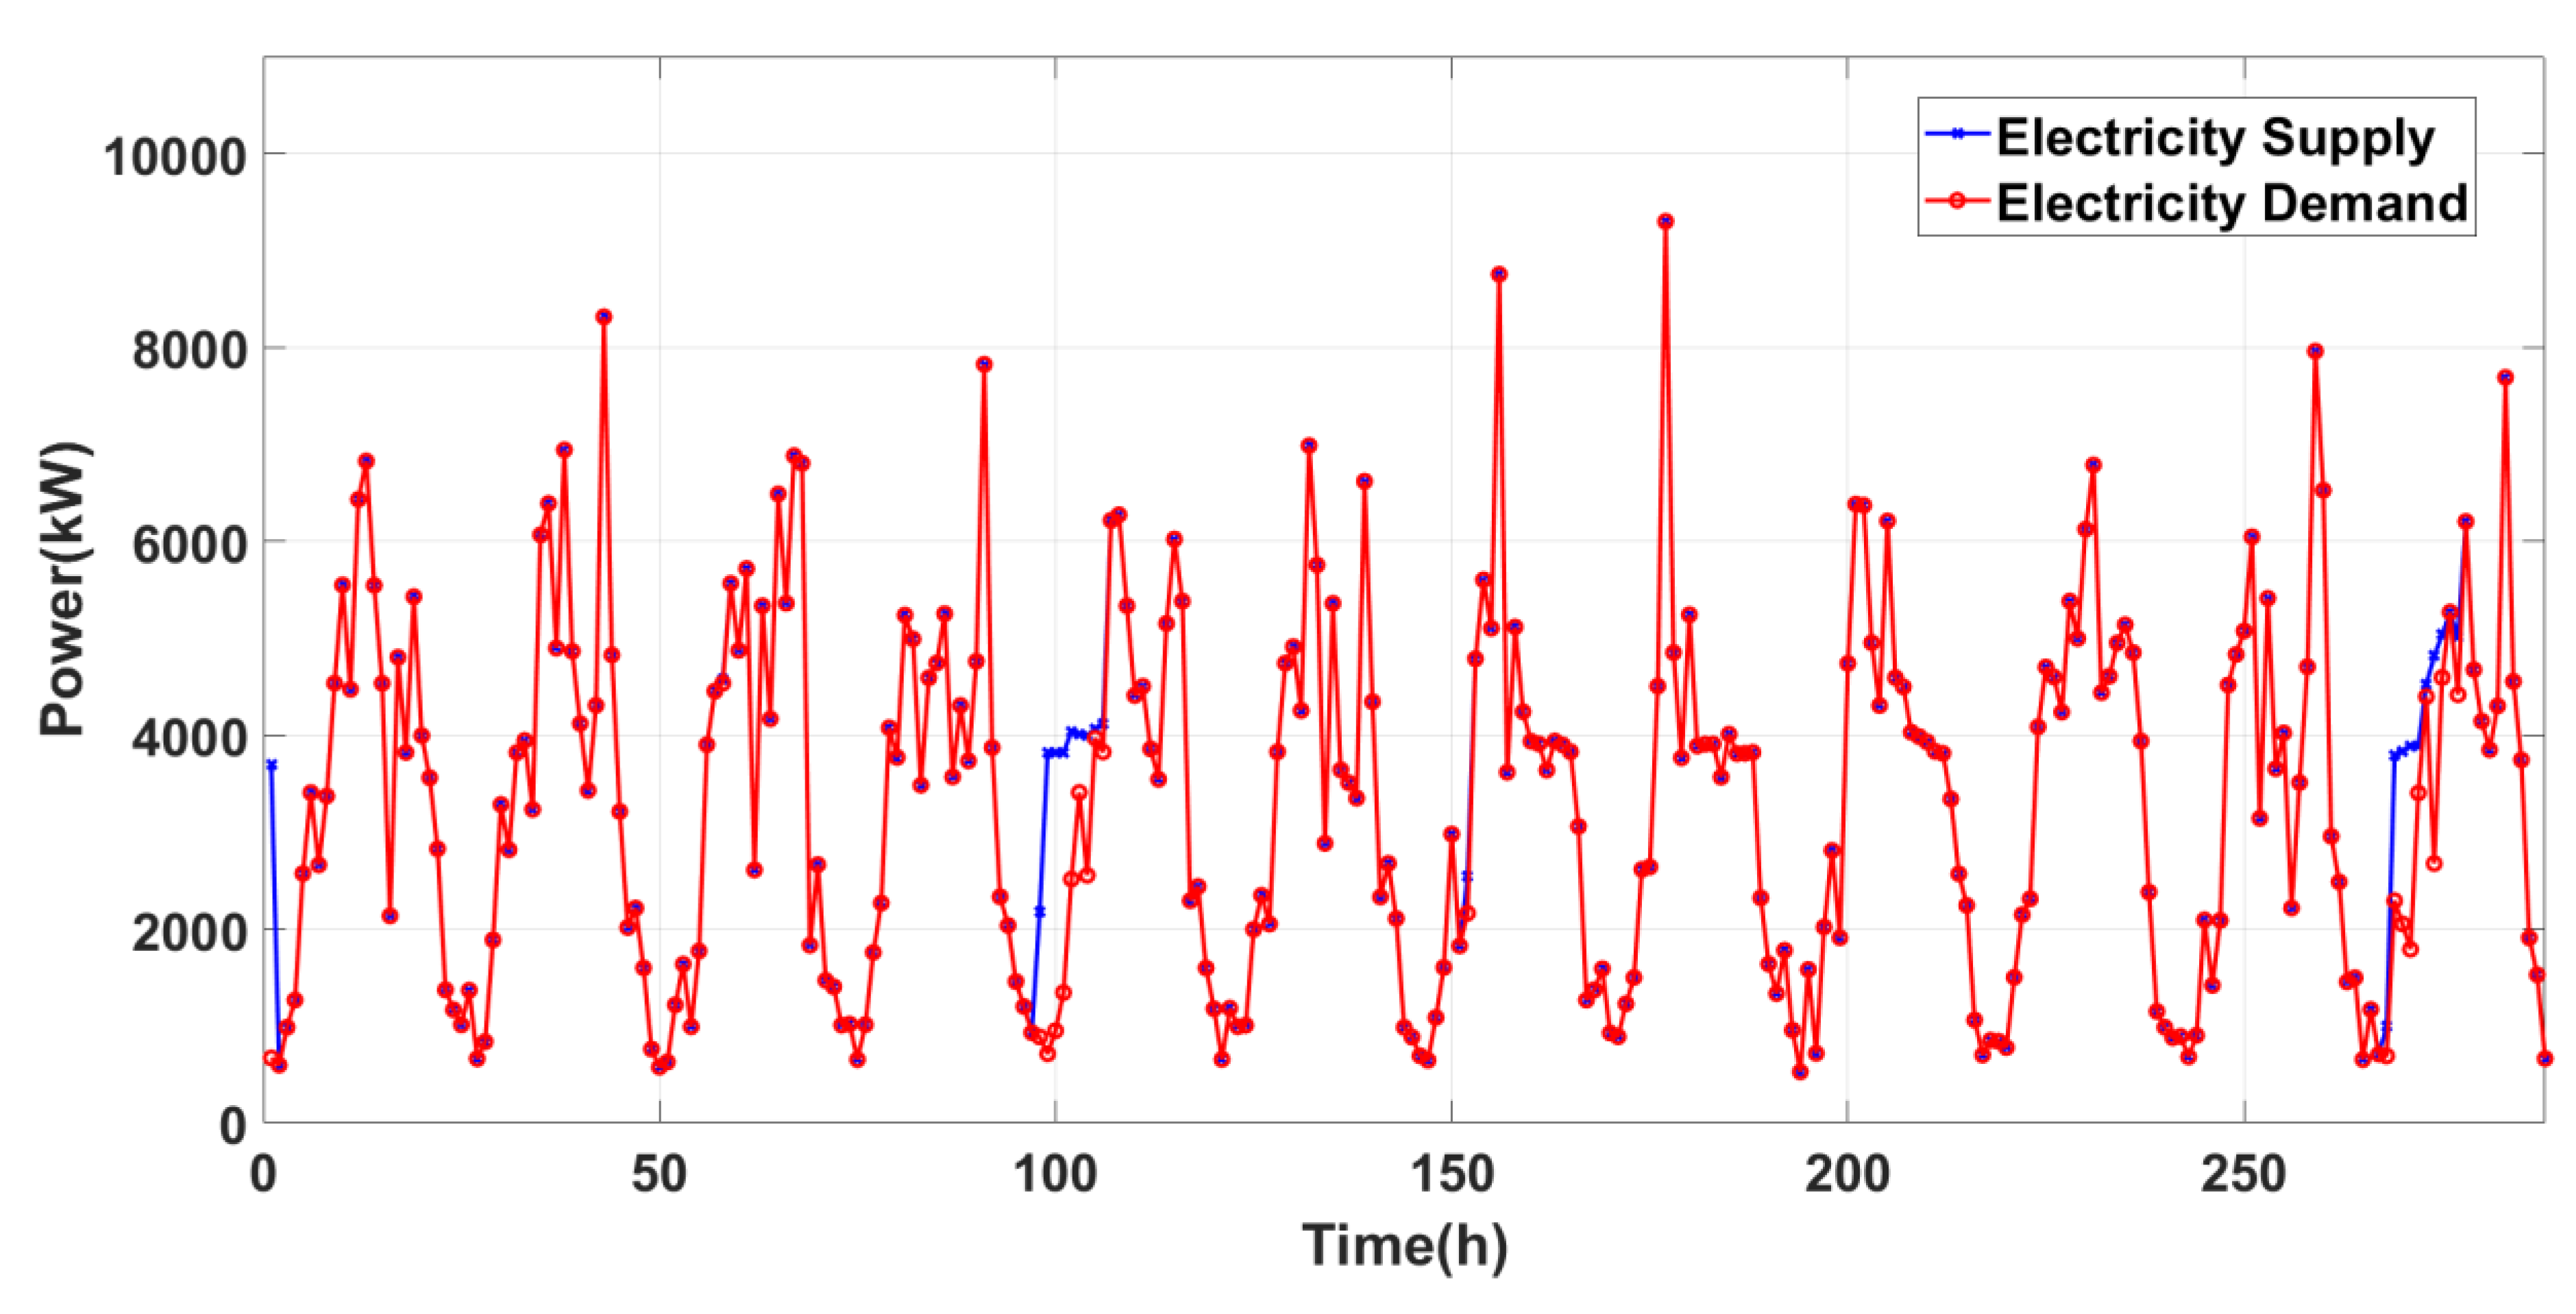
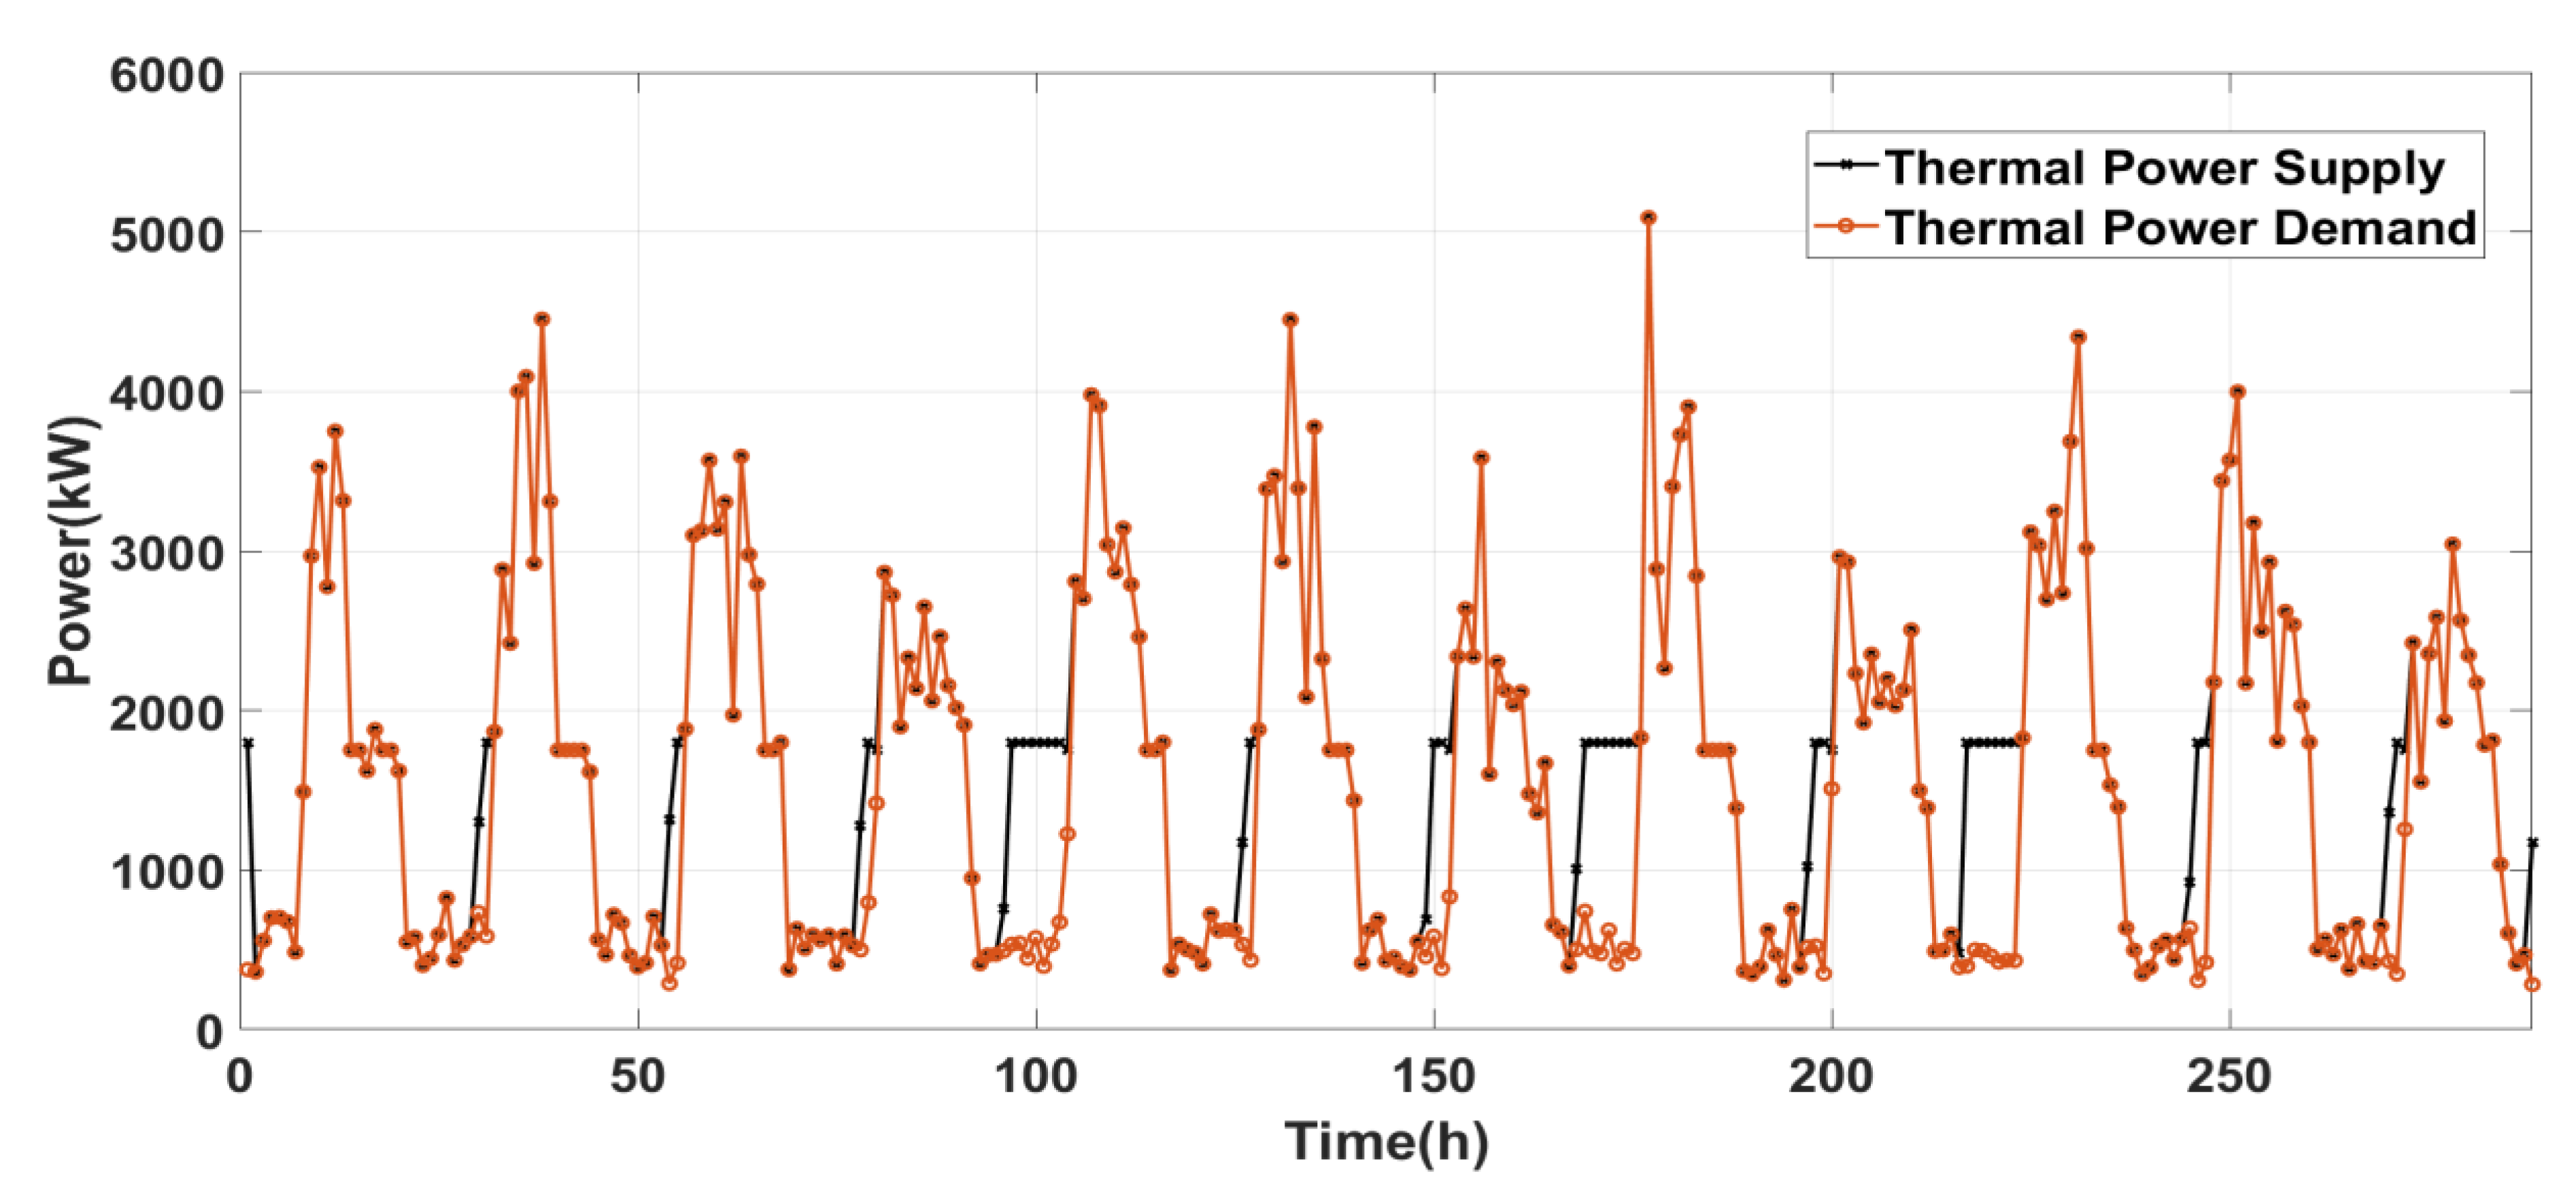
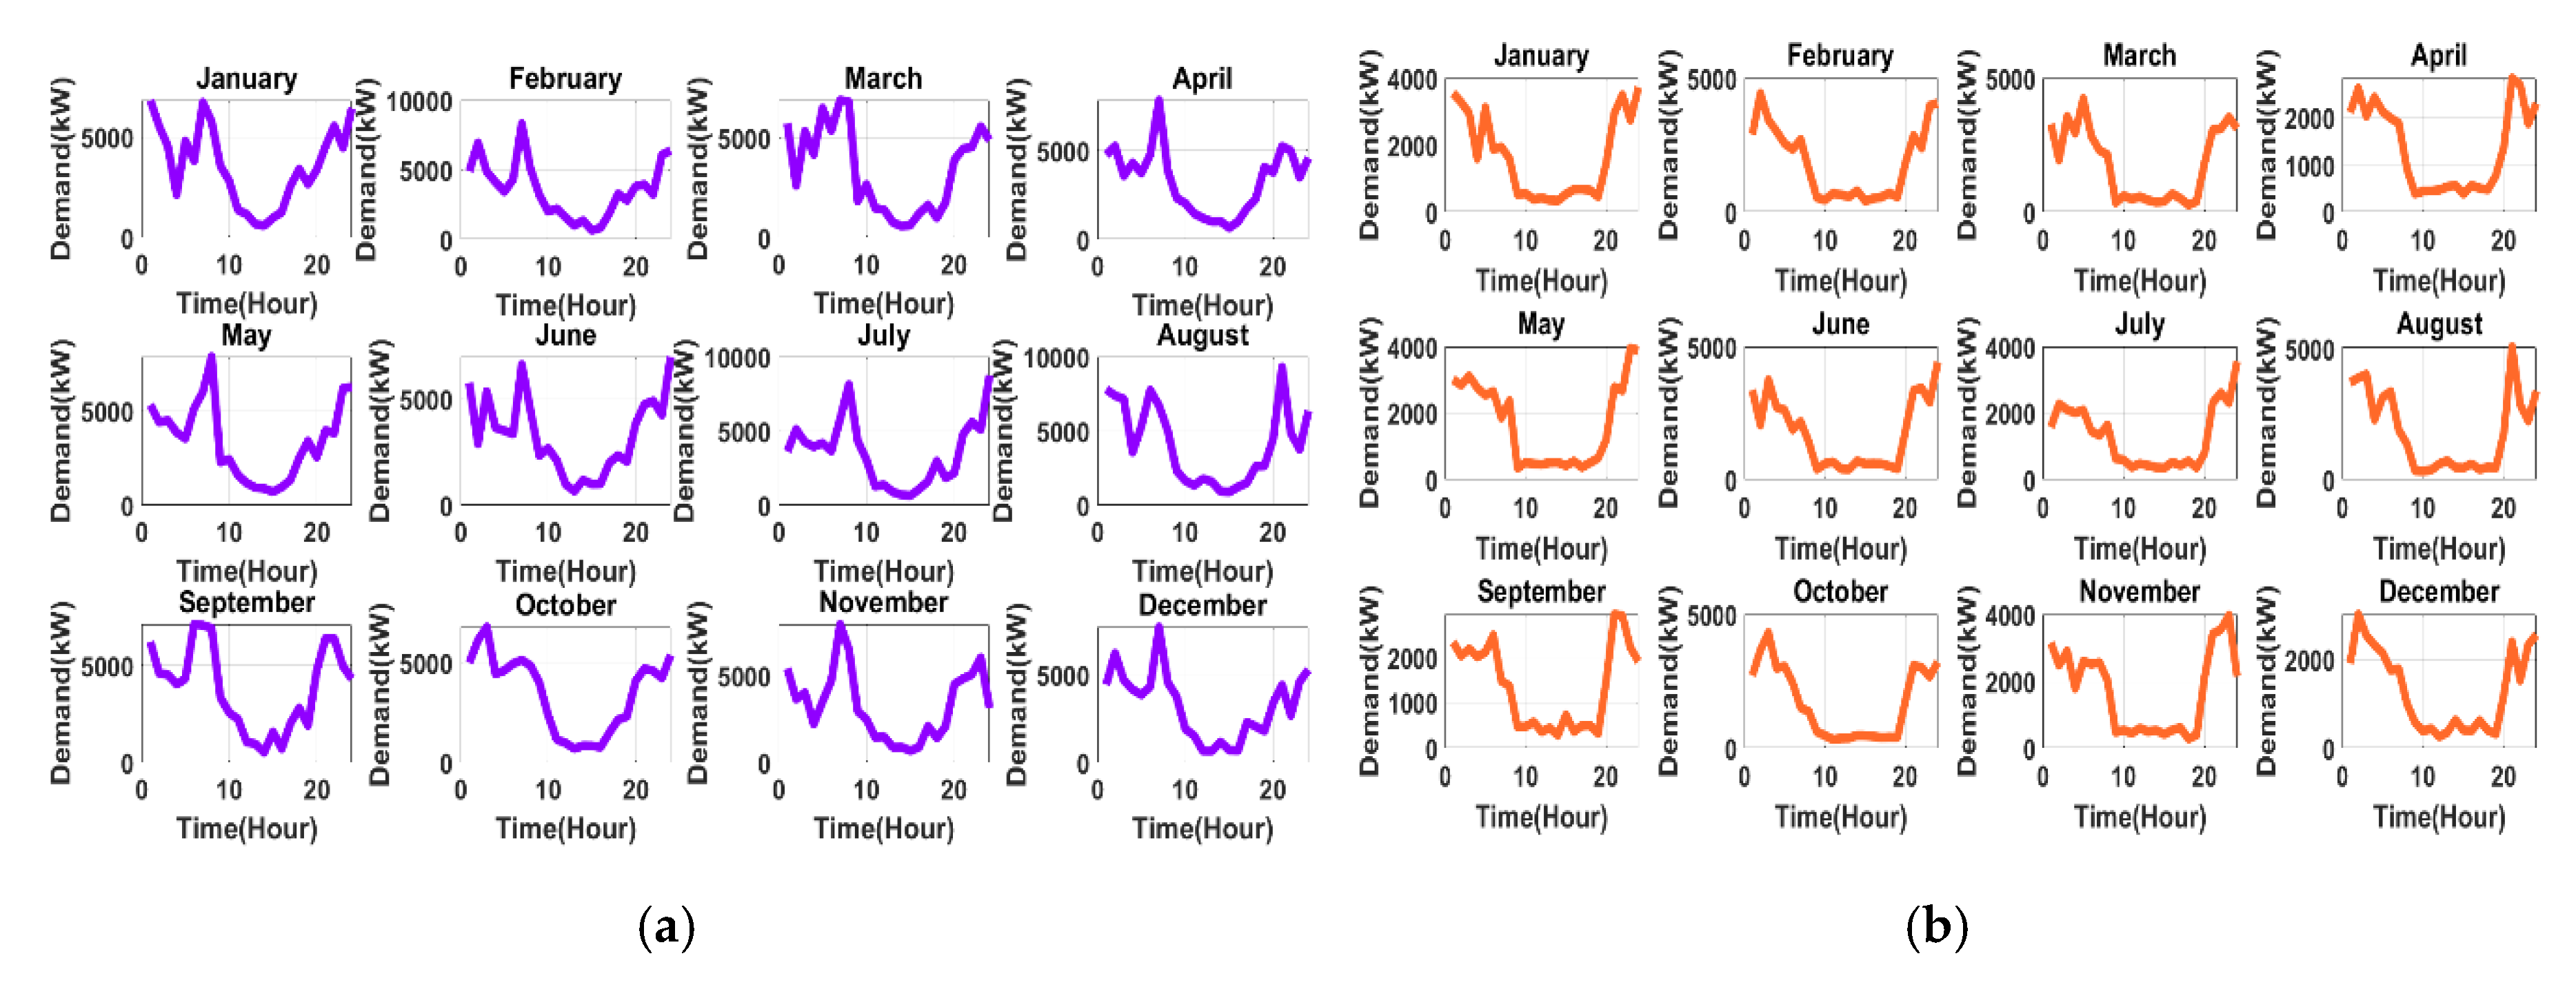
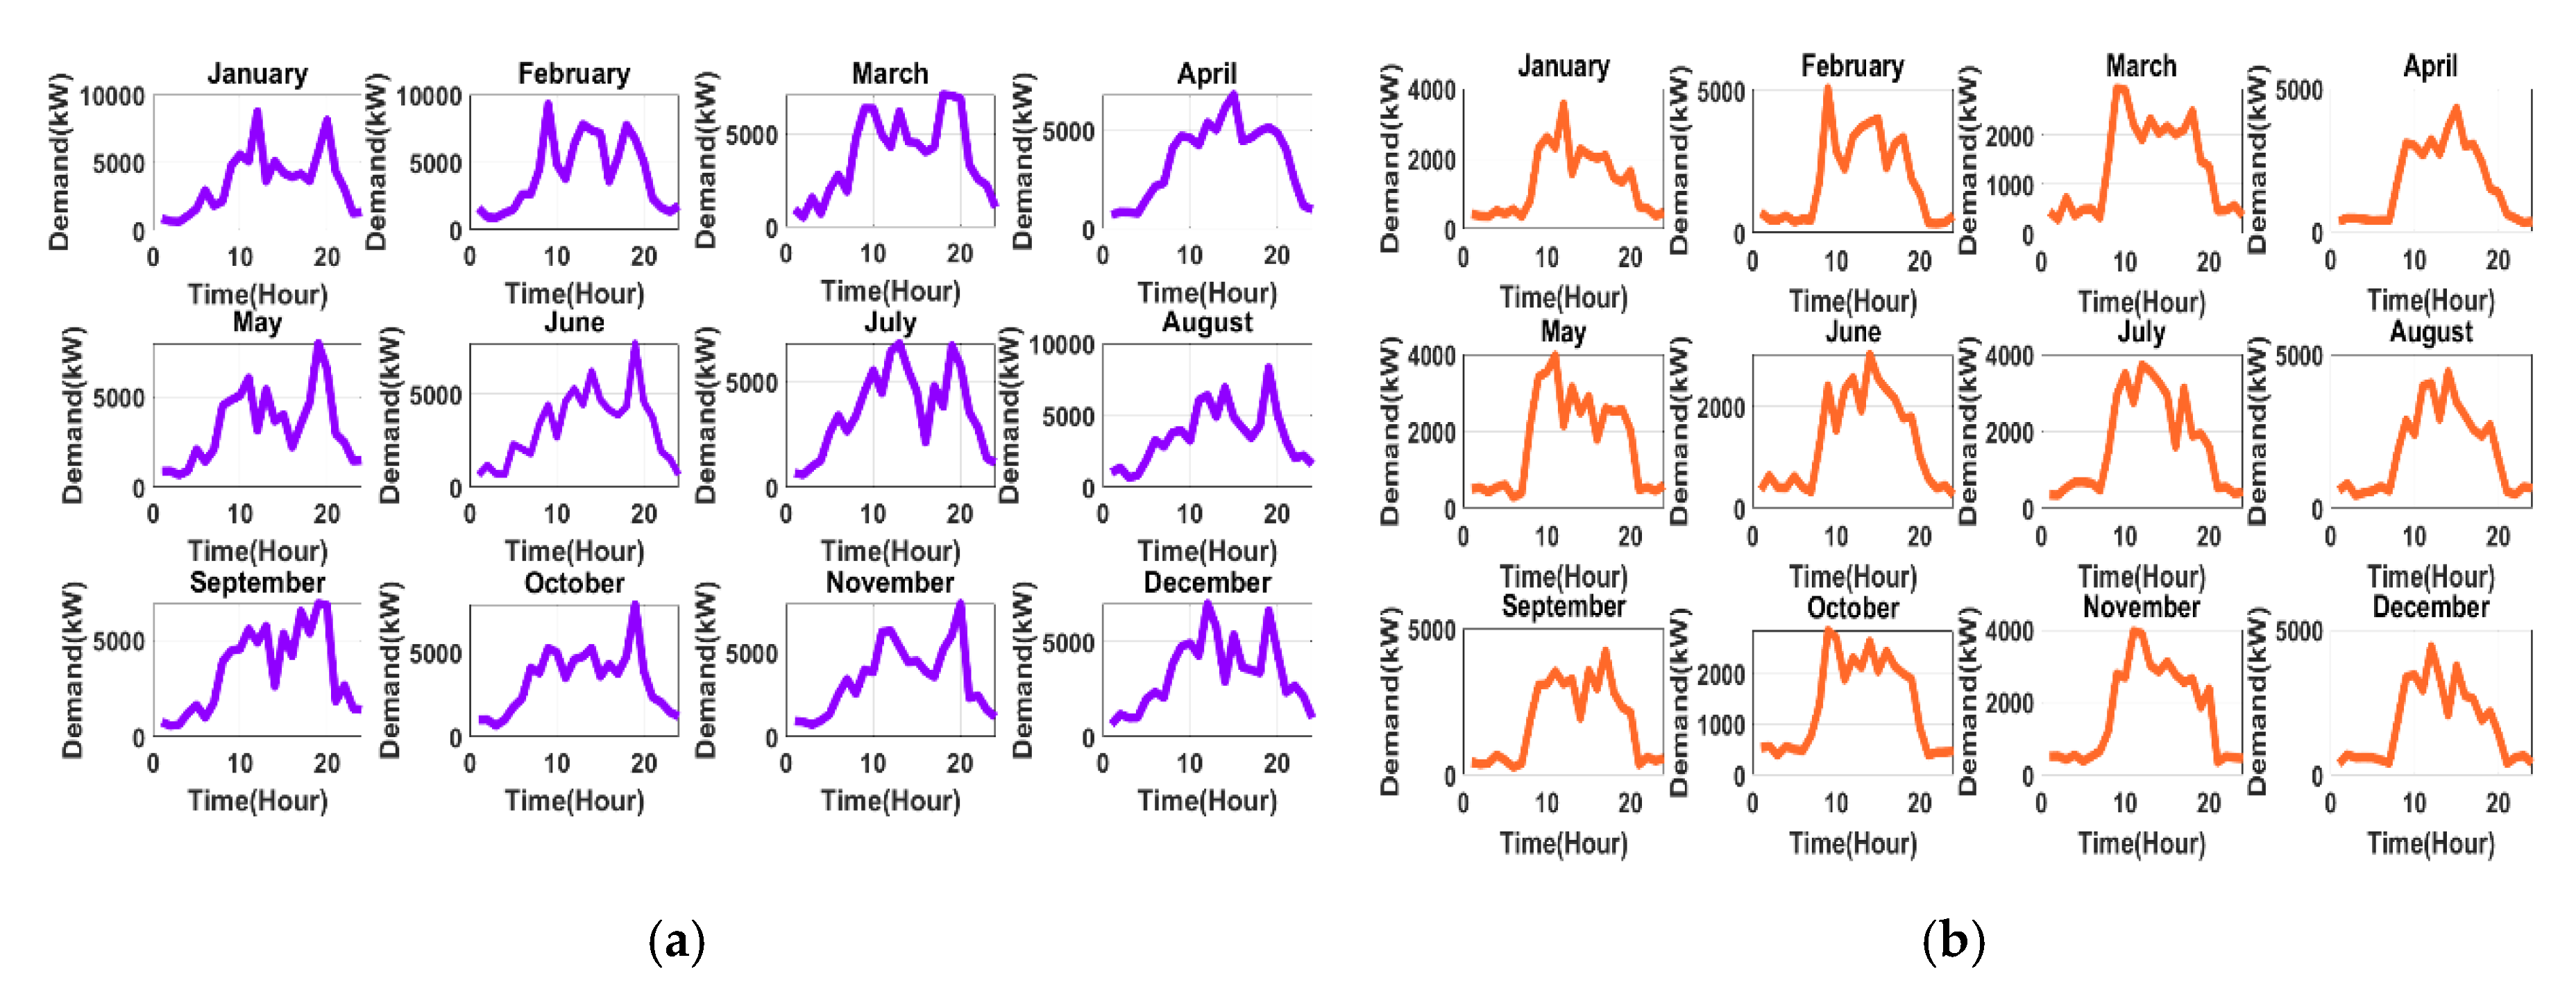
3.1. System Load Profile
3.2. Diesel Genset
3.3. Nuclear Power (Microreactor)
3.4. Solar Power
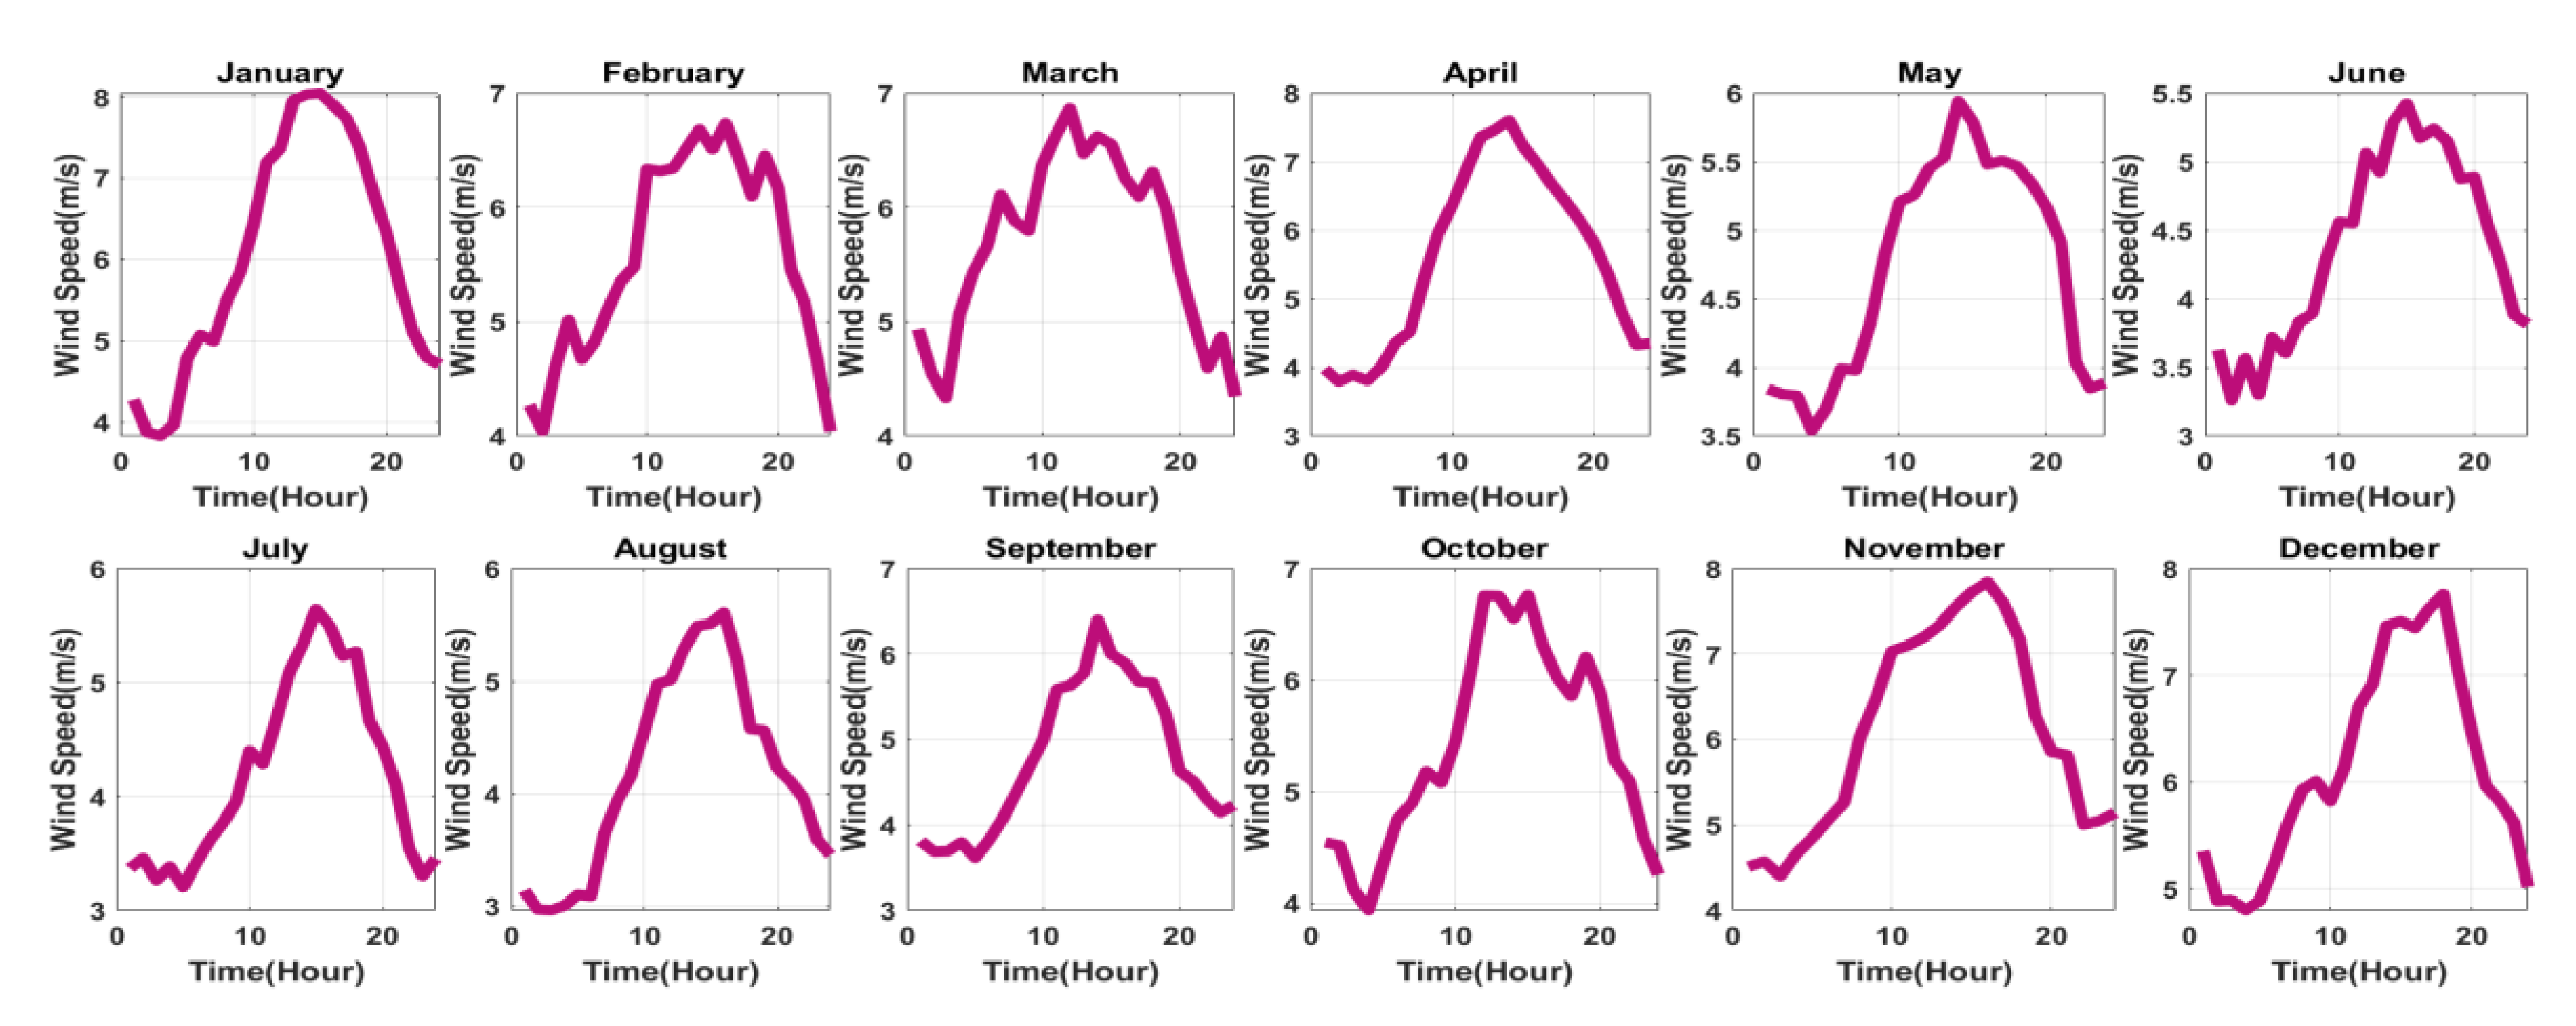
3.5. Wind Power
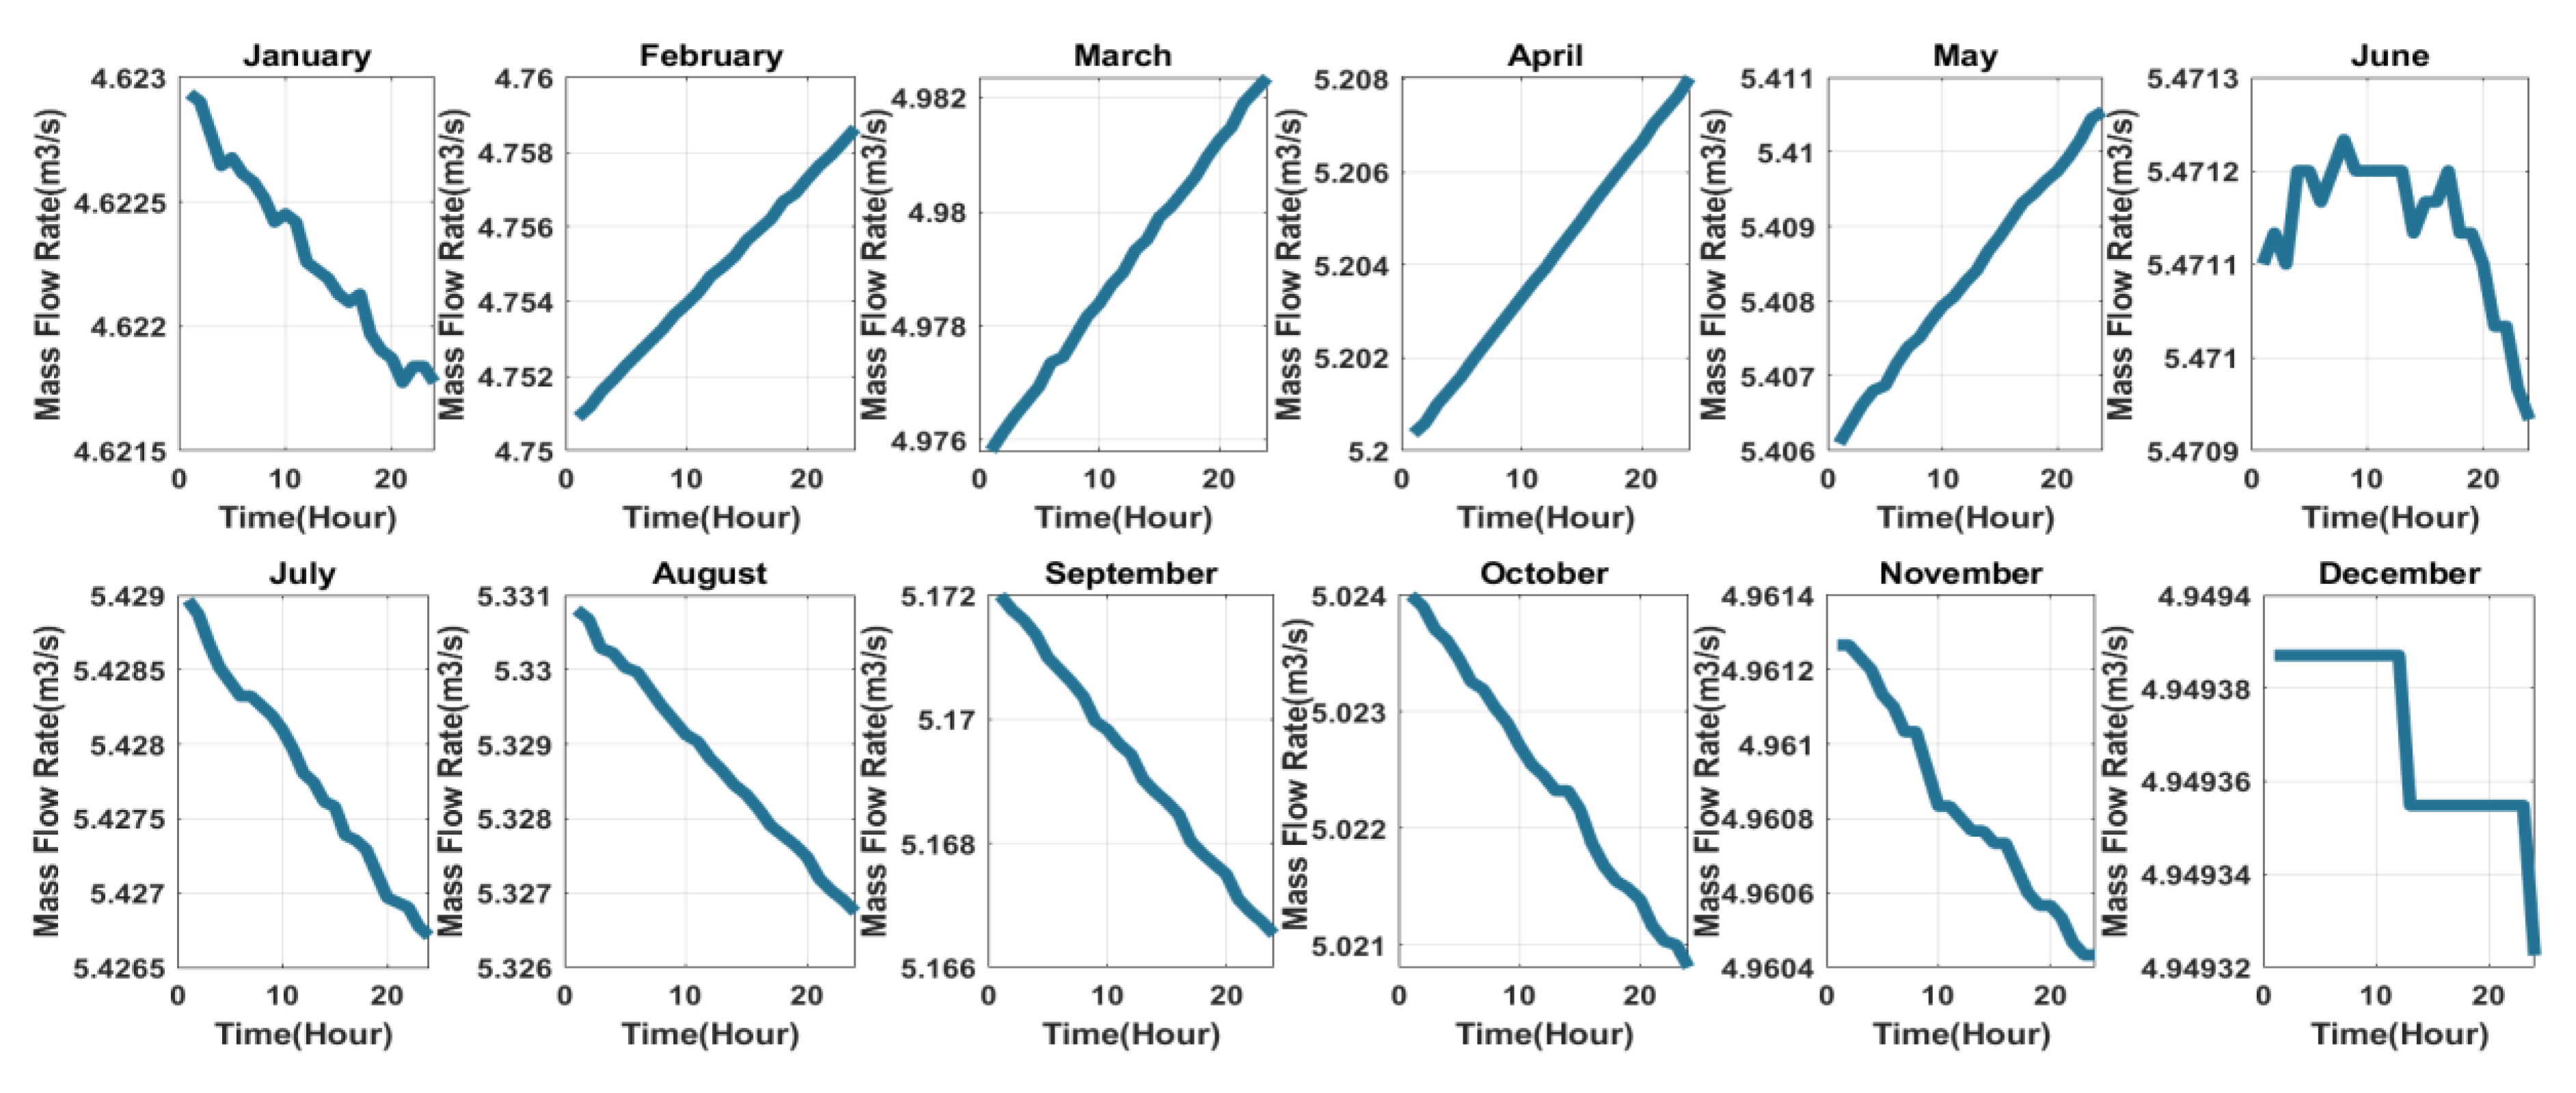
3.6. Hydro Power
3.7. Biomas Power
3.8. Electrolyzer, Hydrogen Storage, and Fuel Cell (FC)
3.9. Electrochemical Energy Storage
3.10. Thermal Energy Storage
3.11. Heat-to-Electricity Unit
3.12. Electricity-to-Heat Unit
4. Key Performance Indicators
4.1. Generation Reliability Factor (GRF)
4.2. Loss of Power Supply Probability (LPSP)
4.3. Surplus Energy Fraction (SEF)
4.4. Level of Autonomy (LA)
4.5. Levelized Cost of Energy (LCOE)
5. Problem Formulation
5.1. Objective Function
5.2. Constraints
5.3. Decision Variables
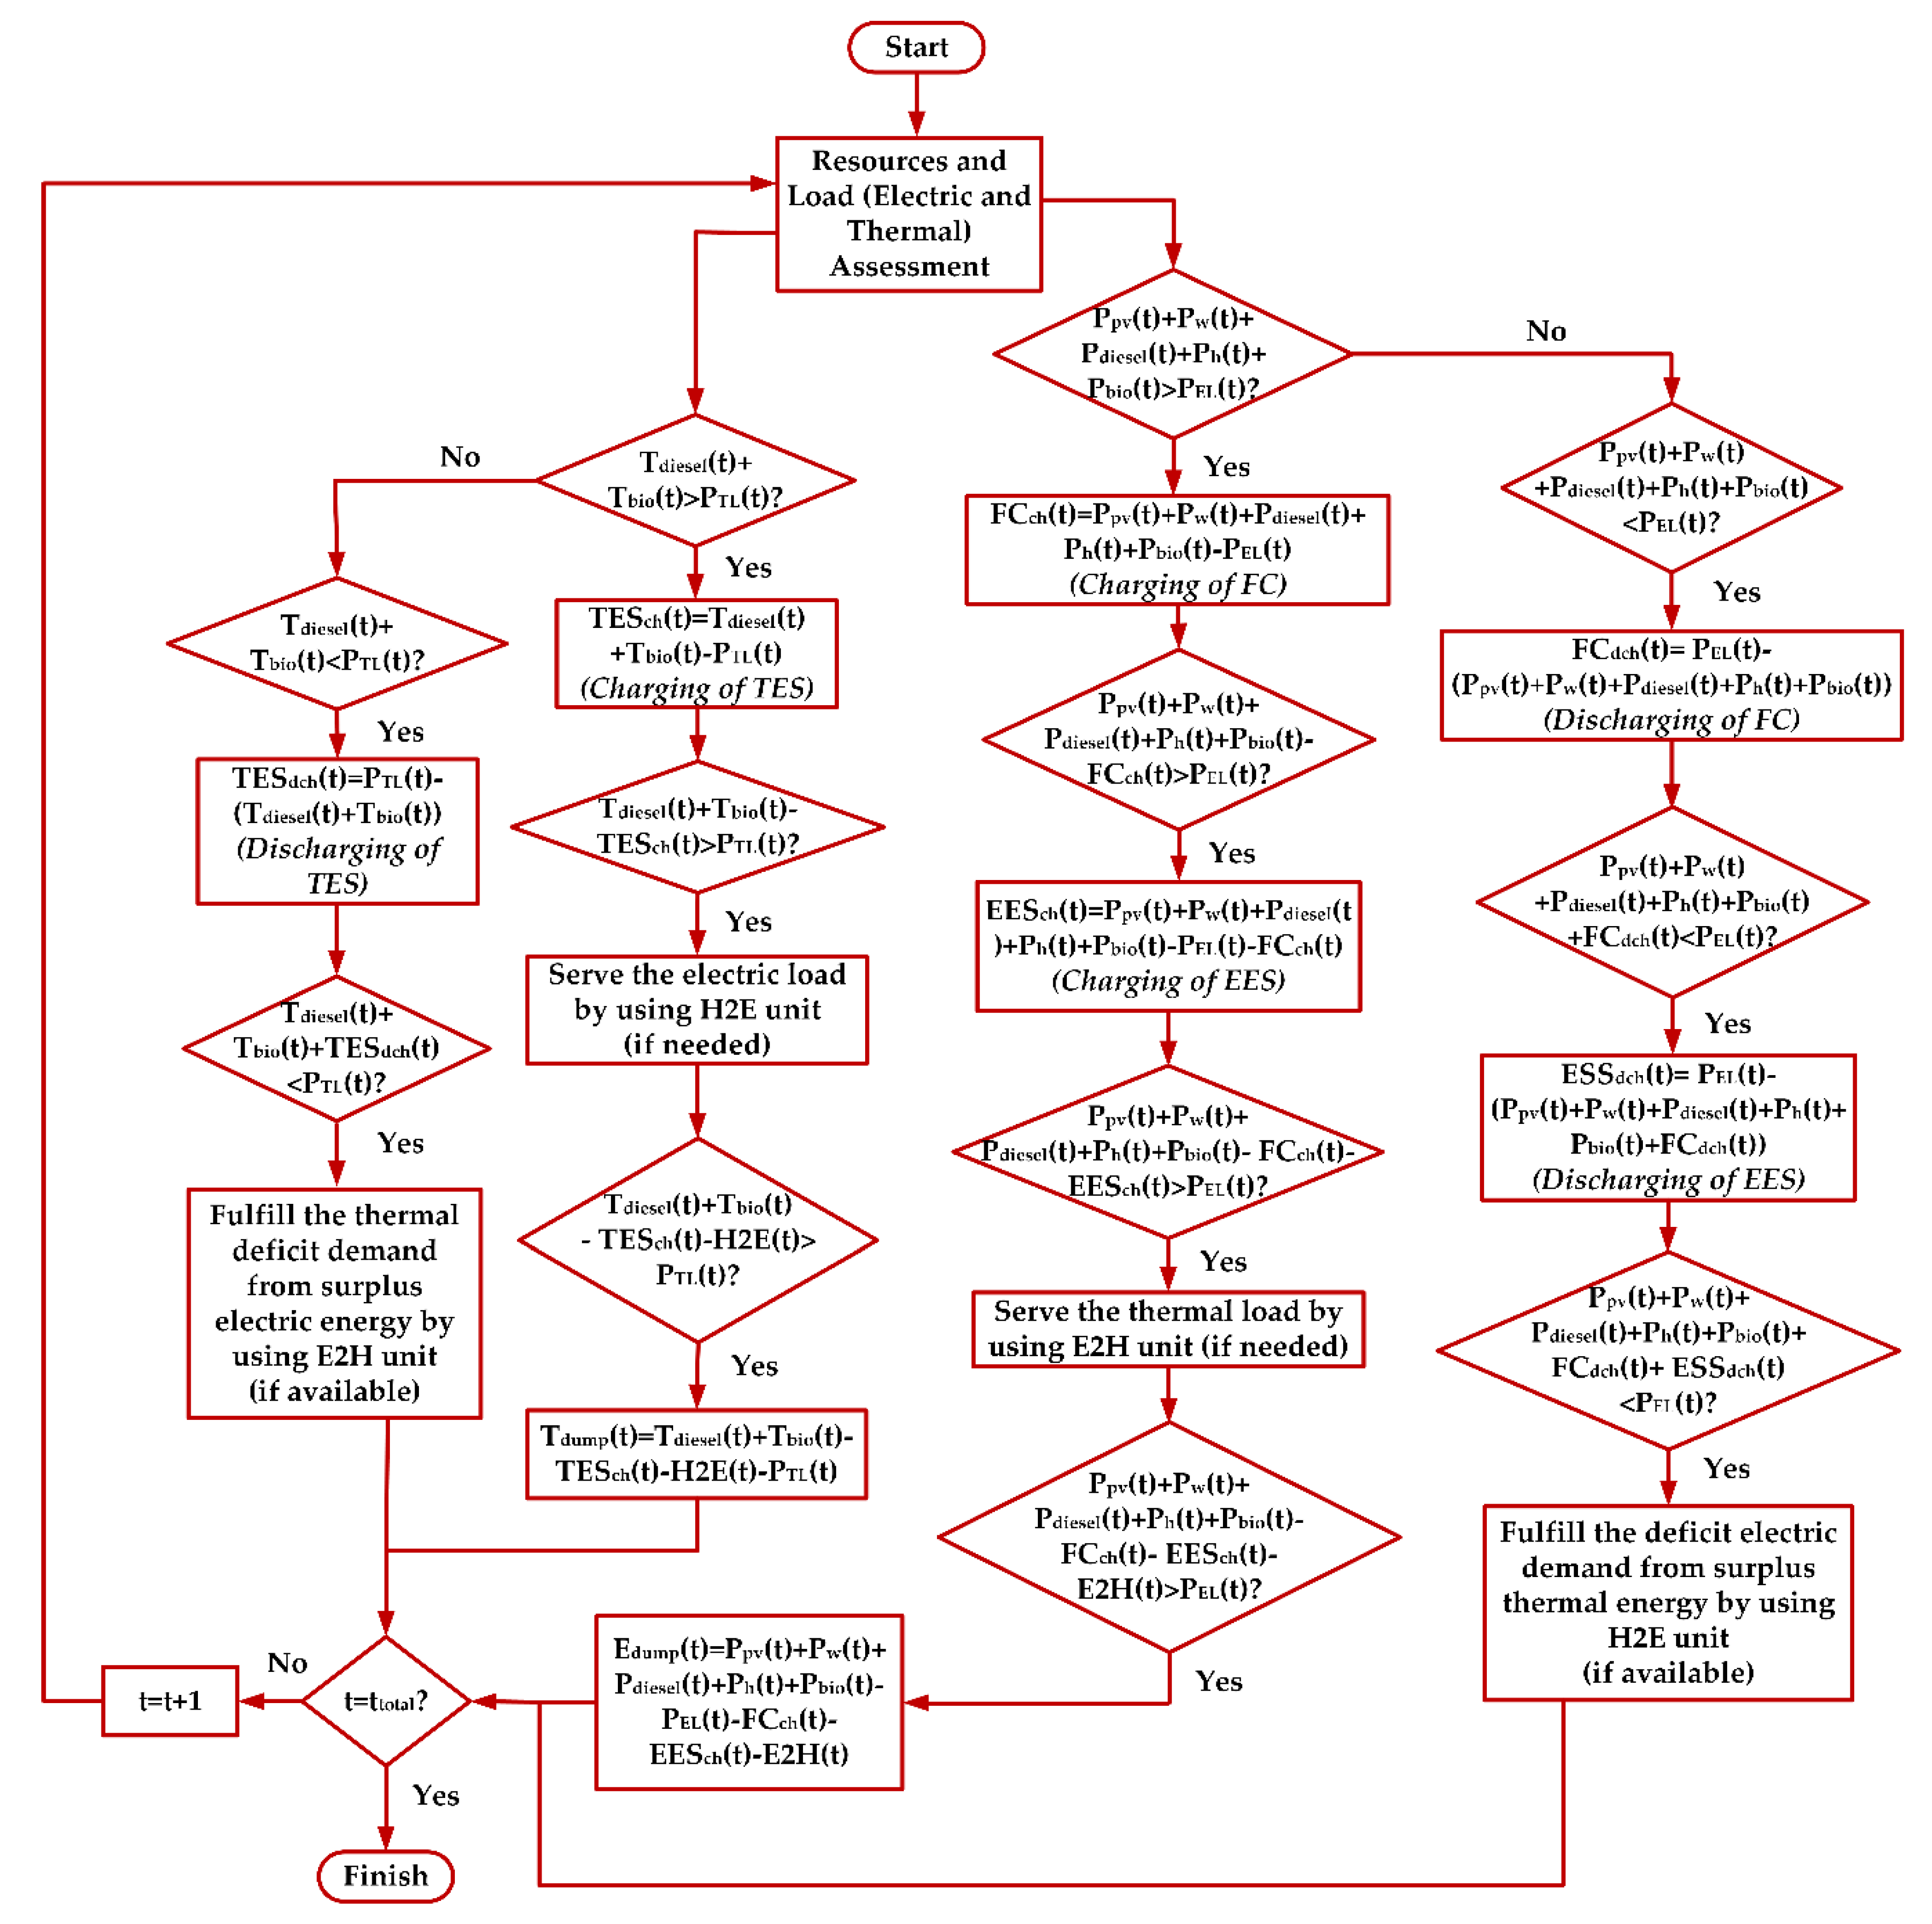
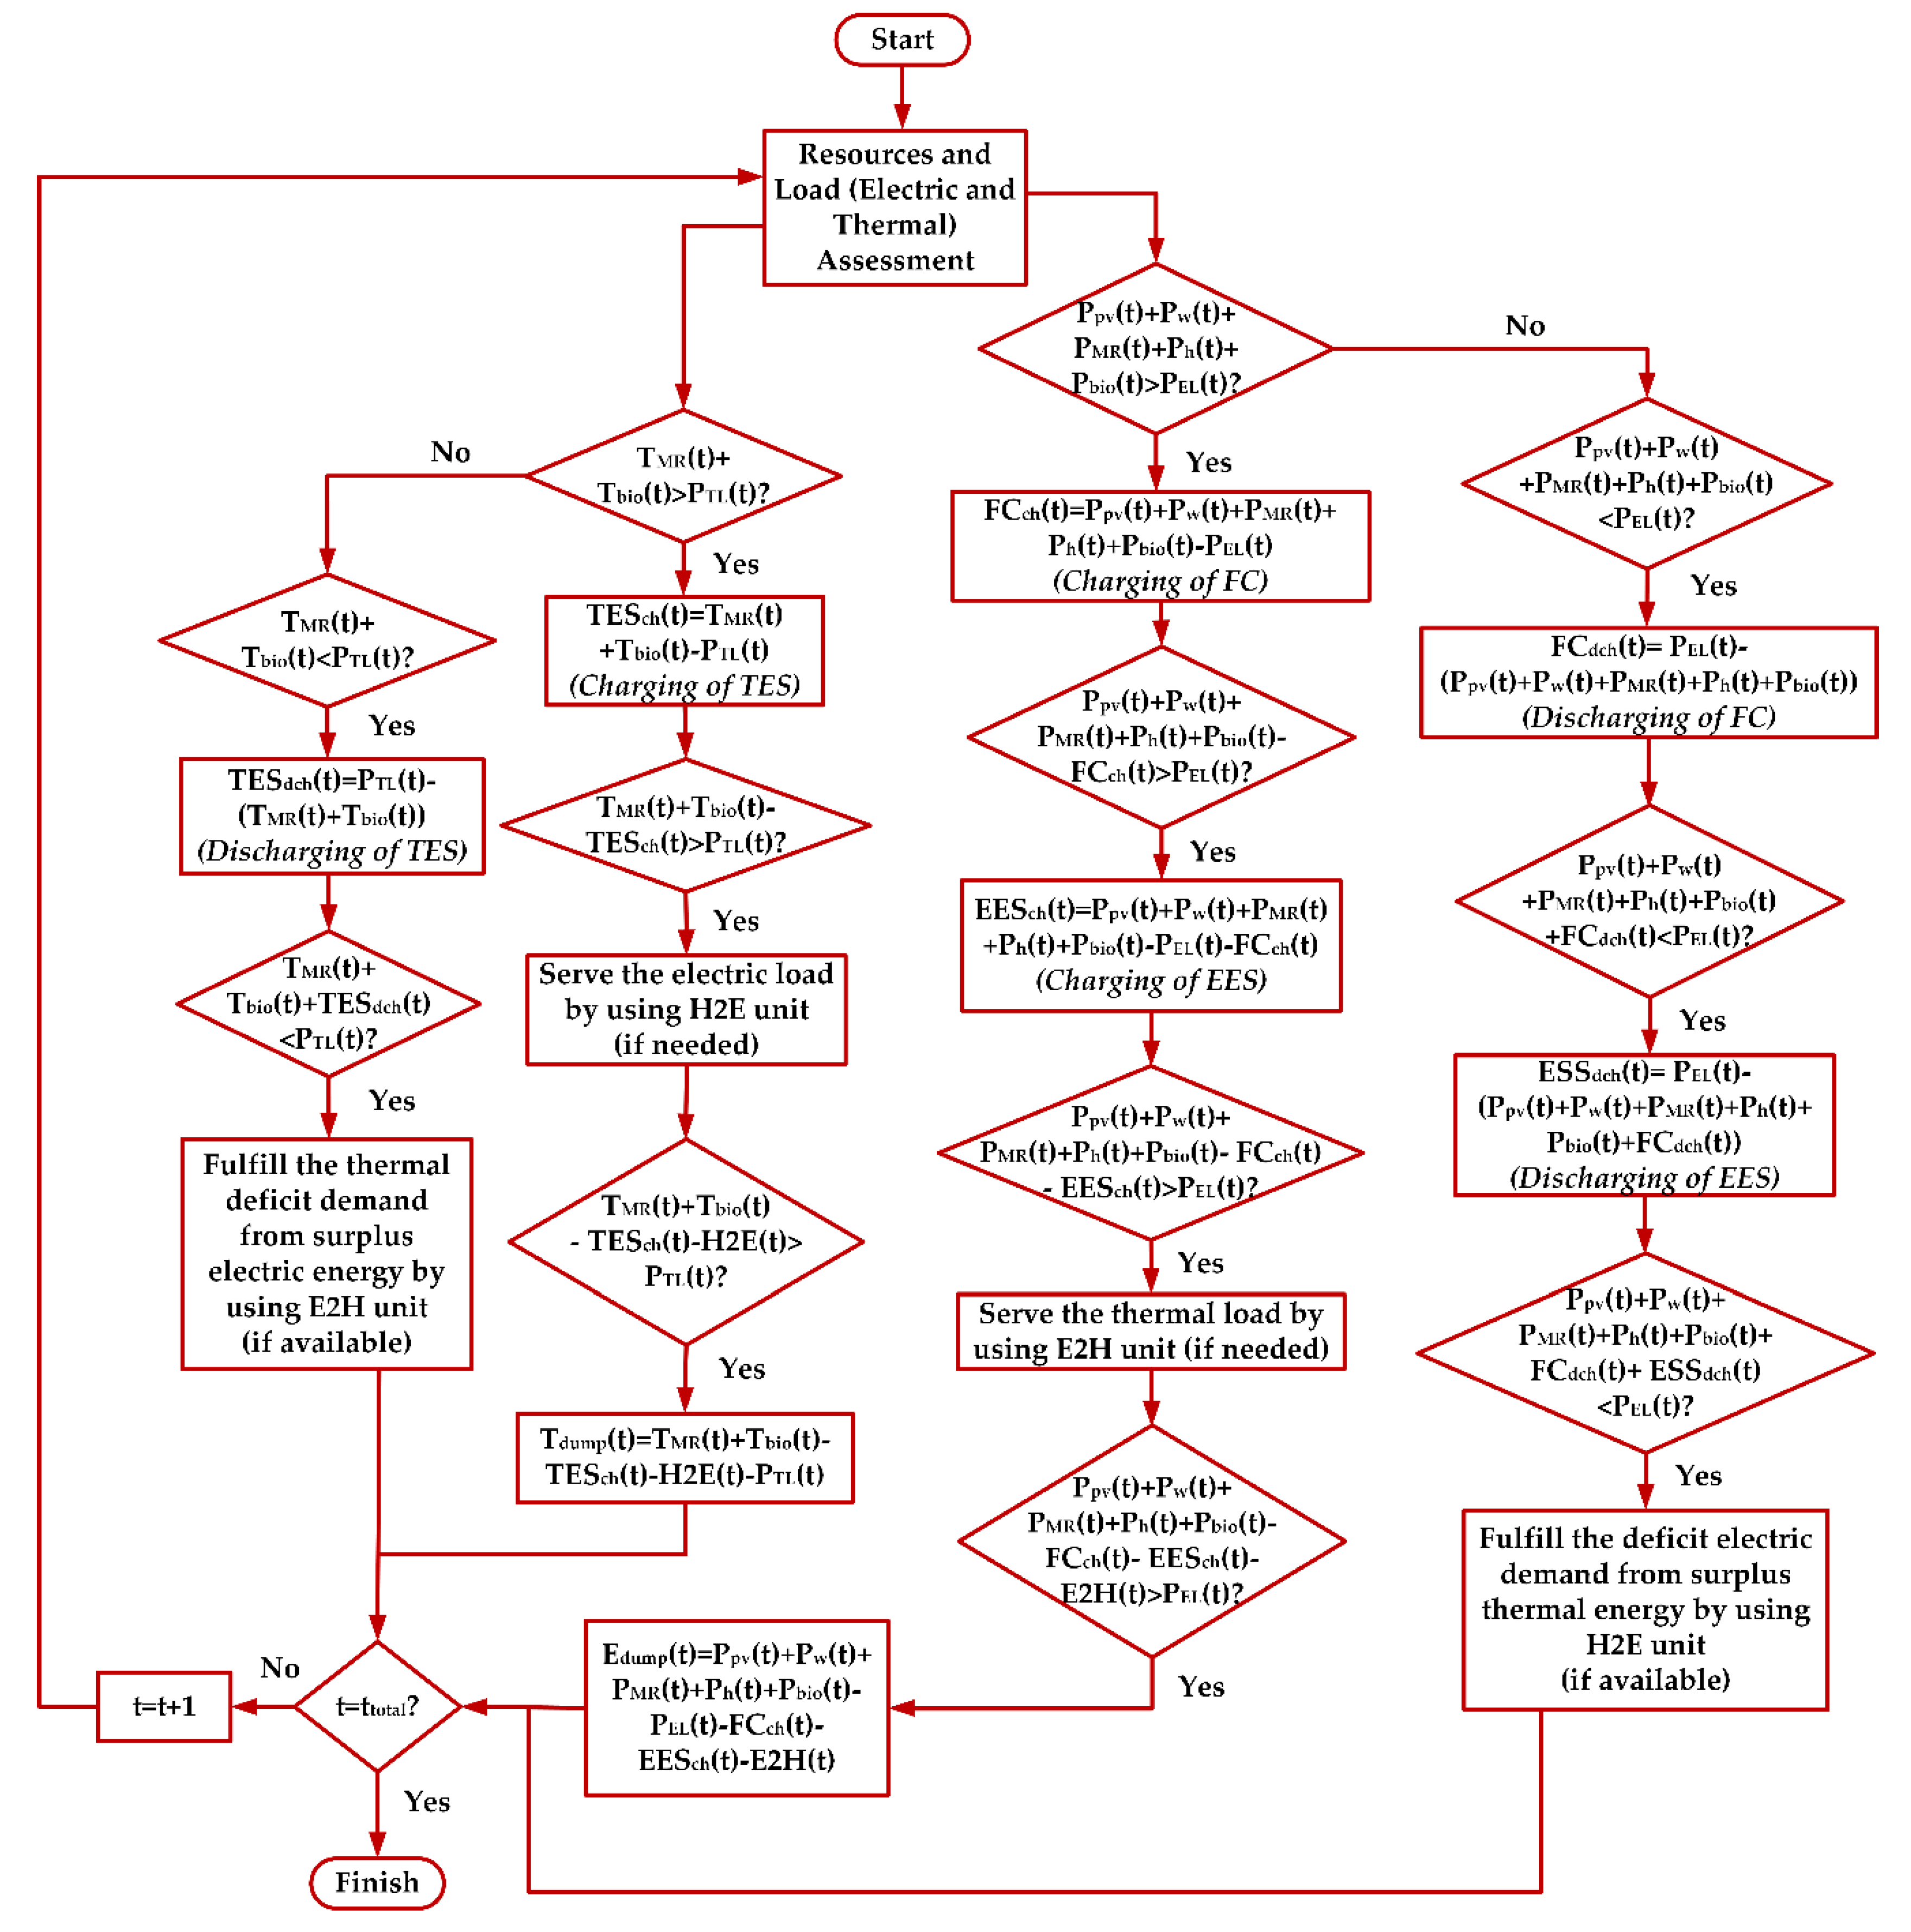
5.4. Implementation of Optimization Algorithm (Particle Swarm Optimization)
- Read the following input data of HES planning problem:
- (a)
- Load system demand data and meteorological data.
- (b)
- Load system equipment’s characteristics (e.g., MR, EES, hydrogen storage, and TES).
- (c)
- Load economic parameters of each system component.
- Initialize all the parameters of PSO and required system component:
- (a)
- Set the maximum number of iterations and population size to 300 and 250, respectively.
- (b)
- Set the number of individual runs to 100.
- (c)
- Set the personal acceleration coefficient () and global acceleration coefficient ().
- (d)
- Set the inertia coefficient (), damping ratio of the inertia coefficient ().
- (e)
- Set the value of constriction coefficient:
- (f)
- Set the constraints:
- (g)
- Set the upper bound and lower bound of the decision variables as follows:
- Upper bound and lower bound of all types of Genset: [50, 0]
- Upper bound and lower bound of the number of MR: [05, 0]
- Upper bound and lower bound of the number of PV panel: [100, 0]
- Upper bound and lower bound of the number of WT: [100, 0]
- Upper bound and lower bound of HT (kW): [1000.64, 0]
- Upper bound and lower bound of MR CHP efficiency (%): [30, 0]
- Upper bound and lower bound of the number of hydrogen tank: [25, 0]
- Upper bound and lower bound of EES (MW): [100, 0]
- Upper bound and lower bound of TES (MW): [25, 0]
- Apply the particle positions to find the value of the objective function.
- Update the individual best position by comparing it with the other populations.
- Identify the global best.
- Update velocities by using Equation (78). Apply the velocity limits.
- Update the position of the particles. Apply the upper bound and lower bound limits. Follow Step 3 to Step 7 until all the particles are evaluated.
- Different particles provide a different value of cost function. Store the best cost value.
- Update inertia weight.
- If the simulation reaches the maximum number of iterations, then stop. Otherwise, update the iteration variable and continue from Step 3 to Step 10. If the program is set to run multiple independent runs, then the program will run up to the specified number of individual runs.
6. Results
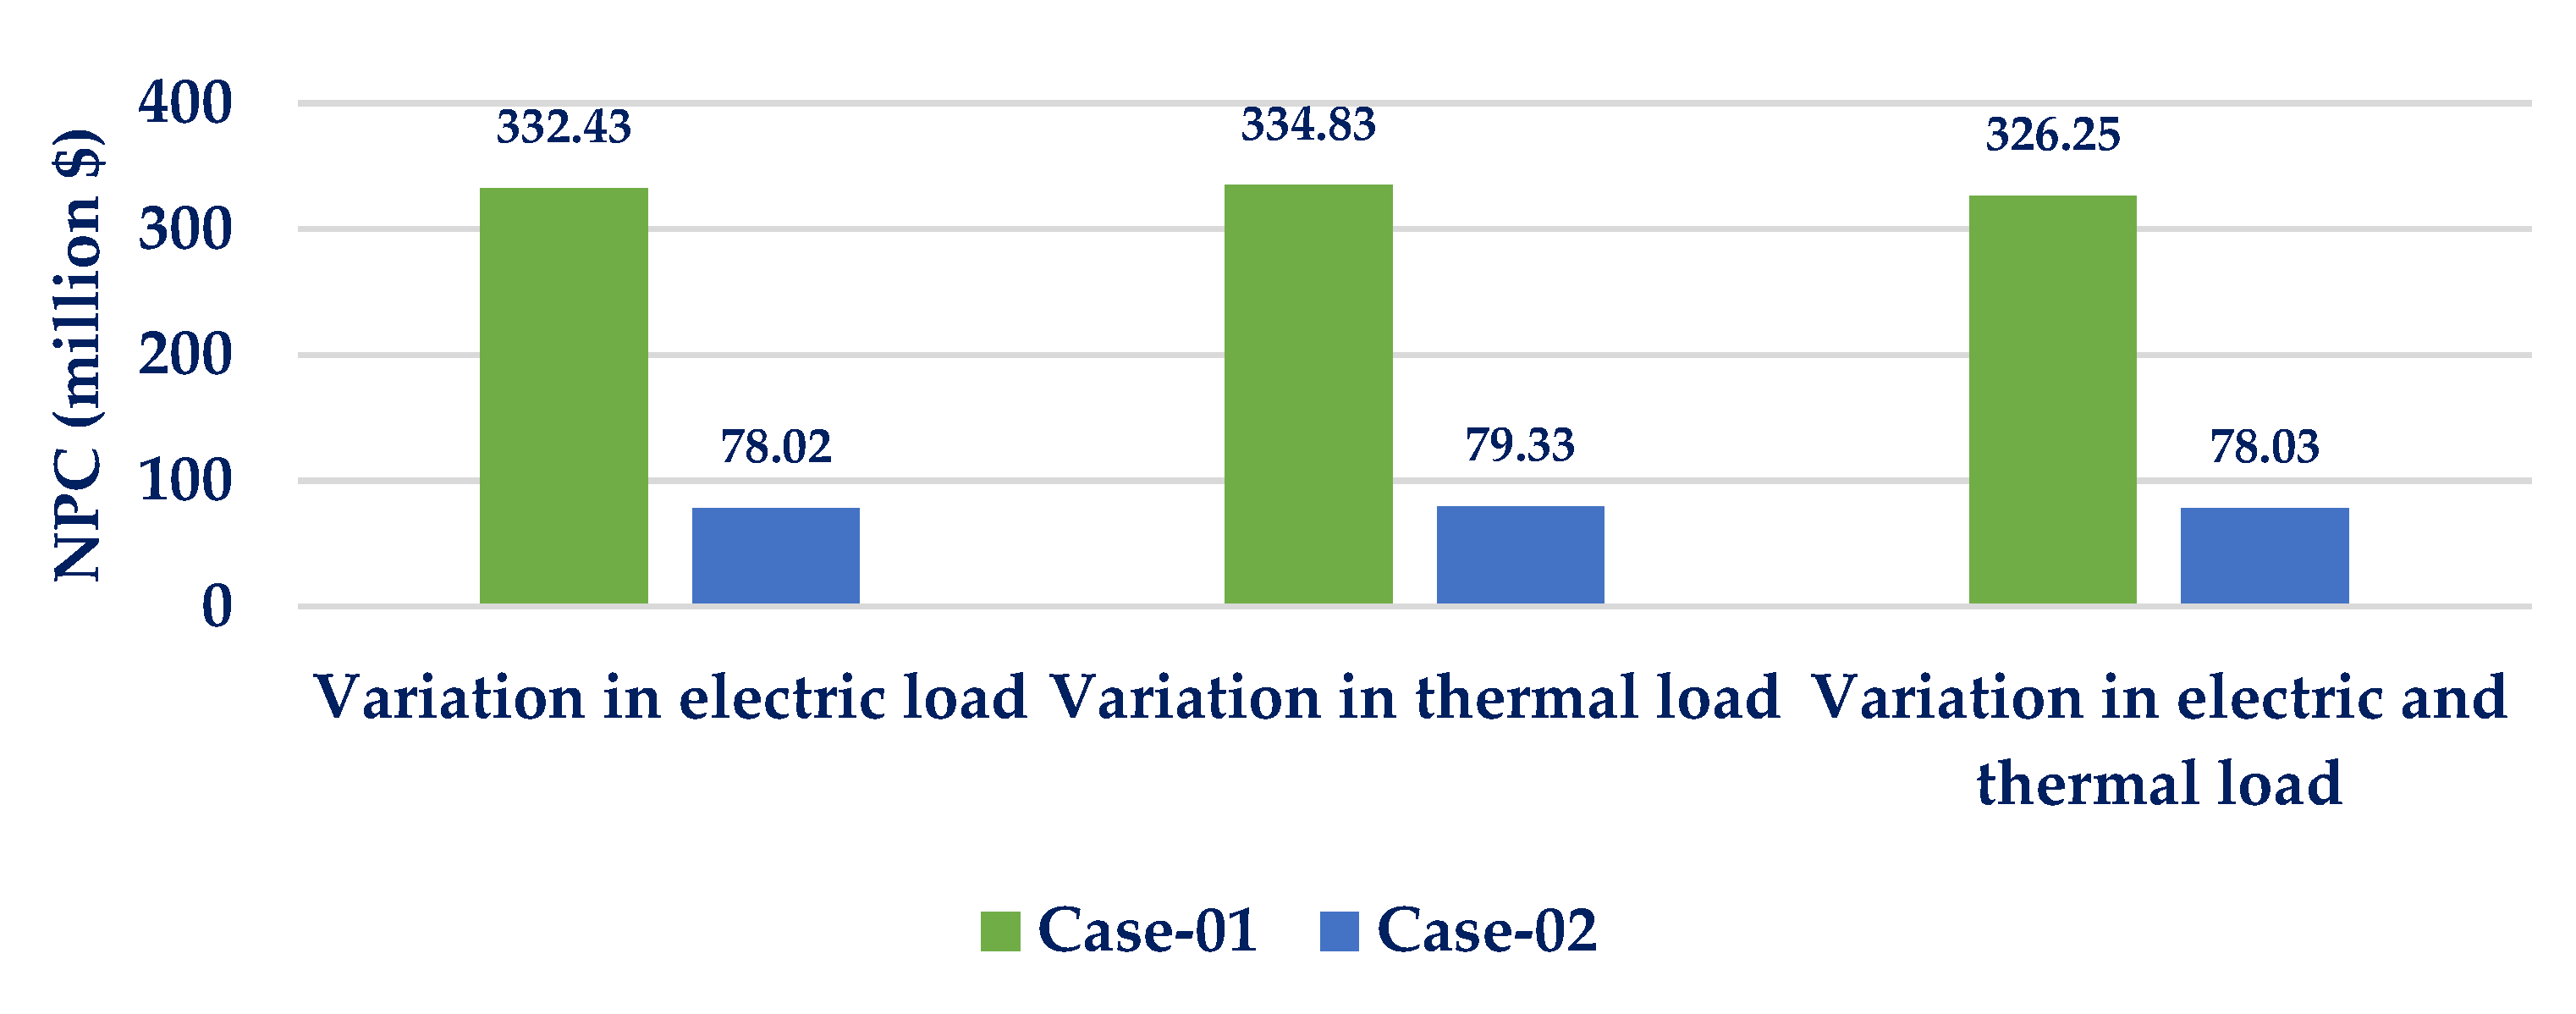
6.1. Assessment of Sensitivity to Shifting Daily Peak Demand
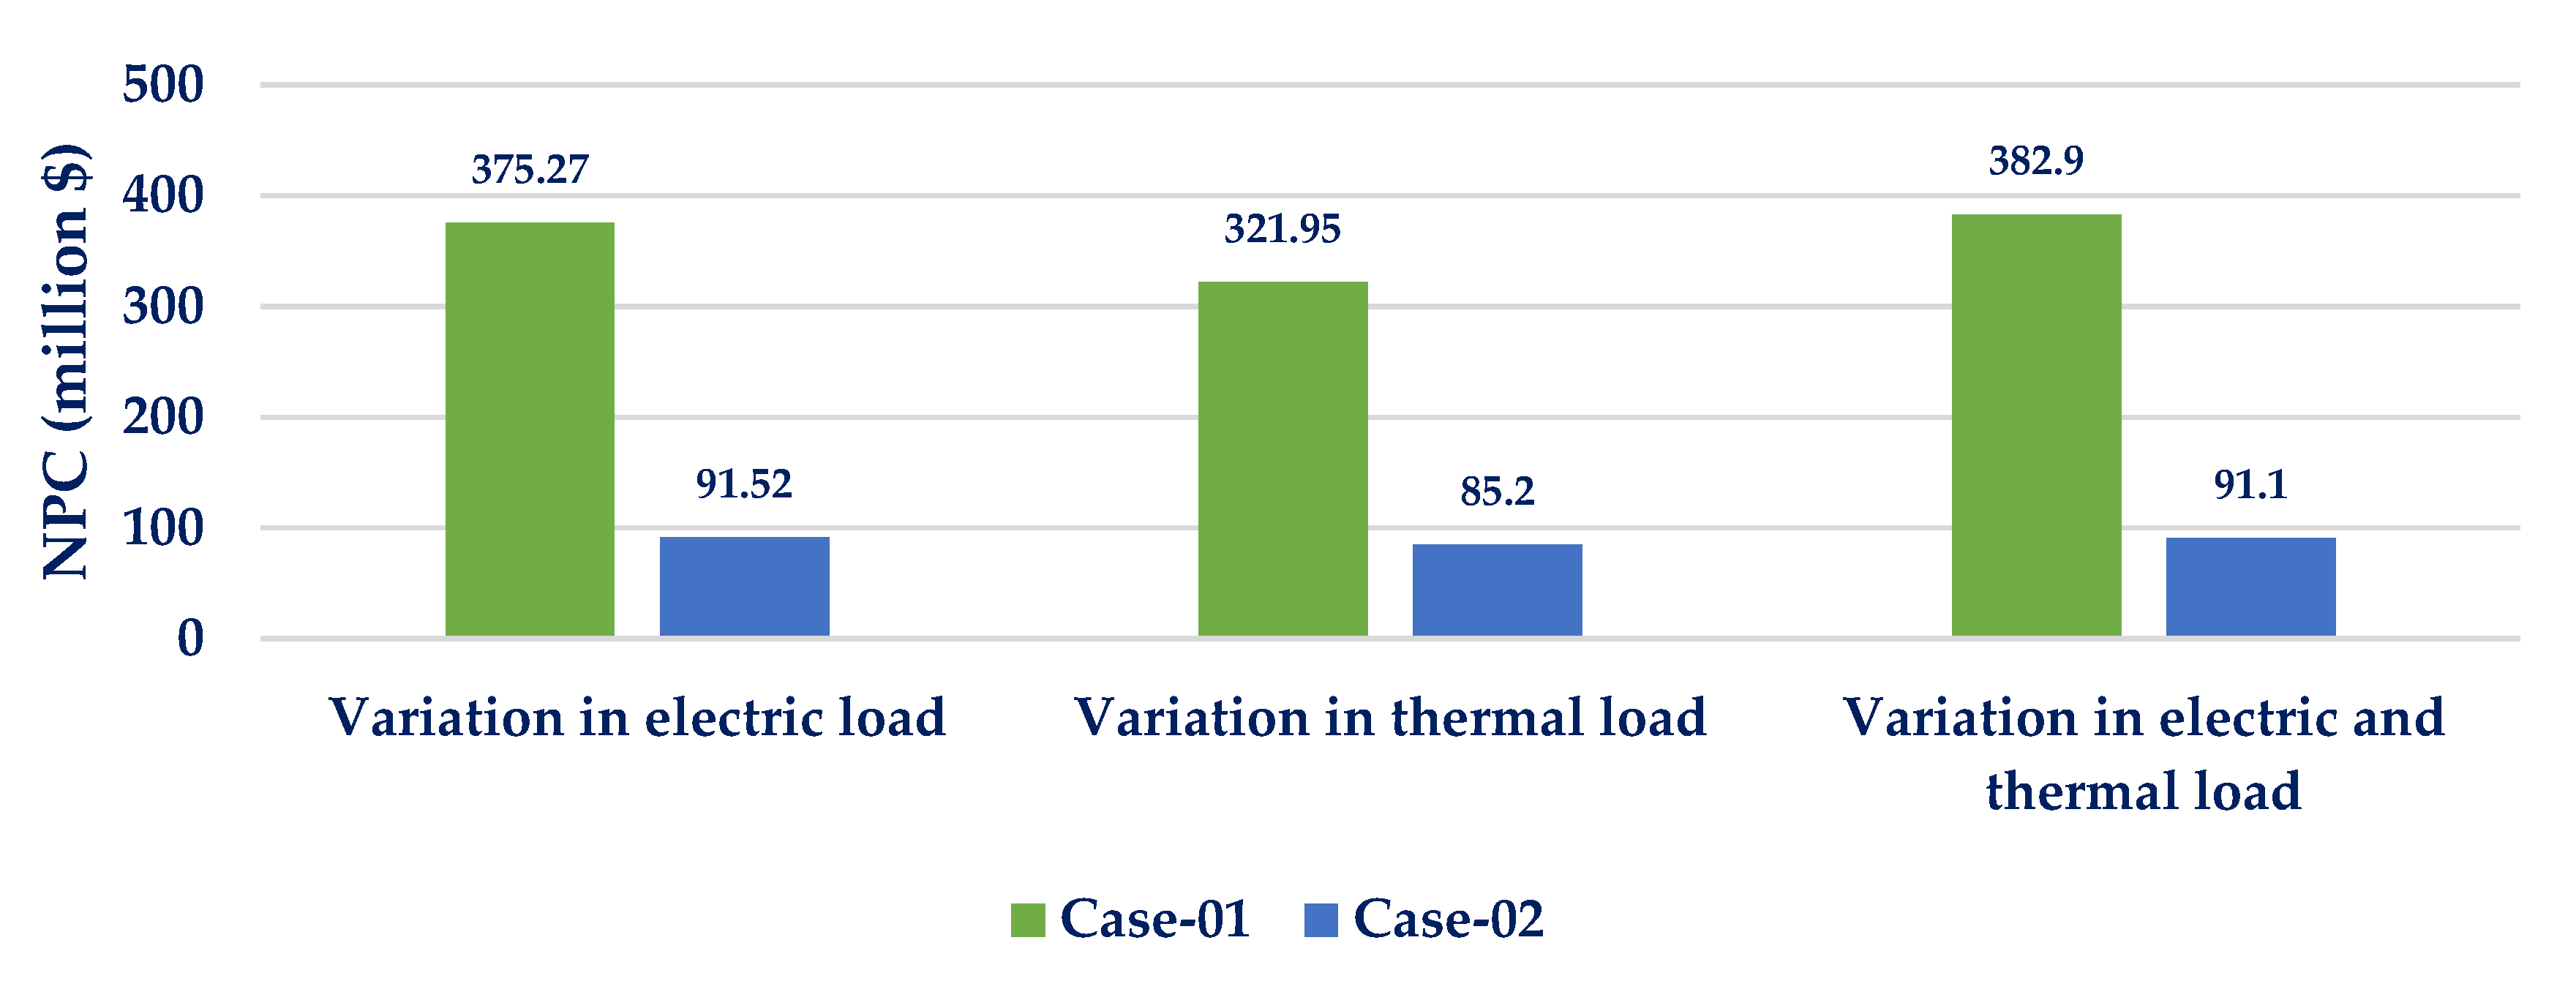
6.2. Assessment of Sensitivity to Shifting of Seasonal Demand
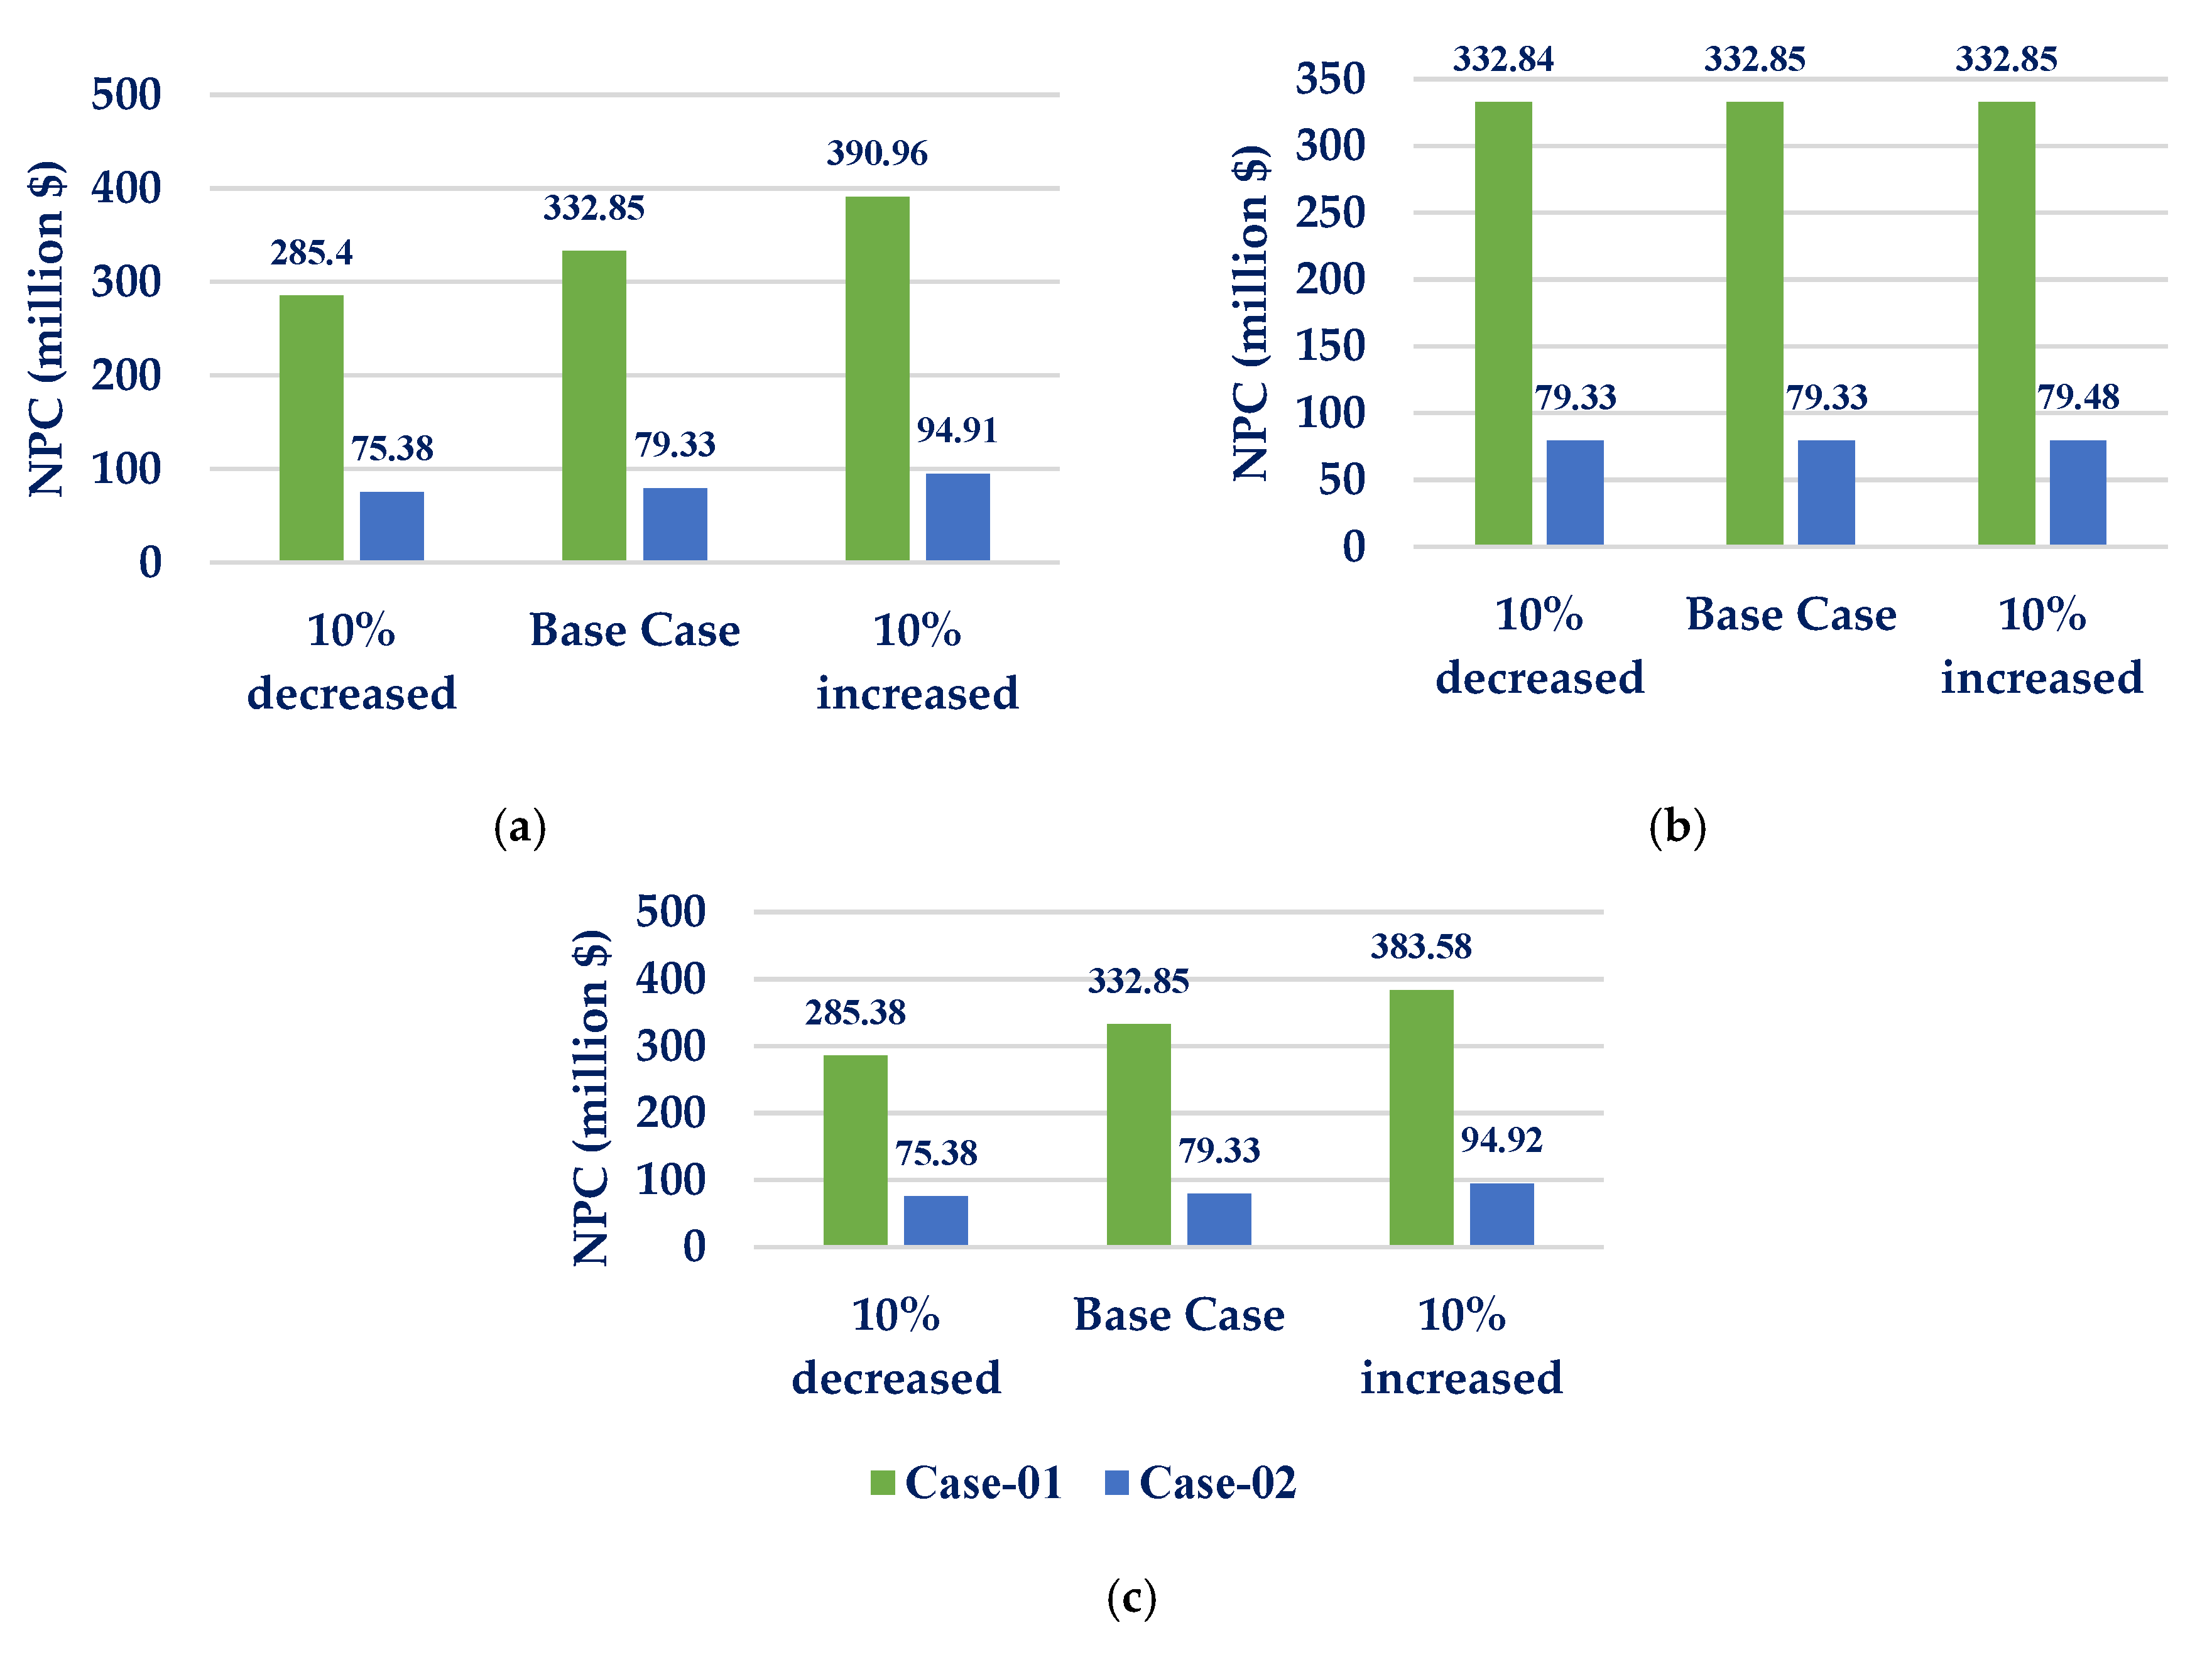
6.3. Assessment of Sensitivity to Variation in Average Energy Demand
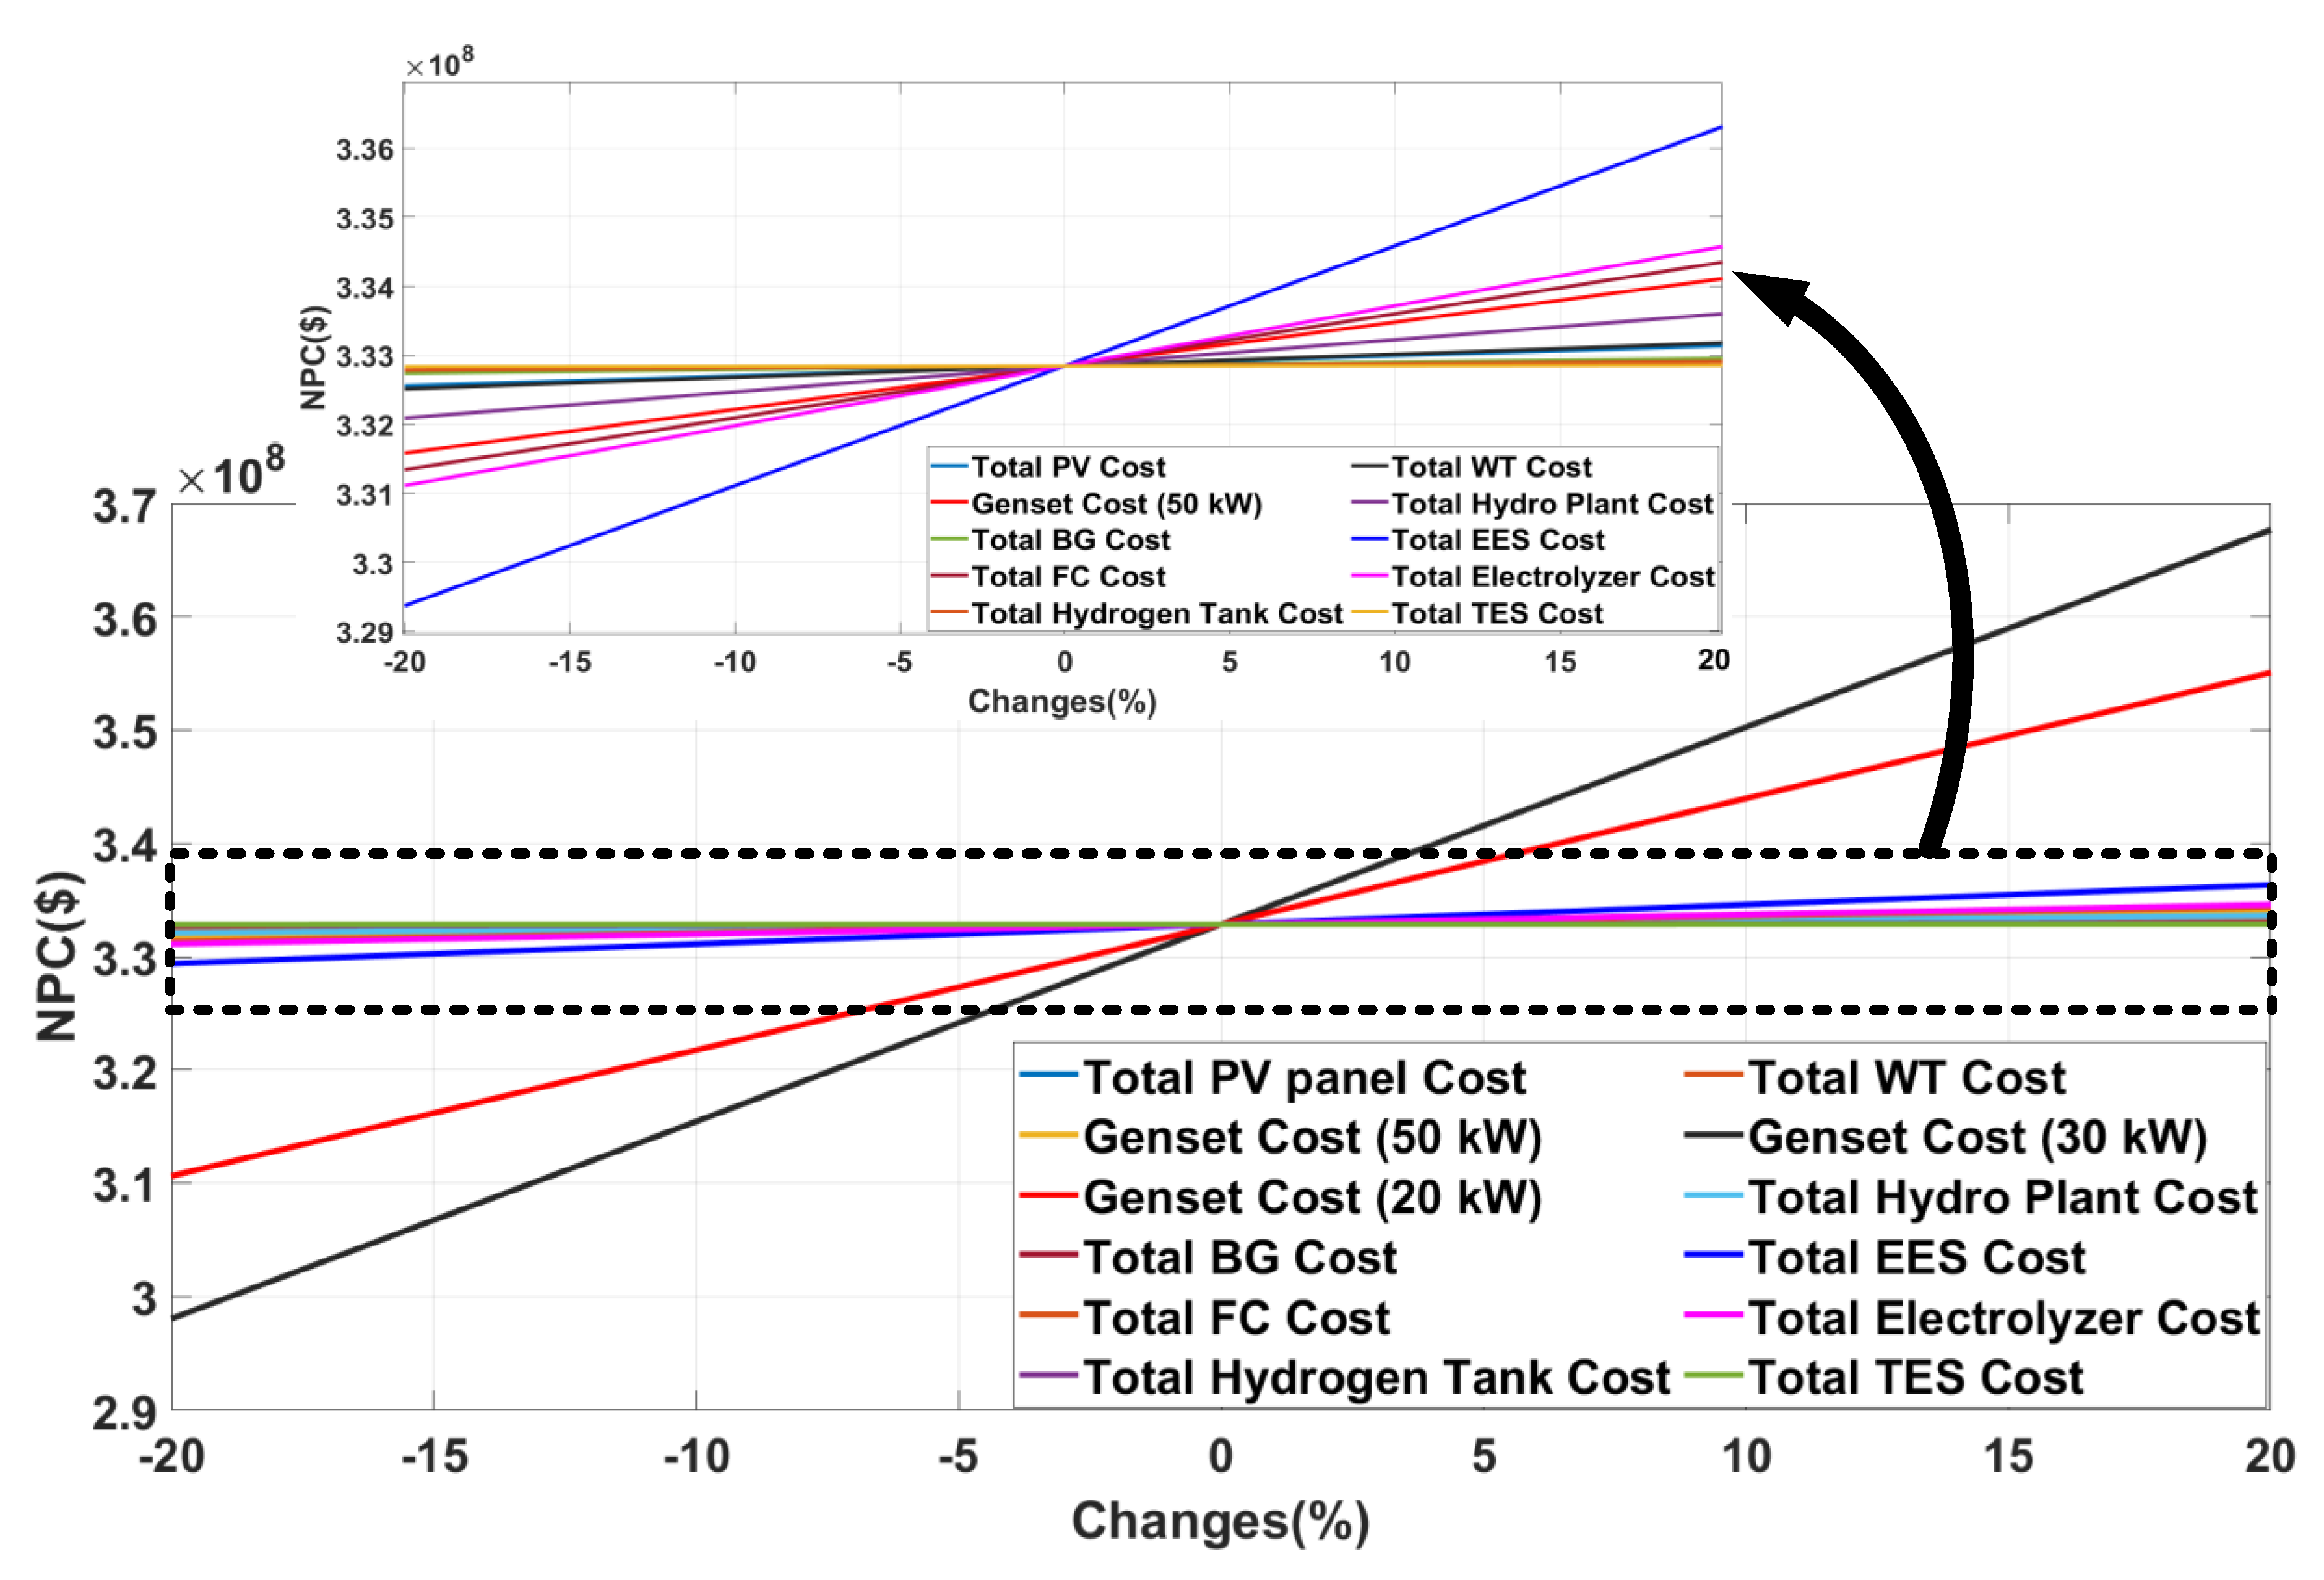
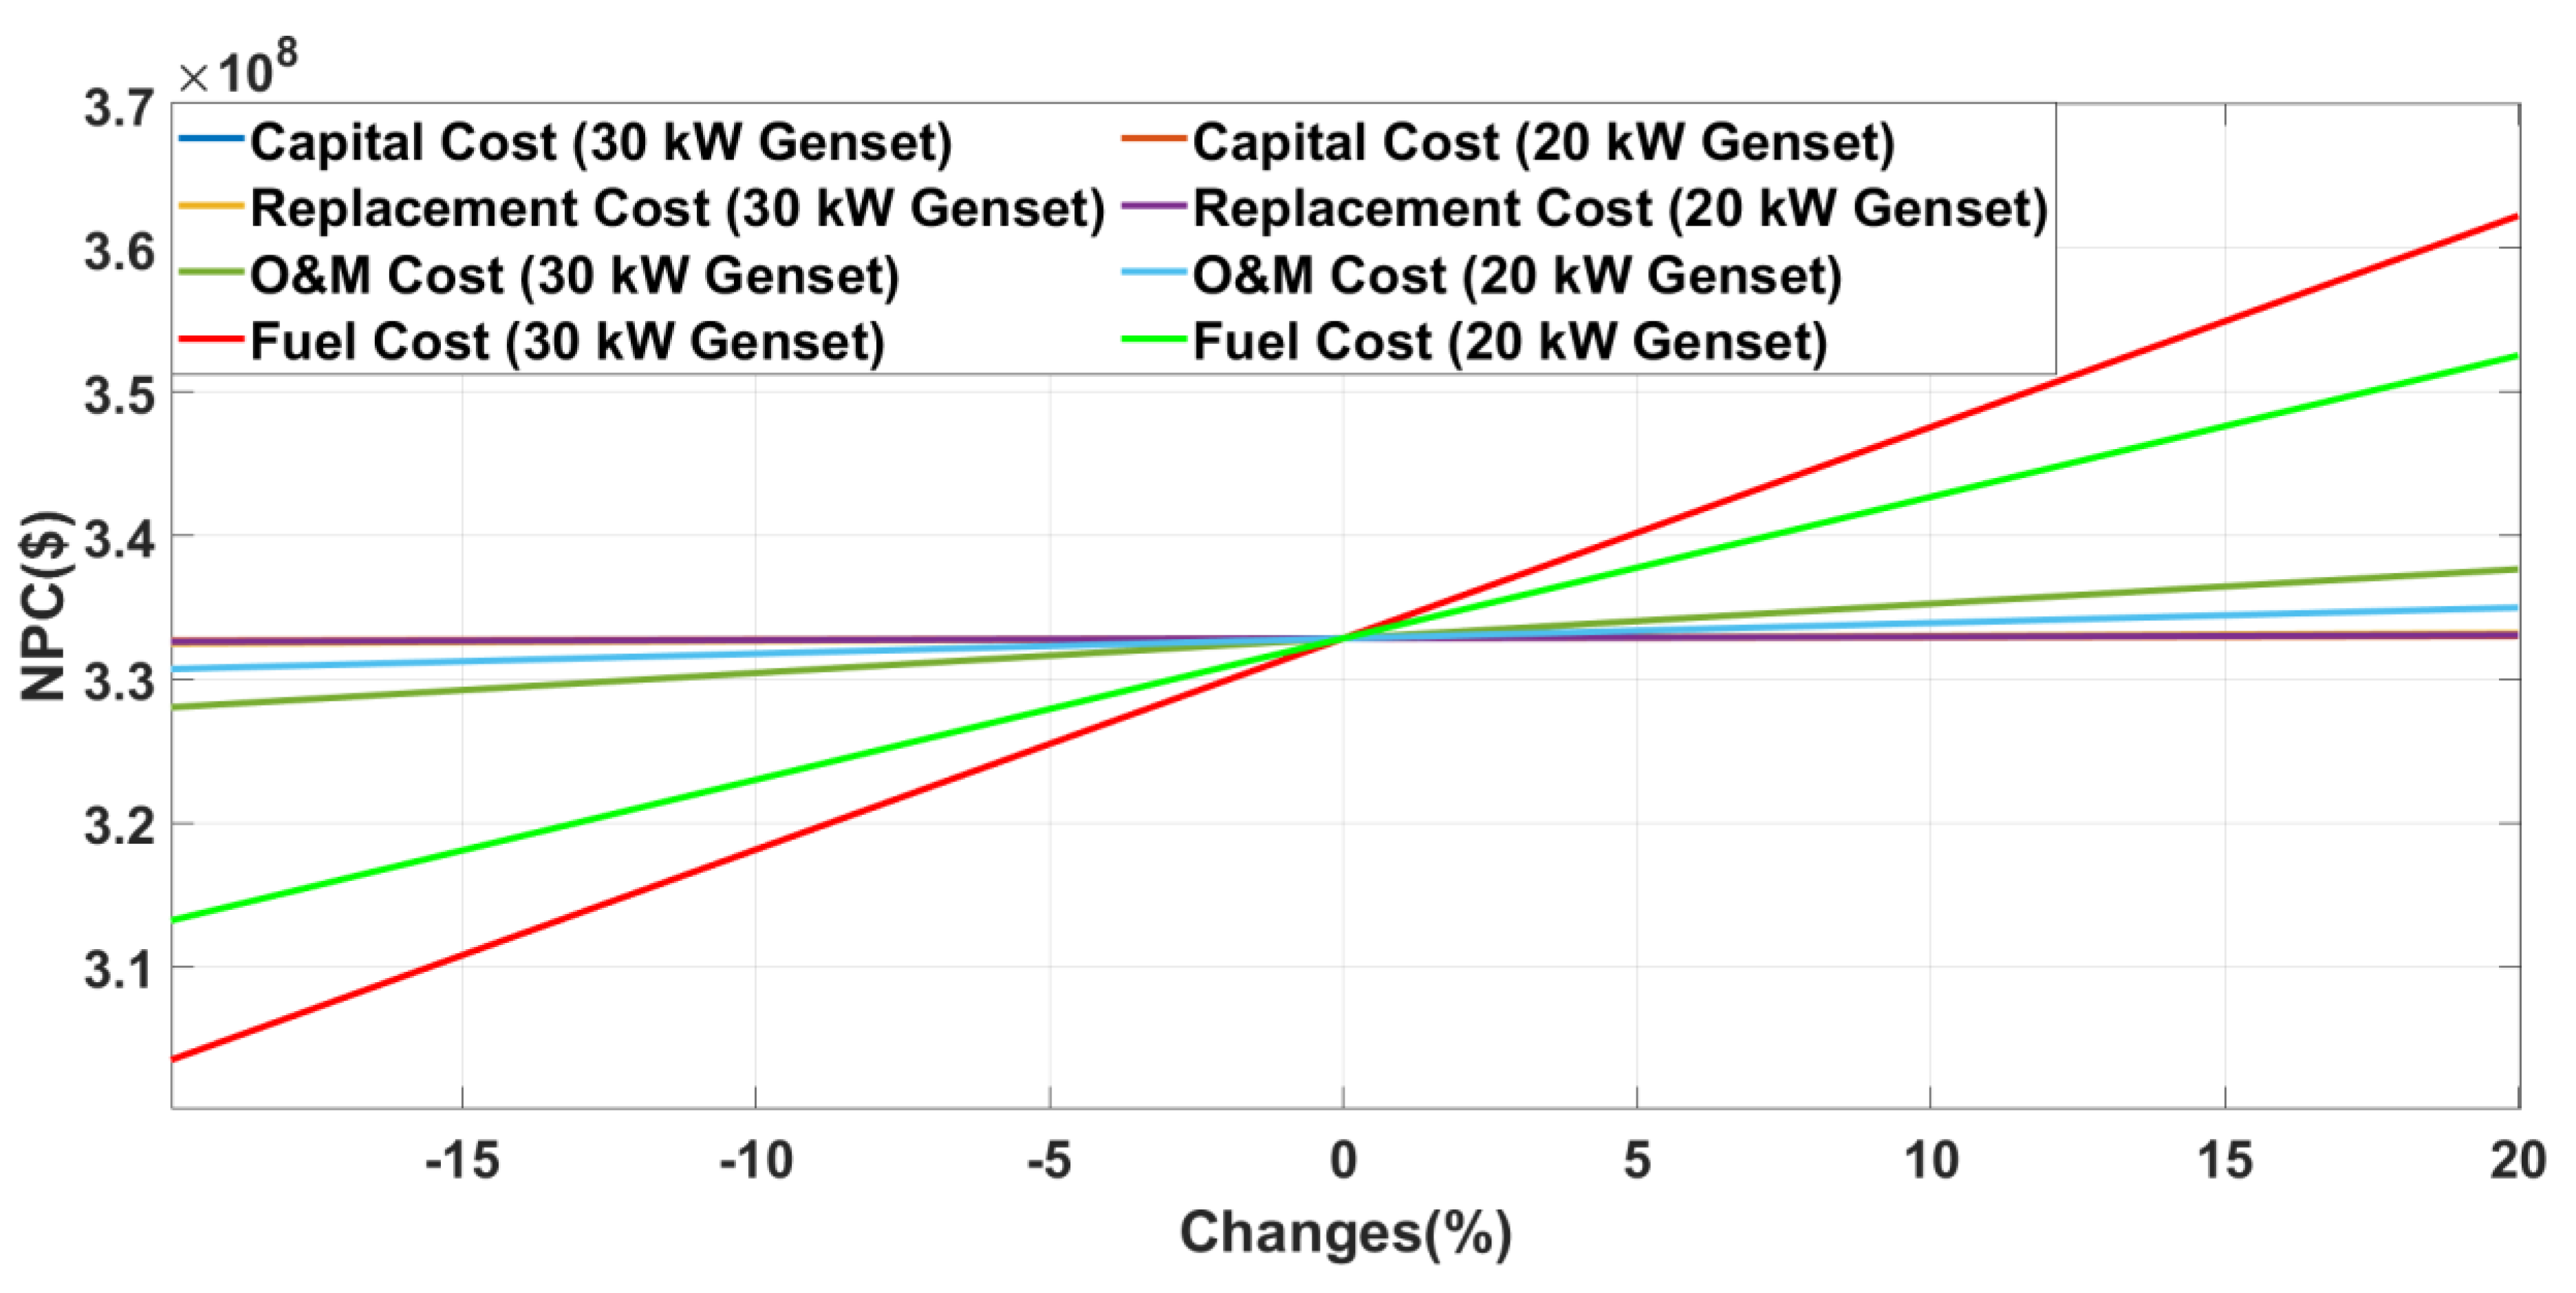
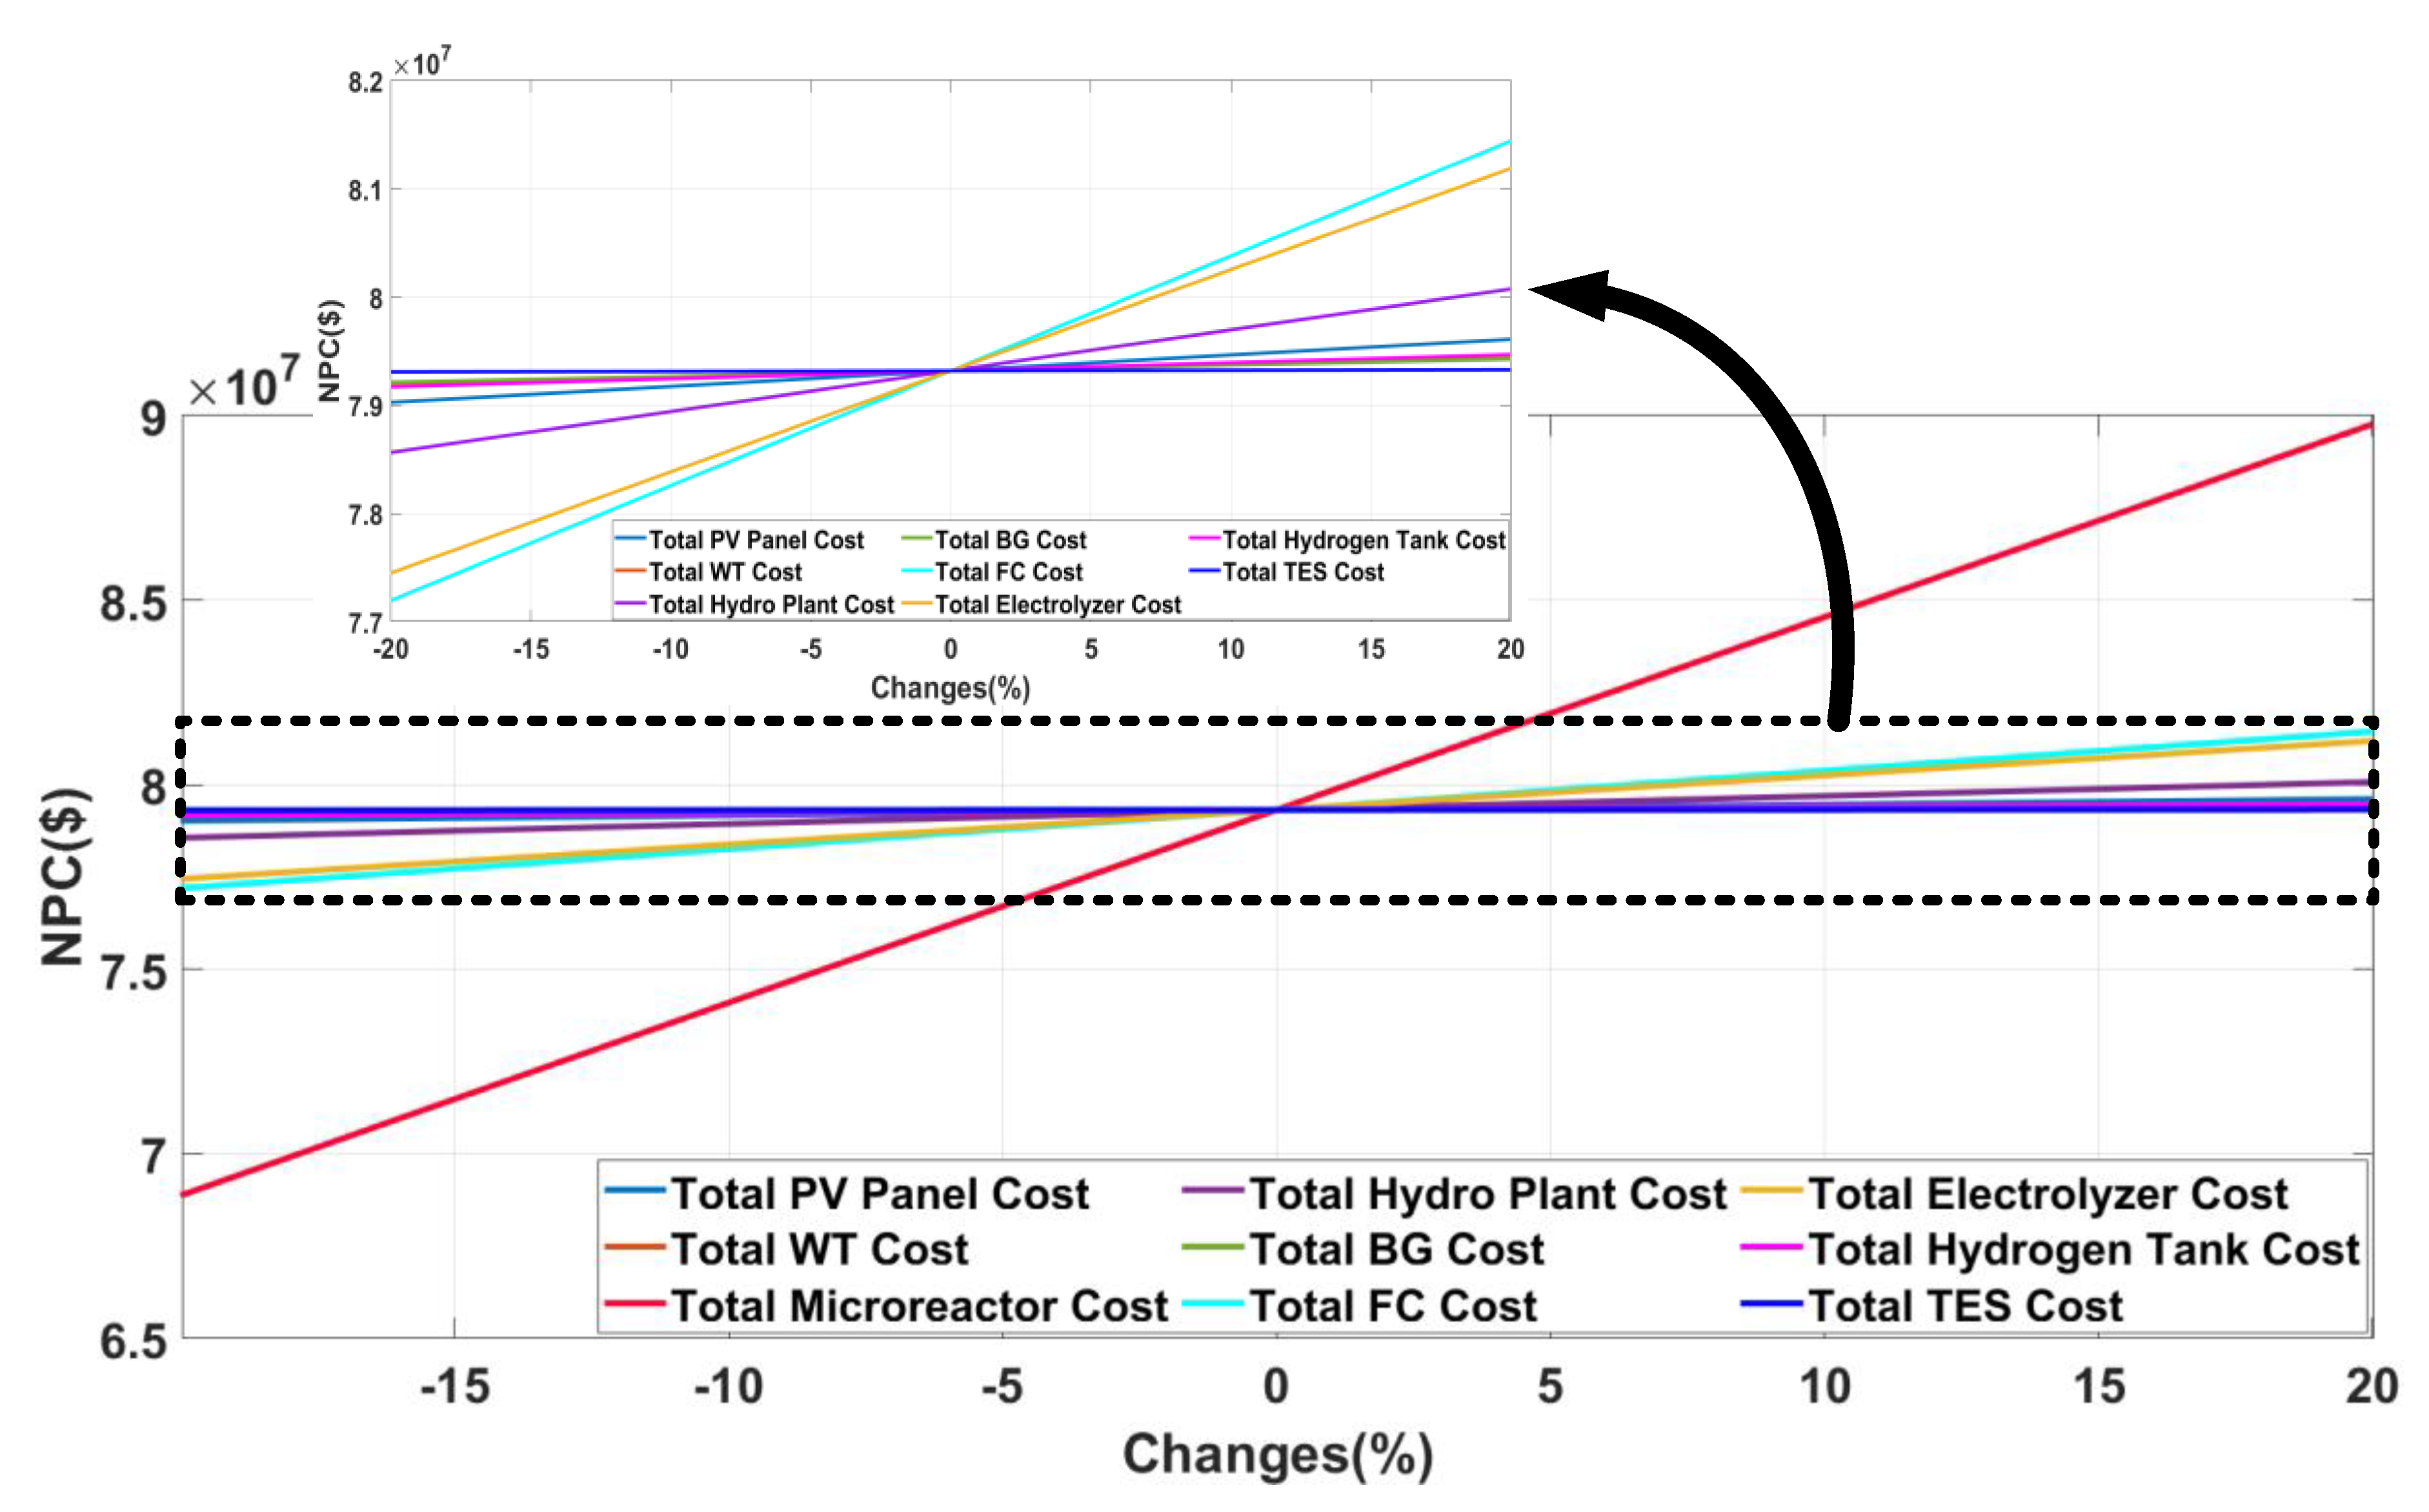
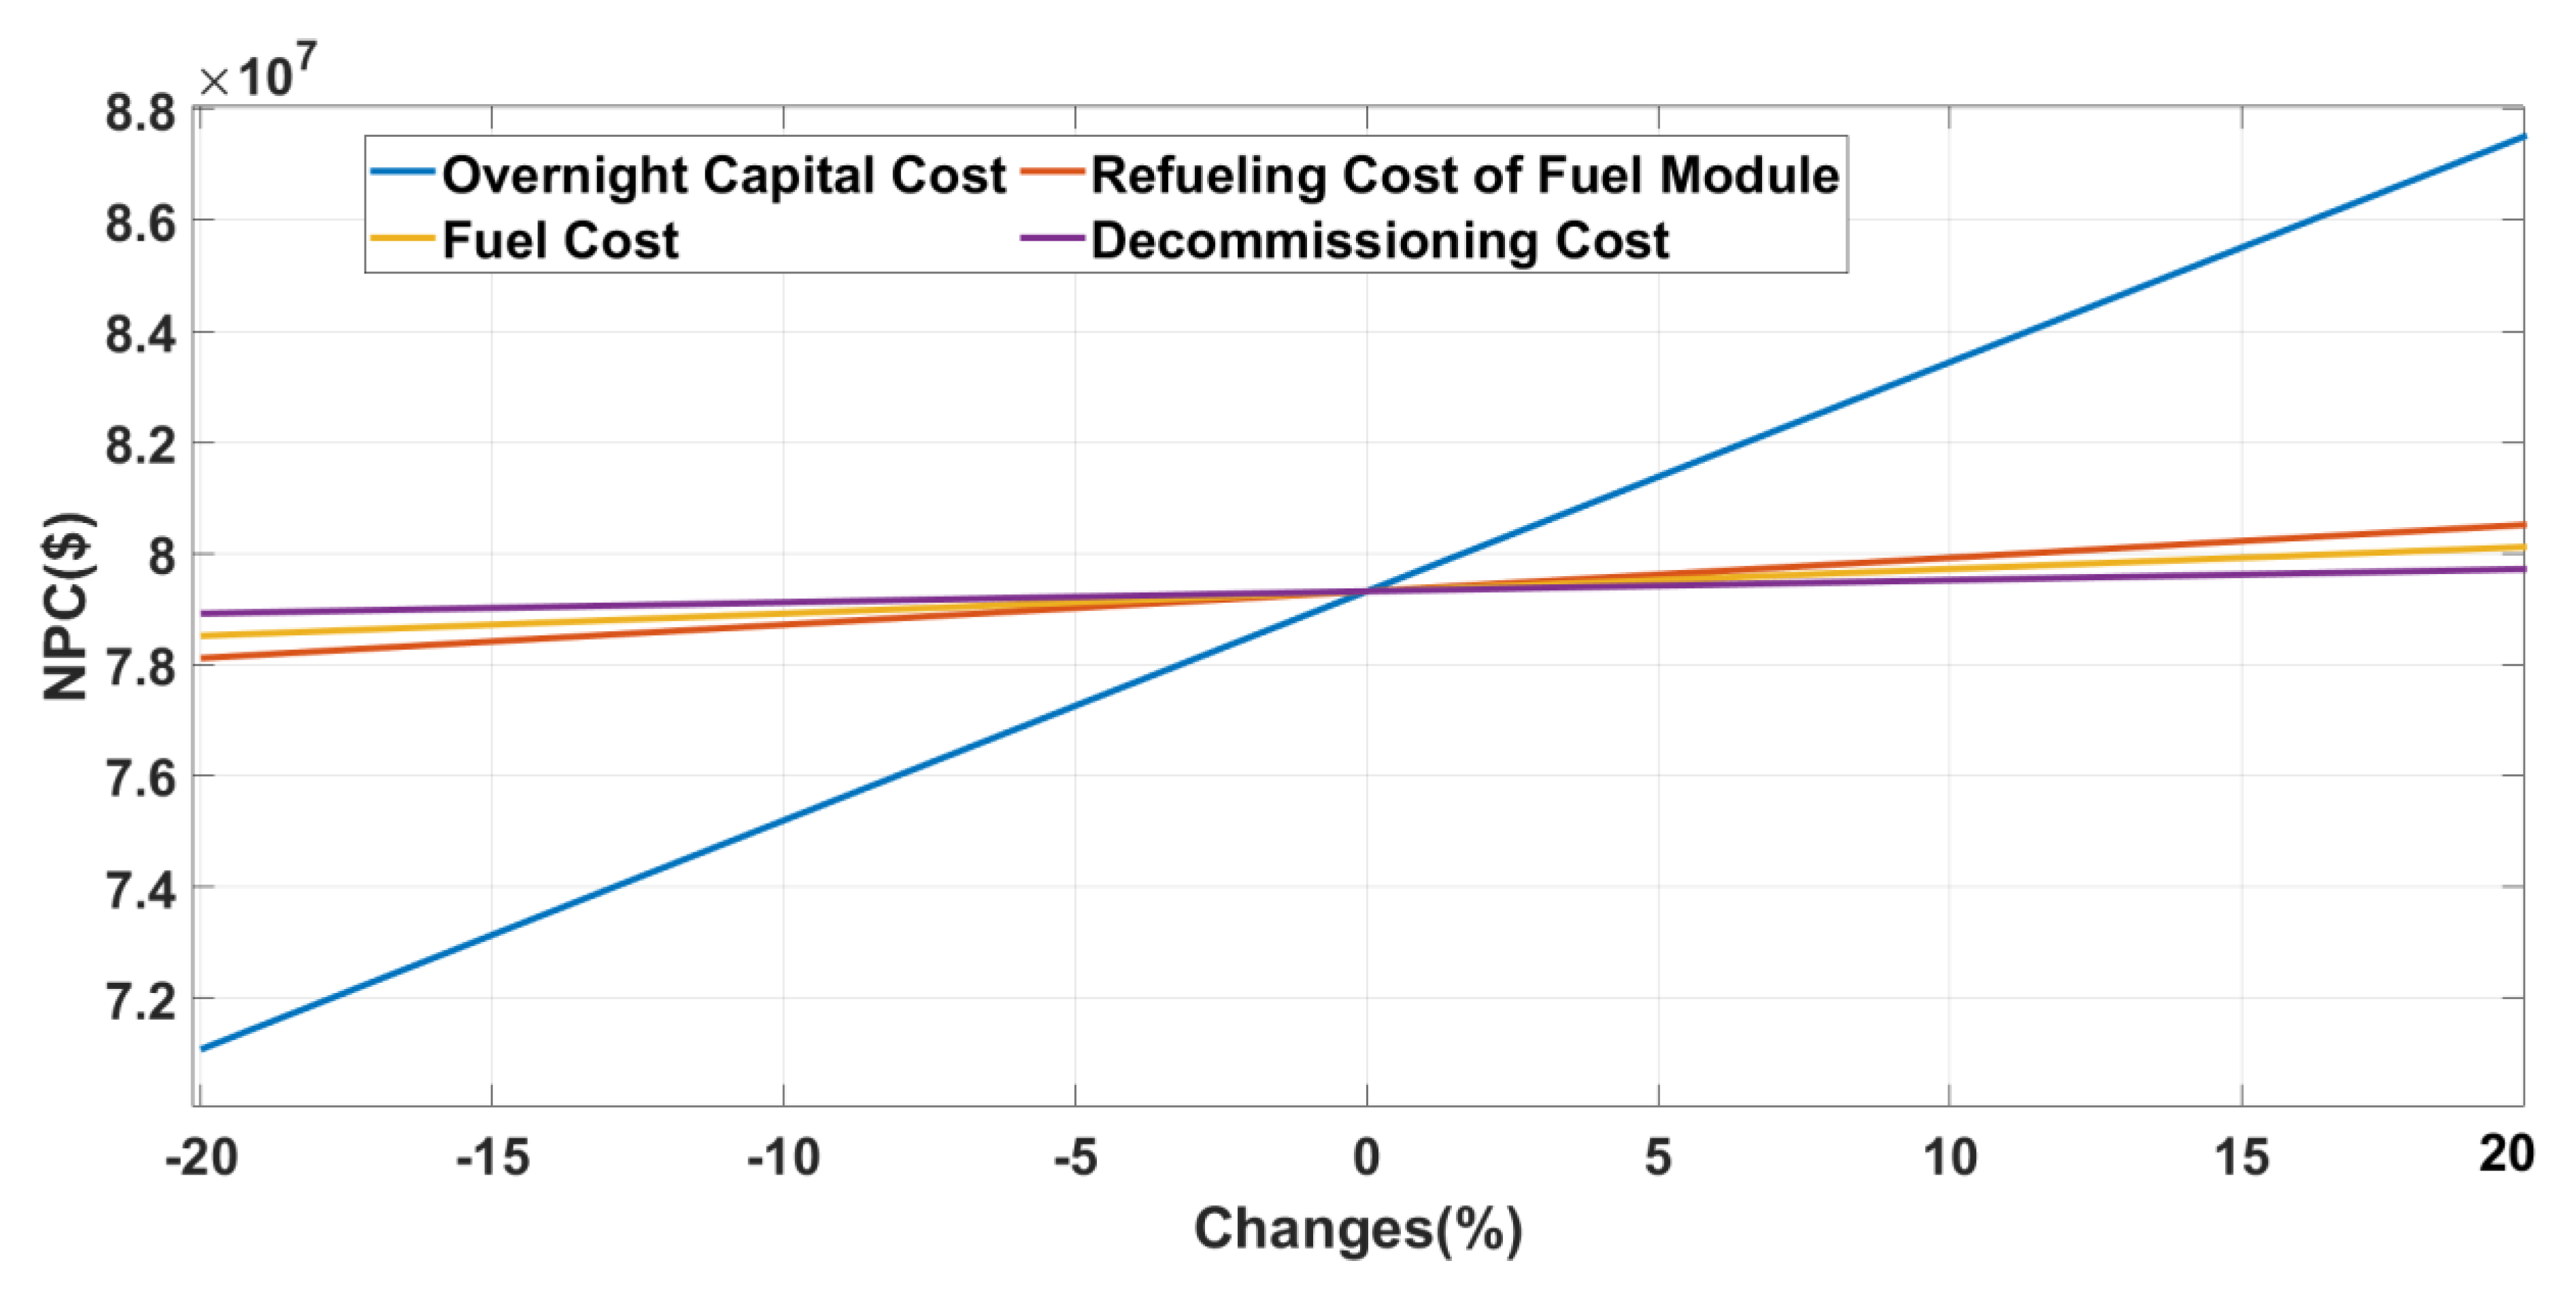
6.4. Assessment of Sensitivity to Variation in System Equipment Cost
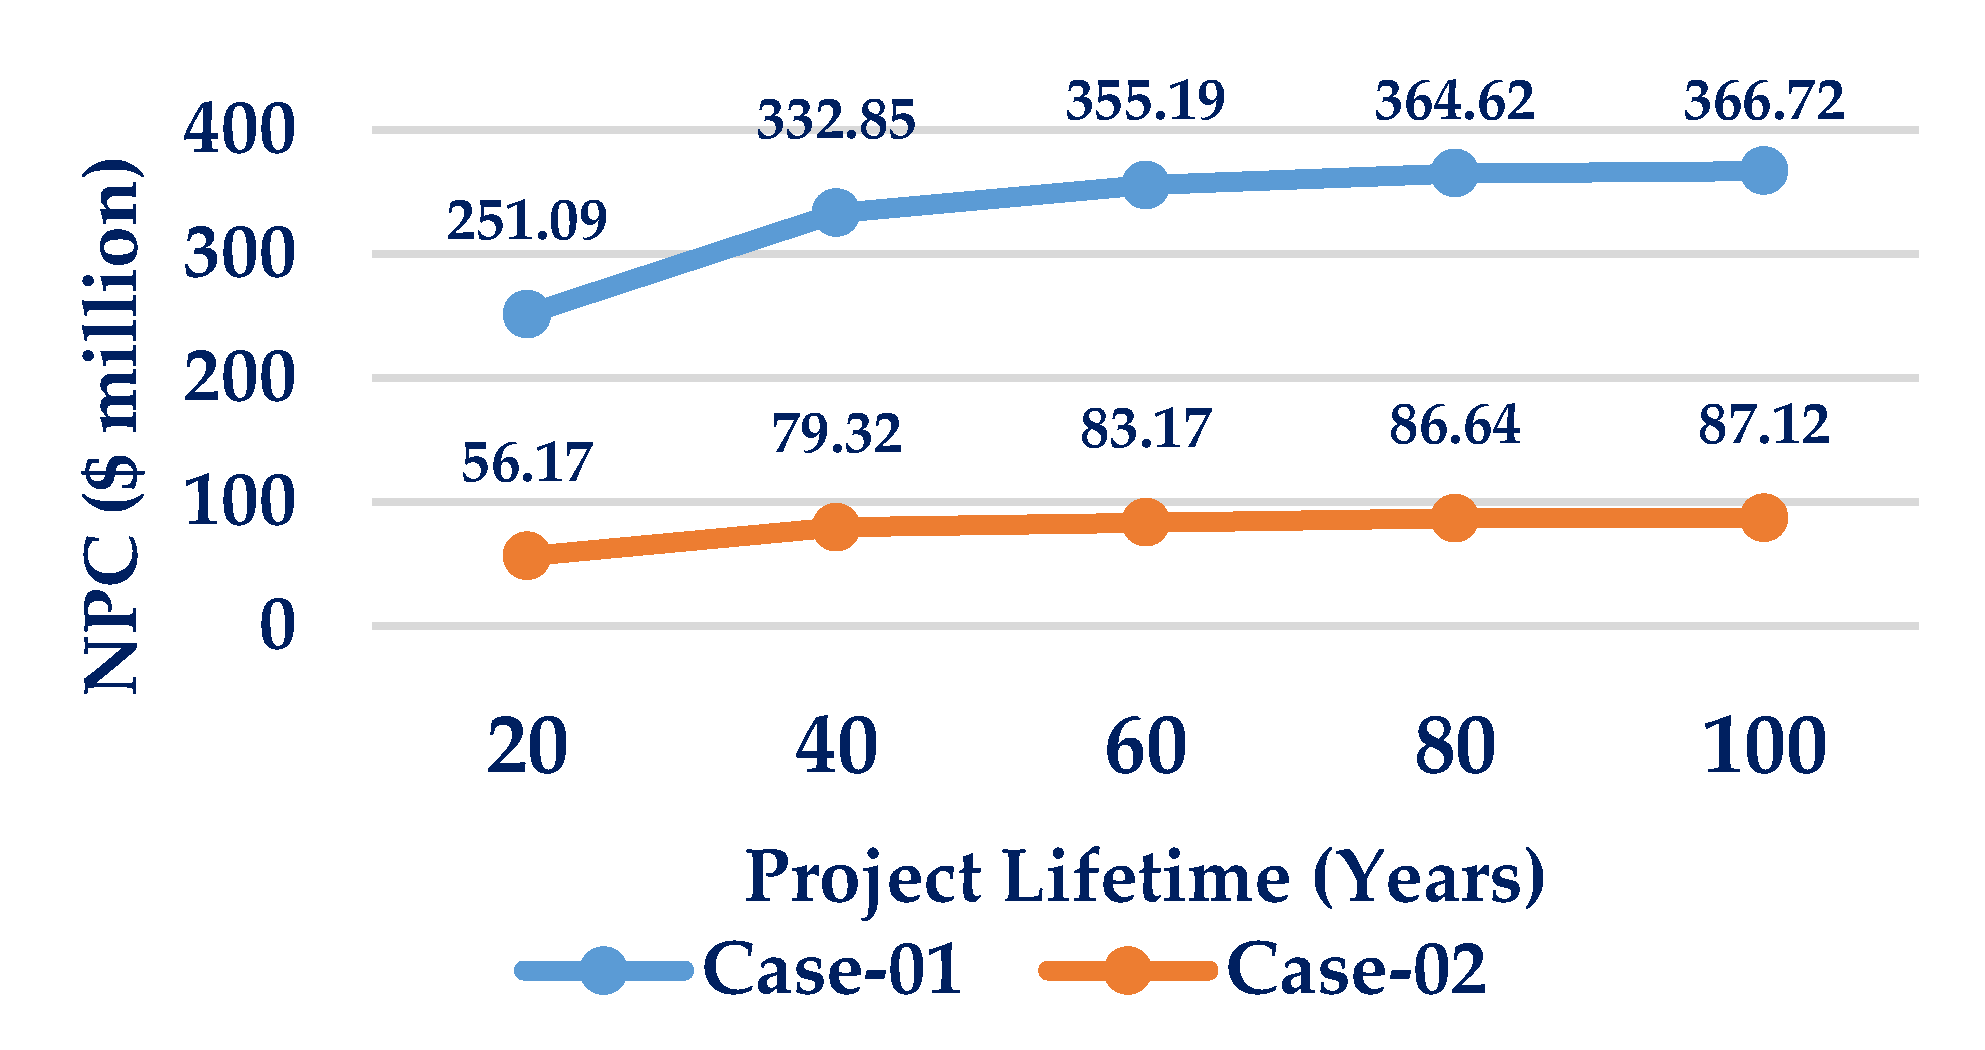
6.5. Assessment of Sensitivity to Variation in Project Lifetime
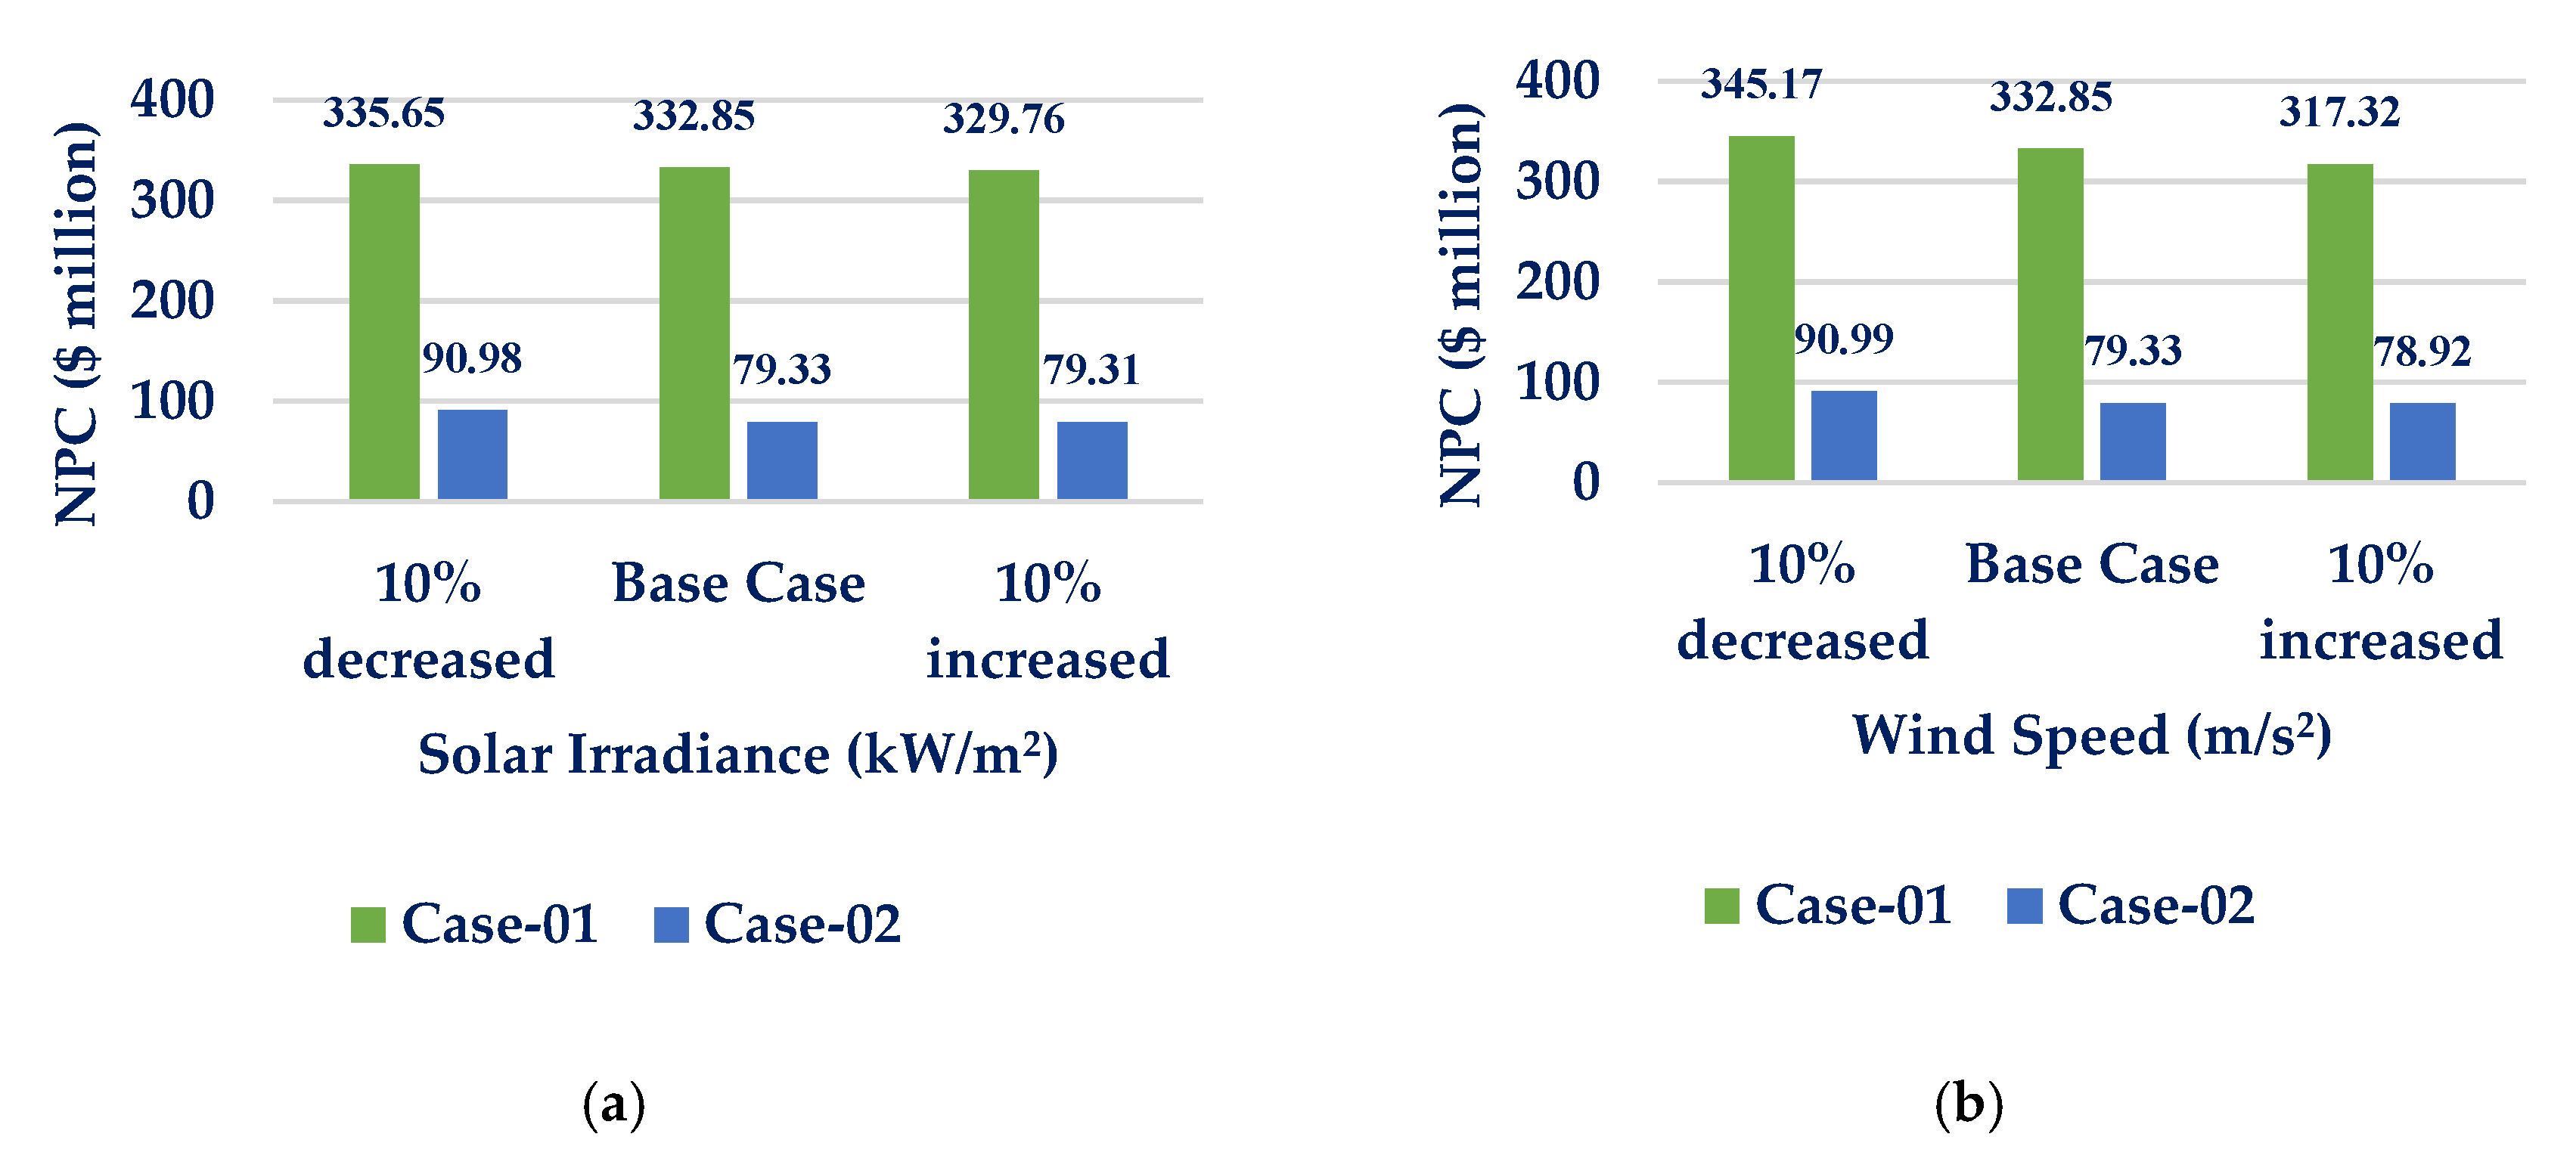
6.6. Assessment of Sensitivity to Variation in Renewable Resources
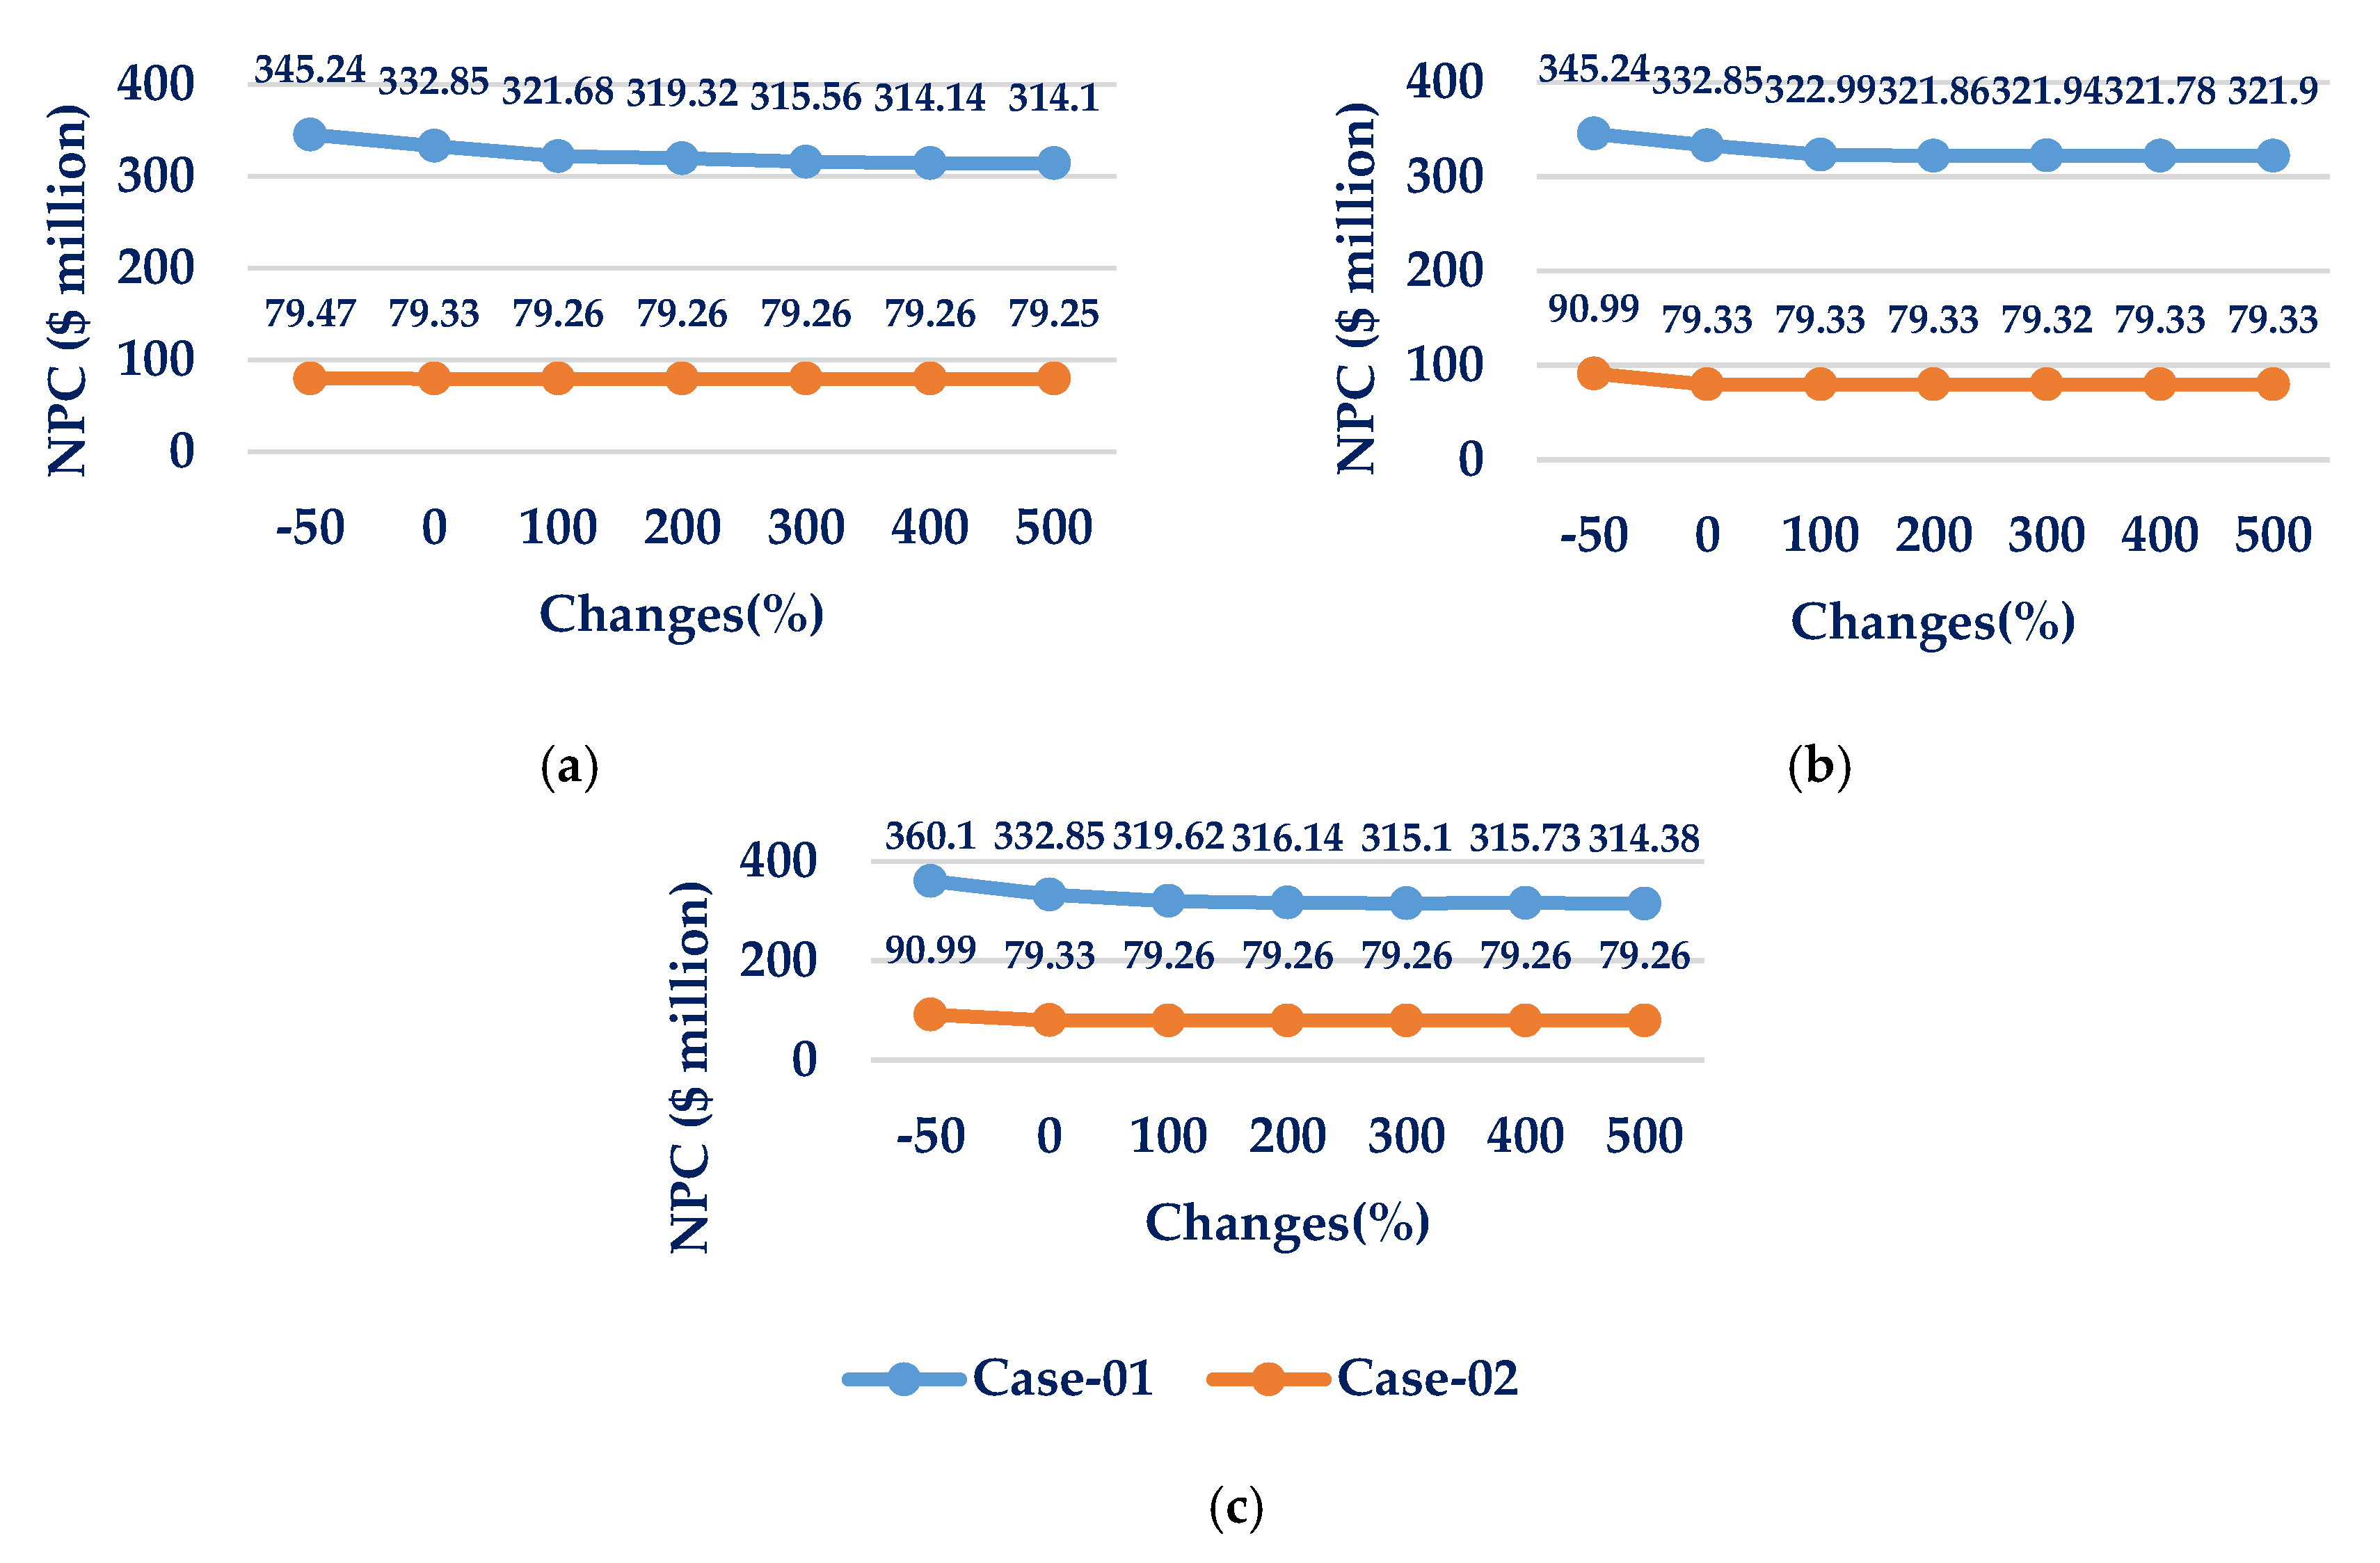
6.7. Assessment of Sensitivity to Variation in PV panels and WT Availability
7. Discussion
Author Contributions
Funding
Conflicts of Interest
Nomenclature
| BG | Biogas Generator |
| CHP | Combined Heat and Power |
| E2H unit | Electricity-to-Heat conversion unit |
| EES | Electric Energy Storage |
| FC | Fuel Cell |
| GRF | Generation Reliability Factor |
| HES | Hybrid Energy System |
| HT | Hydro Turbine |
| H2E unit | Heat-to-Electricity conversion unit |
| KPI | Key Performance Indicator |
| LA | Level of Autonomy |
| LPSP | Loss of Power Supply Probability |
| MEG | Micro Energy Grid |
| MR | Microreactor |
| NPC | Net Present Cost |
| O&M | Operations and Maintenance |
| PSO | Particle Swarm Optimization |
| PV | Photovoltaic |
| RES | Renewable Energy Source |
| SEF | Surplus Energy Fraction |
| SOC | State of Charge |
| TES | Thermal Energy Storage |
| UOIT | University of Ontario Institute of Technology |
| WT | Wind Turbine |
| Power generation (kW) by PV panel at time step | |
| Power generation (kW) by WT at time step | |
| Power generation (kW) by MR at time step | |
| Power generation (kW) by hydro plant at time step | |
| Power generation (kW) by BG at time step | |
| Total electric power generation (kW) by diesel Genset at time step | |
| Thermal power generation (kW) by MR at time step | |
| Thermal power generation (kW) by BG at time step | |
| Total thermal power generation (kW) by diesel Genset at time step | |
| Electric load demand at time step | |
| Thermal load demand at time step | |
| Available discharging power of FC at time step | |
| Available charging power of FC at time step | |
| Available discharging power of EES at time step | |
| Available charging power of EES at time step | |
| Available discharging power of TES at time step | |
| Available charging power of TES at time step | |
| Generated power by E2H at unit time step | |
| Generated power by H2H at unit time step | |
| Dumped power at electric dump load at time step | |
| Dumped power at thermal dump load at time step | |
| Efficiency of H2E unit | |
| Total time |
References
- Gray, R. The Biggest Energy Challenges Facing Humanity. Available online: https://www.bbc.com/future/article/20170313-the-biggest-energy-challenges-facing-humanity (accessed on 18 September 2020).
- Kutscher, C.F.; Milford, J.B.; Kreith, F. Principles of Sustainable Energy Systems, 3rd ed.; CRC Press: Boca Raton, FL, USA, 2018; p. 655. [Google Scholar]
- Nuclear Power and the Environment-U.S. Energy Information Administration (EIA). Available online: https://www.eia.gov/energyexplained/nuclear/nuclear-power-and-the-environment.php (accessed on 27 February 2020).
- US public Opinion Evenly Split on Nuclear: Nuclear Policies-World Nuclear News. Available online: https://world-nuclear-news.org/Articles/US-public-opinion-evenly-split-on-nuclear (accessed on 25 September 2020).
- Jarvis, S.; Deschenes, O.; Jha, A. The Private and External Costs of Germany’s Nuclear Phase-Out; National Bureau of Economic Research: Cambridge, MA, USA, 2019; p. 26598. [Google Scholar]
- Van der Merwe, A. Nuclear energy saves lives. Nature 2019, 570, 36. [Google Scholar] [CrossRef]
- Bragg-Sitton, S.; Boardman, R.; Ruth, M.; Zinaman, O.; Forsberg, C.; Collins, J. Integrated Nuclear-Renewable Energy Systems; Foundational Workshop Report; U.S. Department of Energy Office of Scientific and Technical Information: Washington, DC, USA, 2014; p. 1170315.
- Gabbar, H.A.; Zidan, A. Optimal scheduling of interconnected micro energy grids with multiple fuel options. Sustain. Energy Grids Netw. 2016, 7, 80–89. [Google Scholar] [CrossRef]
- Zhou, X.; Guo, T.; Ma, Y. An Overview on Microgrid Technology. In Proceedings of the 2015 IEEE International Conference on Mechatronics and Automation (ICMA), Beijing, China, 2–5 August 2015; pp. 76–81. [Google Scholar]
- Giatrakos, G.P.; Tsoutsos, T.D.; Mouchtaropoulos, P.G.; Naxakis, G.D.; Stavrakakis, G. Sustainable energy planning based on a stand-alone hybrid renewableenergy/hydrogen power system: Application in Karpathos island, Greece. Renew. Energy 2009, 34, 2562–2570. [Google Scholar] [CrossRef]
- Mohammed, O.H.; Amirat, Y.; Benbouzid, M. Particle swarm optimization of a hybrid Wind/Tidal/PV/battery energy system. Application to a remote area in Bretagne, France. Energy Proc. 2019, 162, 87–96. [Google Scholar] [CrossRef]
- Mengjun, M.; Rui, W.; Yabing, Z.; Zhang, T. Multi-objective optimization of hybrid renewable energy system using an enhanced multi-objective evolutionary algorithm. Energies 2017, 10, 674. [Google Scholar] [CrossRef]
- An, L.; Tuan, T. Dynamic programming for optimal energy management of hybrid wind–PV–diesel–battery. Energies 2018, 11, 3039. [Google Scholar] [CrossRef]
- Al-Masri, H.M.K.; Al-Quraan, A.; AbuElrub, A.; Ehsani, M. Optimal coordination of wind power and pumped hydro energy storage. Energies 2019, 12, 4387. [Google Scholar] [CrossRef]
- Halabi, L.M.; Mekhilef, S.; Olatomiwa, L.; Hazelton, J. Performance analysis of hybrid PV/diesel/battery system using HOMER: A case study Sabah, Malaysia. Energy Convers. Manag. 2017, 144, 322–339. [Google Scholar] [CrossRef]
- Seyed-Ehsan, R.; Javadi, M.S.; Esmaeel Nezhad, A. Mixed-integer nonlinear programming framework for combined heat and power units with nonconvex feasible operating region Feasibility, optimality, and flexibility evaluation. Int. Trans. Electron. Energy Syst. 2019, 29, 18. [Google Scholar] [CrossRef]
- Hu, P.; Cao, C.; Dai, S. Optimal dispatch of combined heat and power units based on particle swarm optimization with genetic algorithm. AIP Adv. 2020, 10, 045008. [Google Scholar] [CrossRef]
- Suman, S. Hybrid nuclear-renewable energy systems: A review. J. Clean. Prod. 2018, 181, 166–177. [Google Scholar] [CrossRef]
- Ruth, M.F.; Zinaman, O.R.; Antkowiak, M.; Boardman, R.D.; Cherry, R.S.; Bazilian, M.D. Nuclear-renewable hybrid energy systems: Opportunities, interconnections, and needs. Energy Convers. Manag. 2014, 78, 684–694. [Google Scholar] [CrossRef]
- Boldon, L.; Sabharwall, P.; Bragg-Sitton, S.; Abreu, N.; Liu, L. Nuclear renewable energy integration: An economic case study. Int. J. Energy Environ. Econ. 2015. [Google Scholar] [CrossRef]
- Bragg-Sitton, S.M.; Boardman, R.; Rabiti, C.; Suk Kim, J.; McKellar, M.; Sabharwall, P.; Chen, J.; Cetiner, M.S.; Harrison, T.J.; Qualls, A.L. Nuclear-Renewable Hybrid Energy Systems: 2016 Technology Development Program Plan; U.S. Department of Energy Office of Scientific and Technical Information: Washington, DC, USA, 2016; p. 1333006.
- Baker, T.E.; Epiney, A.S.; Rabiti, C.; Shittu, E. Optimal sizing of flexible nuclear hybrid energy system components considering wind volatility. Appl. Energy 2018, 212, 498–508. [Google Scholar] [CrossRef]
- Minkiewicz, T.; Reński, A. Nuclear Power Plant as a Source of Electrical Energy and Heat; Gdansk University of Technology: Gdansk, Poland, 2011. [Google Scholar]
- Ko, W.; Kim, J. Generation expansion planning model for integrated energy system considering feasible operation region and generation efficiency of combined heat and power. Energies 2019, 12, 226. [Google Scholar] [CrossRef]
- Gabbar, A.H.; Abdussami, M.R.; Adham, M.I. Techno-economic evaluation of interconnected nuclear-renewable micro hybrid energy systems with combined heat and power. Energies 2020, 13, 1642. [Google Scholar] [CrossRef]
- Lipman, N.H. Overview of wind/diesel systems. Renew. Energy 1994, 5, 595–617. [Google Scholar] [CrossRef]
- Katiraei, F.; Abbey, C. Diesel Plant Sizing and Performance Analysis of a Remote Wind-Diesel Microgrid. In Proceedings of the 2007 IEEE Power Engineering Society General Meeting, Tampa, FL, USA, 24–28 June 2007; pp. 1–8. [Google Scholar]
- Transporting Generators to Remote Locations in an Emergency Situation-New & Used Generators, Ends and Engines|Houston, TX|Worldwide Power Products. Available online: https://www.wpowerproducts.com/news/transporting-generators-to-remote-locations-in-an-emergency-situation/ (accessed on 23 August 2020).
- Generator. Available online: https://www.homerenergy.com/products/pro/docs/latest/generator.html (accessed on 17 August 2020).
- Kusakana, K.; Vermaak, H.J. Hybrid diesel generator/renewable energy system performance modeling. Renew. Energy 2014, 67, 97–102. [Google Scholar] [CrossRef]
- Generator Fuel Curve Intercept Coefficient. Available online: https://www.homerenergy.com/products/pro/docs/latest/generator_fuel_curve_intercept_coefficient.html (accessed on 23 August 2020).
- Ericson, S.J.; Olis, D.R. A Comparison of Fuel Choice for Backup Generators; Joint Institute for Strategic Energy Analysis: Washington, DC, USA, 2019; p. 1505554. [Google Scholar]
- Canada Diesel Prices, 18 November 2019|GlobalPetrolPrices.com. Available online: https://www.globalpetrolprices.com/Canada/diesel_prices/ (accessed on 25 November 2019).
- Small Nuclear Power reactors-World Nuclear Association. Available online: https://www.world-nuclear.org/information-library/nuclear-fuel-cycle/nuclear-power-reactors/small-nuclear-power-reactors.aspx (accessed on 8 December 2019).
- Sherlock, M.F. The Renewable Electricity Production Tax Credit: In Brief. 16. Available online: https://fas.org/sgp/crs/misc/R43453.pdf (accessed on 27 September 2020).
- Cost Competitiveness of Micro-Reactors for Remote Markets. Nuclear Energy Institute. 15 April 2019. Available online: https://www.nei.org/resources/reports-briefs/cost-competitivenessmicro-reactors-remotemarkets (accessed on 24 May 2020).
- Lang, P. Nuclear power learning and deployment rates; disruption and global benefits forgone. Energies 2017, 10, 2169. [Google Scholar] [CrossRef]
- McDonald, A.; Schrattenholzer, L. Learning rates for energy technologies. Energy Policy 2001, 29, 255–261. [Google Scholar] [CrossRef]
- Rubin, E.S.; Azevedo, I.M.L.; Jaramillo, P.; Yeh, S. A review of learning rates for electricity supply technologies. Energy Policy 2015, 86, 198–218. [Google Scholar] [CrossRef]
- Latest Oil, Energy & Metals News, Market Data and Analysis|S&P Global Platts. Available online: https://www.spglobal.com/platts/en (accessed on 13 July 2020).
- Locatelli, G.; Boarin, S.; Pellegrino, F.; Ricotti, M.E. Load following with Small Modular Reactors (SMR): A real options analysis. Energy 2015, 80, 41–54. [Google Scholar] [CrossRef]
- Lewis, C.; MacSweeney, R.; Kirschel, M.; Josten, W.; Roulstone, T.; Locatelli, G. Small Modular Reactors: Can Building Nuclear Power Become More Cost-Effective? National Nuclear Laboratory: Cumbria, UK, 2016. [Google Scholar]
- Bragg-Sitton, S. Hybrid energy systems (HESs) using small modular reactors (SMRs). No. INL/JOU-14-33543. Idaho National Laboratory (INL); 2014. Available online: https://www.osti.gov/biblio/1162228-hybrid-energy-systems-hess-using-small-modular-reactors-smrs (accessed on 13 June 2020).
- Heydari, A.; Askarzadeh, A. Optimization of a biomass-based photovoltaic power plant for an off-grid application subject to loss of power supply probability concept. Appl. Energy 2016, 165, 601–611. [Google Scholar] [CrossRef]
- SUN2000-(25KTL, 30KTL)-US, User Manual 2017. Available online: https://www.huawei.com/minisite/solar/en-na/service/SUN2000-25KTL-30KTL-US/User_Manual.pdf (accessed on 27 September 2020).
- Government of Canada, N.E.B. NEB–Market Snapshot: The Cost to Install wind And Solar Power in Canada Is Projected to Significantly Fall over the Long Term. Available online: https://www.cer-rec.gc.ca/nrg/ntgrtd/mrkt/snpsht/2018/11-03cstnstllwnd-eng.html (accessed on 24 July 2020).
- Solar Panel Maintenance Costs | Solar Power Maintenance Estimates. Available online: https://www.fixr.com/costs/solar-panel-maintenance (accessed on 16 April 2020).
- What Is the Lifespan of a Solar Panel? Available online: https://www.engineering.com/DesignerEdge/DesignerEdgeArticles/ArticleID/7475/What-Is-the-Lifespan-of-a-Solar-Panel.aspx (accessed on 16 April 2020).
- Stackhouse, P.W. Surface Meteorology and Solar Energy (SSE) Data Release 5.1. Available online: https://ntrs.nasa.gov/ (accessed on 24 May 2020).
- Diaf, S.; Notton, G.; Belhamel, M.; Haddadi, M.; Louche, A. Design and techno-economical optimization for hybrid PV/wind system under various meteorological conditions. Appl. Energy 2008, 85, 968–987. [Google Scholar] [CrossRef]
- Small wind turbines. Eocycle. Available online: https://eocycle.com/our-wind-turbines/ (accessed on 27 September 2020).
- Mukhtaruddin, R.N.S.R.; Rahman, H.A.; Hassan, M.Y.; Jamian, J.J. Optimal hybrid renewable energy design in autonomous system using Iterative-Pareto-Fuzzy technique. Int. J. Electr. Power Energy Syst. 2015, 64, 242–249. [Google Scholar] [CrossRef]
- US wind O&M costs estimated at $48,000/MW; Falling costs create new industrial uses: IEA|New Energy Update. Available online: https://analysis.newenergyupdate.com/wind-energy-update/us-wind-om-costs-estimated-48000mw-falling-costs-create-new-industrial-uses-iea (accessed on 17 April 2020).
- Stehly, T.; Beiter, P.; Heimiller, D.; Scott, G. 2017 cost of wind energy review. Renew. Energy 2018, 61. Available online: https://www.nrel.gov/docs/fy18osti/72167.pdf (accessed on 24 May 2020).
- Acakpovi, A. Original framework for optimizing hybrid energy supply. J. Energy 2016, 2016, 1–10. [Google Scholar] [CrossRef]
- Renewable Energy Technologies: Cost Analysis Series (Hydropower). International Renewable Energy Agency (IRENA). 2012. Available online: https://www.irena.org/documentdownloads/publications/re_technologies_cost_analysis-hydropower.pdf (accessed on 24 May 2020).
- Flows. Available online: https://ijc.org/en/loslrb/watershed/flows (accessed on 12 August 2020).
- Wu, A.; Lovett, D.; McEwan, M.; Cecelja, F.; Chen, T. A spreadsheet calculator for estimating biogas production and economic measures for UK-based farm-fed anaerobic digesters. Biores. Technol. 2016, 220, 479–489. [Google Scholar] [CrossRef]
- Shahzad, M.K.; Zahid, A.; Ur Rashid, T.; Rehan, M.A.; Ali, M.; Ahmad, M. Techno-economic feasibility analysis of a solar-biomass off grid system for the electrification of remote rural areas in Pakistan using HOMER software. Renew. Energy 2017, 106, 264–273. [Google Scholar] [CrossRef]
- A Geographical Profile of Livestock Manure Production in Canada. 2006. Available online: https://www150.statcan.gc.ca/n1/pub/16-002-x/2008004/article/10751-eng.htm (accessed on 23 July 2020).
- Jarrar, L.; Ayadi, O.; Al Asfar, J. Techno-economic Aspects of electricity generation from a farm based biogas plant. J. Sustain. Dev. Energy Water Environ. Syst. 2020, 8, 476–492. [Google Scholar] [CrossRef]
- Biogas Basics-Energypedia.Info. Available online: https://energypedia.info/wiki/Biogas_Basics (accessed on 23 July 2020).
- Lantz, M. The economic performance of combined heat and power from biogas produced from manure in Sweden–A comparison of different CHP technologies. Appl. Energy 2012, 98, 502–511. [Google Scholar] [CrossRef]
- German Solar Energy Society. Planning and Installing Bioenergy Systems: A Guide for Installers, Architects and Engineers, 1st ed.; Routledge: London, UK, 2004; ISBN 978-1-84977-216-7. [Google Scholar]
- Chen, Y.R. Thermal properties of beef cattle manure. Agric. Wastes 1983, 6, 13–29. [Google Scholar] [CrossRef]
- Morgan, H.M.; Xie, W.; Liang, J.; Mao, H.; Lei, H.; Ruan, R.; Bu, Q. A techno-economic evaluation of anaerobic biogas producing systems in developing countries. Biores. Technol. 2018, 250, 910–921. [Google Scholar] [CrossRef] [PubMed]
- Lako, P. Biomass for Heat and Power. Energy Technology Systems Analysis Program (ETSAP). 2010, p. 8. Available online: https://iea-etsap.org/E-TechDS/PDF/E05-Biomass%20for%20HP-GS-AD-gct_FINAL.pdf (accessed on 24 May 2020).
- Das, H.S.; Tan, C.W.; Yatim, A.H.M.; Lau, K.Y. Feasibility analysis of hybrid photovoltaic/battery/fuel cell energy system for an indigenous residence in East Malaysia. Renew. Sustain. Energy Rev. 2017, 76, 1332–1347. [Google Scholar] [CrossRef]
- Fathy, A. A reliable methodology based on mine blast optimization algorithm for optimal sizing of hybrid PV-wind-FC system for remote area in Egypt. Renew. Energy 2016, 95, 367–380. [Google Scholar] [CrossRef]
- Abdelshafy, A.M.; Hassan, H.; Mohamed, A.M.; El-Saady, G.; Ookawara, S. Optimal Grid Connected Hybrid Energy System for Egyptian Residential Area. In Proceedings of the IEEE 2017 International Conference on Sustainable Energy Engineering and Application (ICSEEA), Jakarta, Indonesia, 23–24 October 2017; pp. 52–60. [Google Scholar]
- Efficiency Water Electrolysis. DeepResource. 2019. Available online: https://deepresource.wordpress.com/2019/01/02/efficiency-water-electrolysis/ (accessed on 23 July 2020).
- California Hydrogen Business Council–CHBC–Hydrogen Means Business in California. Available online: https://www.californiahydrogen.org/ (accessed on 23 August 2020).
- Kharel, S.; Shabani, B. Hydrogen as a long-term large-scale energy storage solution to support renewables. Energies 2018, 11, 2825. [Google Scholar] [CrossRef]
- Borhanazad, H.; Mekhilef, S.; Gounder Ganapathy, V.; Modiri-Delshad, M.; Mirtaheri, A. Optimization of micro-grid system using MOPSO. Renew. Energy 2014, 71, 295–306. [Google Scholar] [CrossRef]
- PV. Performance Modeling Collaborative|CEC Inverter Test Protocol. Available online: https://pvpmc.sandia.gov/modeling-steps/dc-to-ac-conversion/cec-inverter-test-protocol/ (accessed on 23 August 2020).
- Luo, X.; Wang, J.; Dooner, M.; Clarke, J. Overview of current development in electrical energy storage technologies and the application potential in power system operation. Appl. Energy 2015, 137, 511–536. [Google Scholar] [CrossRef]
- Zidan, A.; Gabbar, H.A.; Eldessouky, A. Optimal planning of combined heat and power systems within microgrids. Energy 2015, 93, 235–244. [Google Scholar] [CrossRef]
- International Energy Agency. Technology Roadmap Energy Storage; International Energy Agency: Paris France, 2014; p. 64. [Google Scholar]
- Thermal Energy Storage Technology Brief. IEA-ETSAP and IRENA© Technology Brief E17, January 2013. Available online: https://www.irena.org/publications/2013/Jan/Thermal-energystorage (accessed on 23 August 2020).
- Steinmann, W.-D.; Eck, M. Buffer storage for direct steam generation. Solar Energy 2006, 80, 1277–1282. [Google Scholar] [CrossRef]
- Steam Generator Efficiency. Available online: https://www.power-eng.com/2007/06/01/steam-generator-efficiency/ (accessed on 24 July 2020).
- A-to-Z Guide to Thermodynamics, Heat and Mass Transfer, and Fluids Engineering: AtoZ; Begellhouse: Danbury, CT, USA, 2006; ISBN 978-0-8493-9356-3.
- Electricity Generating and Distribution Efficiency. Available online: https://www.mpoweruk.com/energy_efficiency.htm (accessed on 24 July 2020).
- Learn How Much it Costs to Install a Steam Shower or Steam Room. Available online: https://www.homeadvisor.com/cost/plumbing/steam-shower-installation/ (accessed on 24 April 2020).
- Combined Heat and Power Technology Fact Sheet Series. US Department of Energy. Available online: https://betterbuildingssolutioncenter.energy.gov/sites/default/files/ (accessed on 24 August 2020).
- Are Electric Boilers Better Than Gas Boilers? VHL. Available online: https://www.villageheating.co.uk/alternate-heating-are-electric-boilers-better-than-gas-boilers/ (accessed on 24 July 2020).
- Lion Electric Boiler 28KW|Boilers|Northern Hydronics. Available online: http://www.northernhydronics.com/Boilers/LION-ELECTRIC-BOILER-28KW/flypage.tpl.html?pop=0 (accessed on 24 April 2020).
- Islam, R.; Gabbar, H.A. Feasibility Study on Small Modular Reactors for Modern Microgrids. In 136 Megabytes, Proceedings of the 2nd International Technical Meeting on Small Reactors, Ottawa, ON, Canada, 7–8 November 2012; Canadian Nuclear Society: Toronto, ON, Canada, 2013. [Google Scholar]
- Luna-Rubio, R.; Trejo-Perea, M.; Vargas-Vázquez, D.; Ríos-Moreno, G.J. Optimal sizing of renewable hybrids energy systems: A review of methodologies. Solar Energy 2012, 86, 1077–1088. [Google Scholar] [CrossRef]
- Rajkumar, R.K.; Ramachandaramurthy, V.K.; Yong, B.L.; Chia, D.B. Techno-economical optimization of hybrid pv/wind/battery system using Neuro-Fuzzy. Energy 2011, 36, 5148–5153. [Google Scholar] [CrossRef]
- Tsai, C.-T.; Beza, T.M.; Wu, W.-B.; Kuo, C.-C. Optimal configuration with capacity analysis of a hybrid renewable energy and storage system for an island application. Energies 2019, 13, 8. [Google Scholar] [CrossRef]
- Salvage Value. Available online: https://www.homerenergy.com/products/pro/docs/latest/salvage_value.html (accessed on 13 July 2020).
- Lee, K.; Park, J. Application of Particle Swarm Optimization to Economic Dispatch Problem: Advantages and Disadvantages. In Proceedings of the 2006 IEEE PES Power Systems Conference and Exposition, Atlanta, Georgia, USA, 29 October–1 November 2006; pp. 188–192. [Google Scholar]
- Khare, A.; Rangnekar, S. A review of particle swarm optimization and its applications in Solar Photovoltaic system. Appl. Soft Comput. 2013, 13, 2997–3006. [Google Scholar] [CrossRef]
- Rini, D.P.; Shamsuddin, S.M. Particle swarm optimization: Technique, system and challenges. IJAIS 2011, 1, 33–45. [Google Scholar] [CrossRef]
- Run of River Power-Energy BC. Available online: http://www.energybc.ca/runofriver.html (accessed on 3 August 2020).


| Name | Capacity (MWe) | Developer |
|---|---|---|
| eVinci | 0.2–5 | Westinghouse, USA |
| NuScale micro | 1–10 | NuScale, USA |
| Aurora | 1.5 | Oklo, USA |
| Sealer | 3–10 | LeadCold, Sweden |
| Holos Quad | 3–13 | HolosGen, USA |
| U-battery | 4 | Urenco-led consortium, UK |
| MMR-5 | 5 | UltraSafe Nuclear, USA |
| Parameters | Value | Parameters | Value |
|---|---|---|---|
| ) | 1000 | 20 million | |
| Plant lifetime (Years) | 40 | Core lifetime (Years) | 10 |
| ) | 15,000 | 5 | |
| ) | 350 | Capacity factor (%) | 95 |
| ) | 10 | Plant efficiency (%) | 40 |
| Cases | Case-01 | Case-02 | |
|---|---|---|---|
| Number of particles | 250 | 250 | |
| Number of iterations | 300 | 300 | |
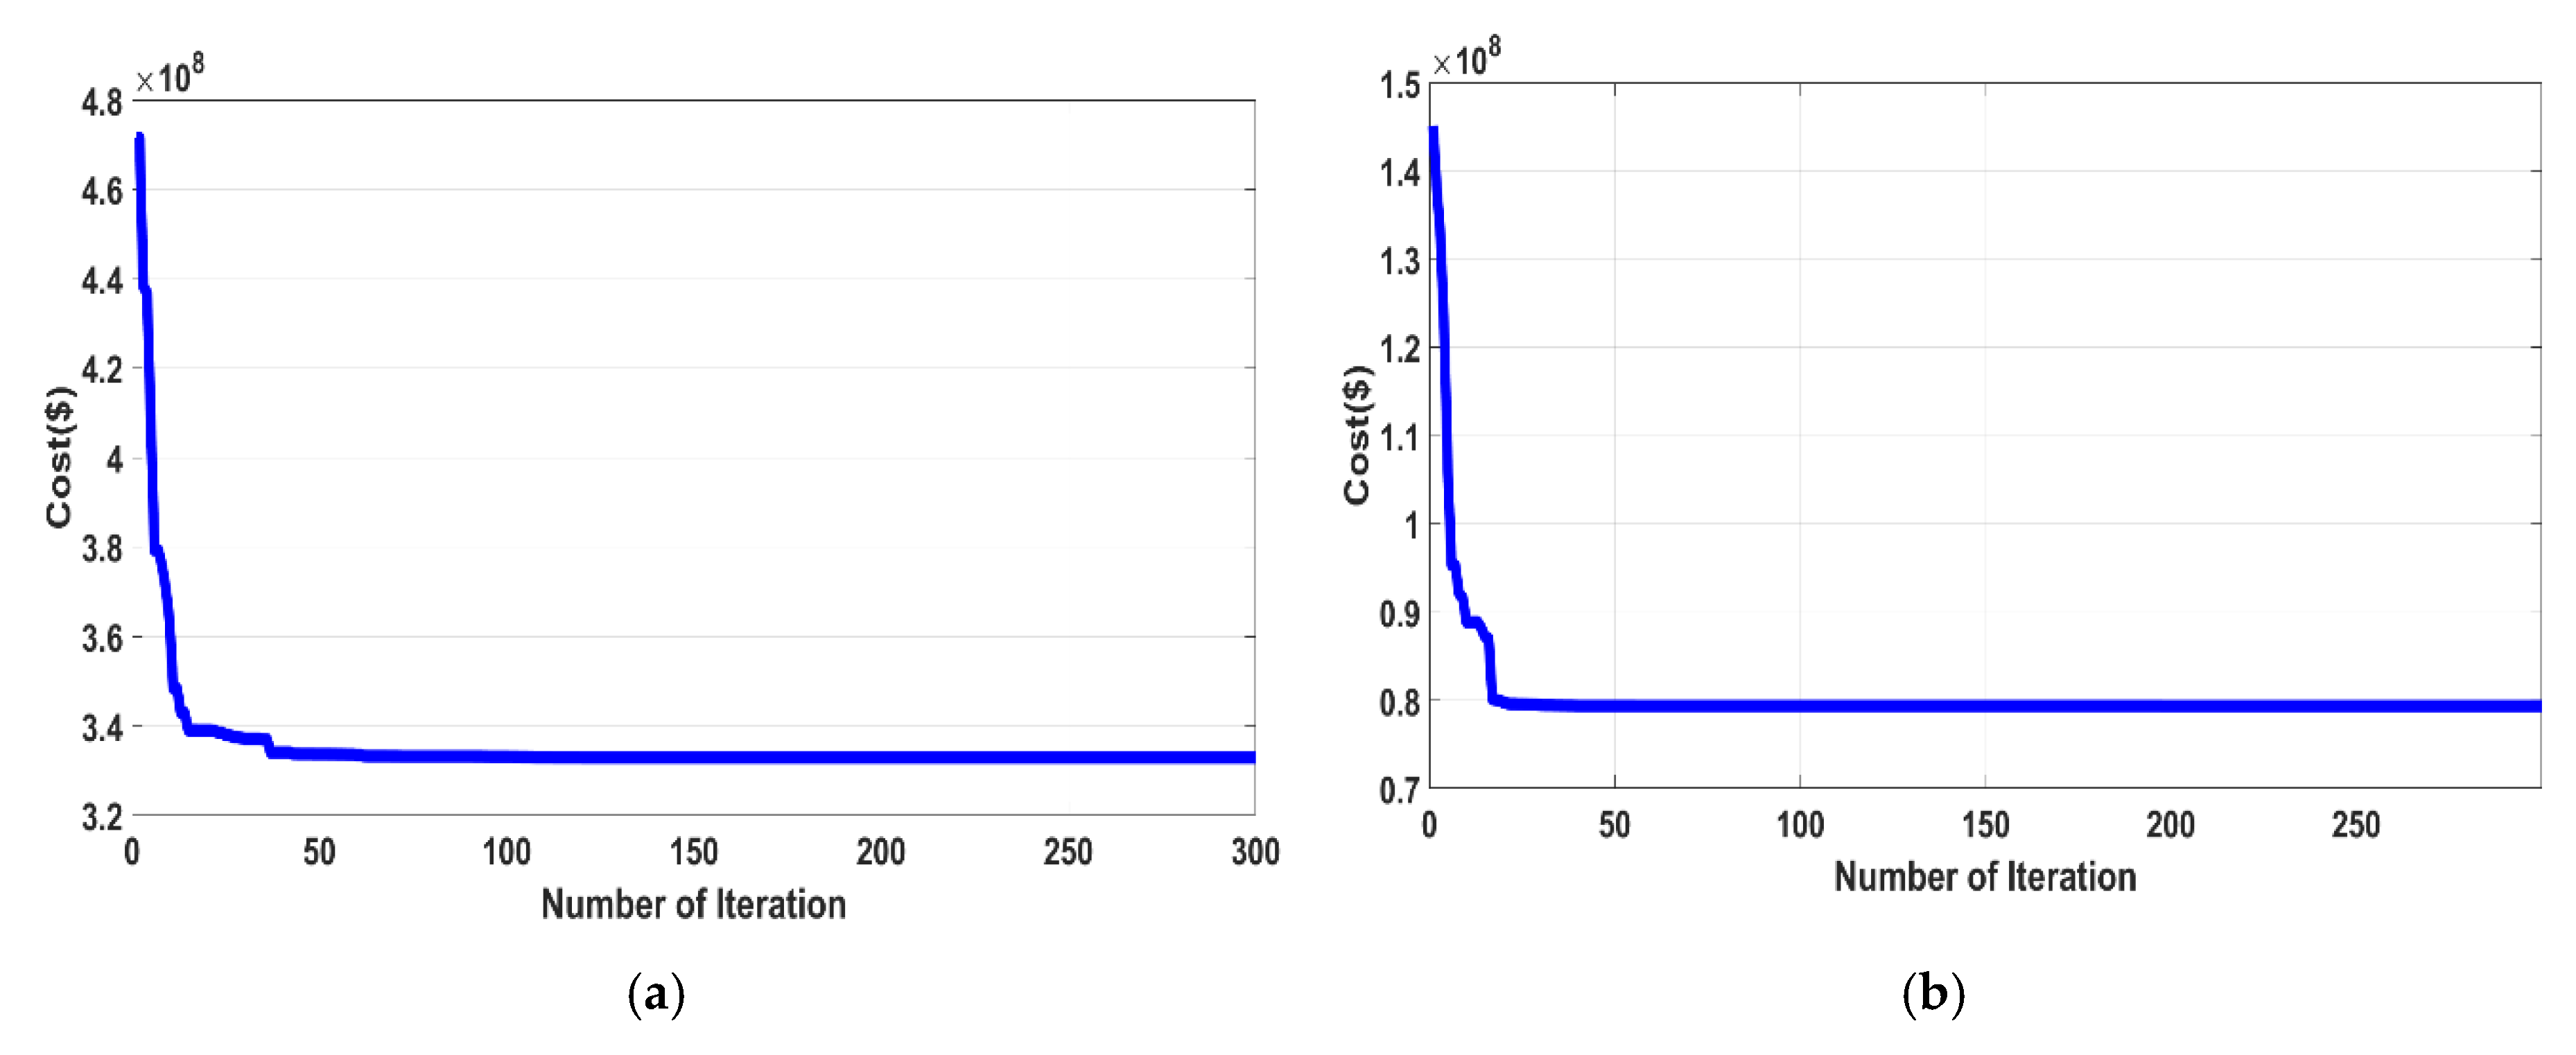
| NPC ($ million) | 332.85 | 79.33 | |
| Number of Diesel Genset/MR | Genset (50 kW) | 1 | 3 (MR) |
| Genset (30 kW) | 50 | ||
| Genset (20 kW) | 50 | ||
| Number of PV panels | 100 | 100 | |
| Number of WT | 100 | 34 | |
| Hydro turbine capacity (kW) | 1000.64 | 1000.64 | |
| Required CHP Efficiency (%) | Genset (50 kW) | 19.8 | 24.6 |
| Genset (30 kW) | 25.8 | ||
| Genset (20 kW) | 30 | ||
| Number of Hydrogen tank | 10 | 23 | |
| Battery bank capacity (MWh) | 15.30 | 0 | |
| TES capacity (MWh) | 19.90 | 19.90 | |
| E2H unit capacity (kW) | 0 | 0 | |
| H2E unit capacity (kW) | 0 | 0 | |
| Parameters | Case-01 | Case-02 |
|---|---|---|
| (%) | 5 | 4.36 |
| (%) | 5 | 5 |
| (%) | 10 | 1.83 |
| (%) | 10 | 10 |
| (%) | 111.72 | 116.48 |
| (%) | 108.71 | 108.71 |
| (%) | 91.32 | 90.97 |
| (%) | 81.25 | 79.51 |
| ($/kWh) | 0.4879 | 0.1163 |
| Section | Summary |
|---|---|
| Section 6.1 | This segment compares the NPC of both cases due to the shift in daily peak demand. |
| Section 6.2 | The section assesses the NPC’s sensitivity to the difference in seasonal peak demand. |
| Section 6.3 | This piece of assessment estimates the impact of average demand changes on NPC. |
| Section 6.4 | The section evaluates and identifies the impact of different equipment cost on NPC. |
| Section 6.5 | This sub-section determines the impact of project lifetime on NPC for both cases. |
| Section 6.6 | This segment evaluates the influence of RESs on system planning and NPC. |
| Section 6.7 | The section analyzes the impact on NPC due to variation in PV panel and WT availability. |
© 2020 by the authors. Licensee MDPI, Basel, Switzerland. This article is an open access article distributed under the terms and conditions of the Creative Commons Attribution (CC BY) license (http://creativecommons.org/licenses/by/4.0/).
Share and Cite
Gabbar, H.A.; Abdussami, M.R.; Adham, M.I. Micro Nuclear Reactors: Potential Replacements for Diesel Gensets within Micro Energy Grids. Energies 2020, 13, 5172. https://doi.org/10.3390/en13195172
Gabbar HA, Abdussami MR, Adham MI. Micro Nuclear Reactors: Potential Replacements for Diesel Gensets within Micro Energy Grids. Energies. 2020; 13(19):5172. https://doi.org/10.3390/en13195172
Chicago/Turabian StyleGabbar, Hossam A., Muhammad R. Abdussami, and Md. Ibrahim Adham. 2020. "Micro Nuclear Reactors: Potential Replacements for Diesel Gensets within Micro Energy Grids" Energies 13, no. 19: 5172. https://doi.org/10.3390/en13195172
APA StyleGabbar, H. A., Abdussami, M. R., & Adham, M. I. (2020). Micro Nuclear Reactors: Potential Replacements for Diesel Gensets within Micro Energy Grids. Energies, 13(19), 5172. https://doi.org/10.3390/en13195172