Abstract
Hydrogen is the most common molecule in the universe. It is an excellent fuel for thermal engines: piston, turbojet, rocket, and, going forward, in thermonuclear power plants. Hydrogen is currently used across a range of industrial applications including propulsion systems, e.g., cars and rockets. One obstacle to expanding hydrogen use, especially in the transportation sector, is its low density. This paper explores hydrogen as an addition to liquid fuel in the detonation chamber to generate thermal energy for potential use in transportation and generation of electrical energy. Experiments with liquid kerosene, hexane, and ethanol with the addition of gaseous hydrogen were conducted in a modern rotating detonation chamber. Detonation combustion delivers greater thermal efficiency and reduced NOx emission. Since detonation propagates about three orders of magnitude faster than deflagration, the injection, evaporation, and mixing with air must be almost instantaneous. Hydrogen addition helps initiate the detonation process and sustain continuous work of the chamber. The presented work proves that the addition of gaseous hydrogen to a liquid fuel–air mixture is well suited to the rotating detonation process, making combustion more effective and environmentally friendly.
1. Introduction
It is well established that combustion processes can take place in two different modes: Deflagration and detonation. While deflagration is widely used in almost every type of thermal engine that converts chemical to mechanical energy, detonation is considered to be more forward looking. It delivers greater cycle efficiency and lower emissions, especially important in the context of climate change concerns [1].
The first person to propose improving a thermodynamic cycle using detonation instead of deflagration was Zel’dovich in 1940 [2]. In the late 1950s, Nicholls et al. [3] proposed and built the first pulsed detonation engine supplied by a hydrogen–air mixture. Sometime later, Adamson et al. [4,5] researched the possibility of harnessing rotating detonation to improve the efficiency of rocket propulsion while Voitsekhovskii [6] successfully achieved spinning detonation in the laboratory. However, after an initial boom in research, progress then ceased as no successfully operating system came to fruition [7]. Interest in the rotating detonation engine (RDE) revived at the beginning of the 21st century when research resumed almost at the same time in Russia [8], Poland [9,10,11,12], and France [13] and later in Japan [14], the USA [15], Singapore [16], China [17], and other countries [18].
Burning the same mixture using different combustion modes (deflagration or detonation) results in substantially different products. Subsequently, applying those different modes to a propulsion system will result in different levels of performance. In the isobaric Brayton cycle, the addition of heat in the process of deflagrative combustion results in an increase of volume. In the isochoric case—the Humphrey cycle—an increase of pressure occurs due to the constant volume heat addition. The Fickett–Jacobs cycle offers the greatest pressure gain coupled with a decrease in specific volume during heat addition in detonation mode [10].
Looking at Table 1 and Figure 1, which provides a comparison of theoretical cycles’ efficiencies for various fuels with the same initial compression ratio, it is evident that the Fickett–Jacobs cycle offers the highest performance. In addition to higher thermodynamic efficiency, the detonation engine offers higher energy release rate, lower emissions, and, in the case of RDE, a shorter combustion chamber than in a classical jet engine. Wolanski [18] summarized this in the form of a table for easy comparison of deflagrative and detonative combustion (see Table 2).

Table 1.
Comparison of calculated efficiency for thermodynamic cycles: Brayton, Humphrey, and Fickett–Jacobs [10].
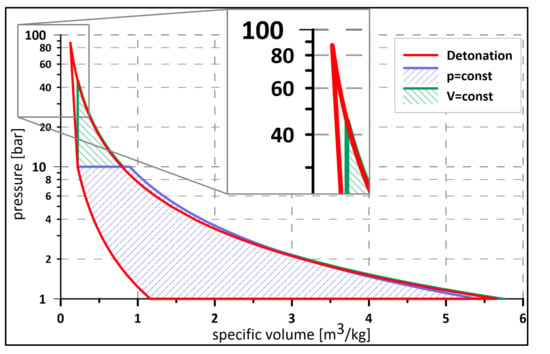
Figure 1.
Comparison of theoretical cycles: Bryton (pressure = const.), Humphrey (Volume = const.), Fickett–Jacobs (detonation) for stoichiometric hydrogen—air mixture.

Table 2.
Comparison of deflagrative versus detonative combustion [18]. Reprint with permission [4915841234612]; Copyright 2012, Elsevier Inc.
From the point of view of the experimental approach regarding the detonation process in jet propulsion systems, one of the most difficult elements is preparing the mixture: Injection, evaporation of liquid fuel, and mixing with the oxidizer. These processes run simultaneously. While in the case of deflagration combustion it is just a minor problem, with detonation, preparing the right mixture may be challenging due to the velocity of the combustion front propagation, which is about three orders of magnitude greater than for deflagration. Some past and recent publications [19,20] show that in an experimental approach, e.g., for PDE engines, liquid kerosene is often replaced with gaseous propane, whose detonation parameters (e.g., cell size) are similar. That approach makes it possible to focus only on parameters of the detonation process in the designed geometry, while the problem of injection and mixture preparation is relegated to ‘future research’. Another way to increase the sensitivity of the air–fuel mixture to detonation transition is by adding a component with low activation energy to the liquid fuel. Isopropyl nitrate (IPN) [21,22], which, incidentally, has a much lower evaporation temperature (40 °C) than kerosene, is one such example. In RDE engines, where the process is continuous, the approach involving replacing liquid kerosene with a gaseous propane seems to be incorrect. It is more reasonable to treat the injection, mixing, and detonation as one complex process inside the combustion chamber. Taking into account the authors’ experience in investigating the detonation process, it was decided to propose the addition of hydrogen as one of the fuel components with a wide detonation range, to facilitate the initiation and sustain the propagation of the rotating detonation wave in the chamber. In order to design the appropriate channel geometry of the detonation chamber it is important to know the width of the detonation cell for the specific mixture. A quick look at fuel parameters lends greater insight to better understanding the difference between hydrogen and liquid hydrocarbon fuels. Table 3 shows the main parameters from the combustion point of view for the fuels considered for the investigation. Table 4 shows cell sizes and calculated detonation velocities for different equivalence ratios in normal temperature and pressure (NTP) conditions (293 K, 100 kPa).

Table 3.
Properties of fuels (based on: [23,24]).

Table 4.
Cell size and calculated detonation velocity for 293 K initial temperature equal and 100 kPa initial pressure of fuel–air mixture.
Even if building a detonation engine is still a challenging venture, a growing awareness of the environmental impact of propulsion systems has concentrated attention on them due to their better performance (higher thermal efficiency) and lower NOX emissions. Governments and organizations such as the International Civil Aviation Organization are introducing policies with ever lower emission limits [1]. Stable detonation with very lean fuel–air mixtures is conducive to this end, as it significantly reduces the combustion temperature, causing lower NOx emissions, as high temperature drives their main formation mechanism.
Current scientific efforts regarding renewable energy sources mostly focus on the use of hydrogen. Combustion of fossil/conventional fuels used in transportation and power generation systems releases large amount of gaseous pollutants and solid particles that may cause serious harm to the environment. Hydrogen has been considered as a promising nonpollutant alternative fuel and an energy carrier for future energy supply systems, due to the fact that hydrogen is a clean gas and it can be produced from water. Hydrogen may provide a secure, cost-effective, and nonpolluting energy source [31].
Hydrogen was described as “a critical and indispensable element of a decarbonized, sustainable energy system” [32] and can play an important role in a low-carbon future, counterbalancing electricity as a zero-carbon energy carrier that can be easily stored and transported [31]. Many recent research papers relate to the usage of “green hydrogen” in the wind and solar power sector [33,34,35,36,37,38].
Compared to other fuels, hydrogen has the highest net calorific value (about 120 MJ/kg), approximately three times greater than, e.g., aviation gasoline [39].
Another advantage of hydrogen over hydrocarbons is that it does not release CO2 during the combustion process.
Many researchers [40] assert that development of the hydrogen gas turbine could be a key future carbon-neutral technology to support society’s goal of achieving ambitious energy and climate targets. At present, gas turbines play an important role in the development of the energy system. In 2019, Siemens’ Roadmap reported that the energy industry committed to develop gas turbines operating with 100% hydrogen by 2030 [41], to support the transformation of the energy grid into an energy system based on renewable resources.
2. Aim of the Research. Experimental Facility
The main aim of the following research was to investigate the possibility to initiate a rotating detonation using a liquid fuel–air mixture with an addition of gaseous hydrogen and the effect of such an addition on the process itself. In every experiment the air was used as an oxidizer. Three liquid fuels were considered as of main interest: Kerosene, ethanol, and hexane. Additionally, some experiments were also conducted with gaseous propane as a replacement for kerosene. To investigate this phenomenon, an experimental facility was designed and built.
The main element of the test facility (Figure 1) was a 7075 aluminum alloy chamber (1) with an outer diameter of 168 mm and length of 120 mm, installed in a horizontal position. Inside the chamber the special insert was axially introduced, which, together with the external chamber case, creates a shaped channel for detonation propagation. In this case it was also an element of a hydrogen delivery system. Assuming the constant outer diameter of the channel, a replaceable axial insert delivered the possibility of control over the width and shape of a detonation channel, which made the facility more universal, ready for various types of fuels.
For a stoichiometric fuel–air mixture, at initial room atmospheric pressure, the cell width value for hydrogen–air and kerosene–air mixture is 9.2 mm [27] and 60.4 mm [28], respectively. According to [28], cell width for the stoichiometric kerosene–air mixture varied in the range 39–84 mm. On the basis of the authors’ own experience from past research as well as a literature review, it was known that for a hydrogen–air mixture the width of the channel should be in the range of 5–25 mm [42,43,44,45] and usually is proportional to the value of the cell width for the investigated mixture. The results of experimental research described in [46] led to the conclusion that for the kerosene–air mixture, the chamber channel width should be about 50 mm. In light of the information gathered, two axial inserts were developed to create a channel of 10 mm for a pure hydrogen–air mixture as well as 50 mm for all other fuels considered.
One end of the chamber was closed by an air manifold (3) with injectors and the other was open to the dump tank (2). The chamber was equipped with doubled-fuel systems: Liquid for the main fuel and gaseous for hydrogen addition. Injectors of both fuels were placed perpendicularly to the main flow in the chamber. Gaseous hydrogen was injected by 90 holes along the curvature of the inner chamber wall. Liquid fuel was injected by 12 swirl injectors (5) fed by a common manifold. The manifold was equipped with two electromagnetic valves: The main one responsible for delivering the fuel from the tank to injectors and the drain valve to clear the line after each experiment, for safety reasons. Due to the large oxidizer mass flow rate required for the experiments, the air manifold was connected to two air tanks controlled by four electromagnetic valves. The air mass flow rate could also be controlled by changing the pressure inside the tanks in the range 5–10 bar abs. To initiate the detonation process inside the experimental chamber, a dedicated initiation tube was installed perpendicularly to the chamber wall, at a distance of 42 mm from the air injectors. In most experiments, a stoichiometric mixture of oxygen and acetylene at the pressure of 3 bar abs was used as the initiation mixture. It was prepared in an external cylindrical tank with a partial pressure method at least 24 h ahead of the scheduled experimental campaign. The main chamber and initiator tube were separated by a 100 μm-thick plastic membrane that burst during, and was replaced after, each experiment. The initiation mixture was ignited by a spark plug controlled by the dedicated acquisition system equipped with two National Instruments’ acquisition cards (PCI 6133 and PCI 6115). More information about the initiation process as well as the hardware can be found in the paper [47]. The design of a research facility enables control of the fuel temperature using a controlled heater inside the fuel tank. It should be mentioned that in some experiments the walls of the detonation chamber were heated by two special heaters placed inside the air manifold and near to the air injector, with mean chamber wall temperature up to 335 K. Heating up the fuel enhanced the degree of evaporation of the liquid droplets, which influenced the process of mixture preparation inside the chamber. The facility was equipped with several slots for thermocouples and pressure transducers. Two types of pressure transducers were used in the experiments: High frequency (natural frequency ≈ 400 kHz) Kistler sensors to measure the pressure inside the chamber (type 603B) and lower frequency (limiting frequency 1 kHz) Keller sensors PAA—23/25 (absolute static pressure) and PD—23 (differential pressure) to measure the dynamic pressure inside the manifolds. Measuring the pressures inside the feeding lines made it possible to calculate the air and fuel mass flow rates. Figure 2a shows a view of the test facility and Figure 2b a diagram of the detonation chamber.
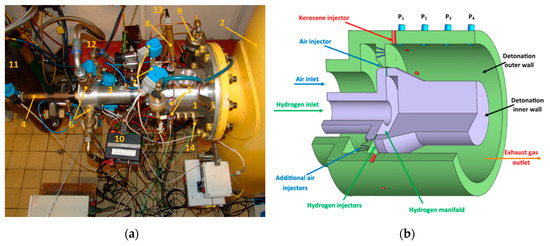
Figure 2.
The experimental facility: (a) view of the research facility: 1—detonation chamber, 2—dump tank, 3—air manifold, 4—hydrogen feeding line, 5—kerosene injectors 6—air electromagnetic valves, 7—kerosene control and cutoff valve, 8—initiator tube, 9—kerosene tank, 10—kerosene injectors controller, 11—hydrogen tank, 12—air tank; 13—spark plug, 14—pressure transducers; (b) scheme of the detonation chamber.
3. Results
3.1. Initial Calculations
For proper evaluation of the influence of hydrogen addition on the mixture, a calculation of chemical energy stored for various mixtures was performed and the results are presented in Table 5. Table 6 presents the increase of available chemical energy content with 10, 20, and 30% by volume of hydrogen addition to each fuel compared to the reference condition (without hydrogen addition) and with φ = 1. The calculations show that for hydrocarbon fuels the maximum energy content increase did not exceed 1% except for ethanol, where it was almost 1.7%.

Table 5.
Calculated chemical energy content in 1 kg of fuel–air mixture for different equivalence ratios based on LHV.

Table 6.
Calculated chemical energy content in 1 kg of stoichiometric fuel–air mixture with hydrogen addition to fuel (by volume).
For better interpretation of the experimental results, calculation of detonation velocities for different equivalence ratios in normal temperature and pressure (NTP) conditions (293 K, 100 kPa) was done, as shown in Table 4.
3.2. Experimental Results for Liquid Kerosene–Hydrogen–Air Mixture
The first stage of research investigated detonation of the hydrogen–air mixture in both chamber configurations, described in Section 2. The results are presented in Figure 3. Knowing the geometrical parameters of the chamber, the location of the pressure transducers, and the time between individual peaks, it was possible to calculate the velocity of the detonation front. Having a set of calculated velocities enabled the researchers to check how much time the detonation wave propagates with each velocity in the period of an experiment and to present that in percentage terms. The pressure–time history is presented at the bottom of the chart, while the percentage of detonation propagation velocity is presented at the top. Both experiments were carried out in similar initial conditions and using the same measuring system (sensors and National Instruments measurement card). As can be seen, the pressure amplitude value was much higher in the dedicated 10 mm chamber width and corresponded approximately to Chapman–Jouget pressure behind the wave. For the second chamber, the pressure amplitude was about 5–6 times lower, which might be explained by the shape and width of the channel, which strongly expanded the exhaust gases (transition from 10 to 50 mm). The propagation velocities, determined by using the fast Fourier transformation in both cases, were close to an average value of 1600 m/s. More information about FFT method to propagation velocity calculation can be found in [48]. The second visible peak of the propagation velocity, around 3000 and 2800 m/s, revealed a situation where, in some periods of the experiment, two waves were propagating in concurrent or counterrotating directions. The following results suggest that the addition of gaseous hydrogen to the liquid fuel–air mixture should produce a beneficial outcome in the form of initiating and propagation of rotating detonation in designed geometry.
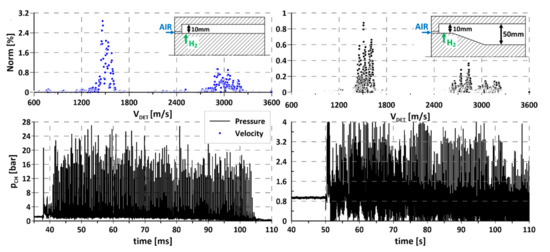
Figure 3.
Comparison of propagation of rotating detonation in two different chamber geometries: (left) designed for hydrogen–air mixture; (right) designed for kerosene–air mixture. Upper part, propagation velocity.
When using gaseous hydrogen as an additional ingredient instead of a main fuel, its content in a mixture cannot be too high. It was assumed that it should be low enough to stay below the lower detonation limit for H2—air mixture (LDLH2). The research facility was designed to deliver flexibility for the injection system, which is why the injected ingredients were controlled by separate valves and signal lines. This provided a possibility to open and close the valves separately at any time during the experiment and to assure proper synchronization. The flexibility of such a system can also be used to investigate the influence of each component on the detonation process, as will be presented below. Figure 4 presents the parameters of a typical experiment during the campaign with liquid kerosene, air, and addition of hydrogen. The bottom graph contains pressures in feeding manifolds of all components. Valve opening and closing moments are clearly visible, as are the changes in pressure during the experiment. As can be seen, hydrogen and air valves open simultaneously, causing the pressure to rise to its maximum value in less than 50 ms and then drop steadily until the valve closes. Perfect stability of pressures cannot be expected in the manifolds due to the type of gas delivery system. A classical pressure feed system was used that stores propellant in external tanks and delivers it using only pressure accumulated in the tanks (without pumps). Due to limited tank volume, the pressure decreases over time. In our case, this approach is justified since the experiments were very short and so the pressure drop can be considered negligible. A liquid fuel line behaves in a very different way. After valve opening, which was made with a delay of up to 20 ms in reference to hydrogen and air valves, pressure in the manifold rises rather slowly and reaches a steady value in about 200 ms. After that it remains constant until the valve is closed. This behavior is again caused by the design of the feed line, which consists of 12 injectors connected with a common manifold and operated by a single valve. It creates a dead volume between the valve and injectors, which has to be filled with fuel in every experiment. After the filling period, it was possible to assure steady pressure throughout the duration of the experiment for the liquid component. As was mentioned before, initiation of the combustion process was done using an external, dedicated initiator. The exact moment of initiator activation was set to the time when the hydrogen and air pressures were at their maximum values. Looking at the chamber pressure time course (upper part of Figure 4), it can be seen that after initiation (at 330 ms) deflagration combustion occurred, leading to 300–700 Hz oscillations and a 15% chamber pressure rise compared to the pre-ignition period. The process continued and at the same time the pressure in the kerosene manifold rose, changing the composition of the mixture inside the chamber. When it reached nominal pressure (550 ms in the presented example) the detonative mode was initiated. Even a cursory analysis of the chamber pressure–time course allows one to divide the detonative period into two parts. The first period, between 540–580 ms is characterized by low pressure peaks in the order of 3–4 bars and frequency of about 5 kHz. In a second period (580–630 ms), the pressure peaks reach 6–8 bars with one-half of the frequency compared to the initial period. This effect is caused by the fact that two waves propagate in the channel right after the initiation of detonation. After some time and many collisions between the waves, one of them expires, leaving a single, strong wave propagating in the channel. The energy released during the rotating detonation process is independent of the number of propagating waves, assuming that, in the case of more than one wave, all of them propagate in the same direction. If the waves propagate in the opposite direction, the amount of energy released may be reduced. This is because after the waves collide and both of them reflect and begin to move back in the direction they came from. It causes them to travel, for a very short period of time, through the exhaust gases produced right before the collision. This is valid for the narrow region when the pressure created by the wave exceeds the pressure of fresh mixture delivery, creating local backflow conditions [49]. The content of exhaust gases in the mixture decreases with the distance from the reflection point and, so, after some time, the wave propagates in a fresh mixture, until it meets another wave to collide with and reflect again. This can be seen when comparing the pressure amplitudes in both regions in Figure 5.
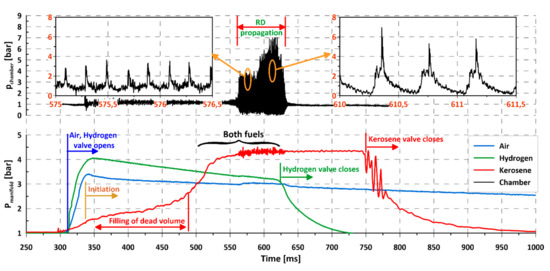
Figure 4.
Initiation and propagation of rotating detonation for kerosene–air mixture and with gaseous addition of hydrogen (course of pressure).
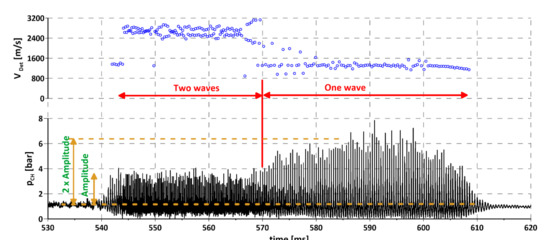
Figure 5.
Propagation of rotating detonation for kerosene–air mixture with gaseous addition, different mode of propagation: One and two waves.
Figure 6 presents an example experiment with additional information about equivalence ratios () for all components and timing of valves and initiator. Detailed investigation of the presented data lead to some conclusions. First, it was evident that the equivalence ratio for hydrogen decreased over time, while for kerosene the situation was completely the reverse. This was caused by the pressure changes presented in Figure 4, as explained previously. Taking that into account, together with pressure changes in the air feed line, the total equivalence ratio (when the mixture of kerosene and hydrogen is considered as one fuel) was more or less constant during the entire experiment and its value exceeded the lower detonation limit (LDL) for both hydrogen (LDLH2) and kerosene (LDLK). The obvious question is why detonation was not initiated in the first ~60 ms of the experiment (marked as Part A in Figure 6) with two s (total and hydrogen) over the detonation limits. First of all, the estimated accuracy of equivalence ratios’ calculation was about ±10%, which means that its actual value for hydrogen might have been lower than the detonation limit. Moreover, the channel geometry (50 mm width) was not optimal for initiating hydrogen detonation and, lastly, the initiator energy was not large enough to initiate the detonation process for a situation when, initially, relatively large kerosene droplets during evaporation were taking a lot of energy (heat) from the environment (air, hydrogen). The relation between equivalence ratios of hydrogen and kerosene changed during the experiment. The kerosene equivalence ratio was calculated based on liquid state, but its rising value also meant an increased content of kerosene vapors in the combustible mixture. As mentioned previously, the flow rate of kerosene changed due to the increasing pressure in the manifold, but another associated effect should also be considered. As the injection pressure rose, the droplet size decreased [50], leading to a larger number of small droplets and so the evaporation surface increased. This influenced the evaporation rate and the vapor content in the global mixture, and, so, suitable conditions for detonation initiation could be created. When the mixture achieves detonative potential, any large-enough energy source can initiate the process. Local hot spots can be one source of the required energy. Since the presented equivalence ratio was calculated based on pressures in an installation (manifolds), after injection to the chamber, before it mixes with the other components, hydrogen can create local spots with far exceeding the required limits and micro explosions can occur. The shock waves created can interact with each other and overlap, amplifying them and leading to initiation of rotating detonation.
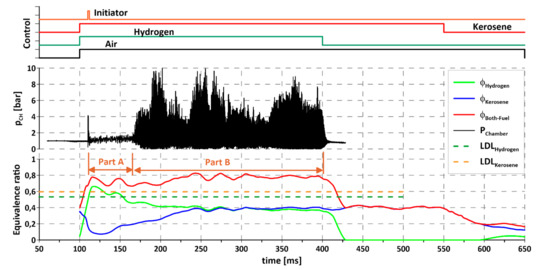
Figure 6.
Propagation of rotating detonation for kerosene–air mixture, influence of hydrogen addition.
The evaporation rate can also be controlled by kerosene temperature. As mentioned before, the research facility was equipped with heaters, with a controller allowing stabilizing the kerosene temperature. Higher temperatures increase the evaporation rate and, for some cases, make detonation initiation possible, even if in normal condition detonation was not observed. An example of such a situation is presented in Figure 7. Both experiments were carried out in the same feeding conditions; the only difference was the initial temperature of the kerosene. While at room temperature the combustion process can be identified as deflagration (Figure 7a) in the whole duration of an experiment, after increasing the initial temperature up to 100 °C rotation detonation is initiated immediately after activation of the initiator. The initial temperature influences the possibility of detonation and the time delay between initiator activation and detonation initiation. Future research should be carried out to identify the boundary temperature and the droplet size that enables the rotation detonation process.
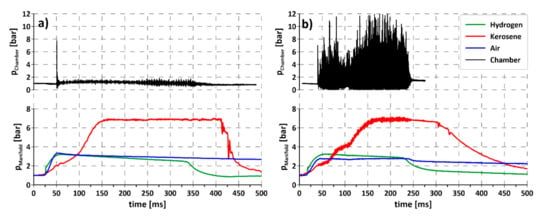
Figure 7.
Propagation of rotating detonation for liquid kerosene–air mixture with hydrogen addition for different initial kerosene temperatures (a) room temperature (20 °C), (b) elevated (100 °C).
In Figure 6, the importance of hydrogen addition can be seen. At 400 ms the hydrogen valve is closed and, as a result, rotating detonation expired immediately even though the kerosene–air mixture was still delivered for the next 150 ms. This means that under the tested conditions detonation was possible only with the addition of hydrogen.
3.3. Experimental Results for Liquid Hexane/Ethanol–Hydrogen–Air Mixture
Similar experiments were conducted for other liquid fuels: Hexane (Figure 8) and ethanol (Figure 9) with air and hydrogen addition. With insight gained from previous experience with kerosene, in these experiments the air, hydrogen, and liquid fuel were supplied simultaneously, so the time with low-injection pressure of liquid fuel was decreased. The visible delay in obtaining the nominal flow of liquid fuel through the injectors was decreased. Analyzing chamber pressure distribution for hexane and ethanol (upper part of Figure 8 and Figure 9, marked with black curve), it may be noted that the initiation of detonation took place in the transient phase (before reaching the nominal flow) of the liquid fuel. The activation of an initiator tube was carried out at about 50 ms of the experiment for both cases, immediately after reaching maximum pressure in the intake manifolds for the gaseous components of the mixture. As can be observed, the combustion started as a deflagration with strong pressure oscillations (frequency of oscillations < 500 Hz), which, in favorable conditions, i.e., evaporation of appropriate amount of fuel and the occurrence of an energy impulse in the form of a pressure wave/oscillation, leads to the initiation of rotating detonation. Comparing the time between the initiating impulse and the appearance of rotating detonation, it may be concluded that the delay time will be reduced for fuels with a lower boiling point (see Table 3), e.g., hexane and ethanol compared to kerosene. In the case of hexane and ethanol, as with kerosene, there were changes in the amplitude of pressure during the propagation of rotating detonation. This was probably connected with the local dynamics of mixing liquid and gaseous components in the detonation chamber. Mixture composition can differ locally due to the possible disturbance of pressure in the manifold, which may cause changes in chamber pressure amplitude. Moreover, it is possible that local changes in droplet size occurred, caused by the interaction between the rotating detonation wave and liquid injector. Since there were 12 liquid injectors operating in the chamber, even small inaccuracies in their manufacture may cause slight differences in mass flow rate flowing through the injector, influencing the behavior of the detonation process. Another reason for pressure amplitude reduction could also be the periodic occurrence of more than one detonation wave in a chamber as well as a change in propagation direction. Both of these effects were noted during the advanced investigation of chamber pressure behavior using more than one pressure sensor in the common plane of a chamber.
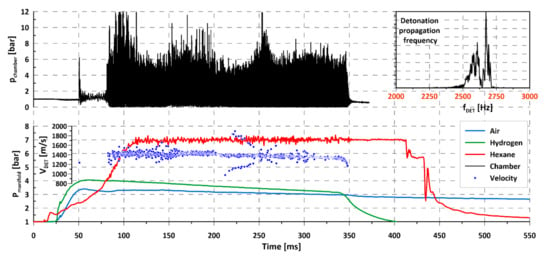
Figure 8.
Propagation of rotating detonation for liquid hexane (C6H14)–air mixture with hydrogen addition.
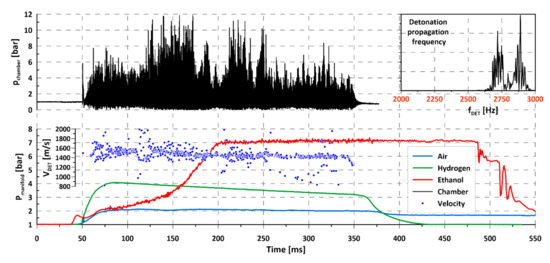
Figure 9.
Propagation of rotating detonation for liquid ethanol (C2H5OH)–air mixture with hydrogen addition.
3.4. Experimental Results for Propane–Air Mixture
As mentioned in Section 2, propane is commonly used as a kerosene substitute in experimental research studies, mostly related to PDE. Since no serious modifications were required in the experimental facility in order to investigate propane, some experiments were also conducted for this fuel. In that case, propane was the only fuel and was delivered through the gaseous injectors used for hydrogen during the previous research. Air was once again used as an oxidizer. An example result of an experiment is presented in Figure 10. After initiation at 50 ms, deflagration combustion occurred with an oscillation frequency of 500 Hz. Despite the detonative potential of the propane–air mixture as presented in the literature, e.g., [20], for our geometry no rotation detonation was observed in several experiments. There are at least two possible reasons for this. First of all, as the injection system was designed for hydrogen, its geometry may be ineffective in terms of creating the right propane–air mixture. The second reason was the initiation energy, which might not have been large enough. The research conducted with propane was treated only as an additional task and was not investigated in a very detailed way. Modification of the injection system together with detailed investigation of the mixing and initiation process will most probably lead to a successful detonation process. The only conclusion that may be drawn is the impossibility of initiating rotating detonation with an air–propane mixture in the current geometry of the chamber. Despite the inability to achieve detonation initiation, one interesting effect was noticed during the experimental campaign. As can be observed in Figure 10, very low frequency changes occurred in chamber pressure. At 50 ms, the pressure amplitude began to rise, achieving the maximum value at circa 175 ms and then dropped slowly. At 300 ms, it began to rise again, but the experiments were too short to investigate the existence of other cycles. This effect might be caused by the fact that the exhaust of the chamber was connected to the dump tank. It is possible that exhaust gases caused shockwaves, which reflected inside the tank and created a wave system, which caused the periodic plugging of chamber exhaust and affected internal pressure. It may be also connected with Helmholtz resonator effect in the whole flow system (feeding, detonation chamber, dump tank, and exhaust tube), but that problem was not investigated further. Importantly, those oscillations might also have influenced the previous results and, so, additional examination, with longer operation of the chamber, should be done to improve the quality of results. This was included in the future research plan but will require serious interference in the geometry of the research facility.
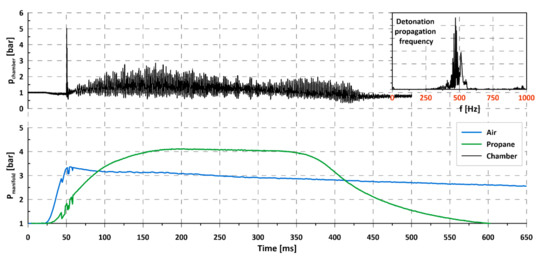
Figure 10.
Propagation of rotating detonation for propane–air mixture.
4. Discussion and Conclusions
As was presented in Table 1 and proven in [51,52] from the thermal efficiency point of view, detonation is far more effective than the classical deflagration combustion. Considering the use of rotating detonation in an axisymmetric chamber, there are further advantages associated with the geometry, mass, and design of the combustion chamber. The presented research revealed the possibility of using readily accessible fuels such as kerosene, hexane, or ethanol in such a system, with just a little addition of sensitizer, which in our case was a hydrogen.
While it was not possible to detonate the investigated fuels in a pure form in the designed geometry of the chamber, addition of a small amount of hydrogen (up to 10% by volume, taking into account only H2 and air) initiated and sustained the rotating detonation process. The influence of initial fuel temperature (20 °C and 100 °C for kerosene) on the possibility of detonation occurrence was presented. With higher temperature of a fuel, the less hydrogen amount was required to initiate detonation. It is expected that further increase in initial fuel temperature (above 100 °C, close to boiling temperature) will lead to an even greater reduction in sensitizer requirement and make detonation initiation far less demanding. Nevertheless, it cannot be forgotten that if kerosene is at too high a temperature, it may lead to rapid evaporation of lighter fractions, the accumulation of heavier fractions, and, consequently, the choking of injectors. Another problem is that, if fuel is heated, the feeding line should be designed so that large pressure drops are avoided, as these may lead to the boiling temperature being exceeded, creating a vapor lock in an injector. Alternatively, the other mixture component can be heated, an air in this case. Since the flow rate of a gaseous oxidizer is rather large, a great deal of energy would be required to increase the temperature to a reasonable level. But in a system where the air supplied is compressed, such as a turbojet engine (transportation sector) or turbine (power generation sector), its temperature rises naturally. Such a situation is also expected to improve the evaporation rate of liquid fuel droplets and helps to initiate and sustain the detonation. On the other hand, since the density of the air decreases with rising temperature, the loading factor also decreases. Further research is required to investigate the advantages and disadvantages of heating air in a supply line for optimization purposes.
Hydrogen addition to a fuel–air mixture causes complications in the supply line and the combustion chamber itself. Since hydrogen has to be stored in a rather large additional tank (given its density), it may not be effective to apply that to mass-limited aerospace systems. There are, however, applications where system mass is not a critical factor, for example, power plants. Assuming “green hydrogen” can be produced on site at a renewable energy power plant, it can be stored as an energy reserve and released, supporting the rotating detonation process when the renewable source becomes suboptimal.
Together with rising efficiency of a combustion process, the lower amount of hydrocarbon fuels has to be used to get a similar effect. Since combustion products contain the CO2, from the point of view of environmental concerns, it is important to increase the efficiency as much as possible. One way to get this goal is to replace classical combustion chambers with a more effective detonation one wherever feasible. As the paper presented, this is possible with just a little help from easily available hydrogen, the most common molecule in the universe.
Author Contributions
Conceptualization, J.K.; methodology, J.K.; formal analysis, J.K. and Ł.M.; investigation, J.K.; resources, J.K., K.W. and S.S.; writing—original draft preparation, J.K., K.W., P.W. and S.S.; writing—review and editing, Ł.M.; visualization, J.K. and K.W.; supervision, J.K.; funding acquisition, J.K. All authors have read and agreed to the published version of the manuscript.
Funding
This work was funded by Narodowe Centrum Nauki, grant No. 838/B/T02/2009/37.
Conflicts of Interest
The authors declare no conflict of interest.
Symbols and Abbreviations
| Symbols | Abbreviations |
| f | frequency (Hz) |
| λ | cell size (mm) |
| ϕ | equivalence ratio (-) |
| CH | detonation chamber |
| const. | constant |
| FFT | Fast Fourier Transform |
| HHV | higher heating value (MJ/kg) |
| IPN | isopropyl nitrate |
| LDL | lean detonation limit |
| LHV | lower heating value (MJ/kg) |
| NOx | nitrous oxides |
| NPT | normal pressure and temperature |
| PDE | Pulsed Detonation Engine |
| RDE | Rotating Detonation Engine |
References
- ICAO 2019 Environment Report. Available online: https://www.icao.int/environmental-protection/Documents/ICAO-ENV-Report2019-F1-WEB%281%29.pdf (accessed on 15 September 2020).
- Zel’dovich, Y. To the Question of Energy Use of Detonation Combustion. J. Propuls. Power 2006, 22, 588–592. [Google Scholar] [CrossRef]
- Nicholls, J.A.; Wilkinson, H.R.; Morrison, R. Intermittent Detonation as a Thrust-Producing Mechanism. J. Jet Propuls. 1957, 27, 534–541. [Google Scholar] [CrossRef]
- Adamson, T.C.; Olsson, G.R. Performance analysis of a rotating detonation wave rocket engine. Astronaut. Acta 1967, 13, 405–415. [Google Scholar]
- Shen, P.I.w.; Adamson, T.C. Theoretical analysis of a rotating two-phase detonation in liquid rocket motors. Astronaut. Acta 1972, 17, 715–728. [Google Scholar]
- Voytsekhovskiy, B.V. Stationary Detonation. Dokl. Akad. Nauk Ussr 1959, 129, 1254–1256. [Google Scholar]
- Cullen, R.E.; Nicholls, J.A.; Ragland, K.W. Feasibility studies of a rotating detonation wave rocket motor. J. Spacecr. Rocket. 1966, 3, 893–898. [Google Scholar] [CrossRef]
- Bykovskii, F.A.; Vedernikov, E.F. Continuous detonation of a subsonic flow of a propellant. Combust. Explos. Shock Waves 2003, 39, 323–334. [Google Scholar] [CrossRef]
- Wolanski, P.; Kindracki, J.; Fujiwara, T. An experimental study of small rotating detonation engine. In Pulsed and Continuous Detonations; Roy, G., Frolov, S., Sinibaldi, J., Eds.; Torus Press: Moscow, Russia, 2006; pp. 332–338. [Google Scholar]
- Kindracki, J. Badania Eksperymentalne i Symulacje Numeryczne Procesu Wirującej Detonacji Gazowej. [Experimental research and numerical calculation of the rotating detonation]. Ph.D. Thesis, Warsaw University of Technology, Warsaw, Poland, 2008. (In Polish). [Google Scholar]
- Kindracki, J. Analysis of the experimental results of the initiation of detonation in short tubes with kerosene–oxidizer mixtures. J. Loss Prev. Process Ind. 2013, 26, 1515–1523. [Google Scholar] [CrossRef]
- Kublik, D.; Kindracki, J.; Wolański, P. Evaluation of wall heat loads in the region of detonation propagation of detonative propulsion combustion chambers. Appl. Them. Eng. 2019, 156, 606–618. [Google Scholar] [CrossRef]
- Falempin, F.; Daniau, E.; Getin, N.; Bykovskii, F.A.; Zhdan, S. Toward a continuous detonation wave rocket engine demonstrator. In Proceedings of the A Collection of Technical Papers—14th AIAA/AHI International Space Planes and Hypersonic Systems and Technologies Conference, Canberra, Australia, 6–9 November 2006; Volume 1, pp. 501–511. [Google Scholar]
- Hishida, M.; Fujiwara, T.; Wolanski, P. Fundamentals of rotating detonations. Shock Waves 2009, 19, 1–10. [Google Scholar] [CrossRef]
- Wilson, D.R.; Lu, F.K. Summary of Recent Research on Detonation Wave Engines at UTA. In Proceedings of the 2011 International Workshop on Detonation for Propulsion, Busan, Korea, 14–15 November 2011. [Google Scholar]
- Yi, T.H.; Turangan, C.; Lou, J.; Wolanski, P.; Kindracki, J. A three-dimensional numerical study of rotational detonation in an annular chamber. In Proceedings of the 47th AIAA Aerospace Sciences Meeting including the New Horizons Forum and Aerospace Exposition, Orlando, FL, USA, 5–8 January 2009. [Google Scholar]
- Shao, Y.-T.; Liu, M.; Wang, J.-P. Numerical Investigation of Rotating Detonation Engine Propulsive Performance. Combust. Sci. Technol. 2010, 182, 1586–1597. [Google Scholar] [CrossRef]
- Wolanski, P. Detonative propulsion. Proc. Combust. Inst. 2013, 34, 125–158. [Google Scholar] [CrossRef]
- Zheng, D.; Wang, B. Acceleration of DDT by non-thermal plasma in a single-trial detonation tube. Chin. J. Aeronaut. 2018, 31, 1012–1019. [Google Scholar] [CrossRef]
- Li, J.; Lai, W.H.; Chung, K.; Lu, F.K. Experimental study on transmission of an overdriven detonation wave from propane/oxygen to propane/air. Combust. Flame 2008, 154, 331–345. [Google Scholar] [CrossRef]
- Liu, Q.; Bai, C.; Dai, W.; Jiang, L. Deflagration-to-detonation transition in isopropyl nitrate mist/air mixtures. Combust. Explos. Shock Waves 2011, 47, 448–456. [Google Scholar] [CrossRef]
- Zhang, F.; Akbar, R.; Thibault, P.A.; Murray, S.B. Effects of nitrates on hydrocarbon-air flames and detonations. Shock Waves 2001, 10, 457–466. [Google Scholar] [CrossRef]
- McAllister, S.; Chen, J.-Y.; Fernandez-Pello, A.C. Fundamentals of Combustion Processes; Springer: New York, NY, USA, 2011; ISBN 978-1-4419-7942-1. [Google Scholar]
- Coward, H.F.; Jones, G.W. Limits of inflammability of gases and vapors. J. Frankl. Inst. 1927, 203, 161. [Google Scholar] [CrossRef]
- Nettleton, M.A. Gaseous Detonations; Springer: Dordrecht, The Netherlands, 1987; ISBN 978-94-010-7915-0. [Google Scholar]
- Kistiakowsky, G.B.; Knight, H.T.; Malin, M.E. Gaseous Detonations. III. Dissociation Energies of Nitrogen and Carbon Monoxide. J. Chem. Phys. 1952, 20, 876–883. [Google Scholar] [CrossRef]
- Stamps, D.W.; Tieszen, S.R. The influence of initial pressure and temperature on hydrogen-air-diluent detonations. Combust. Flame 1991, 83, 353–364. [Google Scholar] [CrossRef]
- Austin, J.M.; Shepherd, J.E. Detonations in hydrocarbon fuel blends. Combust. Flame 2003, 132, 73–90. [Google Scholar] [CrossRef]
- Mendiburu Zevallos, A.A.; Ciccarelli, G.; Carvalho, J.A., Jr. DDT limits of ethanol–air in an obstacles-filled tube. Combust. Sci. Technol. 2018, 1–16. [Google Scholar] [CrossRef]
- Bull, D.C.; Elsworth, J.E.; Shuff, P.J.; Metcalfe, E. Detonation cell structures in fuel/air mixtures. Combust. Flame 1982, 45, 7–22. [Google Scholar] [CrossRef]
- Staffell, I.; Scamman, D.; Velazquez Abad, A.; Balcombe, P.; Dodds, P.E.; Ekins, P.; Shah, N.; Ward, K.R. The role of hydrogen and fuel cells in the global energy system. Energy Environ. Sci. 2019, 12, 463–491. [Google Scholar] [CrossRef]
- US Department of Energy. The Green Hydrogen Report. The 1995 Progress Report of the Secretary of Energy’s Hydrogen Technical Advisory Panel; US Department of Energy: Golden, CO, USA, 1995.
- Yuksel, Y.E.; Ozturk, M.; Dincer, I. Energetic and exergetic assessments of a novel solar power tower based multigeneration system with hydrogen production and liquefaction. Int. J. Hydrog. Energy 2019, 44, 13071–13084. [Google Scholar] [CrossRef]
- Wang, H.; Kong, H.; Pu, Z.; Li, Y.; Hu, X. Feasibility of high efficient solar hydrogen generation system integrating photovoltaic cell/photon-enhanced thermionic emission and high-temperature electrolysis cell. Energy Convers. Manag. 2020, 210, 112699. [Google Scholar] [CrossRef]
- Liu, Y.; Zhu, Q.; Zhang, T.; Yan, X.; Duan, R. Analysis of chemical-looping hydrogen production and power generation system driven by solar energy. Renew. Energy 2020, 154, 863–874. [Google Scholar] [CrossRef]
- Hosseini, S.E. Performance evaluation of a solarized gas turbine system integrated to a high temperature electrolyzer for hydrogen production. Int. J. Hydrog. Energy 2020. [Google Scholar] [CrossRef]
- Ishaq, H.; Siddiqui, O.; Chehade, G.; Dincer, I. A solar and wind driven energy system for hydrogen and urea production with CO2 capturing. Int. J. Hydrog. Energy 2020, 1–12. [Google Scholar] [CrossRef]
- Ishaq, H.; Dincer, I. Dynamic analysis of a new solar-wind energy- based cascaded system for hydrogen to ammonia. Int. J. Hydrog. Energy 2020. [Google Scholar] [CrossRef]
- Ni, M.; Leung, M.K.H.; Sumathy, K.; Leung, D.Y.C. Potential of renewable hydrogen production for energy supply in Hong Kong. Int. J. Hydrog. Energy 2006, 31, 1401–1412. [Google Scholar] [CrossRef]
- ETN Global. Hydrogen Gas Turbines; ETN Global: Brussels, Belgium, 2020. [Google Scholar]
- Goldmeer, J. Power to Gas: Hydrogen for power Generation—Fuel Flexible Gas Turbines as Enablers for a Low or Reduced Carbon Energy Ecosystem. Available online: https://www.ge.com/content/dam/gepower/global/en_US/documents/fuel-flexibility/GEA33861 Power to Gas—Hydrogen for Power Generation.pdf (accessed on 29 September 2020).
- Rowiński, A.; Łukasik, B.; Irzycki, A.; Czyż, S. The study of the continuously rotating detonation combustion chamber supplied with different types of fuel. J. Kones 2013, 20, 259–266. [Google Scholar]
- Ikema, D.; Yokota, A.; Kurata, W.; Kawana, H.; Ishii, K. Propagation stability of rotating detonation waves using hydrogen/oxygen-enriched air mixtures. Trans. Jpn. Soc. Aeronaut. Space Sci. 2018, 61, 268–273. [Google Scholar] [CrossRef]
- Zhou, S.; Ma, H.; Liu, D.; Yan, Y.; Li, S.; Zhou, C. Experimental study of a hydrogen-air rotating detonation combustor. Int. J. Hydrog. Energy 2017, 42, 14741–14749. [Google Scholar] [CrossRef]
- Rankin, B.A.; Codoni, J.R.; Cho, K.Y.; Hoke, J.L.; Schauer, F.R. Investigation of the structure of detonation waves in a non-premixed hydrogen-air rotating detonation engine using mid-infrared imaging. Proc. Combust. Inst. 2019, 37, 3479–3486. [Google Scholar] [CrossRef]
- Kindracki, J. Study of detonation initiation in kerosene–oxidizer mixtures in short tubes. Shock Waves 2014, 24, 603–618. [Google Scholar] [CrossRef]
- Kindracki, J. Experimental studies of kerosene injection into a model of a detonation chamber. J. Power Technol. 2012, 92, 80–89. [Google Scholar]
- Kindracki, J. Experimental research on rotating detonation in liquid fuel-gaseous air mixtures. Aerosp. Sci. Technol. 2015, 43. [Google Scholar] [CrossRef]
- Kindracki, J.; Kobiera, A.; Wolański, P.; Gut, Z.; Folusiak, M.; Swiderski, K. Experimental and numerical study of the rotating detonation engine in hydrogen-air mixtures. 2011, 2, 555–582. [Google Scholar] [CrossRef]
- Ashgriz, N. Handbook of Atomization and Sprays. Ashgriz, N., Ed.; Springer: Boston, MA, USA, 2011; ISBN 978-1-4419-7263-7. [Google Scholar]
- Sousa, J.; Paniagua, G.; Collado Morata, E. Thermodynamic analysis of a gas turbine engine with a rotating detonation combustor. Appl. Energy 2017, 195, 247–256. [Google Scholar] [CrossRef]
- Frolov, S.M.; Aksenov, V.S.; Ivanov, V.S. Experimental proof of Zel’dovich cycle efficiency gain over cycle with constant pressure combustion for hydrogen-oxygen fuel mixture. Int. J. Hydrog. Energy 2015, 40, 6970–6975. [Google Scholar] [CrossRef]
© 2020 by the authors. Licensee MDPI, Basel, Switzerland. This article is an open access article distributed under the terms and conditions of the Creative Commons Attribution (CC BY) license (http://creativecommons.org/licenses/by/4.0/).