Article

Comparative Analysis on Load Characteristic of Intermittently Conditioned Buildings for Different Wall Insulation Forms

1
School of Civil Engineering and Architecture, Zhejiang Sci-Tech University, Hangzhou 310018, China
2
School of Thermal Engineering, Shandong Jianzhu University, Jinan 250101, China
*
Authors to whom correspondence should be addressed.
Energies 2020, 13(18), 4974; https://doi.org/10.3390/en13184974
Submission received: 19 August 2020 / Revised: 9 September 2020 / Accepted: 19 September 2020 / Published: 22 September 2020
(This article belongs to the Section G: Energy and Buildings)

Abstract

:
The Air-conditioning System (ACS), used in office buildings in the hot summer and cold winter zone of China, are always operate intermittently. The dynamic thermal behaviors of building walls with real climate conditions may be different from those with only the representative day’s climate conditions, due to the time varying nature of the climate, which will lead to the variation of the ACS loads. A numerical calculation was performed to analyze the effects of insulation form on heat behavior of external walls and ACS loads. The results indicate that cooling transmission load with inside insulation reaches its maximum value when the solar-air temperature in daytime is the highest, while that with outside insulation occurs at the time when the air temperature at night is the highest during summer. Heating transmission load for the wall with external and internal insulation both peaks in the day with lowest mean outdoor temperature during the last non-working period. Inside insulation can be considered a better way to reduce the peak load, peak-valley load difference and energy consumption.

Graphical Abstract

1. Introduction

The hot summer and cold winter (HSCW) climate zone of China is characterized by a developed economy and high population density [1]. To maintain better indoor comfort, demand for air conditioning systems (ACS) has increased. It is estimated that the ACS loads in peak periods are continuously rising, and are the main reason for the peak load and the peak-valley difference of the power grid increasingly prominent, which has even reached the historical extreme value in 2019 [2]. Therefore, establishing ways to reduce ACS energy consumption is urgently needed.
Appropriate design of building envelope is one of the useful ways to realize effective energy conservation, given that 35% of the ACS energy consumption is caused by the heat transfer of building envelope in HSCW climate zone [1]. Proper distribution of thermal mass and insulation layer for building walls, not only helps to reduce transmission load and peak load, but also helps to maintain maximum load levelling [3,4]. Maximum load levelling is realized by reducing peak and enhancing valley of loads, i.e., reduction of the difference between peak and valley load [3]. The reduction of load, peak load and peak-valley load difference are quite significant; first, it reduces the large energy demand; second, it allows smaller ACS capacity and higher ACS energy efficiency [4]; third, it promote ACS operational stability, and hence, increases ACS energy efficiency [3]. Therefore, peak load, peak-valley load difference and energy consumption of ACS are all key aspect of its design.
However, previous research on optimization of insulation forms of building walls have focused more attention on continuously conditioned buildings [5,6,7,8,9,10]. In fact, the office buildings in HSCW zone are only conditioned during working time, i.e., ACS is intermittently operated. There are few studies focused on building partly occupied and intermittently conditioned. Barrios et al. [11] and Tsilingiris [12] studied the annual ACS energy consumption of an intermittently conditioned building under periodic ambient conditions. The results showed that inside insulation gives lowest ACS energy consumption. The research on the effectiveness of the insulation form of the external wall on ACS energy consumption obtained the same conclusions under the climate conditions of representative day. Wang et al. [1] investigated the dynamic thermal characteristics of intermittently heated rooms by employing CFD techniques. The results show the heat release of internal mass during non-working time causes the heating load increasing. Zhang et al. [13] and Yang et al. [14] found that envelope with heavy thermal mass can reduce transmission loads as the heat storing by the indoor side layer during daytime will be removed by ventilation at night. On the contrary, Yuan et al. [15] studied the thermal performance of walls with outside and inside insulation. The results indicate that the envelope with heavy thermal mass layer placed inside increase the transmission loads, for the thermal mass layer stores excess heat and this heat must be removed by ACS in next cooling period.
By comparison the above studies, it is found that the heat storage or release of the indoor side of the wall plays a significant role in cooling and heating loads in an intermittently conditioned room and it is determined by two factors, i.e., the capacity of the inside layer of the wall and ambient condition during ACS non-working time [1,13,14,15]. However, the above research was performed for the representative day, in which the ambient air temperature during non-working period is onefold, just low or high. However, in reality, both low and high outdoor air temperature at night occurs, which results the heat storage or release of the indoor side of the wall is difficult to confirm. Therefore, these researches only qualitatively explain the influence of wall insulation on the energy consumption of air conditioning, but they cannot comprehensively predict the load characteristics, such as the peak load and the daily load peak-valley difference during the whole cooling and heating seasons.
In the present paper, the most suitable insulation form of external walls from the peak load, the peak-valley load difference and total load of ACS has been investigated numerically based on the climate conditions throughout the whole cooling and heating season, as the conceptual framework shown in Figure 1.

2. Method

2.1. Climate Conditions
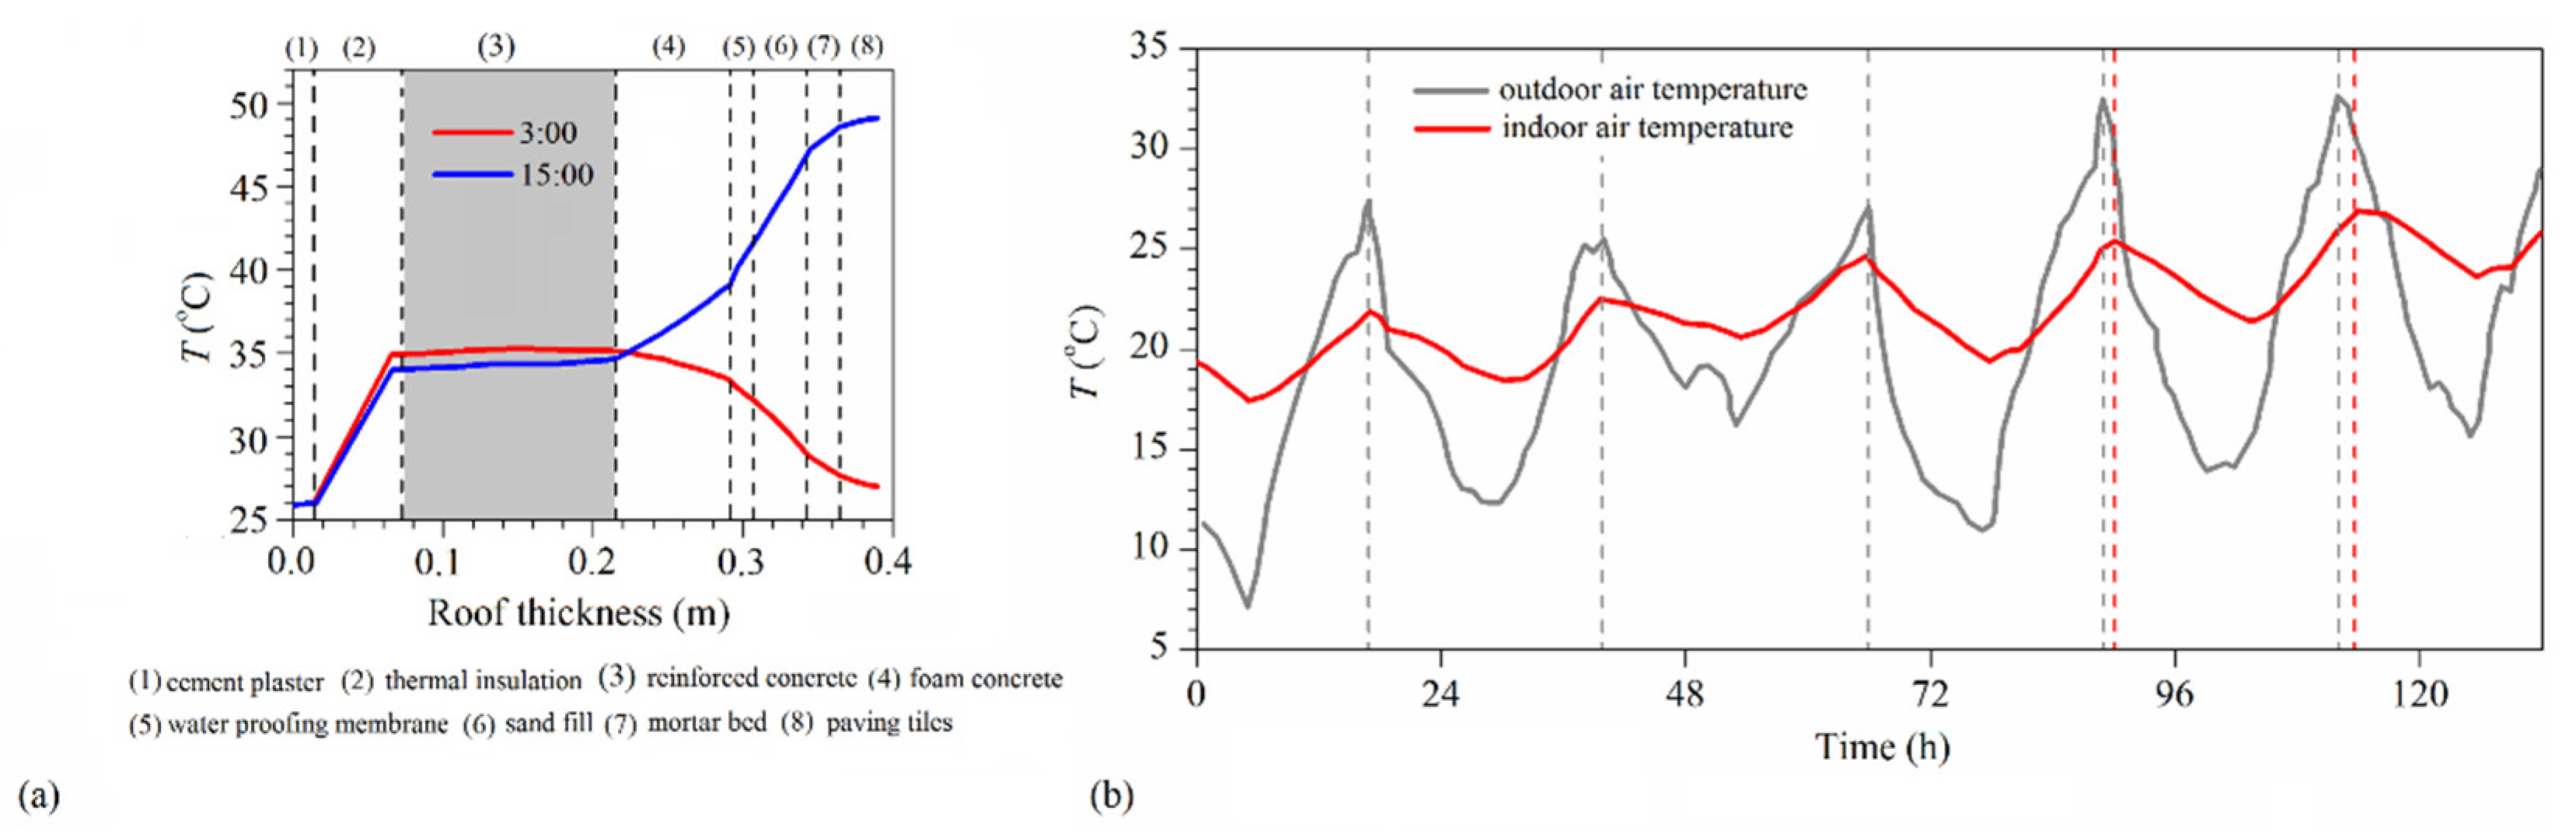
The HSCW zone involves Henan, Jiangsu, Anhui, Jiangxi, Fujian, Hunan, Sichuan and Guangxi Province and Shanghai [16]. In this region the mean temperature of the coldest month is between 0 and 10 °C, while that of the hottest month is between 25 and 29 °C. Additionally, the relative humidity is between 75% and 80% [17]. In this paper, the representative of HSCW zone is Shanghai. The climate data of outdoor air temperature and sol-air temperature are taken from the China Meteorological Data Sharing Service System and given in Figure 2.

2.2. Building Model

Office buildings are always multi-story buildings in the hot summer and cold winter zone. In such buildings, most of the rooms are with one exterior facade exposed to exterior conditions. The other walls between the two rooms can be considered interior walls. Therefore, a room located in the middle of an intermediate floor in a multi-story building is chosen as the calculation model [1,18], shown in Figure 3a. The internal walls between two rooms assumed to be at the same temperature, so intermediate layer of these walls can be considered as an adiabatic boundary.
The room used in this study was a single room with dimension of 6 m × 3.6 m × 3 m ((Long × Wide × High) and has a sliding double-glazing window with the dimension of 2 m × 1.6 m, as shown in Figure 3a. The windows are thermally controlled double 6 mm glass with a 5mm air gap (with heat transfer coefficient Uw = 3.0 W/m2·K, solar heat gain coefficient SHGC= 0.37) [19]. The internal envelope are 10 cm walls and 20 cm floor/ceiling built in reinforced concrete. The external wall structure was composed of 2 cm thick exterior plaster, an Extruded polystyrene (XPS) layer of variable thickness, 20 cm thick reinforced concrete and 2 cm thick interior plaster. Insulation was placed at outside (Wall-1) and inside (Wall-2) as shown in Figure 3b. Insulation thickness was increased from 1.5 to 9.0 cm, corresponding to the thermal resistance R = 0.5, 1.0, 2.0, 3.0 m2·K/W, respectively. Thermophysical properties of the external walls are presented in Table 1.

2.3. HVAC System

The cooling and heating season of Shanghai are 15 June–15 September, and 1 December–15 March, respectively [18]. The ACS was switched on-off intermittently, running only from 8:00 to 18:00. The window was kept closed when the ACS is off. Here indoor set point temperature was 26 °C for cooling and 20 °C for heating [16], the air change rate resulted by infiltration was 1.0 h−1(one air change per hour).

2.4. Internal Loads

There are two people (10 m2/person), two computers and four lightings in each room, with 76 W person’s sensible and 32 W latent heat gains, 400 W heat gains of the equipment. Operating time of the equipment is half of the working time [16].

2.5. Mathematical Formulation and Calculation Procedure

To analyze the temperature distribution of composed walls, Figure 4a shows the temperature distribution across the roof thickness at two different times by employing a numerical method. The temperature distribution of reinforced concrete (the gray area) was nearly invariable because of the fast thermal diffusion. Figure 4b presents the measured indoor air temperature of a test chamber whose walls were composed of thermal insulation layer and metal board. It can be seen that the peak temperature of outdoor and indoor air nearly has no time lag. This proves the heat conduction of insulation layer can be deemed steady.
To simplify the analysis, some assumptions are used to establish for mathematical model based on the above results and other studies, as follows:
(1)
The temperature distribution across the reinforced concrete layer is uniform because of high thermal conductivity. This implies the convection heat-transfer at its surface is quite slower than the thermal diffusion [14,15,22].
(2)
The heat conduction of insulation layer is deemed as steady heat conduction, as the heat storage capacity of the insulation can be ignored for its low density [4,15].
(3)
There exists thermal radiation between the room surfaces due to temperature difference. However, temperature difference will be reduced by adding insulation layer on the external walls, and hence some studies neglected this thermal radiation [4,15,22]. For simplicity, this thermal radiation is also ignored in the present study.
Based on the above assumptions, the heat balance equations can be written as:

2.5.1. Heat Balance Equations of External Walls

h o ( T sa θ e ) = λ i δ i ( θ e T m )
λ i δ i ( θ e T m ) h i ( θ i T i ) = ρ m c m δ m d T m d τ
with the boundary condition
θ i = T m
By solving the above questions, exterior and interior surface temperature θe and θi of Wall 1 is expressed by:
θ e = h o T sa + λ i δ i T m h o + λ i δ i
and,
θ i = ( h o + λ i δ i ) h i T i + λ i δ i h o T sa ( h o + λ i δ i ) ( h i + λ i δ i ) ( λ i δ i ) 2 + C 1 exp ( ( h o + λ i δ i ) ( h i + λ i δ i ) ( λ i δ i ) 2 ( h o + λ i δ i i ) ρ m c m δ m τ )
for exterior insulation, and
h o ( T sa θ e ) λ i δ i ( T m θ i ) = ρ m c m δ m d T m d τ
h i ( θ i T i ) = λ i δ i ( T m θ i )
with the condition,
θ e = T m
for interior insulation.
By solving the above questions, θe and θi of Wall 2 is expressed by,
θ e = ( h i + λ i δ i ) h o T sa + λ i δ i h i T i ( h o + λ i δ i ) ( h i + λ i δ i ) ( λ i δ i ) 2 + C 2 exp ( ( h o + λ i δ i ) ( h i + λ i δ i ) ( λ i δ i ) 2 ( h i + λ i δ i ) ρ m c m δ m τ )
θ i = h i T i + λ i δ i T m h i + λ i δ i
where hi and ho is the convection heat transfer coefficient at the wall inside and outside surface, here, hi = 8.0 W/m2·K [12] and ho= 23 W/m2·K [23]. λi is the thermal conductivity of insulation layer (W/m·K). cm and ρm are the specific heat capacity (J/kg·K) and density (kg/m3) of the thermal mass material, respectively. δm and δi are the thicknesses of the thermal mass and insulation layers (m). Ti and Tm is the temperature of indoor air and the thermal mass (°C). Tsa is solar-air temperature, which can be written as [11]:
T sa ( τ ) = T o ( τ ) + a I ( τ ) h o σ Δ R h o
where To is the ambient air temperature (°C); I is the total solar radiation (W/m2). a is the solar absorptivity at the envelope exterior surface, here, a = 0.7. εΔR/ho is the correction coefficient and it is 0 °C here [5].

2.5.2. Heat Balance Equations of Indoor Air

Under the case of ACS intermittently operated, Ti is the set temperature during ACS working periods, and controlled by Equation (4) when ACS is off,
n 3600 ρ c p V ( T o ( τ ) T i ( τ + Δ τ ) ) + h i F ( θ i ( τ ) T i ¯ ( τ , τ + Δ τ ) ) + h i F cf ( θ cf ( τ ) T i ¯ ( τ , τ + Δ τ ) ) + U w F w ( T o ( τ ) T i ¯ ( τ , τ + Δ τ ) ) = ρ c p V ( T i ( τ + Δ τ ) T i ( τ ) ) Δ τ
T i ¯ ( τ , τ + Δ τ ) = T i ( τ + Δ τ ) + T i ( τ ) 2
with the initial condition,
τ = 0, Ti (0) = Tc
where ρ and cp are the density (kg/m3) and specific heat capacity of air (J/kg·k). n is the room air change rate (h−1). Uw is the heat transfer coefficient of the windows. Tc is the initial temperature of indoor air, °C. V is the volume of the rooms (m3). θcf are the inner surface temperature of the internal wall (°C). Fw, F and Fcf are the areas of the windows, external walls and internal walls (m2), respectively. Δτ is the time step (s).

2.5.3. Heat Balance Equations of Internal Walls

h i F i ( T i ¯ ( τ , τ + Δ τ ) θ cf ( τ ) ) = 1 2 ρ m c m δ cf d θ cf d τ
Combining above equations, numerical calculations were performed with MATLAB program. In this way, the inner and the outer surfaces temperature of envelopes, indoor air temperature could be determined.

2.6. Model Validation

In order to validate the created model, the calculated results were compared with the experimental results. The experiment is conducted in a chamber in dimension of 3.6 × 3.0 × 2.6 m (Long × Wide × High), which was constructed in a laboratory. Its envelope configuration contains 7 mm rock wool layer placed at inside and 10 mm stainless steel layer. A thick insulation layer was placed on its bottom to prevent heat transfer of the floor. Three boxes filled with sand were regarded as internal envelopes, with the dimensions of 0.5 × 0.4 × 1.2 m (Long × Wide × High). The air temperature of laboratory was set at 22 °C. The chamber was heated 12 h each day, with the set temperature of 28 ± 0.5 °C. The door of the chamber is always closed.
The air temperature was measured using type-K thermocouples, which was installed on 4 poles with 7 measuring points. In addition, 4 thermocouples were also employed to measure the temperature of the sand. The distribution of the measuring poles and points are presented in Figure 5b–d. The air and sand temperature are obtained by averaging the values at different measuring points, respectively.
The calculated and experimental results about air (Ti) and sand temperature (qi) are compared in Figure 6. It shows that good agreement is achieved between the two sets of results. To quantify the error between the two sets of results, CV(RMSE)(Cumulative Variation of Root Mean Square Error) is calculated, with the detailed calculation procedure of CV(RMSE) given in [24]. The CV(RMSE) is 1.3% and 2.3% for Ti and θi, respectively. Comparing results demonstrates the analytical model are reliable in this study, so it will be used for the following discussions.

3. Results and Discussion

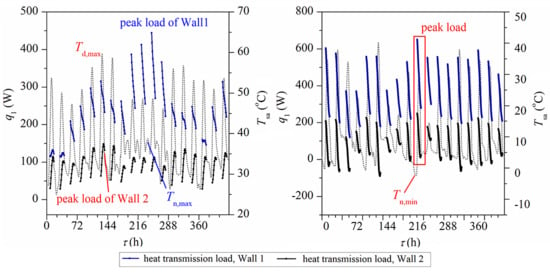
3.1. Effects of Insulation form on the Hourly Transmission Loads

Figure 7 shows the hourly temperature variation of the interior surface of external wall (θi) with 1.5 cm thick insulation layer in the hottest month, and in the coldest month, respectively. A detailed variation of inner surface temperature (θi) and indoor air temperature for three days (Ti) is presented.
It can be seen that the θi of Wall 2 fluctuates more significantly due to the variation of solar-air and indoor air temperature. The maximum temperature swing for Wall 2 (inside insulation) can be more than 10 °C in summer and reach 20 °C in winter, but for Wall 1 (with external insulation) it can only be less than half of that for Wall 2.
Due to the low heat capacity of the insulation materials, the insulation layer responds rapidly to the change of the ambient air temperature. When the ACS is switched on, θi of Wall-2 decreases and approaches to the set point (26 °C) immediately, but θi of Wall-1 decreases gradually. When the ACS is switched off, the thermal mass layer can prevent rapid increase of θi of Wall 1, so it increases only 3 °C during ACS non-working time, while increases 8 °C for Wall 2. Moreover, θi and Ti of Wall-2 increases nearly simultaneously, i.e., there is no time lag. But for Wall-1, there is at least 5 h time lag. Similar results are obtained in winter. Therefore, a smaller difference between inner surface temperature and the design room value for inside insulation than that for outside insulation when the ACS starts to run. The cooling or heating transmission load would be proportional to this temperature.
Similar trends of variations are calculated for other cases of external walls with 3.0, 6.0, 9.0 cm insulation layer, so no more detailed description about these.
The transmission load is expressed by:
q i ( τ ) = h i F ( θ i ( τ ) T i ( τ ) )
Figure 8 indicates that a variation exists in relation to the transmission load for two different insulation form. Wall 2 provides a smaller transmission loads both in summer and winter. For most days in summer, the maximum transmission load of Wall 2 is about less than 70% of the minimum transmission load of Wall 1 in summer. Even the largest difference of the cooling transmission load between two walls is that the former is only about 30% of the later. In winter, the maximum transmission load of Wall 2 is nearly equivalent to the minimum transmission load of Wall 1.
Interestingly, the transmission load for the wall with external and internal insulation peaked at definitely different time in summer. Peak transmission load of Wall 1 occurs in the day with maximum mean outdoor from 18:00 to 8:00 in next day (Tn,max) and that of Wall 2 occurs in the day with maximum mean sol-air temperature from 8:00 to18:00 (Td,max) in summer, see the red box in Figure 8a. Differently from summer, in winter the transmission load for Wall 1 and Wall 2 both peaks in Jan. 10 with the maximum mean outdoor temperature (Tn,max), shown in Figure 8b.
For exterior insulation (Wall 1), the thermal mass layer who has high heat capacity stores (releases) much heat during ACS off period in summer (winter). Thus, a large amount of energy applies to cool (or heat) the inner layer of envelopes in the first few hours of the next cooling (heating) period. This leads to the peak transmission load occurs in the day with highest (lowest) mean outdoor temperature during ACS off time.
The reason why the transmission load for Wall 2 peaks at different cases in summer and winter is twofold, one is the temperature difference between indoor and outdoor air (ΔT) and another is the insulation layer’s low heat capacity. In winter, large ΔT results in the insulation layer releasing quite much heat during ACS off period, which causes large increase of the load of the next heating period. However, in summer with small ΔT, the insulation layer stores little heat during ACS off time, which has slight effect on the transmission load in the next cooling period.
Figure 8 indicates that inside insulation does not only reduce heat transfer, but also reduce peak heat transmission load significantly. The transmission load peak-valley difference is also different for the two walls.

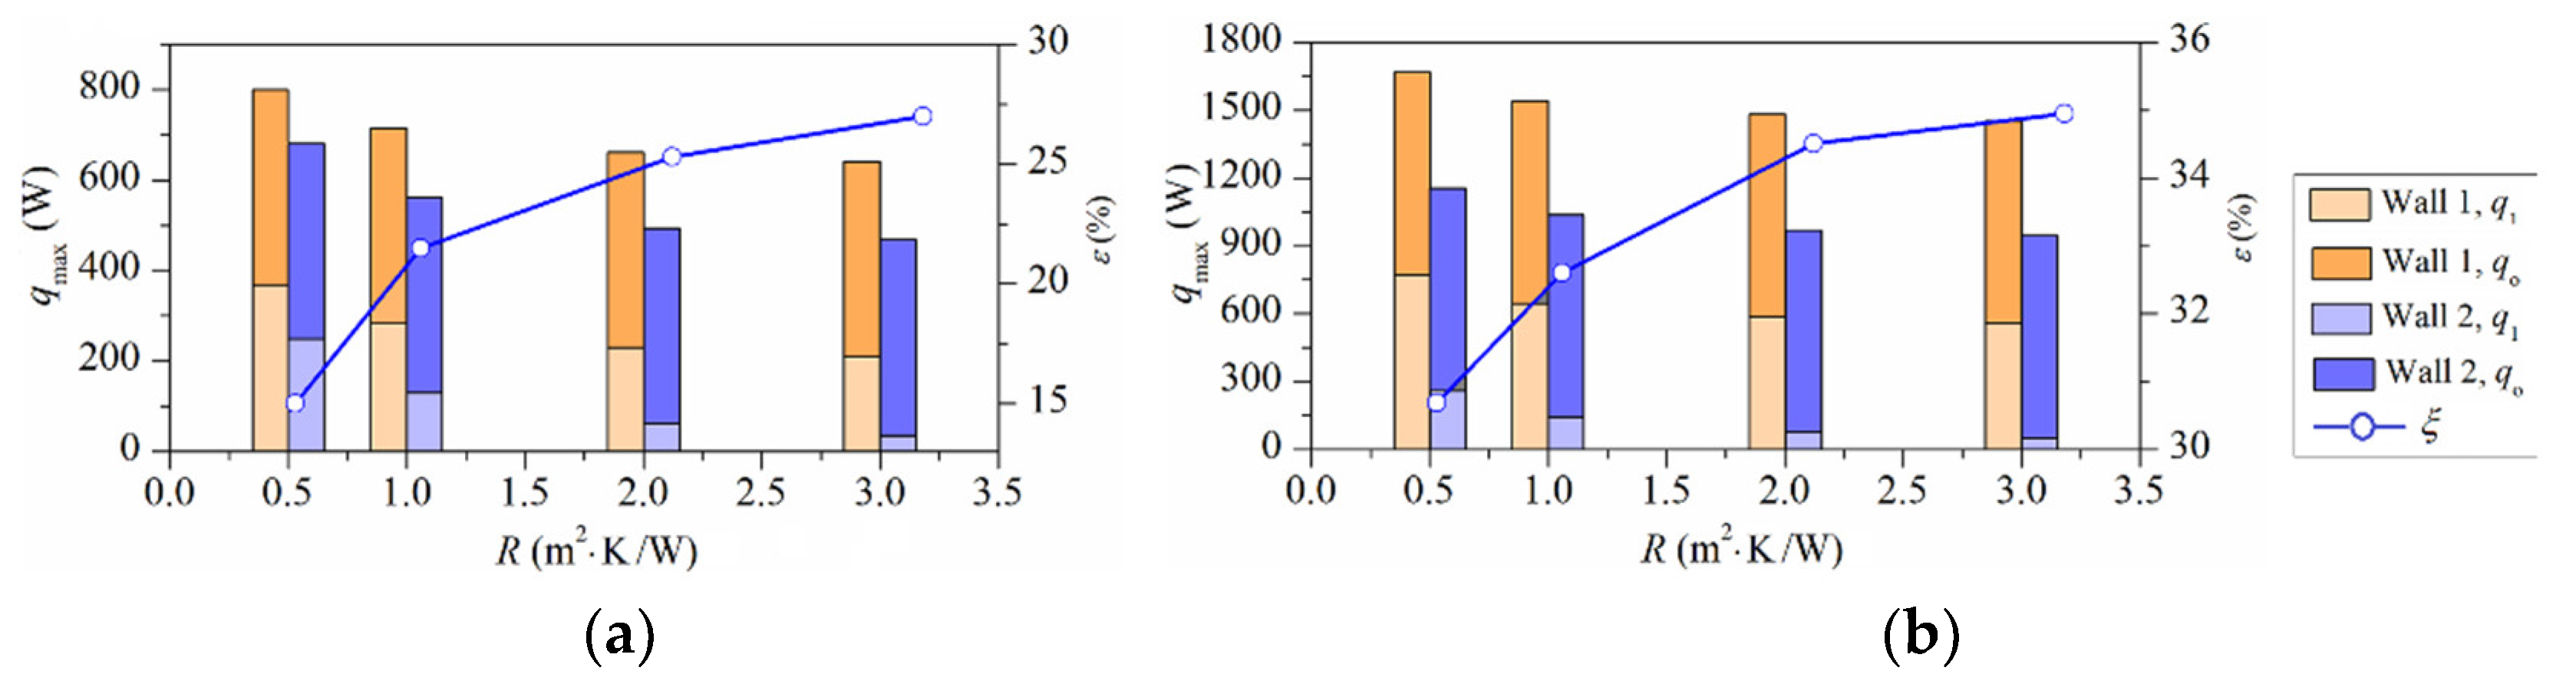
3.2. Effects of Insulation form on Peak Loads

Figure 9 compares the peak heat transfer load of the two walls with respect to different insulation resistance. Inside insulation (Wall 2) gives lower peak transmission loads. The larger the insulation resistance is, the greater the advantage of inside insulation is. even if the wall has a low insulation resistance of 0.5 m2·K/W, the peak heat transfer load of Wall 2 is about 40% lower than that of Wall 1 (outside insulation) in summer. Inside insulation has a stronger advantage of reducing peak transmission load in winter than in summer.
Cooling and heating loads consist of transmission load of exterior wall (q1), and other components of cooling and heating loads (qo) including fresh air load (qv), transmission load of interior walls (qi), the load due to heat conduction through windows (qw), the load; due to solar radiation heat gain (qs) and internal heat gain (qh). Solar radiation and internal heat gain are first absorbed by the internal mass and later transferred from the surfaces of internal mass to the air by convection, i.e., loads are forming after a time delay. Therefore, the load factor method, by which the effect of thermal internal gains by solar radiation transferred to load has been considered, is employed to calculate these two loads. Detailed calculation procedures for qo are given by Equations (17)–(23):
q o = q v + q i + q w + q s + q h
q v = M o ρ ( H o ( τ ) H i ( τ ) ) 3600
in summer, and
q v = M o c p ρ ( T i ( τ ) T o ( τ ) ) 3600
in winter:
q i = h i F i ( θ cf ( τ ) T i ( τ ) )
q w = U w F w ( T o ( τ ) T i ( τ ) )
q s = C a C s F w D j C LQ
q h = q S C L + q L
where Mo is the fresh air volume and Mo = 30 m3/h [23]. Ho and Hi are the enthalpy of the ambient and indoor air, (J/kg). CLQ and CL are the load factor of windows and internal heat gains [23]. CS and Ca is the shading and effective area coefficient and their value are 0.93 and 0.85 [23]. Dj is the solar heat gain factor and its value is 174 W/m2 and 207 W/m2 for summer and winter [23]. qS and qL are indoor sensible, and latent heat gain, respectively.
Insulation form affects the heat transmission load directly, and it further have an effect on the total load of air conditioning. Therefore, we define the peak load rate (ε) to represent compare the advantage of two walls to reduce peak load, as follows,
ε = q max , out q max , in q max , out × 100 %
where qmax,out and qmax,in are the peak cooling or heating load of the insulated buildings with outside, and inside insulation, respectively (W).
The peak cooling or heating loads of buildings with outside and inside insulation, and peak load rate (ε) in relation to the insulation thermal resistance (R) is reported in Figure 10.
Figure 10a shows when the wall has a low insulation resistance of 0.5 m2·K/W, the peak cooling load of the room with inside insulation is about 15% lower than that of the room with external insulation. When the insulation resistance is large enough (R = 2.0 m2·K/W), peak load rate can be reached 25%. Compared with summer, the advantage of inside insulation to reduce peak loads is more significant in winter. Even when the wall has a low insulation resistance of 0.5 m2·K/W, peak load rate can be reached 25%. When the insulation resistance is large enough (R = 2.0 m2·K/W), peak load rate can be as high as 35%.

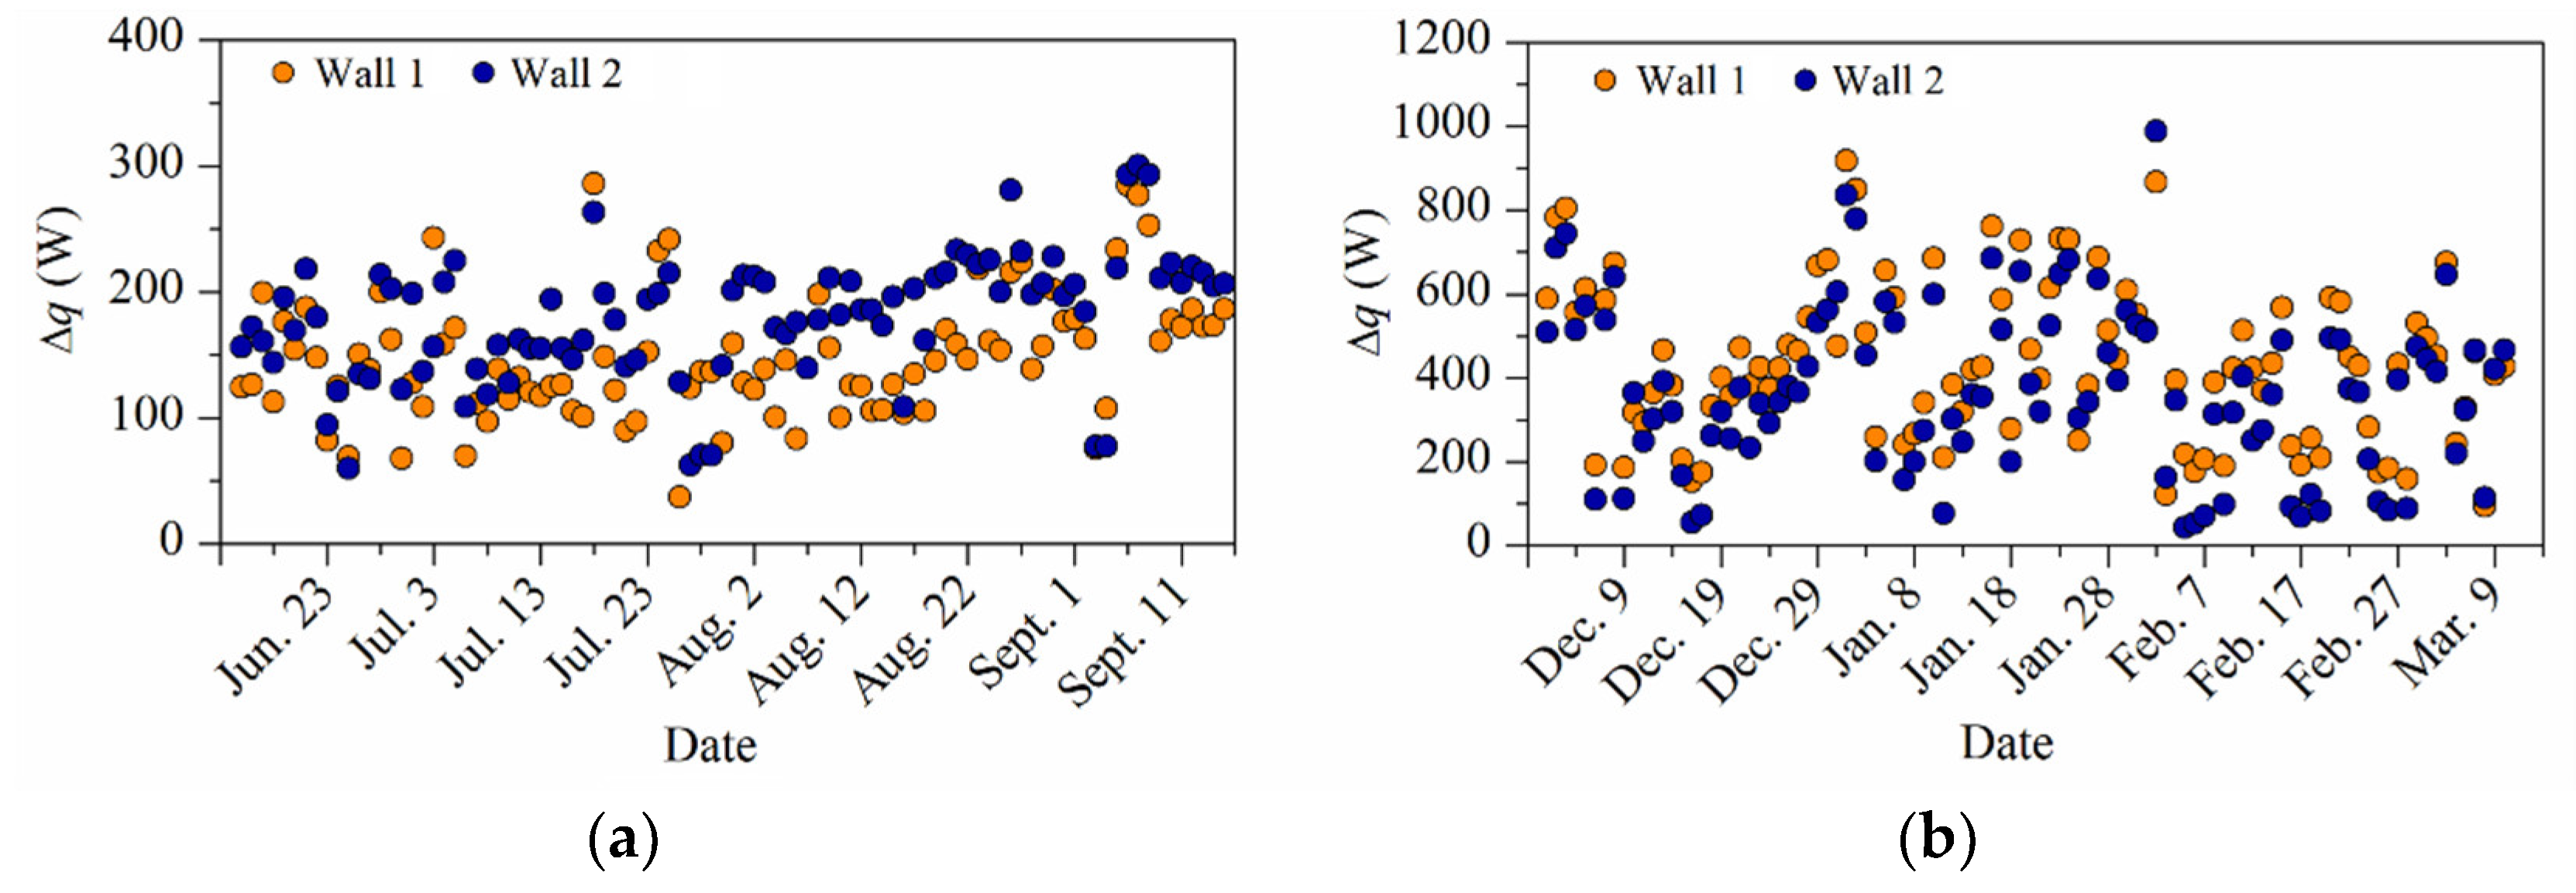
3.3. Effect of Insulation form on Daily Peak-Valley Load Difference

To evaluate the swing of the load during ACS working time, the peak-valley load difference are calculated, in which the peak and valley load is the maximum and minimum daily cooling or heating load during ACS working time. The variations of the daily peak-valley load difference for R = 0.5 m2·K/W during cooling and heating seasons are shown in Figure 11, respectively. It indicates that the daily peak-valley load of Wall 2 is larger than that of Wall 1 in summer. Winter is the opposite, i.e., the daily peak-valley load difference of Wall 2 is smaller than that of Wall 1.
Figure 12 presents the daily peak-valley load difference visually using a boxplot broken out for different insulation resistance. As clearly shown in Figure 12a, the medians and the interquartile ranges of Wall 1 are lower than Wall 2. However, the difference between them gradually narrow with the insulation resistance increasing. Conversely, in winter, the medians and the interquartile ranges of Wall 1 are higher than that of Wall 2, and this advantage of inside insulation is more significant for higher insulation resistance.
Comparing Figure 12a,b, the medians in winter are larger than in summer, meaning that decreasing peak-valley load difference of winter is more essentially. When the insulation is placed on the indoor surface, the peak-valley load difference is greatly reduced in winter. Therefore, inside insulation can be considered a better way to maintain the ACS running steady.

3.4. Effects of Insulation form on ACS Energy Consumption

To compare the effects of insulation form on the ACS energy consumption of each month, the energy consumption index, written as Equation (25), in the considered months for different insulation forms are presented in Figure 13,
Q = Q 1 + Q o = 0 τ q 1 d τ A f · τ + 0 τ q o d τ A f · τ
where Q1 and Qo are the energy consumption index due to heat transfer through the external wall and other components energy consumption index (due to fresh air load, heat conduction through windows, solar radiation heat gain and internal heat gain), W/m2. Af is the floor area of the office room, m2.
The results in Figure 13a show that in July and August, Q1 of Wall-2 is much lower comparison with Wall-1. But it is just the reverse in June and September. As a result, the trend of Q is similar to that of Q1. The reason is that the outdoor air temperature during ACS off period is lower than the cooling set temperature frequently in June and September, so the inside layer of the wall is cooled which can decrease the transmission load of next cooling period. Wall-1 with the mass layer inside releases more heat, so results to more significant reduction of the transmission load, and hence, lower total cooling loads. However, the reduction of energy consumption caused by internal insulation in the hottest months is much larger than that caused by external insulation in June and September.
Figure 13b indicates that inside insulation always gives lower energy consumption and the difference of q1 between two walls is quite big. The reason for that has two, first, the heat capacity (ρ × c) of the thermal mass is about 54 times higher than that of the insulation material; second, the ambient temperature is really low, such as the temperature deviates from the set temperature (20 °C) by more than 15 °C for nearly 50% of the winter time (see in Figure 2). This will lead to a large amount energy to heat the inside layer of Wall 1 during the first few hours of the next heating period.
To compare the energy saving of outside and inside insulation, the relative energy saving index (ξ), expressed as Equation (26), are presented in Figure 14.
ξ = Q out Q in Q out × 100 %
where Qout and Qin is the energy consumption of the rooms with exterior and interior insulation, respectively (W/m2).
Figure 14 shows that inside insulation gives lower energy consumption caused by the wall heat transfer (Q1) more significantly and total energy consumption than outside insulation. In summer, when the insulation resistance is as low as 0.5 m2·K/W, Q1 of Wall 2 is about 2/3 of that of Wall 1, and the relative energy saving index (ξ) can reach 8%. In winter, for the same case, Q1 of Wall 2 is only 1/5 of that of Wall 1 and ξ can reach 35%. A more significant energy saving can be achieved when insulation placed towards the inside, and the advantage of inside insulation is more significant in winter.
Further, it can be seen that increasing insulation resistance, ξ cannot be increased significantly, such as when the insulation resistance increases from 0.5 to 3.0 m2·K/W, the energy saving increases about 3% in summer and less than 2% in winter. Increasing the thermal resistance of insulation cannot enhance the energy saving advantage of inside insulation.
The above conclusions confirm that the inner layer of the envelope storing/dissipating excess heat during ACS off period is the main reason influencing cooling/heating loads. This part of loads can be reduced by placing the insulation inside effectively, especially in winter with larger outdoor and indoor temperature difference. Hence, inside insulation is an effective way to achieve energy savings of buildings intermittently conditioned in HSCW zone.

3.5. Study Limitations

The main limitations of this paper are as follows: (a) there are some assumptions for the model, and based on these, the lumped parameter method was used for the modelling of the reinforced concrete layer of the wall. It might be simplified for the actual situation; (b) the applicability of the building mode has a limited range for the specific thermal properties of building materials; (c) no simulation tool was used and the selected model is not based on real-time monitoring.

4. Conclusions

The effects of insulation form on peak loads, peak-valley loads difference and total loads were studied under the real climatic conditions of Shanghai, presenting HSCW zone in China. For this purpose, investigation is carried out for an office with the insulation layer placed at exterior and interior of the wall. The results show that:
(1)
In the cooling season, when the wall insulated externally and internally, cooling transmission loads peaked in the day with the maximum mean outdoor temperature during the last ACS non-working period and with maximum mean sol-air temperature during ACS working time, respectively. Contrary to the cooling season, the heating transmission loads for the wall with external and internal insulation both peaked in the day with lowest mean outdoor temperature during the last ACS off period.
(2)
Compared with outside insulation, inside insulation gives lower peak loads. The peak cooling and heating loads of the room with interior insulation are at least 15% and 25% lower than that of the room with exterior insulation.
(3)
The steady running of ACS in winter is more difficult to realize in winter than in summer, meaning that decreasing peak-valley load difference of winter is more essential. When the insulation placed on the indoor surface, the peak-valley load difference is reduced greatly in winter. Thus, inside insulation can be considered a better way to maintain the ACS running steady.
(4)
A more significant energy saving can be achieved when insulation placed towards the inside, and this advantage of inside insulation is more significant in winter.

Author Contributions

Conceptualization, L.Y. and Z.W.; methodology, L.Y.; software, Y.H.; validation, X.W.; formal analysis, X.W.; investigation, X.W.; resources, L.Y.; data curation, L.Y.; writing—original draft preparation, Z.W.; writing—review and editing, L.Y.; visualization, Y.H.; supervision, L.Y. All authors have read and agreed to the published version of the manuscript.

Funding

This research received no external funding.

Conflicts of Interest

The authors declare no conflict of interest.

References

  1. Wang, S.; Kang, Y.; Yang, Z.; Yu, J.; Zhong, K. Numerical study on dynamic thermal characteristics and optimum configuration of internal walls for intermittently heated rooms with different heating durations. Appl. Therm. Eng. 2019, 155, 437–448. [Google Scholar] [CrossRef]
  2. Zheng, X.; Lin, Z.; Xu, B.Y. Thermal conductivity and sorption performance of nano-silver powder/FAPO-34 composite fin. Appl. Therm. Eng. 2019, 160, 114–120. [Google Scholar] [CrossRef]
  3. Ozel, M.; Pihtili, K. Investigation of the most suitable location of insulation applying on building roof from maximum load levelling point of view. Build. Environ. 2007, 42, 2360–2368. [Google Scholar] [CrossRef]
  4. Al-Sanea, S.A.; Zedan, M.F. Improving thermal performance of building walls by optimizing insulation layer distribution and thickness for same thermal mass. Appl. Energy 2011, 88, 3113–3124. [Google Scholar] [CrossRef]
  5. Ozel, M. Effect of insulation location on dynamic heat-transfer characteristics of building external walls and optimization of insulation thickness. Energy Build. 2014, 72, 288–295. [Google Scholar] [CrossRef]
  6. Al-Sanea, S.A.; Zedan, M.F. Effect of insulation location on thermal performance of building walls under steady periodic conditions. Int. J. Ambient. Energy 2001, 22, 59–72. [Google Scholar] [CrossRef]
  7. Daouas, N. A study on optimum insulation thickness in walls and energy savings in Tunisian buildings based on analytical calculation of cooling and heating transmission loads. Appl. Energy 2011, 88, 156–164. [Google Scholar] [CrossRef]
  8. Kaynakli, A review of the economical and optimum thermal insulation thickness for building applications. Renew. Sustain. Energy Rev. 2015, 16, 415–425.
  9. Sadineni, S.B.; Madala, S.; Boehm, R.F. Passive building energy savings: A review of building envelope components. Renew. Sustain. Energy Rev. 2011, 15, 3617–3631. [Google Scholar] [CrossRef]
  10. Shekarchian, M.; Moghavvemi, M.; Rismanchi, B.; Mahlia, T.M.I.; Olofsson, T. The cost benefit analysis and potential emission reduction evaluation of applying wall insulation for buildings in Malaysia. Renew. Sustain. Energy Rev. 2012, 16, 4708–4718. [Google Scholar] [CrossRef]
  11. Barrios, G.; Huelsz, G.; Rojas, J. Thermal performance of envelope wall/roofs of intermittent air-conditioned rooms. Appl. Therm. Eng. 2012, 40, 1–7. [Google Scholar] [CrossRef]
  12. Tsilingiris, P.T. Wall heat loss from intermittently conditioned spaces—The dynamic influence of structural and operational parameters. Energy Build. 2006, 38, 1022–1031. [Google Scholar] [CrossRef]
  13. Zhang, R.; Nie, Y.; Lam, K.P.L.; Biegler, T. Dynamic optimization based integrated operation strategy design for passive cooling ventilation and active building air conditioning. Energy Build. 2014, 85, 126–135. [Google Scholar] [CrossRef]
  14. Yang, L.; Li, Y. Cooling load reduction by using thermal mass and night ventilation. Energy Build. 2008, 40, 2052–2058. [Google Scholar] [CrossRef]
  15. Yuan, L.; Kang, Y.; Wang, S.; Zhong, K. Effects of thermal insulation characteristics on energy consumption of buildings with intermittently operated air-conditioning systems under real time varying climate conditions. Energy Build. 2017, 155, 559–570. [Google Scholar] [CrossRef]
  16. China Academy of Building Research. The People’s Republic of China National Standard GB50189-2015, Design Standard for Energy Efficiency of Public Buildings (in Chinese); China Architecture and Building Press: Beijing, China, 2015. [Google Scholar]
  17. Yu, J.; Yang, C.; Tian, L.; Liao, D. A study on optimum insulation thicknesses of external walls in hot summer and cold winter zone of China. Appl. Energy 2009, 86, 2520–2529. [Google Scholar] [CrossRef]
  18. Raftery, P.; Lee, E.; Webster, T.; Hoyt, T.; Bauman, F. Effects of furniture and contents on peak cooling load. Energy Build. 2014, 85, 445–457. [Google Scholar] [CrossRef] [Green Version]
  19. Friess, W.A.; Rakhshan, K.; Hendawi, T.A.; Tajerzadeh, S. Wall insulation measures for residential villas in Dubai: A case study in energy efficiency. Energy Build. 2012, 44, 26–32. [Google Scholar] [CrossRef]
  20. Al-Sanea, S.A. Thermal performance of building roof elements. Build. Environ. 2002, 37, 665–675. [Google Scholar] [CrossRef]
  21. Zhang, Y.; Lin, K.; Zhang, Q.; Di, H. Ideal thermophysical properties for free-cooling (or heating) buildings with constant thermal physical property material. Energy Build. 2006, 38, 1164–1170. [Google Scholar] [CrossRef]
  22. Yam, J.; Li, Y.; Zheng, Z. Nonlinear coupling between thermal mass and natural ventilation in buildings. Int. J. Heat Mass Transf. 2003, 46, 1251–1264. [Google Scholar] [CrossRef]
  23. China Academy of Building Research. Code for Thermal Design of Civil Building GB 50176-2016, Ministry of Housing and Urban-Rural Development of the People’s Republic of China (in Chinese); China Architecture and Building Press: Beijing, China, 2016. [Google Scholar]
  24. Royapoor, M.; Roskilly, T. Building model calibration using energy and environmental data. Energy Build. 2015, 94, 109–120. [Google Scholar] [CrossRef] [Green Version]
Figure 1. Conceptual framework of the present study.
Energies 13 04974 g001
Figure 2. Climate data of Shanghai (a) in summer and (b) in winter.
Energies 13 04974 g002
Figure 3. Schematic view of the (a) typical room; and (b) external wall configurations.
Energies 13 04974 g003
Figure 4. The results of previous papers; (a) temperature distribution across the roof thickness [20]; and (b) the variation of outdoor and indoor air temperature [21].
Energies 13 04974 g004
Figure 5. Schematic view of the experimental chamber: (a) its layout, (b) distribution of measuring poles, (c) distribution of measuring points and (d) measuring points of the sand box.
Energies 13 04974 g005
Figure 6. Comparisons between the calculated and experimental data of indoor air and interior surface temperature.
Energies 13 04974 g006
Figure 7. Variations of the inside surface temperature (a) in cooling season (b) in heating season.
Energies 13 04974 g007
Figure 8. Hourly variations of the transmission load; (a) in cooling season; (b) in heating season.
Energies 13 04974 g008
Figure 9. Comparison of the peak transmission load between the two walls with respect to different insulation resistance; (a) in cooling season; (b) in heating season.
Energies 13 04974 g009
Figure 10. Comparison of the peak load between the externally and internally wall with respect to different insulation resistance; (a) in cooling season; (b) in heating season.
Energies 13 04974 g010
Figure 11. The peak and valley load difference of ACS for different insulation form; (a) in cooling season; (b) in heating season.
Energies 13 04974 g011
Figure 12. Boxplot of the daily peak-valley load difference for different thermal resistance; (a) in cooling season; (b) in heating season.
Energies 13 04974 g012
Figure 13. Effect of insulation form on transmission load and total loads for different month; (a) in cooling season; (b) in heating season.
Energies 13 04974 g013
Figure 14. Comparison of the energy consumption for different insulation form with respect to different insulation resistance; (a) in cooling season; (b) in heating season.
Energies 13 04974 g014
Table 1. Thermo-physical properties of external wall [17,18].
MaterialThickness
δ (cm)
Density
ρ (kg/m3)
Thermal Conductivity
λ (W/(m·K)
SpecificHeat Capacity
ρcp (J/(kg·K))
Reinforced concrete2025001.74920
XPS1.5, 3.0, 6.0, 9.0350.031213

