Article

Design of Battery Storage System for Malaysia Low Voltage Distribution Network with the Presence of Residential Solar Photovoltaic System

1
Faculty of Electrical Engineering, Universiti Teknikal Malaysia Melaka, Hang Tuah Jaya, Durian Tunggal 76100, Melaka, Malaysia
2
UNITEN R&D, Kajang 43000, Selangor, Malaysia
*
Author to whom correspondence should be addressed.
Energies 2020, 13(18), 4887; https://doi.org/10.3390/en13184887
Submission received: 30 June 2020 / Revised: 4 August 2020 / Accepted: 6 August 2020 / Published: 18 September 2020
(This article belongs to the Special Issue Modelling and Analysis of Distributed Energy Storage)

Abstract

:
The recent proliferation of residential solar photovoltaic systems has prompted several technical challenges to the operation of low voltage (LV) distribution networks. More specifically, the mismatch of the solar generation and demand profiles, particularly during the midday when the demand is low and solar generation is high, can lead to network overvoltages and increased network losses. In addition, the solar photovoltaic system is not able to reduce the system’s maximum demand, given the residential LV network would normally have an evening peak when the sun goes down. In this regard, this paper examines two different control strategies in designing the battery energy storage system. One aims to eliminate reverse flow caused by the surplus solar energy and the other aims for peak demand reduction.

1. Introduction

Over the last decade, residential rooftop photovoltaic (PV) systems have gained popularity in many countries [1]. This is mainly driven by its low upfront investment, coupled with strong government-led support schemes, such as feed-in tariffs and net metering [2,3] to achieve a low carbon future in the respective countries. The proliferation of residential solar PV is expected to continue in the years to come. However, the increasing penetration of residential PV systems has started to witness technical challenges in the low voltage distribution network, particularly overvoltages and frequent voltage fluctuations [4,5,6,7]. The residential PV system is also unable to reduce peak demand since the maximum solar output at midday does not coincide with the evening peak normally experienced by the residential household [8].
One of the promising ways to address the these issues is by utilizing an on-site battery energy storage system (BESS) in which surplus PV power can be stored locally [9]. This avoids reverse power flow occurrence when PV generation exceeds local demand. In addition, residential BESS can be controlled to achieve different aims, such as reduce peak load [10,11], mitigate the volatility of renewable energy sources [12,13], and minimize the electricity cost based on economic incentives [14]. The high costs for the integrated PV–BESS system still remain as the main barrier for adoption amongst the residential prosumer [15,16]. Nevertheless, several studies have suggested that with the advancement in the battery technology, BESS could become profitable in the future [14,17]. This stimulates interest in developing methodologies that can support the quantification of BESS benefits, and its associated technical impacts to the system under various operating strategies.
The benefits of integrated PV–BESS have been well reported in the literature, given its superior ramping speed and flexibility in managing the solar output intermittency [18]. Recent studies [19,20] examined the technical benefits of BESS without considering any network topology. Instead, simplified network models have been utilized as the test case in [14], where these idealized network models have the limitation on representing the consumers’ diversity and network characteristics adequately. In addition, a limited number of BESS studies have considered multiperiod load and PV generation profiles at the final user level. The authors in [21] proposed a control strategy to increase the penetration of solar power with proper control of BESS. The Monte Carlo simulation performed in [22] only considers a fixed time horizon of 24 h without the influence of demand diversity. An enhanced probabilistic load forecasting technique was proposed for optimal energy storage system operation; however, the authors did not consider simultaneously the presence of PV generation in their optimization model [23]. Analysis in [24] that apply annual solar irradiation data suggests that the output from the solar PV system is highly uncertain and able to be broadly categorized into five variability days. Averaging the multiday PV profiles into a typical PV profile for a case study may underestimate the BESS capacity requirement. Thus, considering the wide spectrum of PV variability is of paramount importance in designing the BESS system. Furthermore, it is also worth noting that none of these papers consider the concept of battery-autonomy days in determining the optimal BESS capacity. This is important as the solar PV generation varies in consecutive days. This phenomenon is particularly acute for tropical countries that experience frequent cloud passing. This will result the state of charge (SoC) of the BESS system, which will vary significantly over the days.
In light of this, the BESS design approach developed in this paper is based on the real residential low voltage (LV) distribution network in Malaysia [8]. Moreover, the residential PV system’s rating is based on the actual PV installation statistics as provided by the Sustainable Energy Development Authority (SEDA) Malaysia [25]. More importantly, each house is assigned with an individual load profile with actual annual solar generation profiles. This allows the PV–BESS studies to be carried out more realistically, as compared to the abovementioned papers, which only consider a simplistic network model with daily or weekly profiles.
An optimal operation of centralized control of battery energy storage in low voltage networks with a few hundred nodes is computationally infeasible [19]. This is because the optimization problem becomes too complex to be solved efficiently. Furthermore, these centralized control strategies would normally require advanced communication infrastructure at the LV distribution substation or end user level, which is scarcely available nowadays. Hence, this paper proposes the design of a BESS system with two practical operation strategies for a typical residential LV network in Malaysia. The first strategy aims to effectively avoid the occurrence of reverse power flow incident at an LV distribution substation when the solar output is higher than the aggregated demand, thus eliminating the adverse impacts of reverse power flow on the operation of the distribution network. The second strategy utilizes all of the generated solar energy to minimize the maximum demand at the substation level. Subsequently, both strategies were evaluated and compared in terms of the required BESS power and energy ratings, maximum demand reduction, and the smoothness of the load profiles. It is also worth noting that annual demand and generation profiles were considered in this paper.
The paper is organized as follows. Section 2 presents the modeling approach for a low voltage distribution network, as well as the associated demand and solar profiles. The formulation of battery control strategies is presented in Section 3. Section 4 provides the results with detailed discussion, followed by concluding remarks in Section 5.

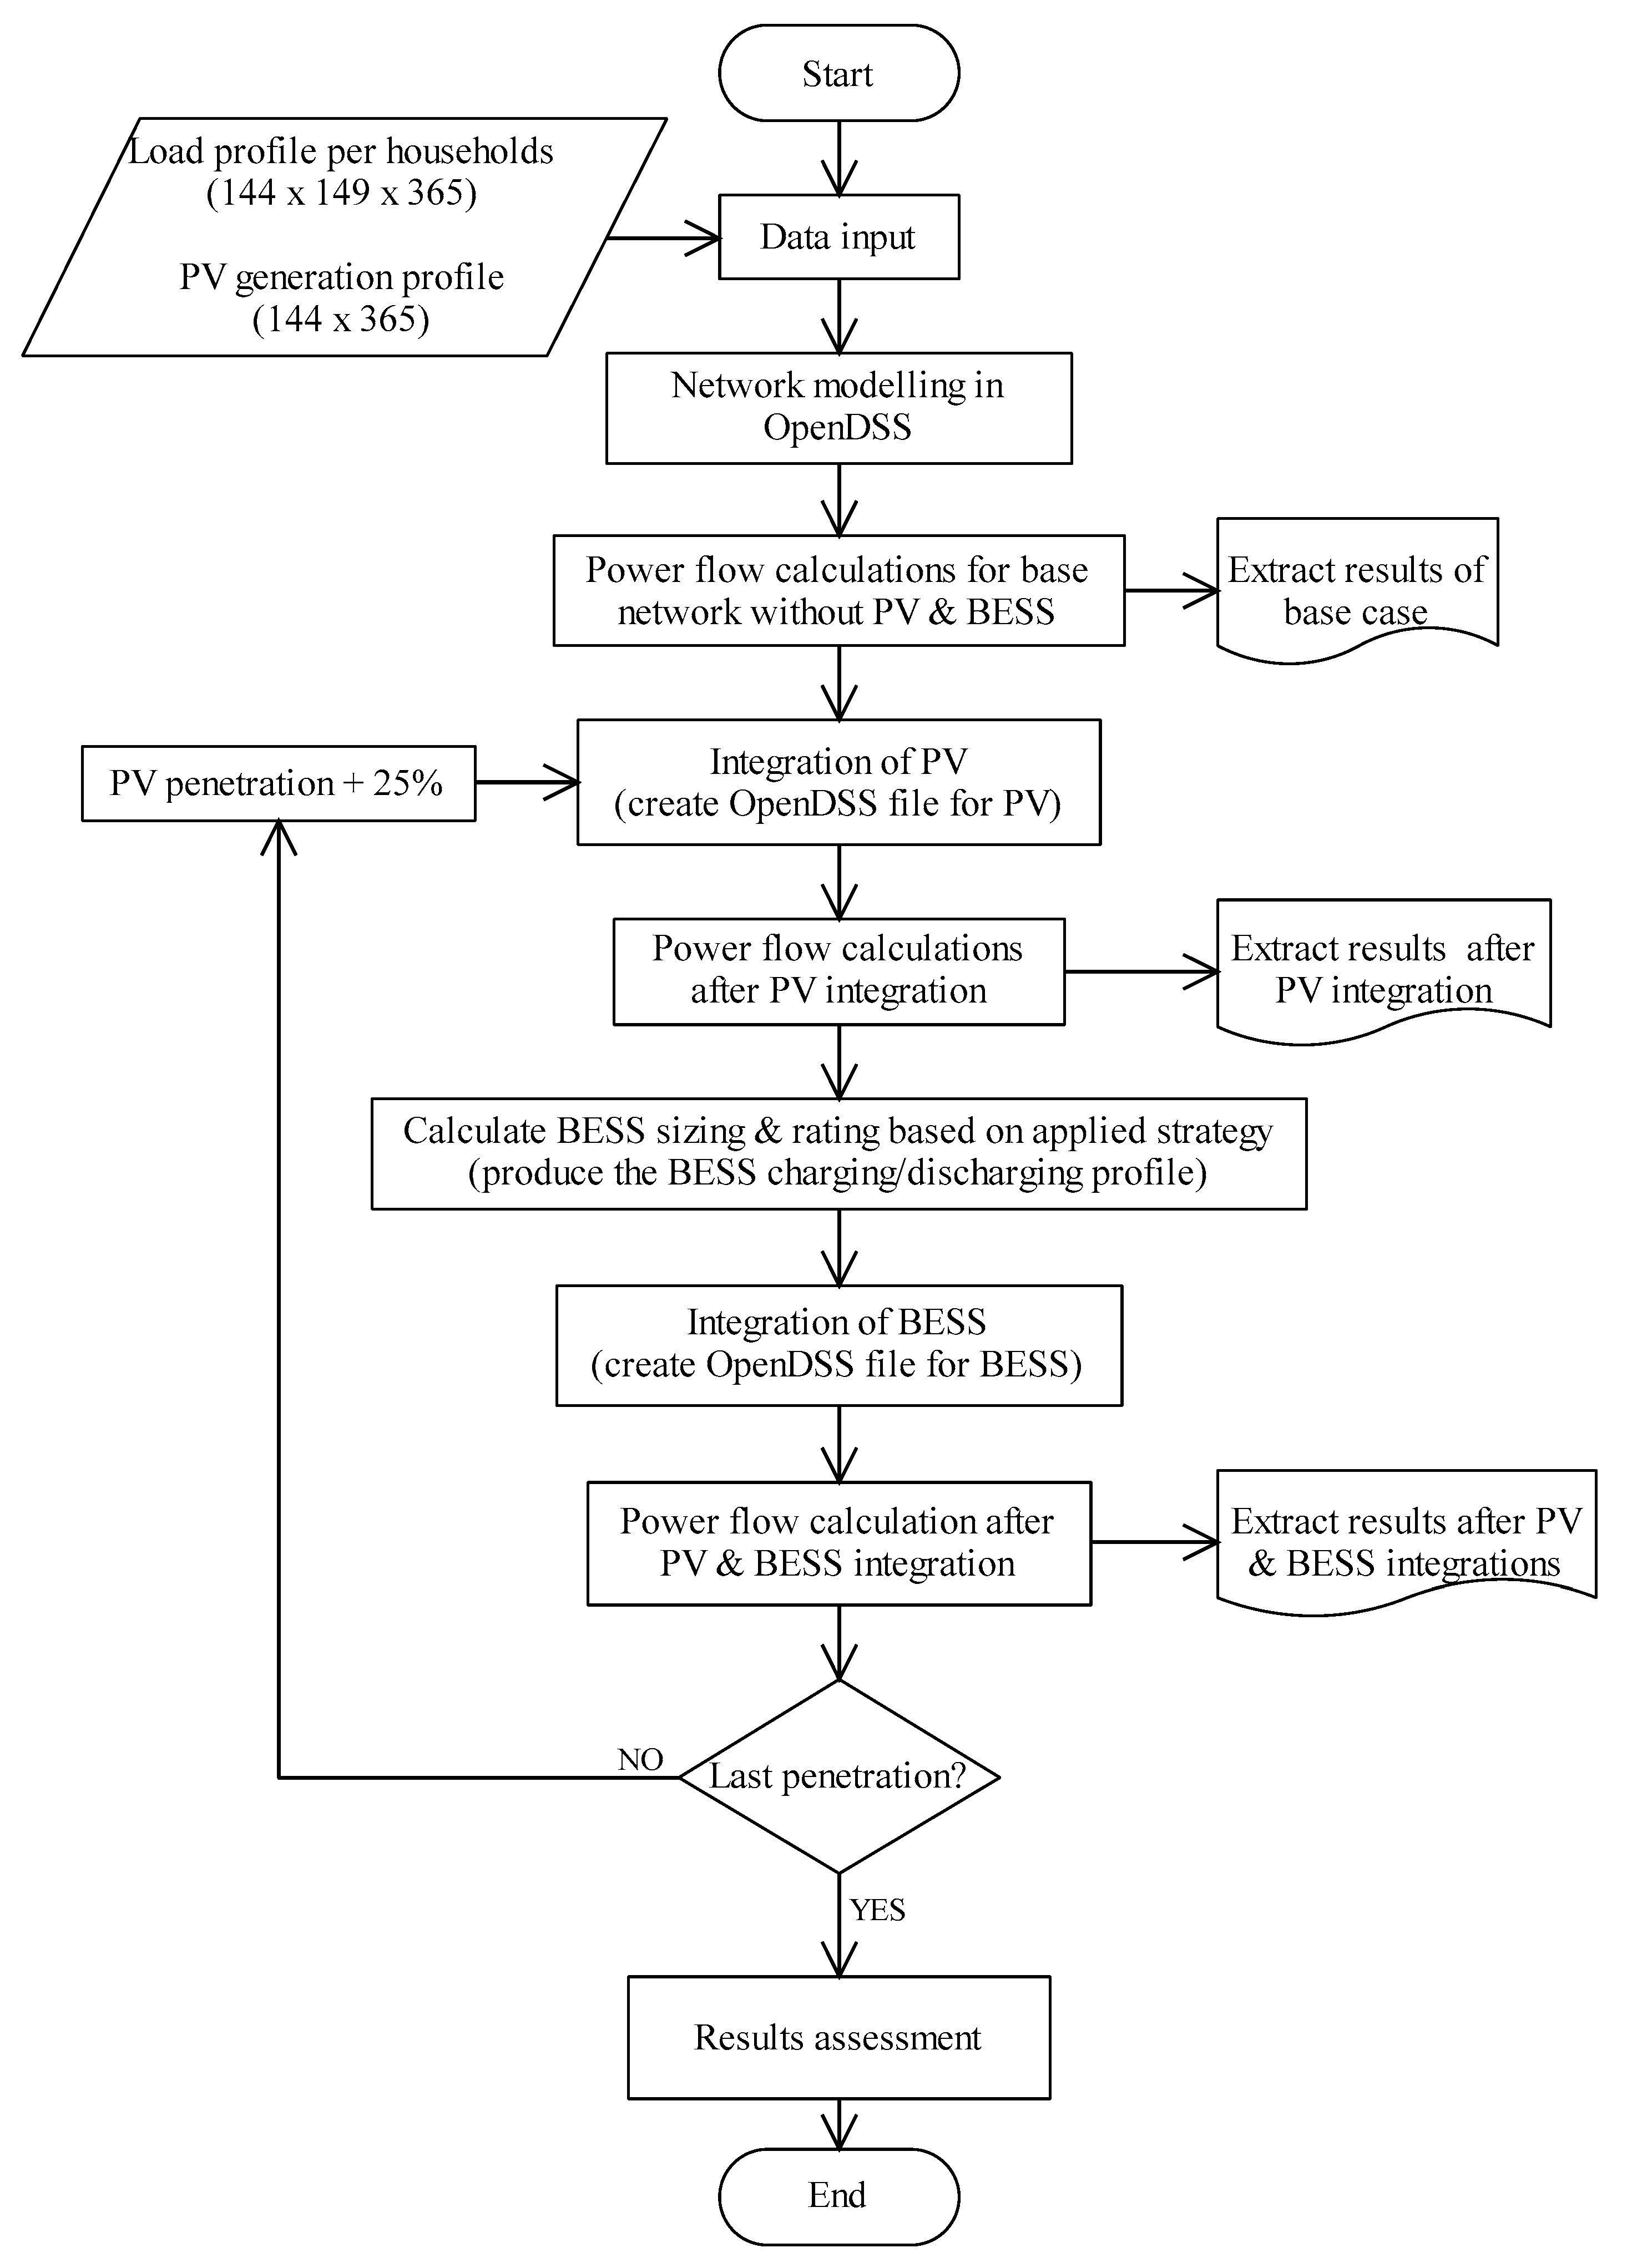
2. System Modeling and Analysis

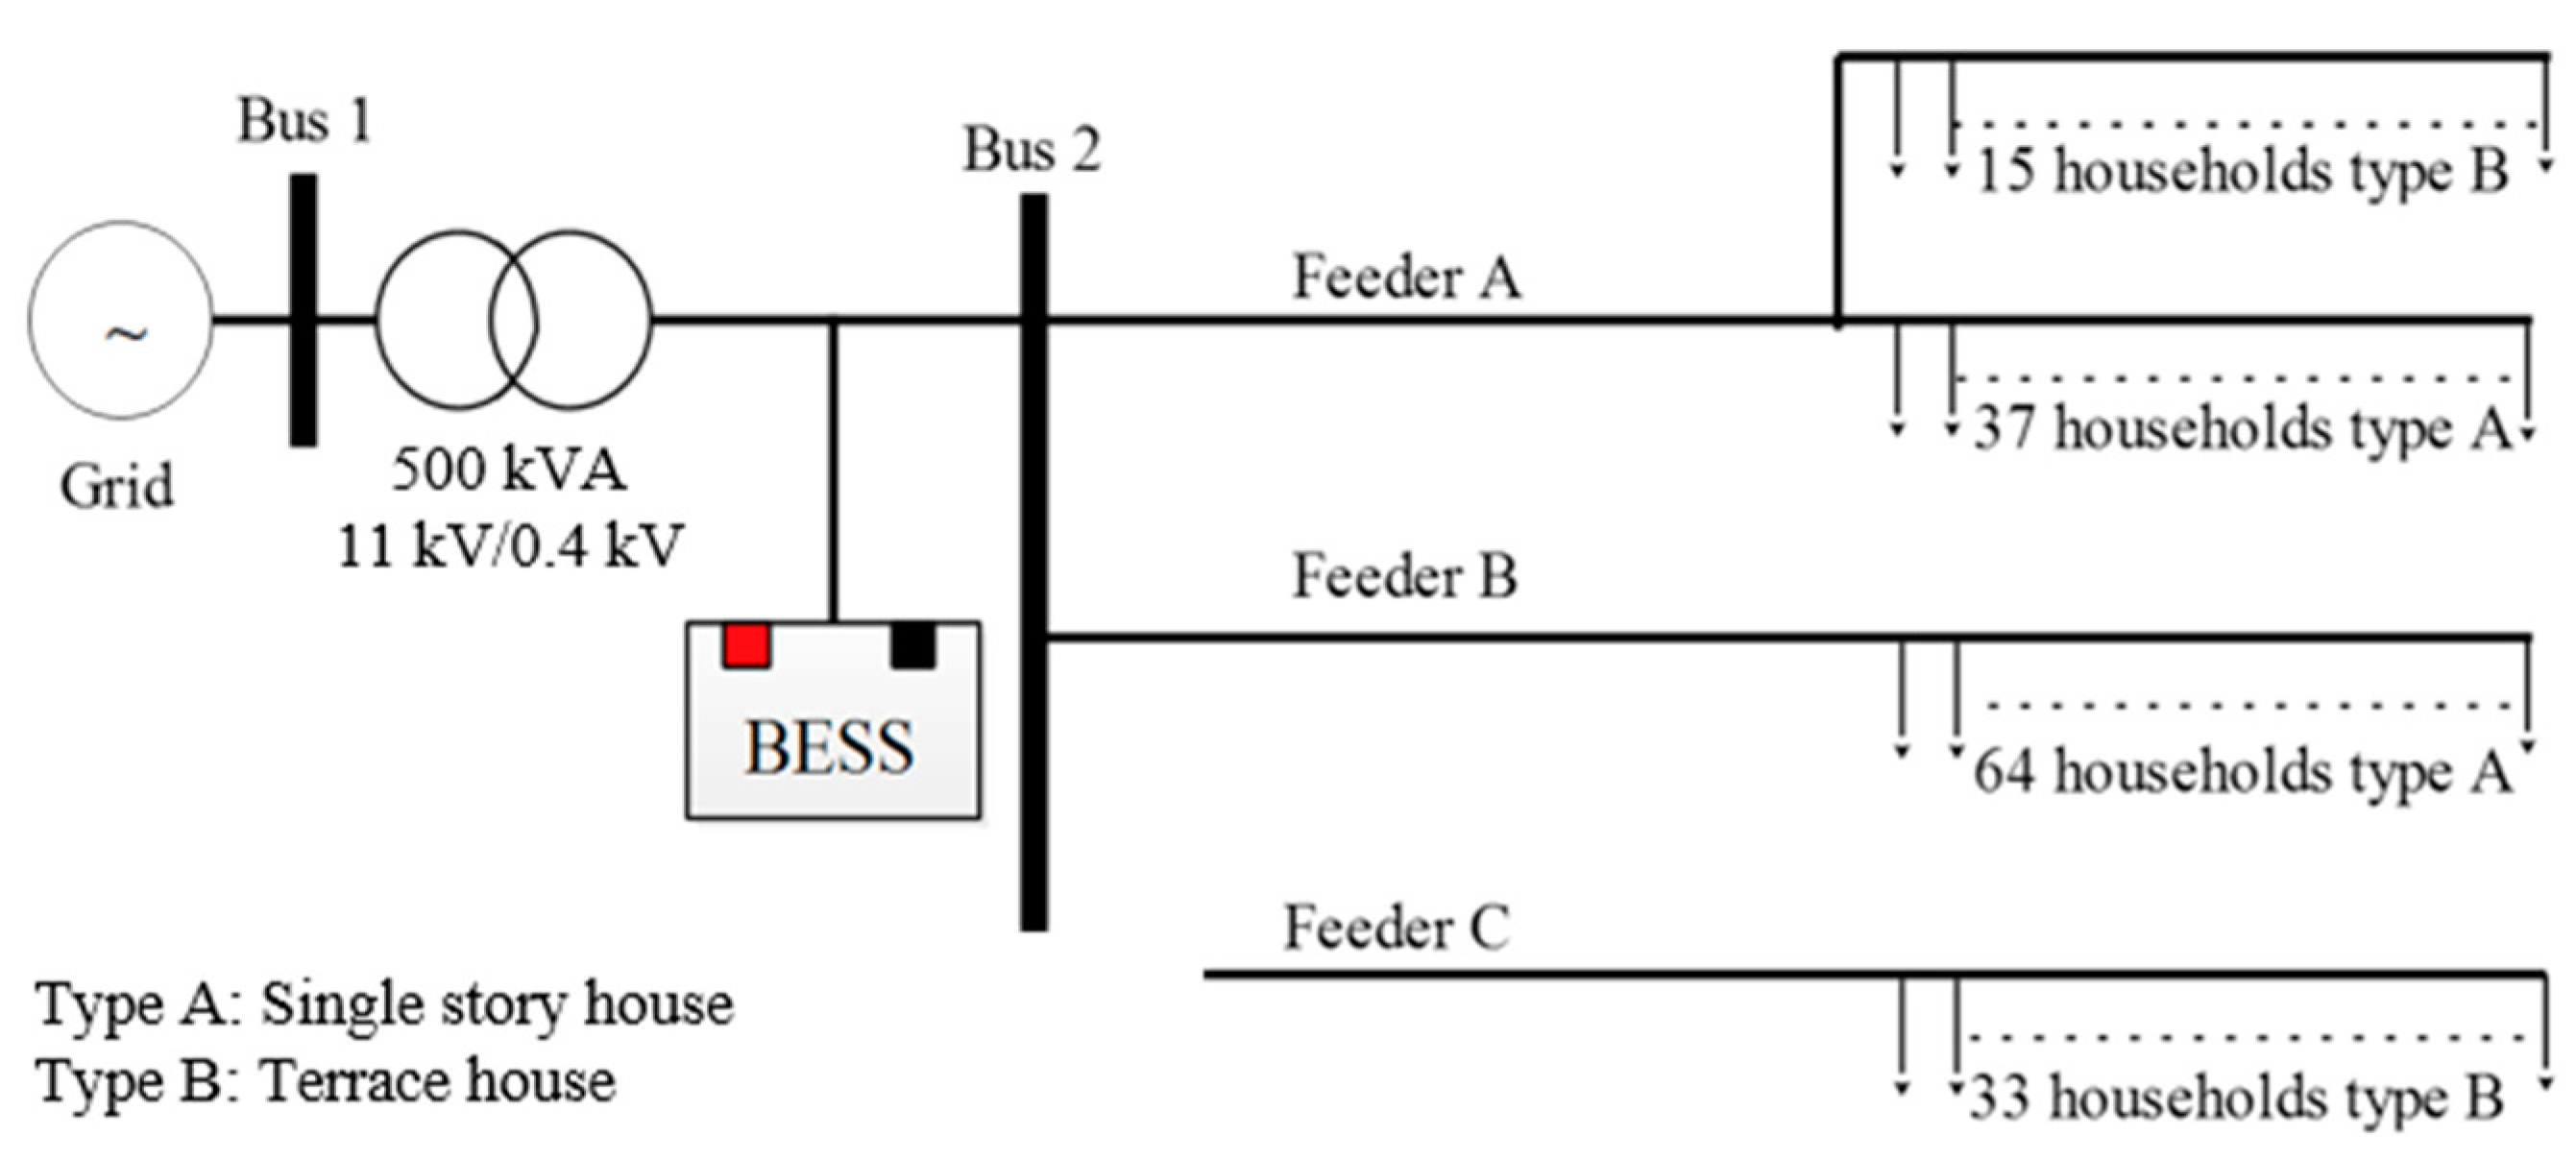
2.1. Network Modeling

This paper focuses on LV network integration with solar PV and a BESS system. A typical residential area in Malaysia, called Taman Impian Putra and located at Port Dickson, was considered as the reference LV network in this work, as shown in Figure 1. The network data were obtained from the local power utility, TNB [8]. Table 1 and Table 2 show the types of cable used and the loading among the distribution feeders. An open distribution system simulator (OpenDSS) was utilized in this work for the network modeling that considers the self-impedance, neutral wire, and mutual impedance of the network. The network is supplied by three main LV feeders with a distribution transformer (11 kV/0.4 kV) rated at 500 kVA with a different number of residential houses. As identified from the site visit, two types of houses were considered, terrace and single story, with after-diversity maximum demand (ADMD) of 3 kW and 1.5 kW, respectively [26]. Previous study that utilized a similar LV distribution network as shown in Figure 1 suggested no voltage violation issues to the network even with 200% of solar PV penetration, driven by the high cable rating used and relatively short feeder. In this regard, voltage violation is assumed not to be a primary concern for this study.
The proposed BESS system will be centrally installed at the LV substation level, as shown in Figure 1. In this regard, only a central controller is needed to manage the charging and discharging strategies of the BESS system. The battery management system can utilize the historical aggregated load profile, as seen from the substation side for peak load reduction strategy. A monitoring device can be installed to detect the occurrence of reverse power flow and subsequently trigger the BESS charging operation. The requirement of communication infrastructure for this centrally managed BESS is much lower compared to the distributed BESS system.

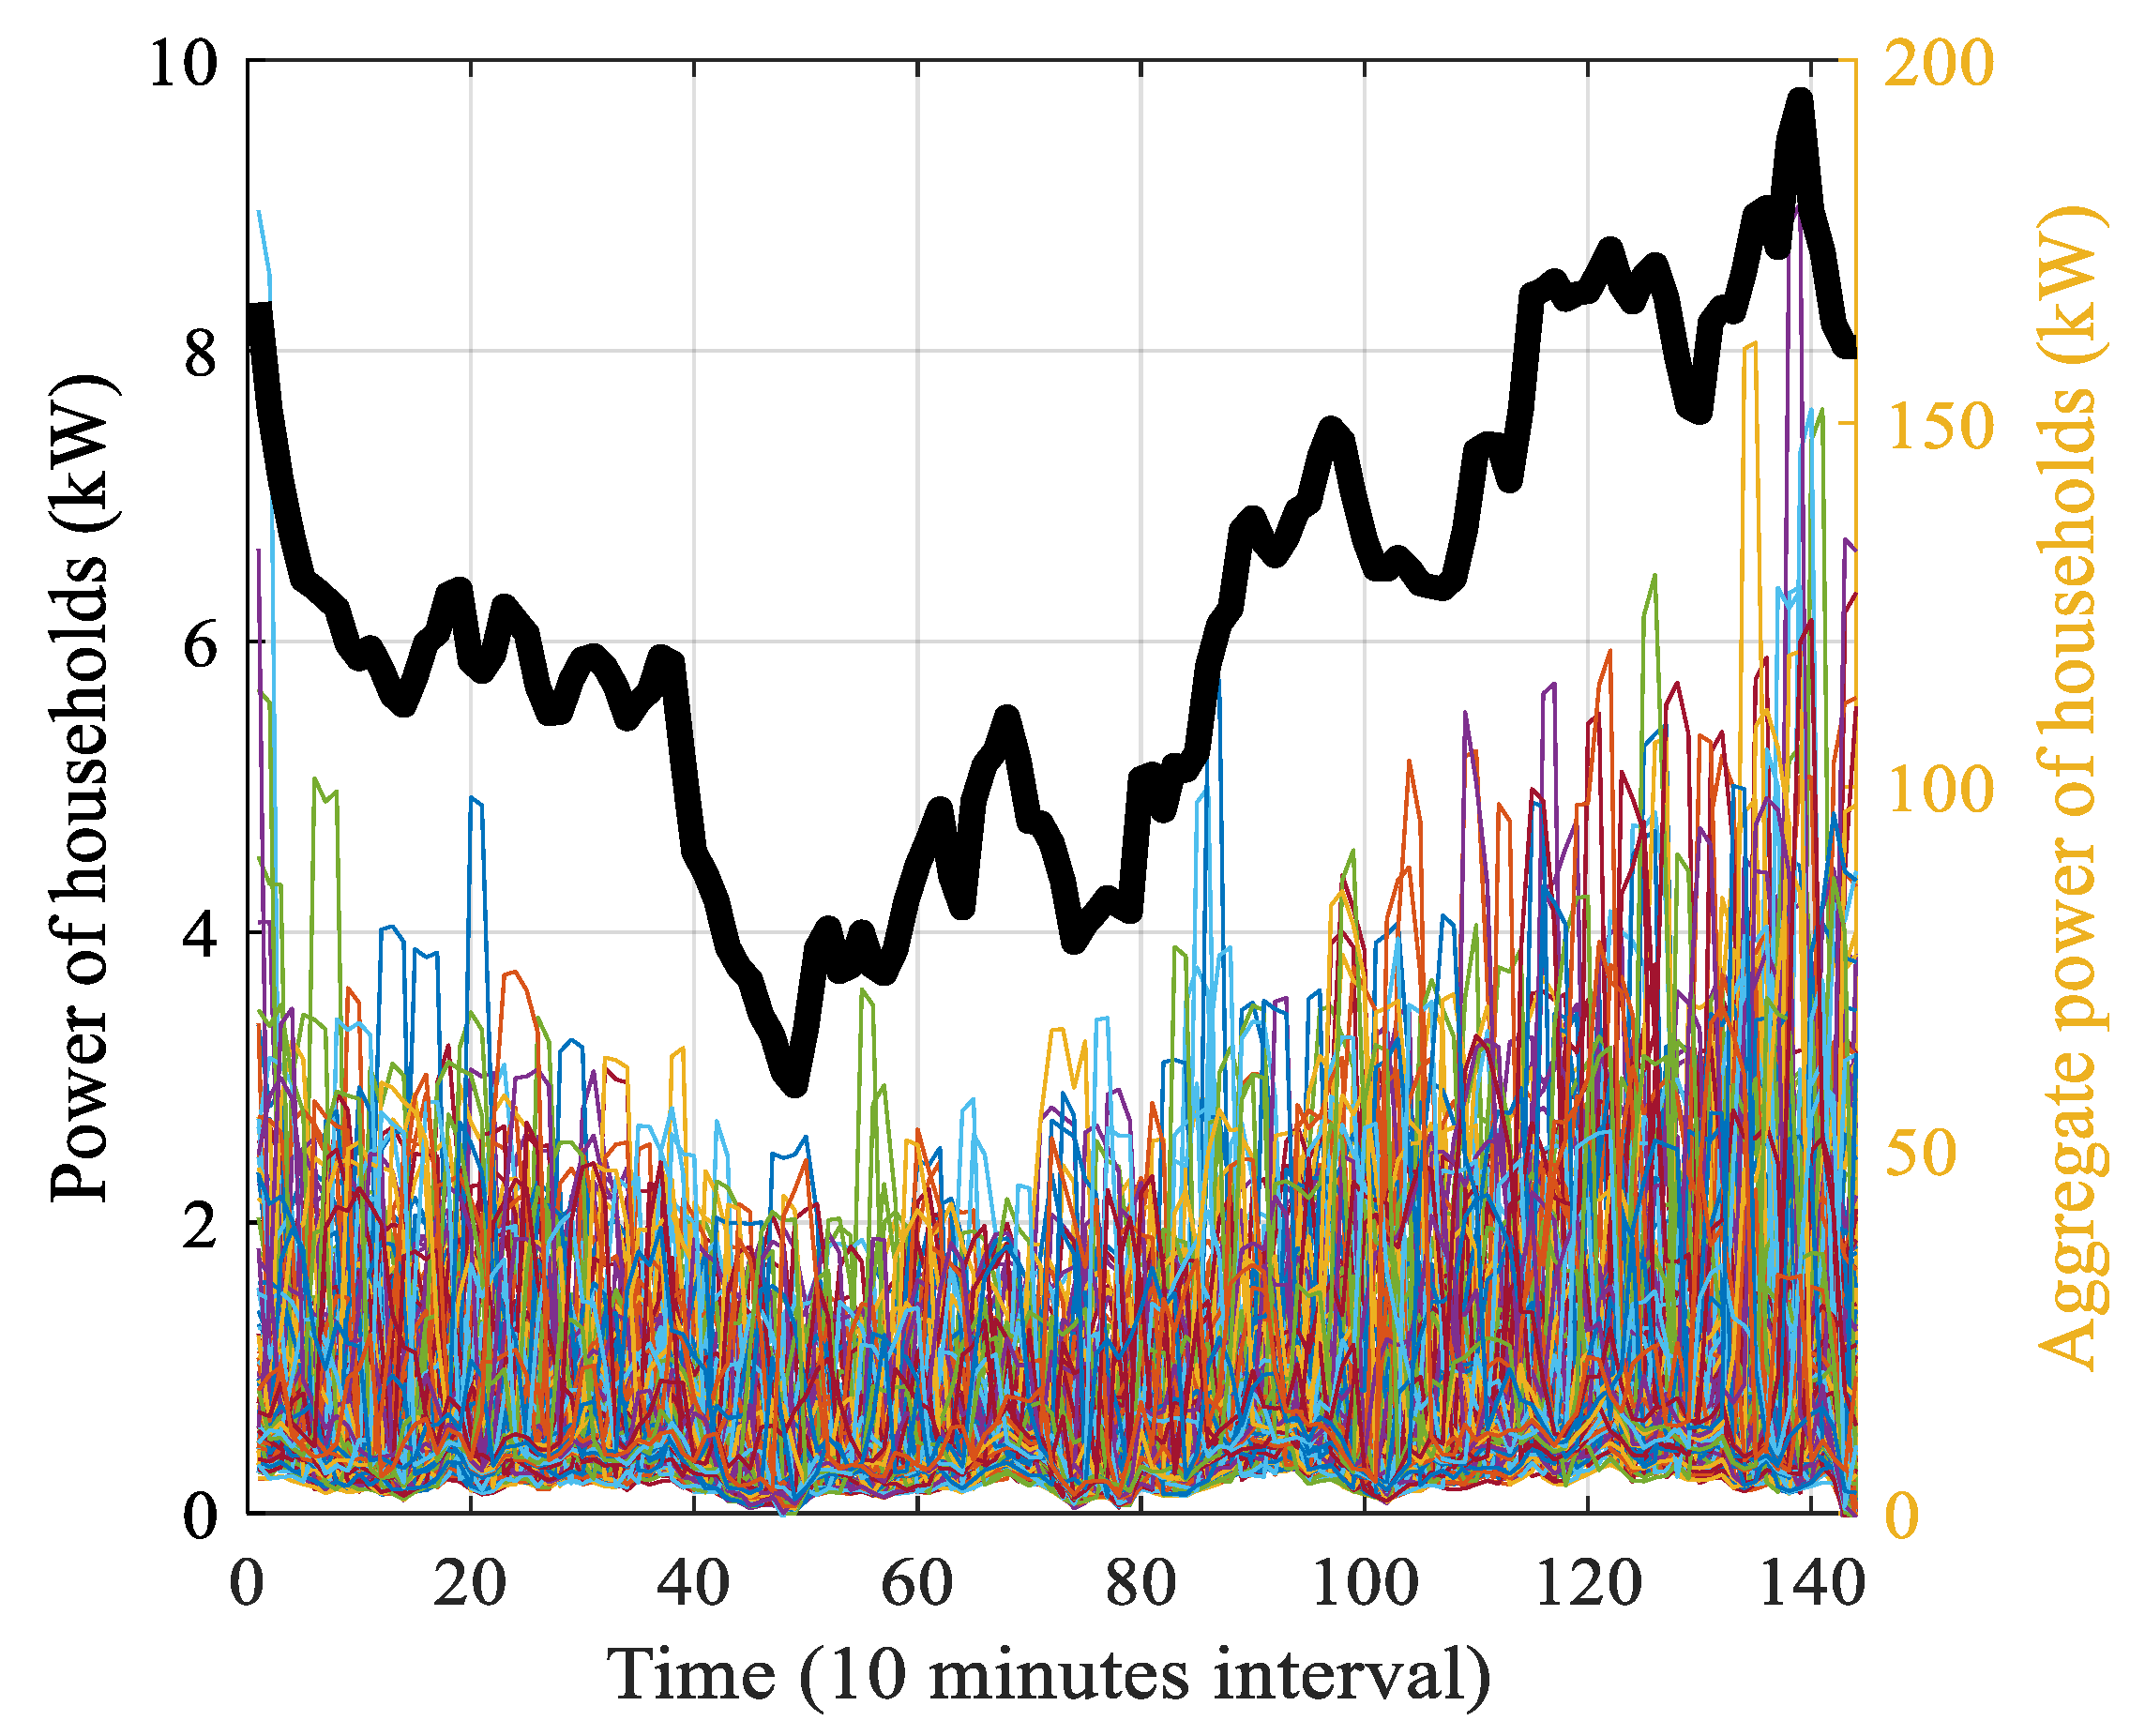
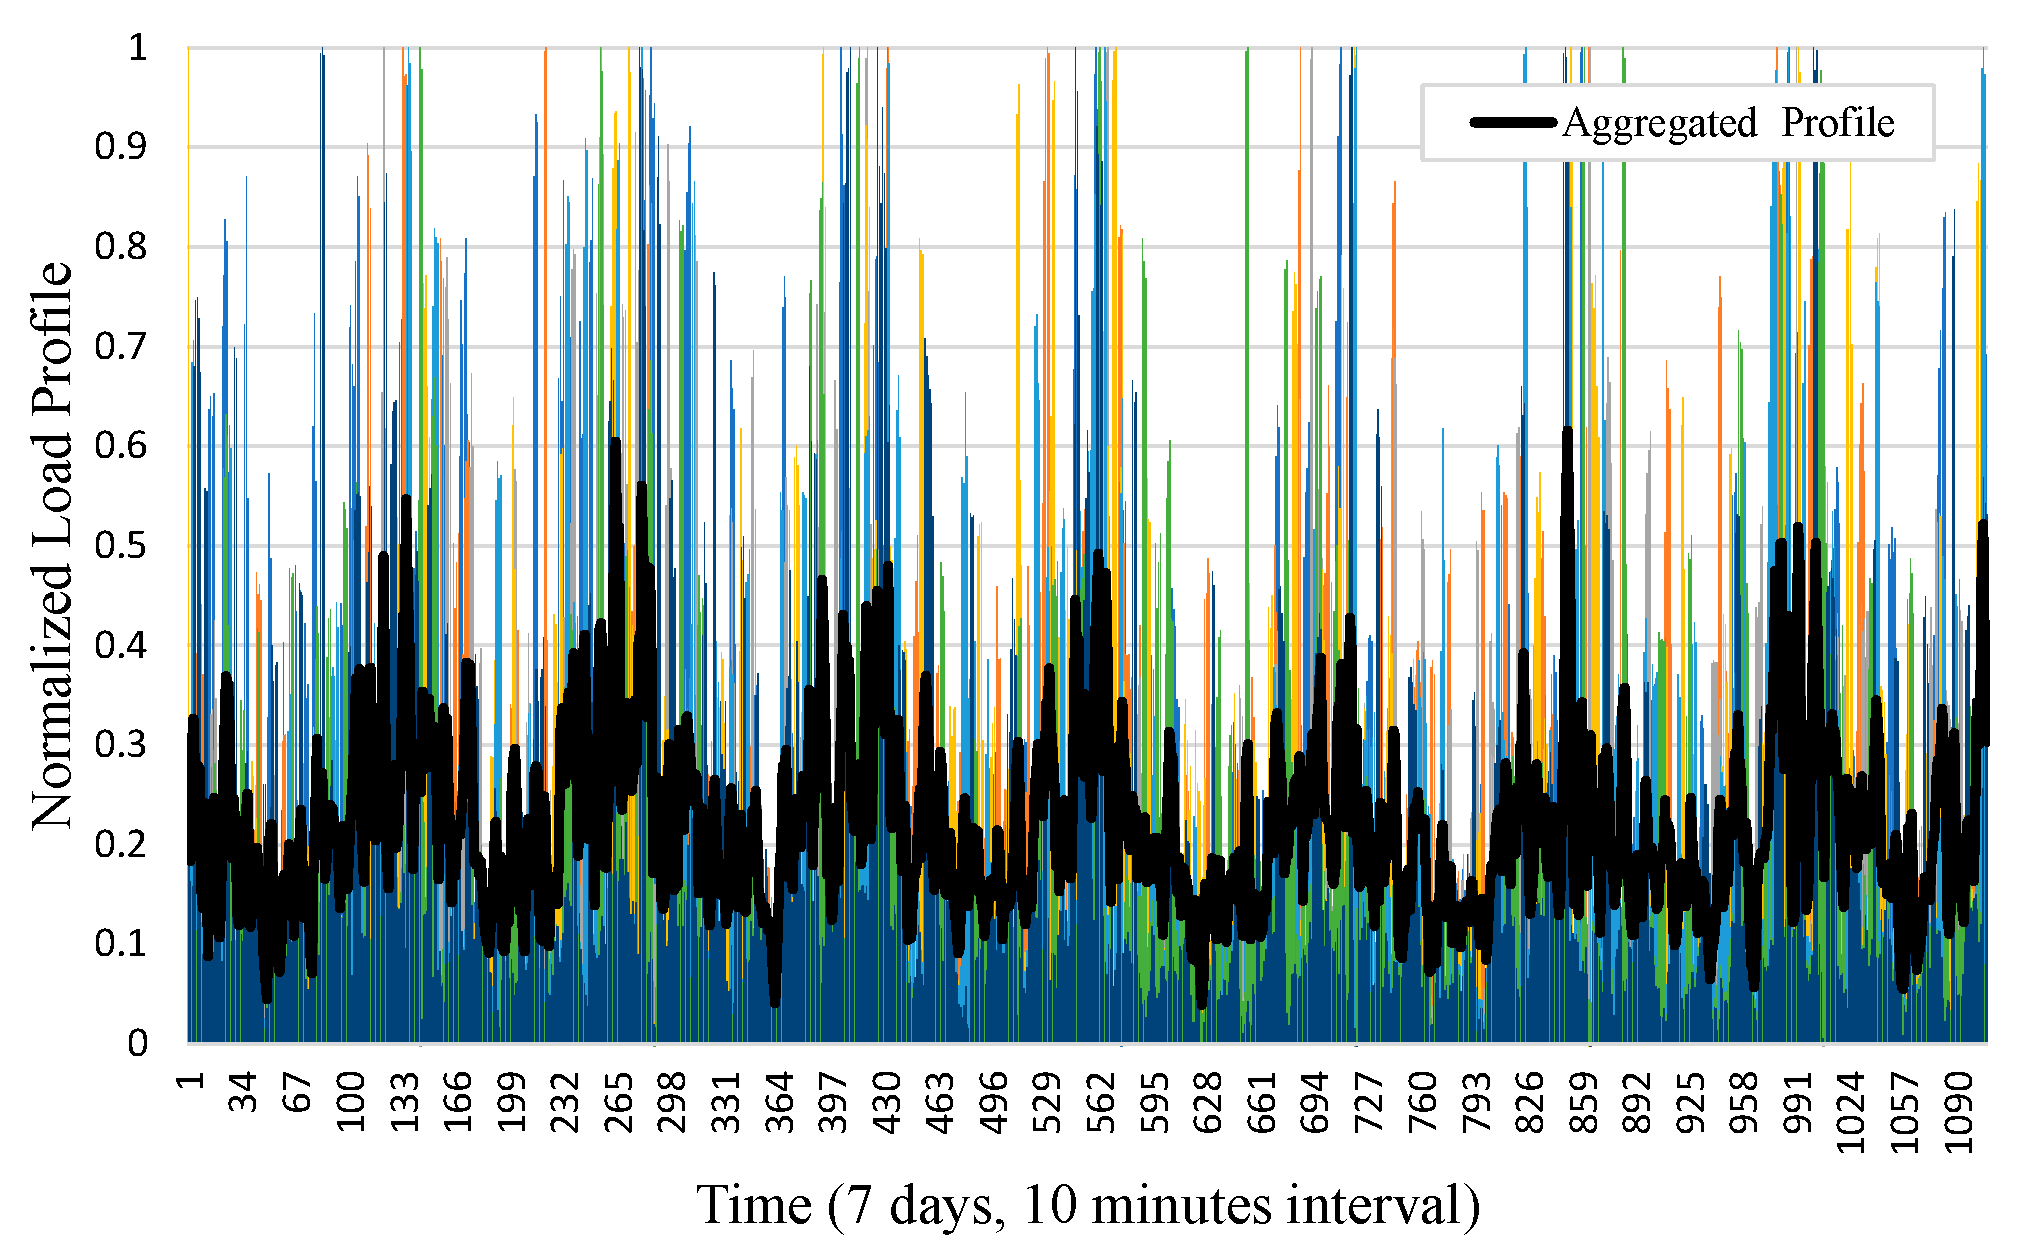
2.2. Consumer Demand Profile and Modeling

The typical aggregated residential load profile in Malaysia that was utilized in previous studies [27] was utilized in this paper. The load profile as shown in Figure 2 is an aggregated residential profile of 149 Malaysian households that was generated in ten minute intervals for a day (144 min). The individual load profiles are generated by utilizing the approach that was presented in previous work [27]. Figure 3 shows the individual and aggregated household load profiles for seven consecutive days. The load profiles were saved in a TEXT file for OpenDSS LV load-shape modeling. A power factor of 0.95 was assumed for all case studies. The aggregated load profiles and energy consumption of the houses can be written as Equations (1)–(3), as follows:
P A g r e g a t e d ( t ) = i = 1 n h P i ( t )           i { 1 , 2 , , 149 } , n h = 149
E A g r e g a t e d ( d ) = t = 1 n t p s P A g r e g a t e d ( t ) ( n p t s / 24 )         t { 1 , 2 , , 144 }    ,     n t p s = 144
E T o t a l = d = 1 n d E A g r e g a t e d ( d )         n d { 1 , 2 , , 365 }

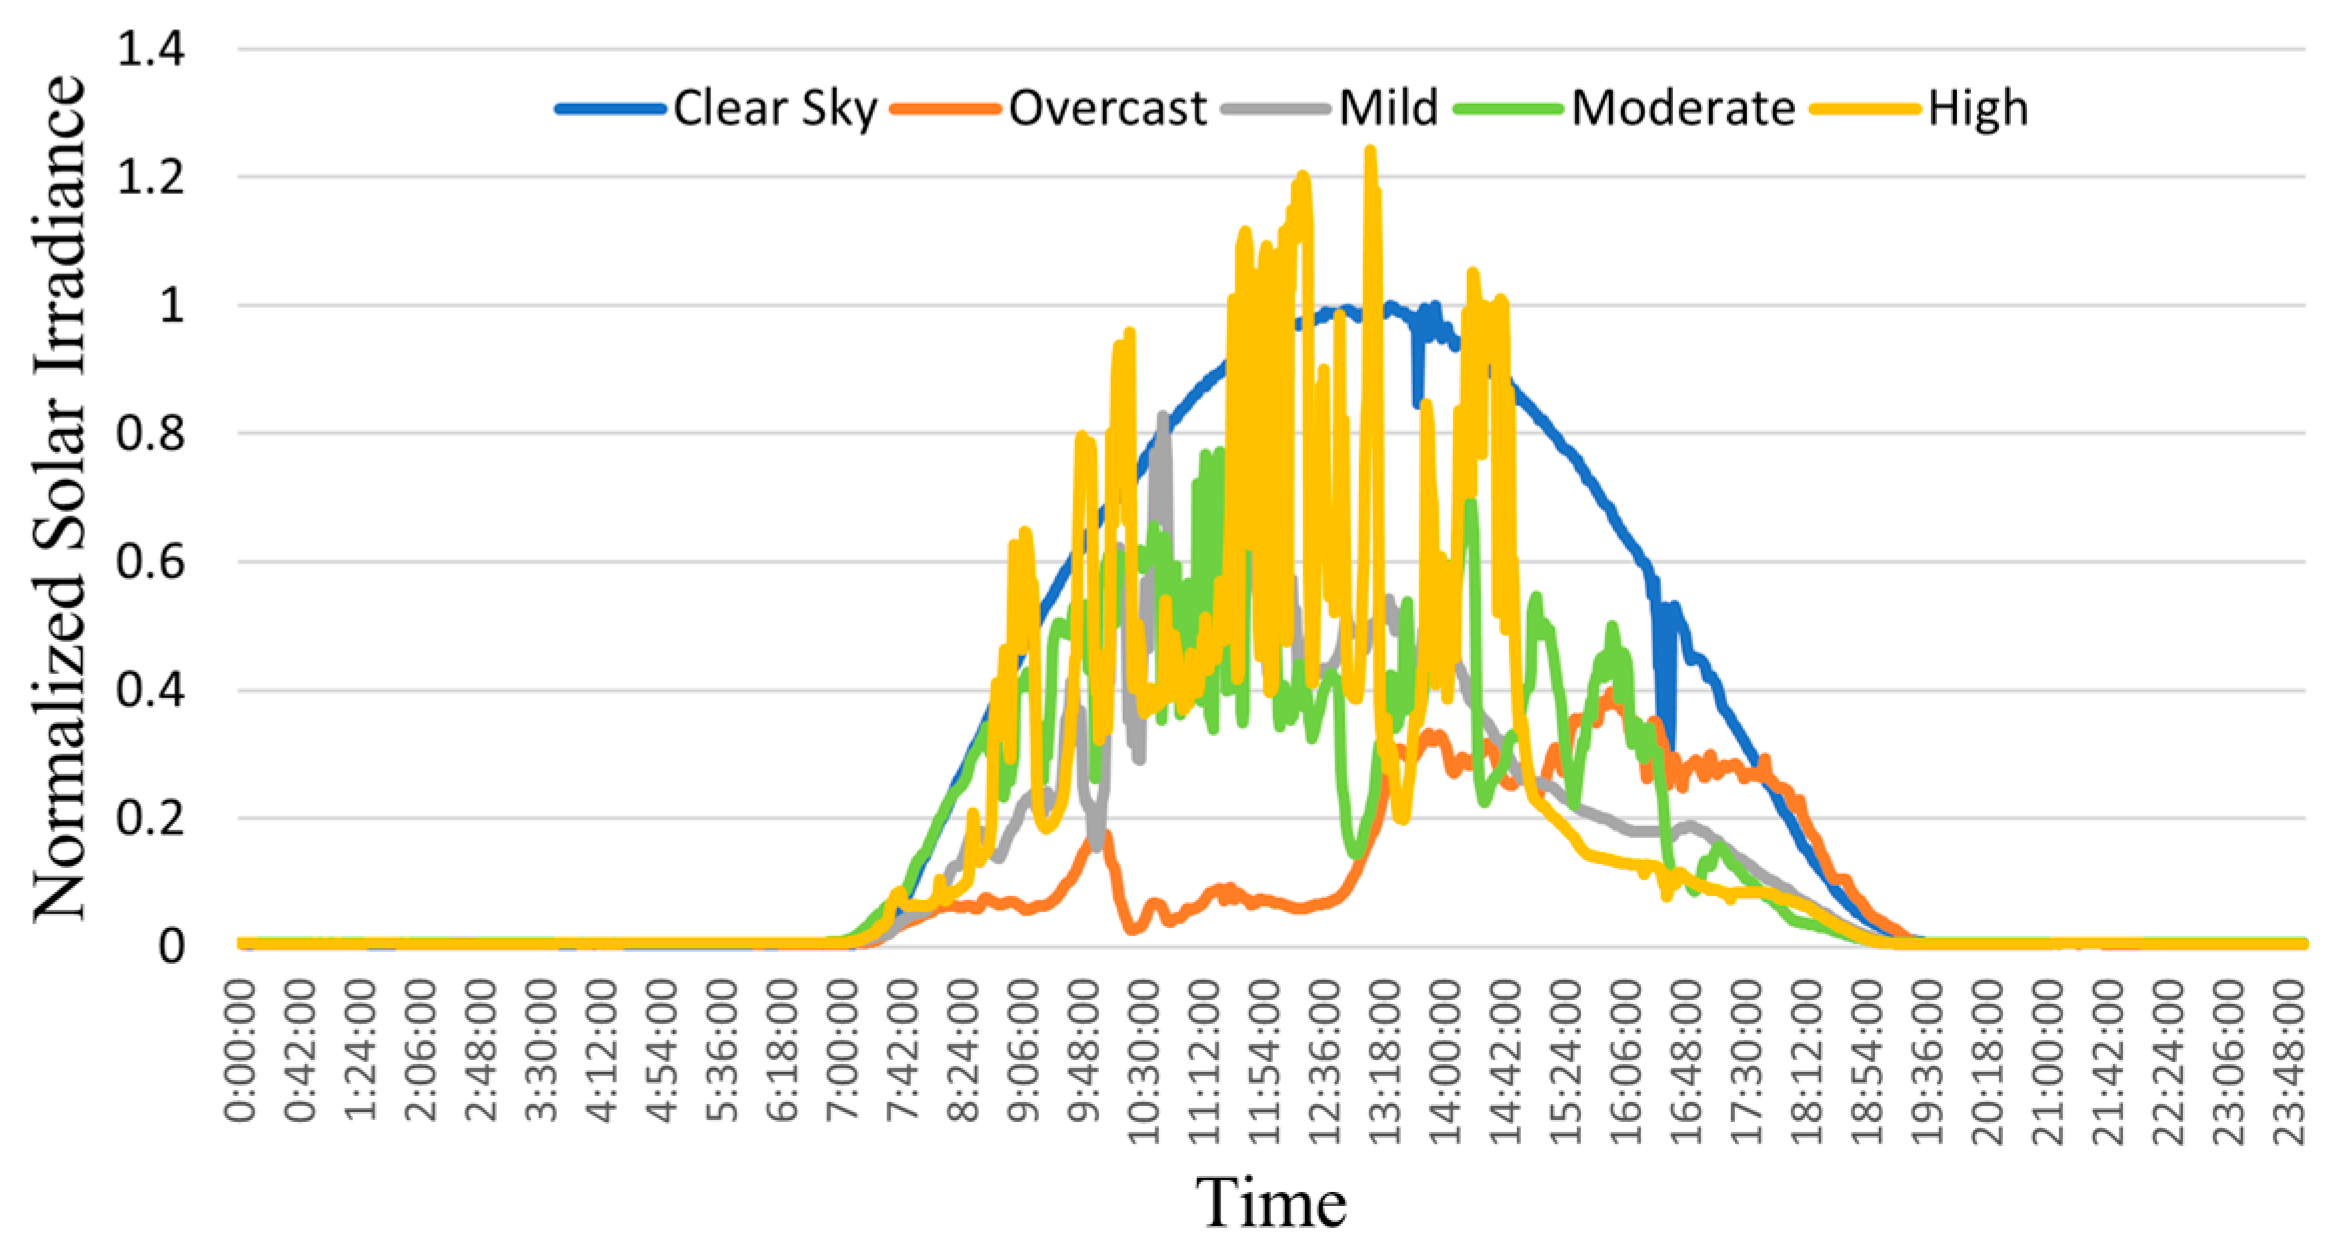
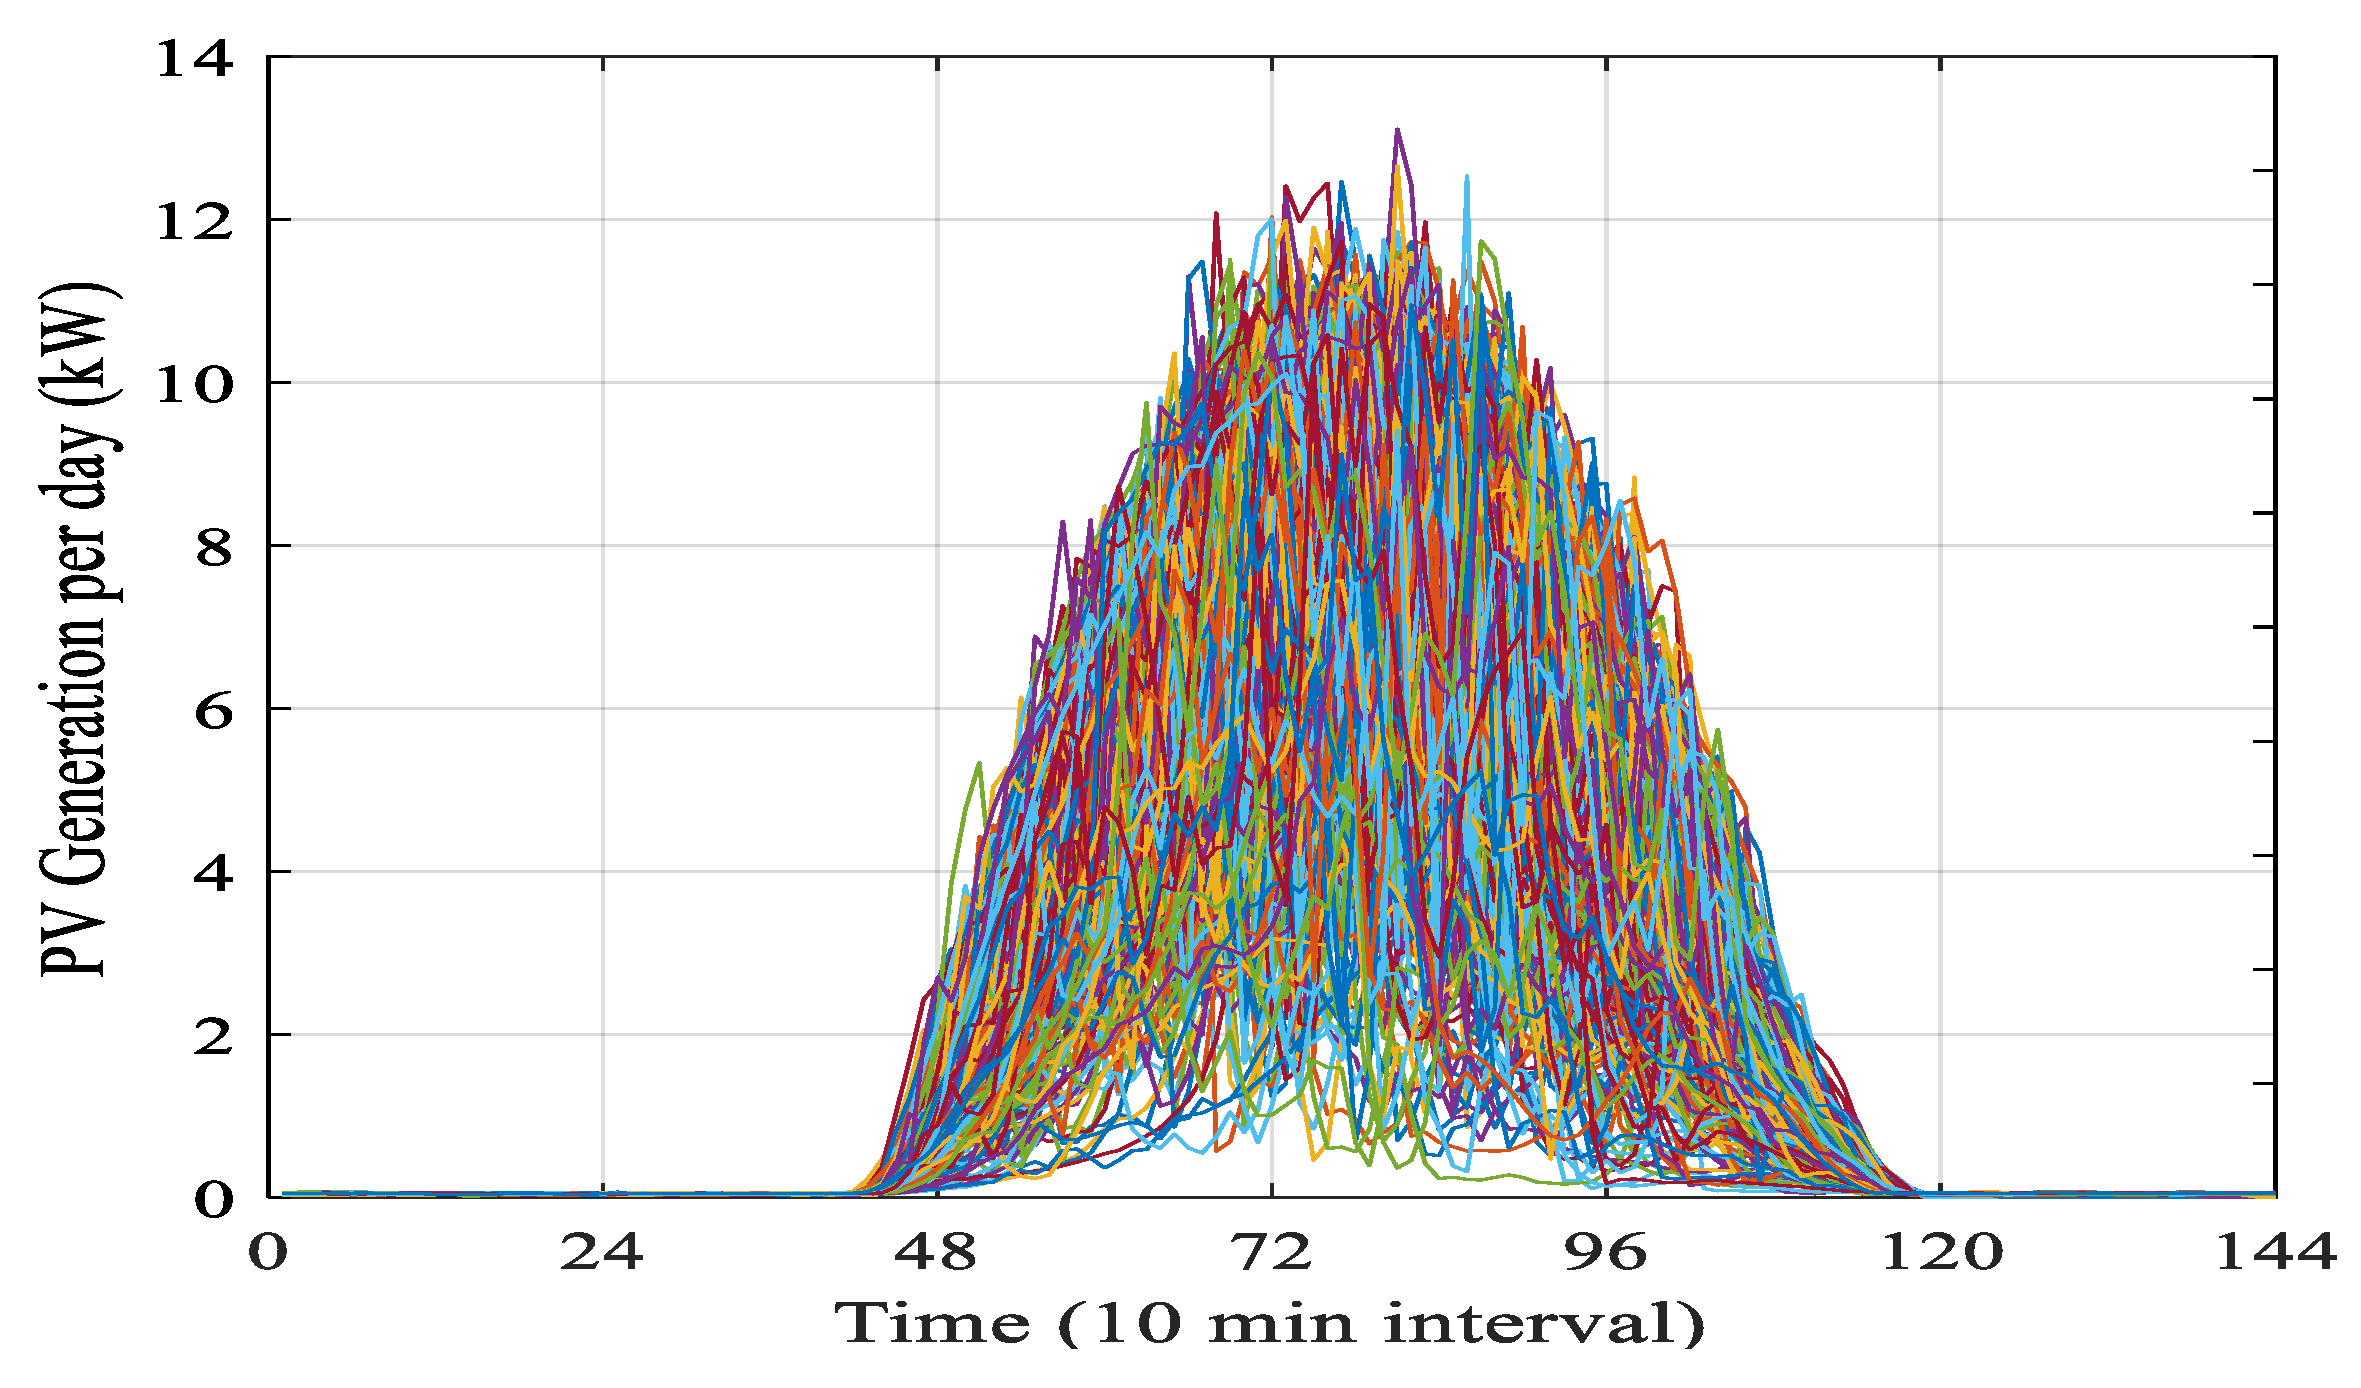
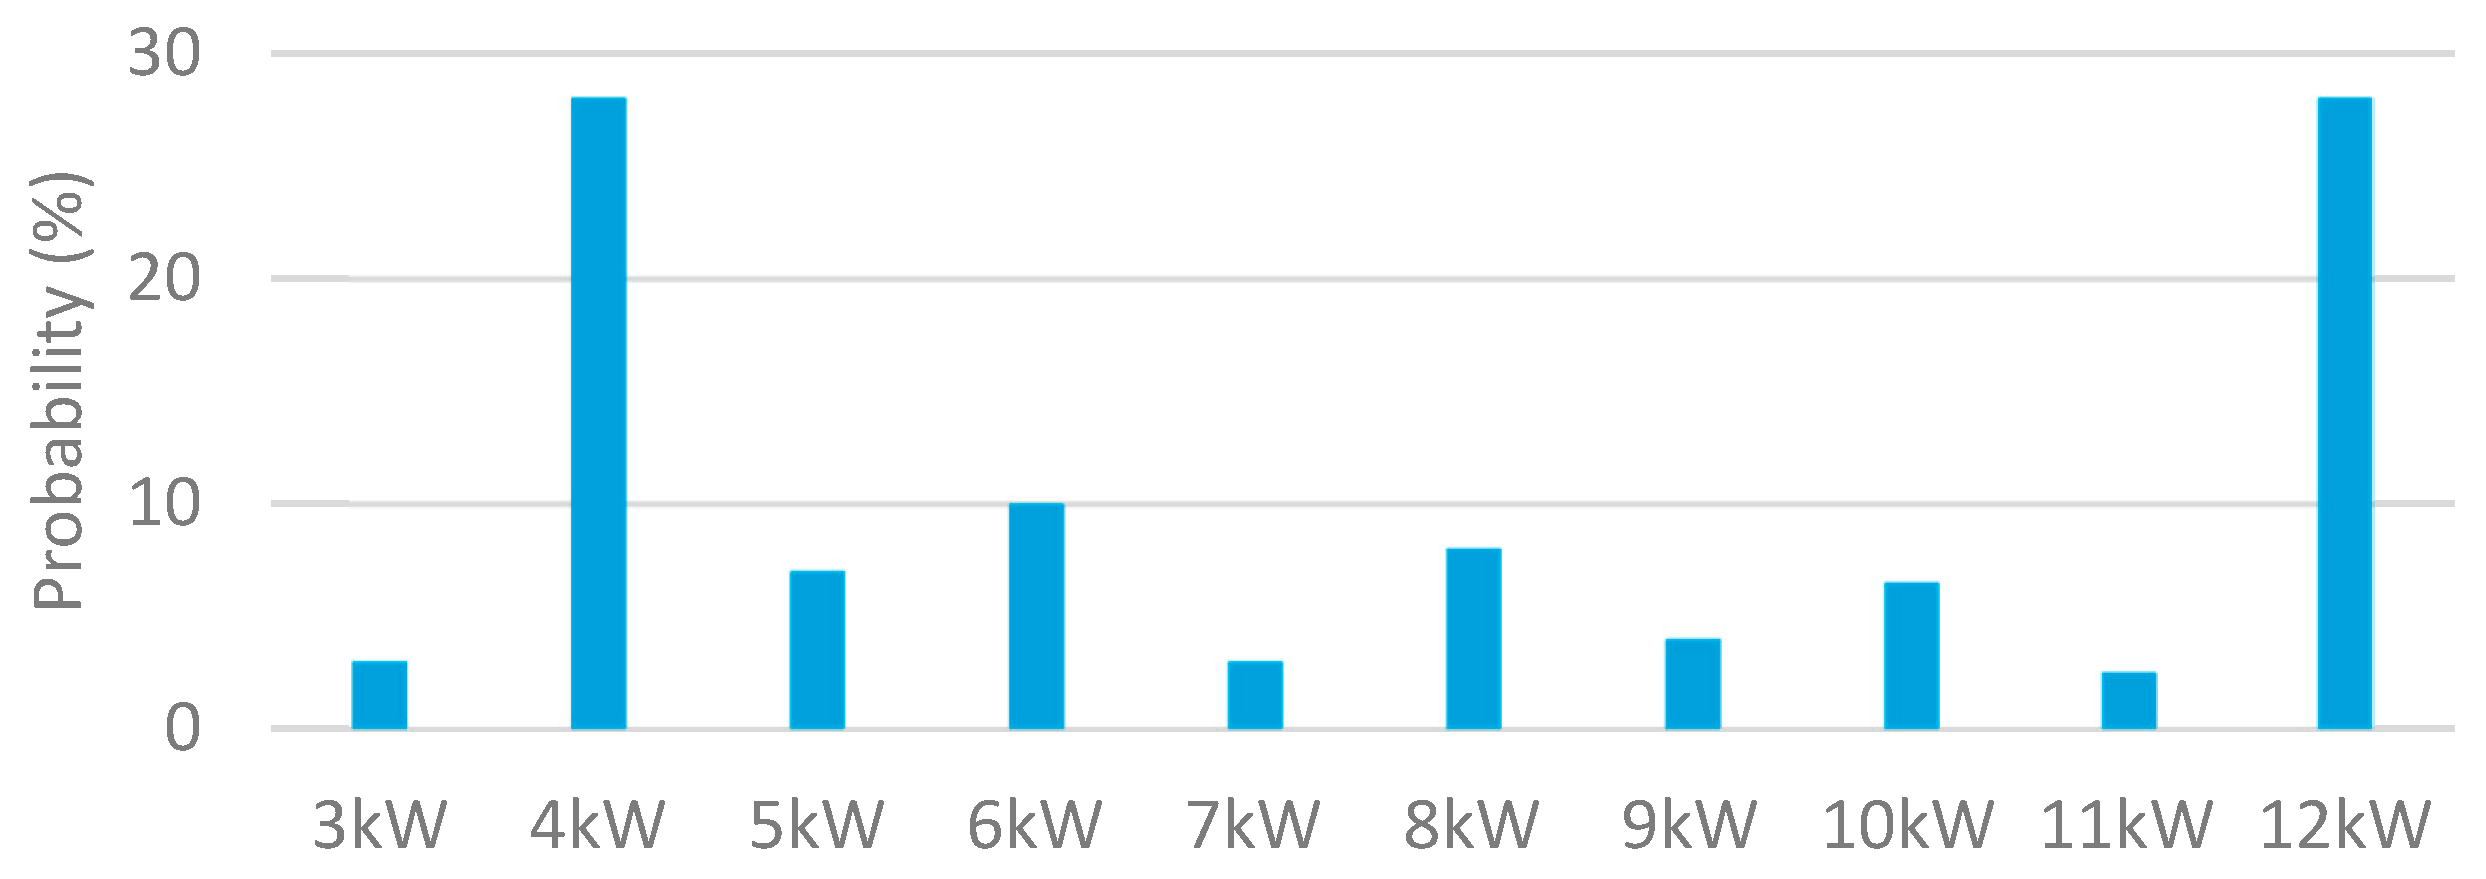
2.3. Solar Variability Profiles and Modeling

There are five different types of PV profiles that might happen based on Malaysia’s weather conditions, based on the recorded and analyzed site data [24,28]. The authors clustered the data sets of a year as clear day, overcast day, moderate variability, mild variability, and high variability. In order to have proper design for BESS, the whole probability of weather conditions needs to be considered. Therefore, this paper utilizes the yearly PV profile data sets that were extracted from a weather station located on the rooftop of the Faculty of Electrical Engineering, Universiti Teknikal Malaysia Melaka, UTeM (2.32° N, 102.3° E). The PV generation data are real data that were recorded from the solar inverter’s AC output data, located in the UTeM’s Solar PV System and Smart Grid Research Laboratory. Figure 4 shows the PV generation profile with a five minute interval for five different solar variability types recorded during the year 2016. Meanwhile, the aggregated PV generation profile of the houses that can be seen from the transformer side is written as Equations (4)–(6). The PV generation profiles captured for 365 days of the year 2016 are shown in Figure 5.
P V A g r e g a t e d ( t ) = i = 1 n h P V i ( t )              , P V A g r e g a t e d 0
P V E A g r e g a t e d ( d ) = t = 1 n t p s P V A g r e g a t e d ( t ) ( n p t s / 24 )
P V E T o t a l = d = 1 n d P V E A g r e g a t e d ( d )
The PV system was modeled in OpenDSS as a grid-tied PV system. The data of PV generation profiles were recorded and saved in a txt file, which served as the input data for the PV system installed. The capacity of the PV system installed for each house was assigned randomly based on the statistics obtained from the Sustainable Energy Development Authority (SEDA) Malaysia. Figure 6 shows that the two highest residential PV system capacities installed in Malaysia are 4 and 12 kWp, respectively, followed by 6 and 8 kWp.

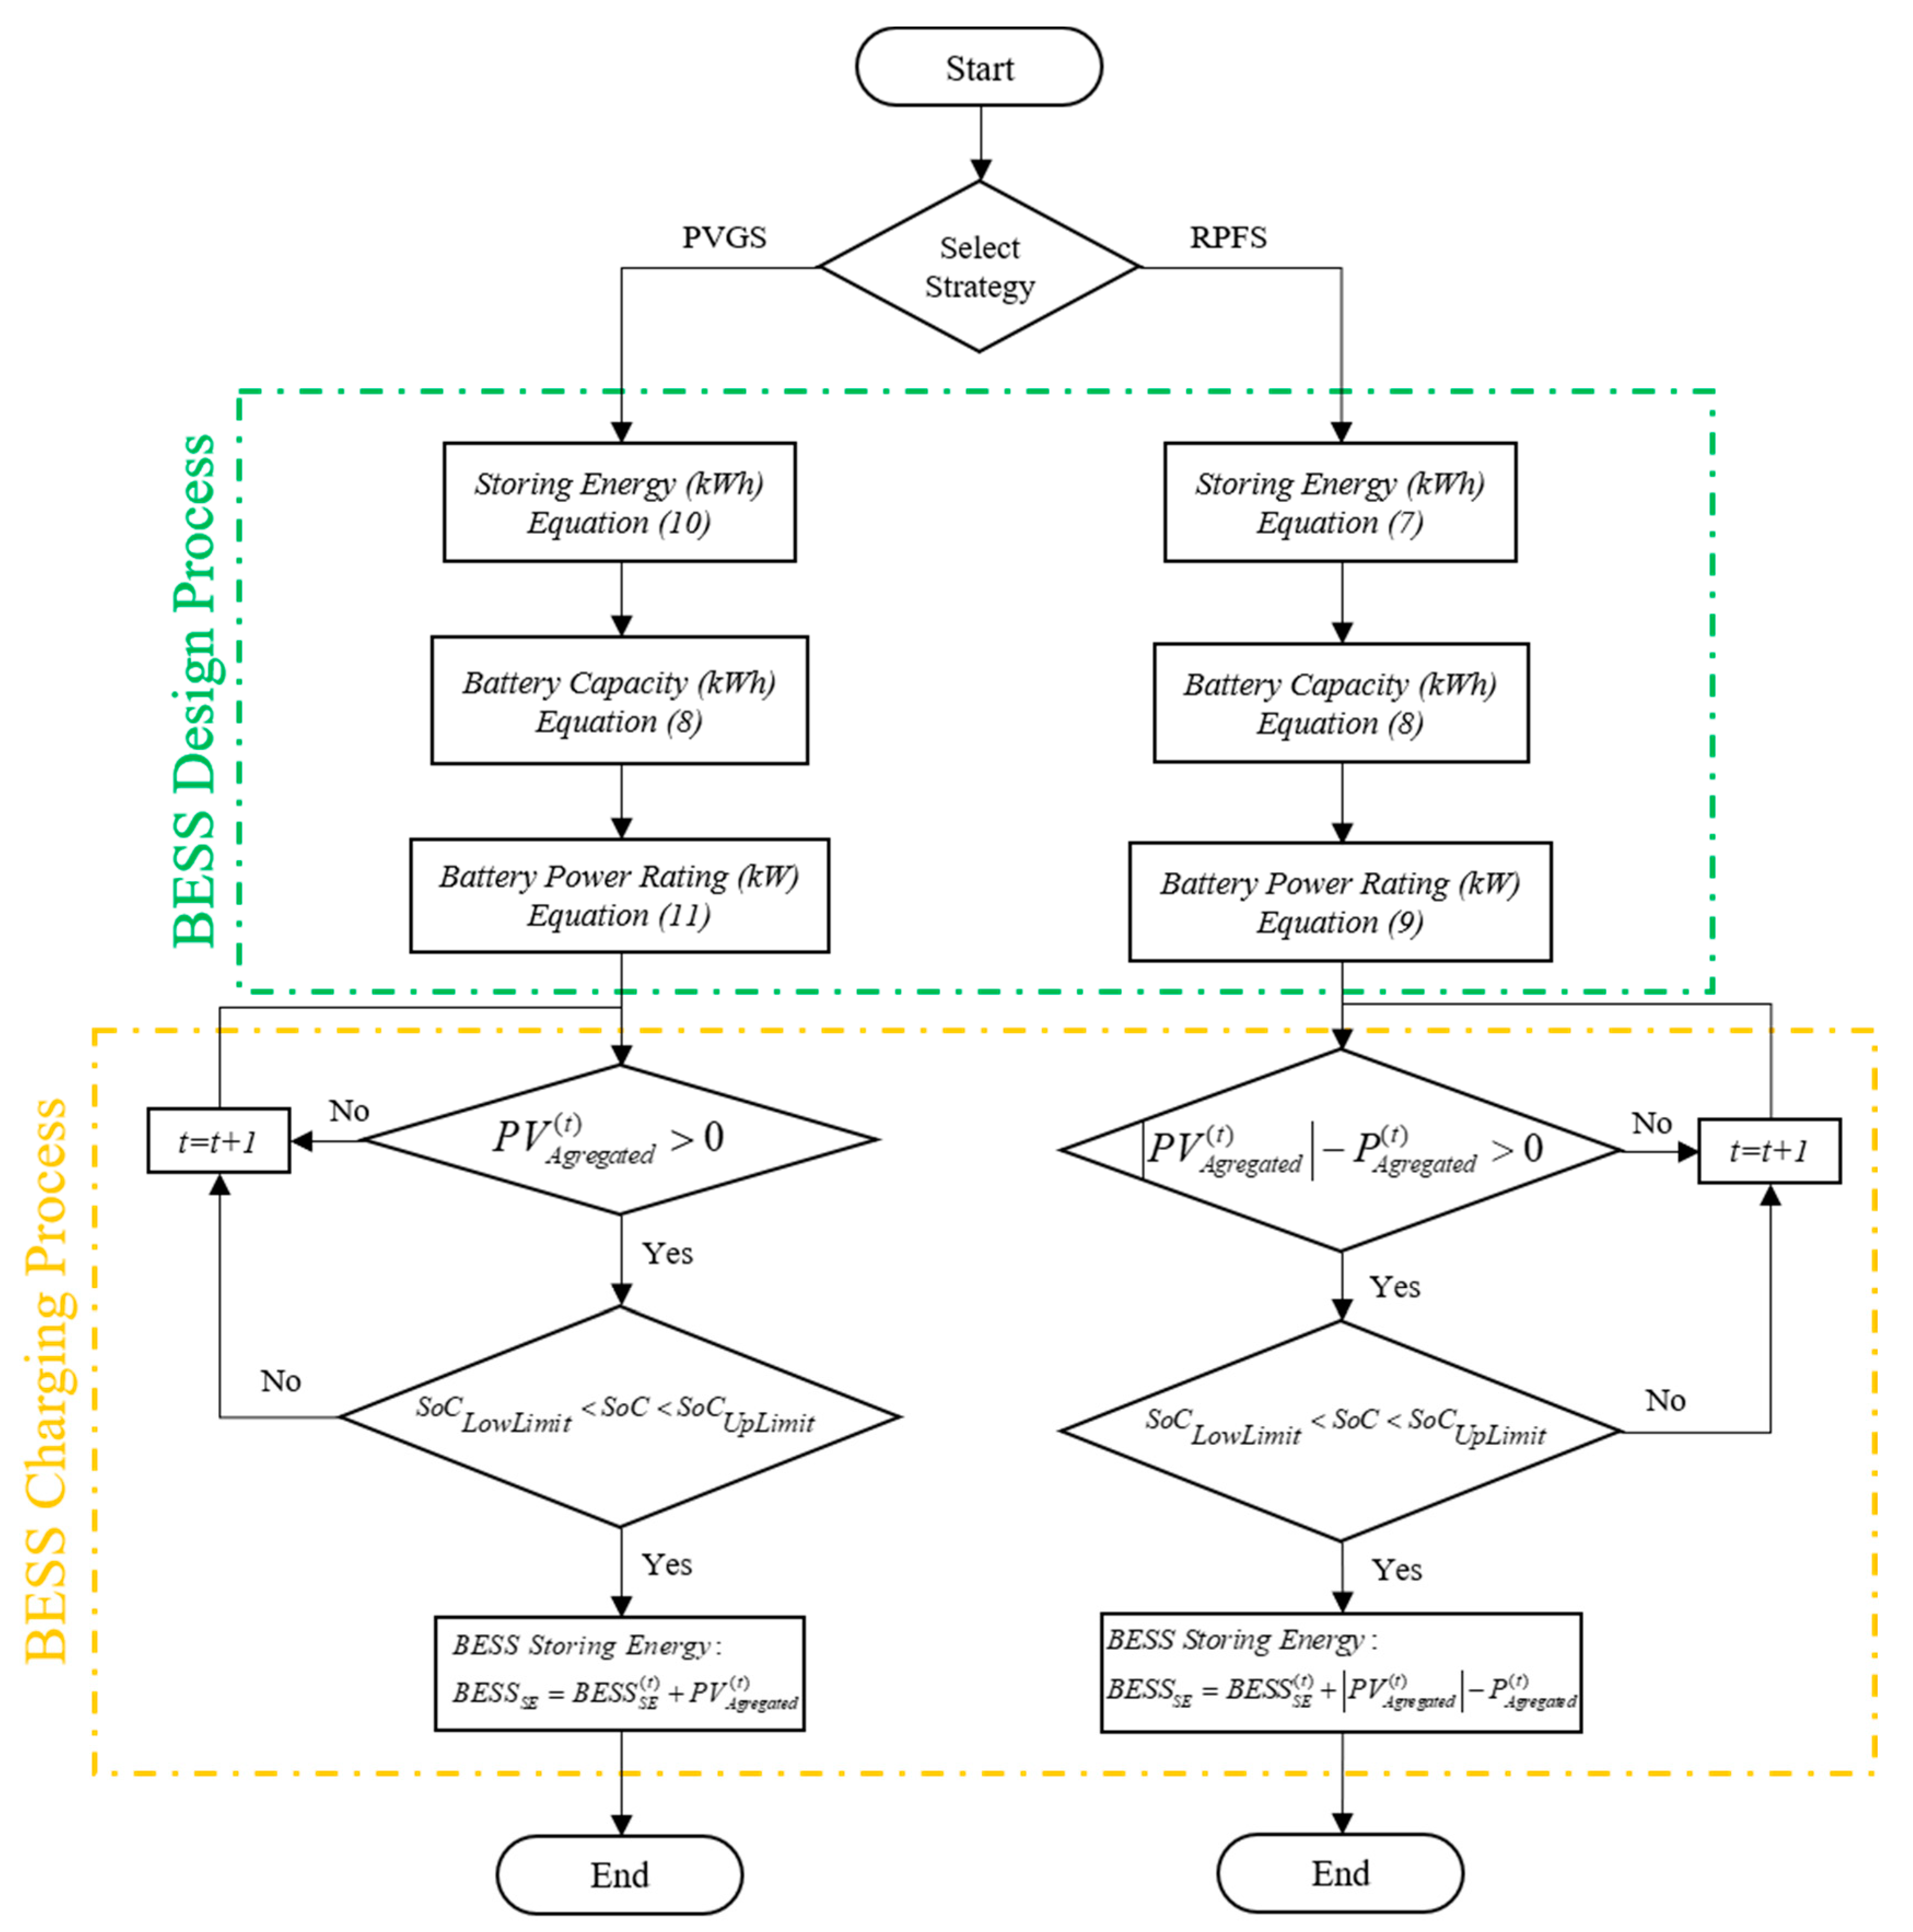
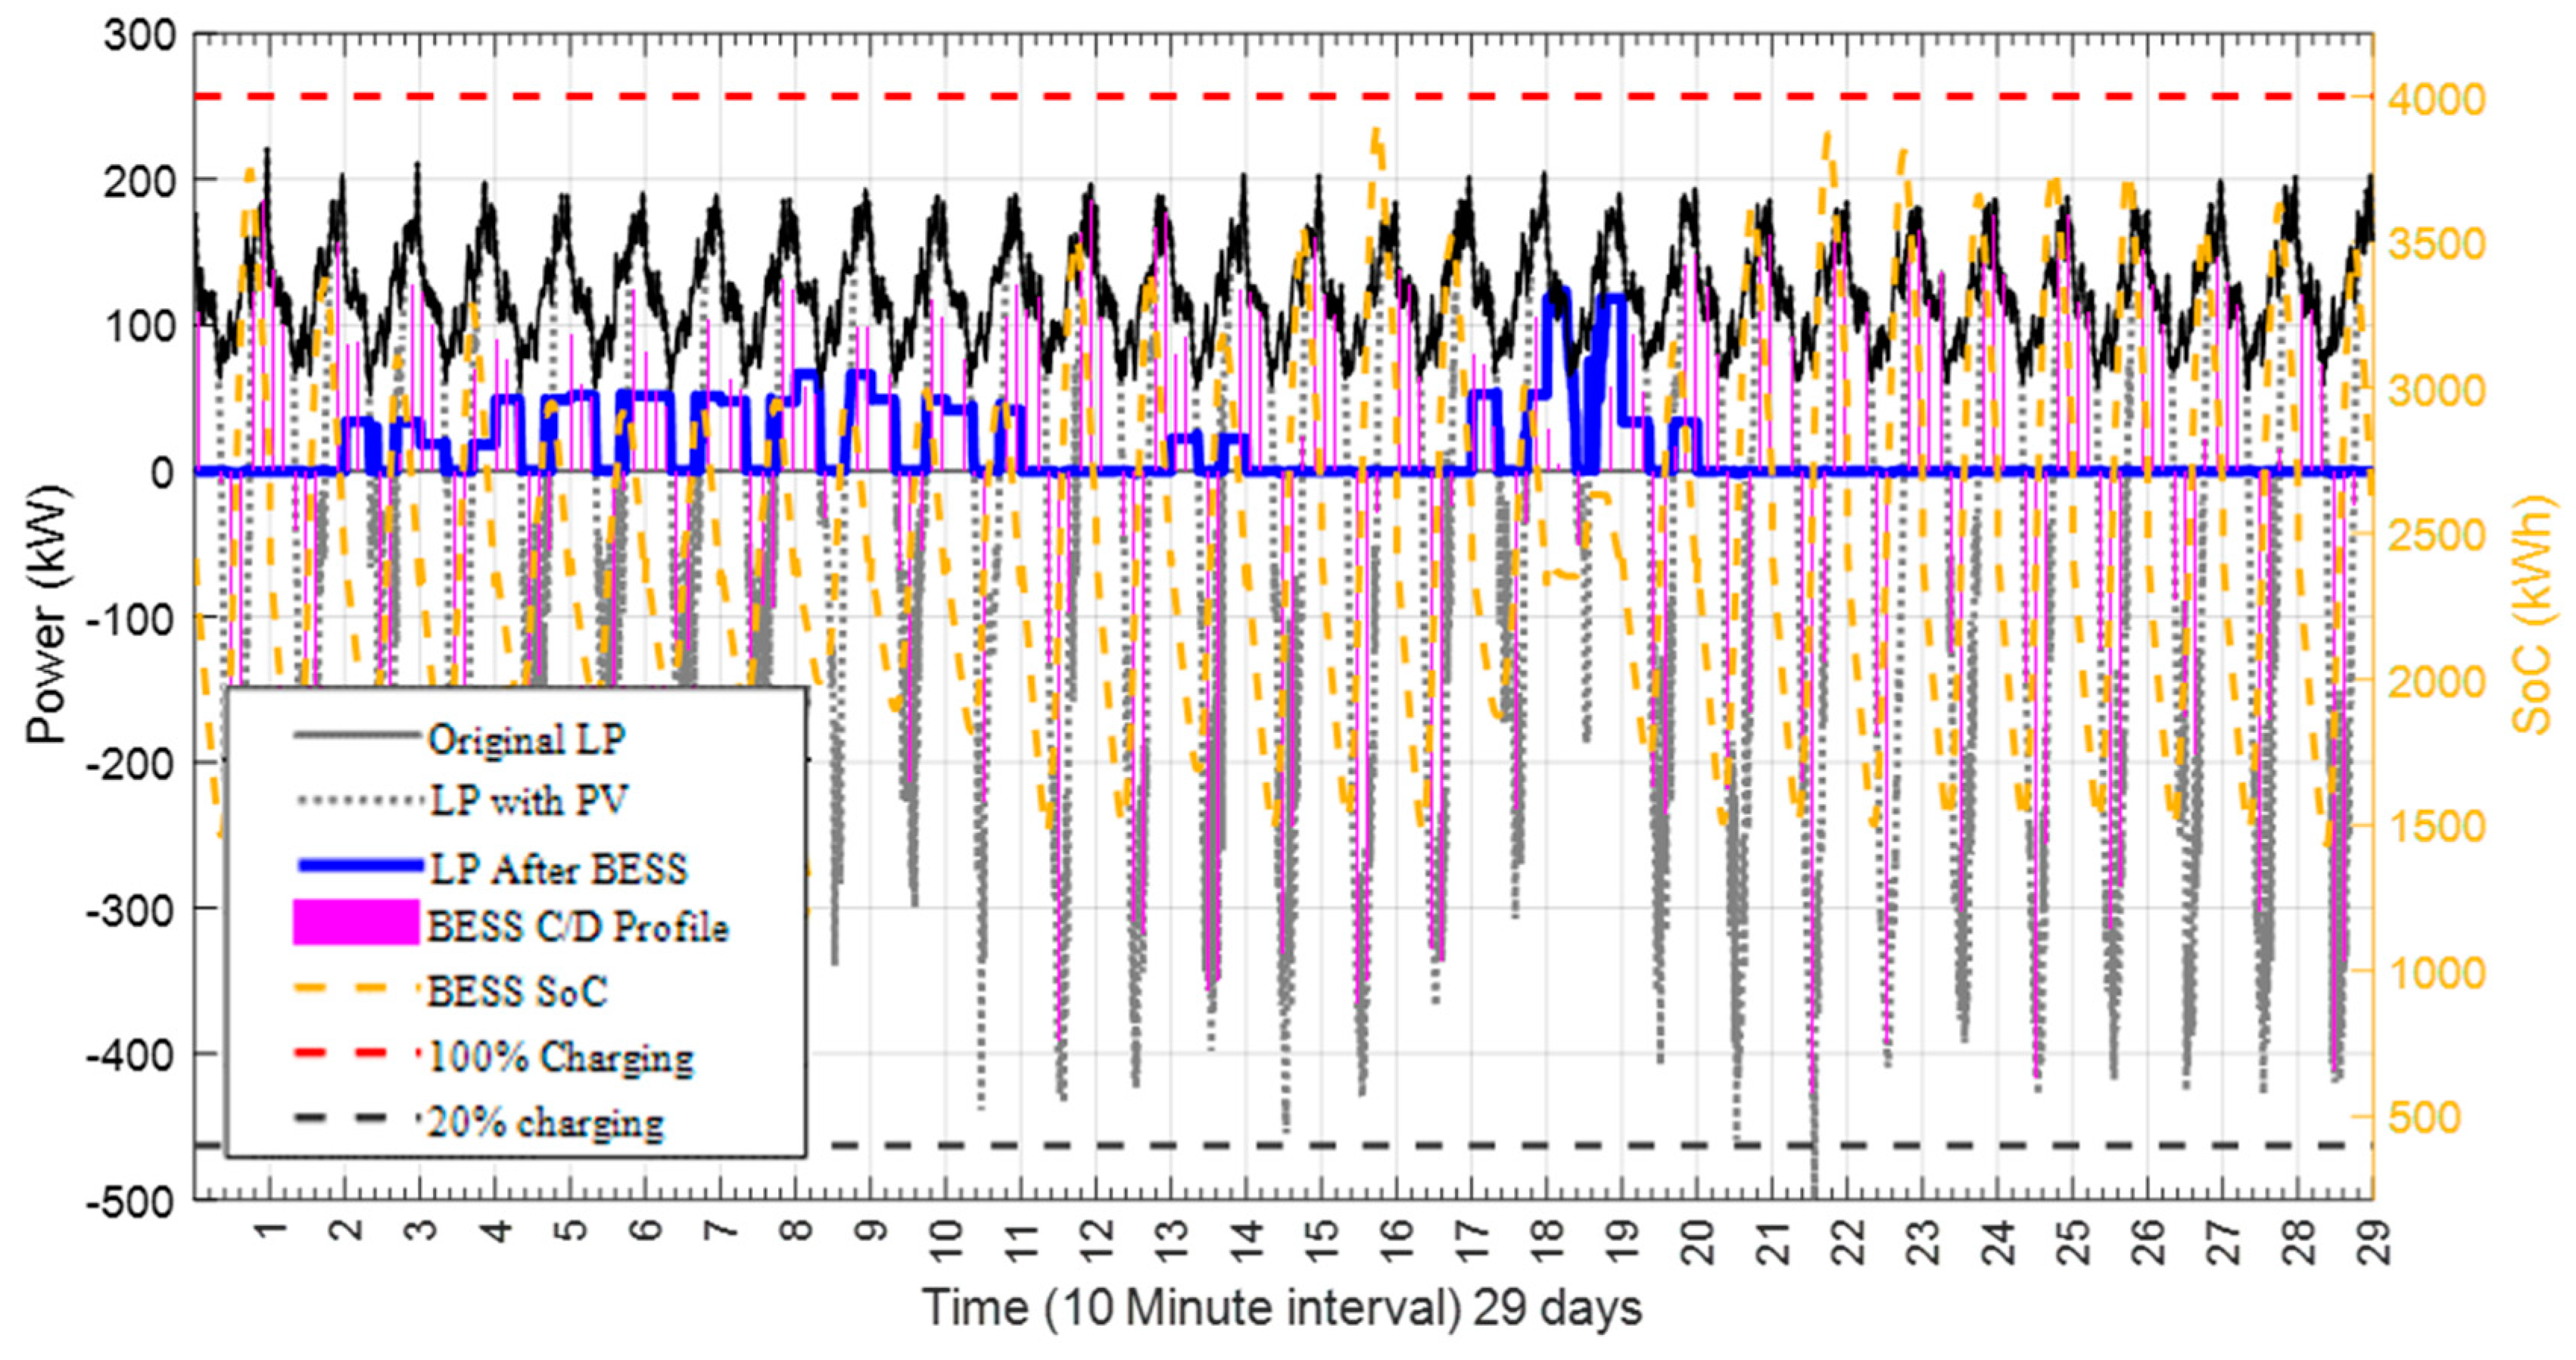
3. Formulation of Battery Control Strategies

Various battery control strategies can be considered to allocate BESS in the distribution network, depending on the aims of the BESS installation. The following subsections describe the proposed strategies that were utilized in this study for BESS charging, namely reverse power flow strategy (RPFS) and PV generation strategy (PVGS). Subsequently, different BESS sizes (kW) and capacities (kWh) were determined under various BESS integration scenarios. Furthermore, the following battery parameters and factors were considered. These factors were determined based on datasheets from battery manufacturers such as Tesla [29].
  • Depth of discharging (DOD), 80%;
  • Battery charging efficiency (Effc), 90%;
  • Battery discharging efficiency (Effdc), 90%;
  • Autonomy days (AD), 0–100%;

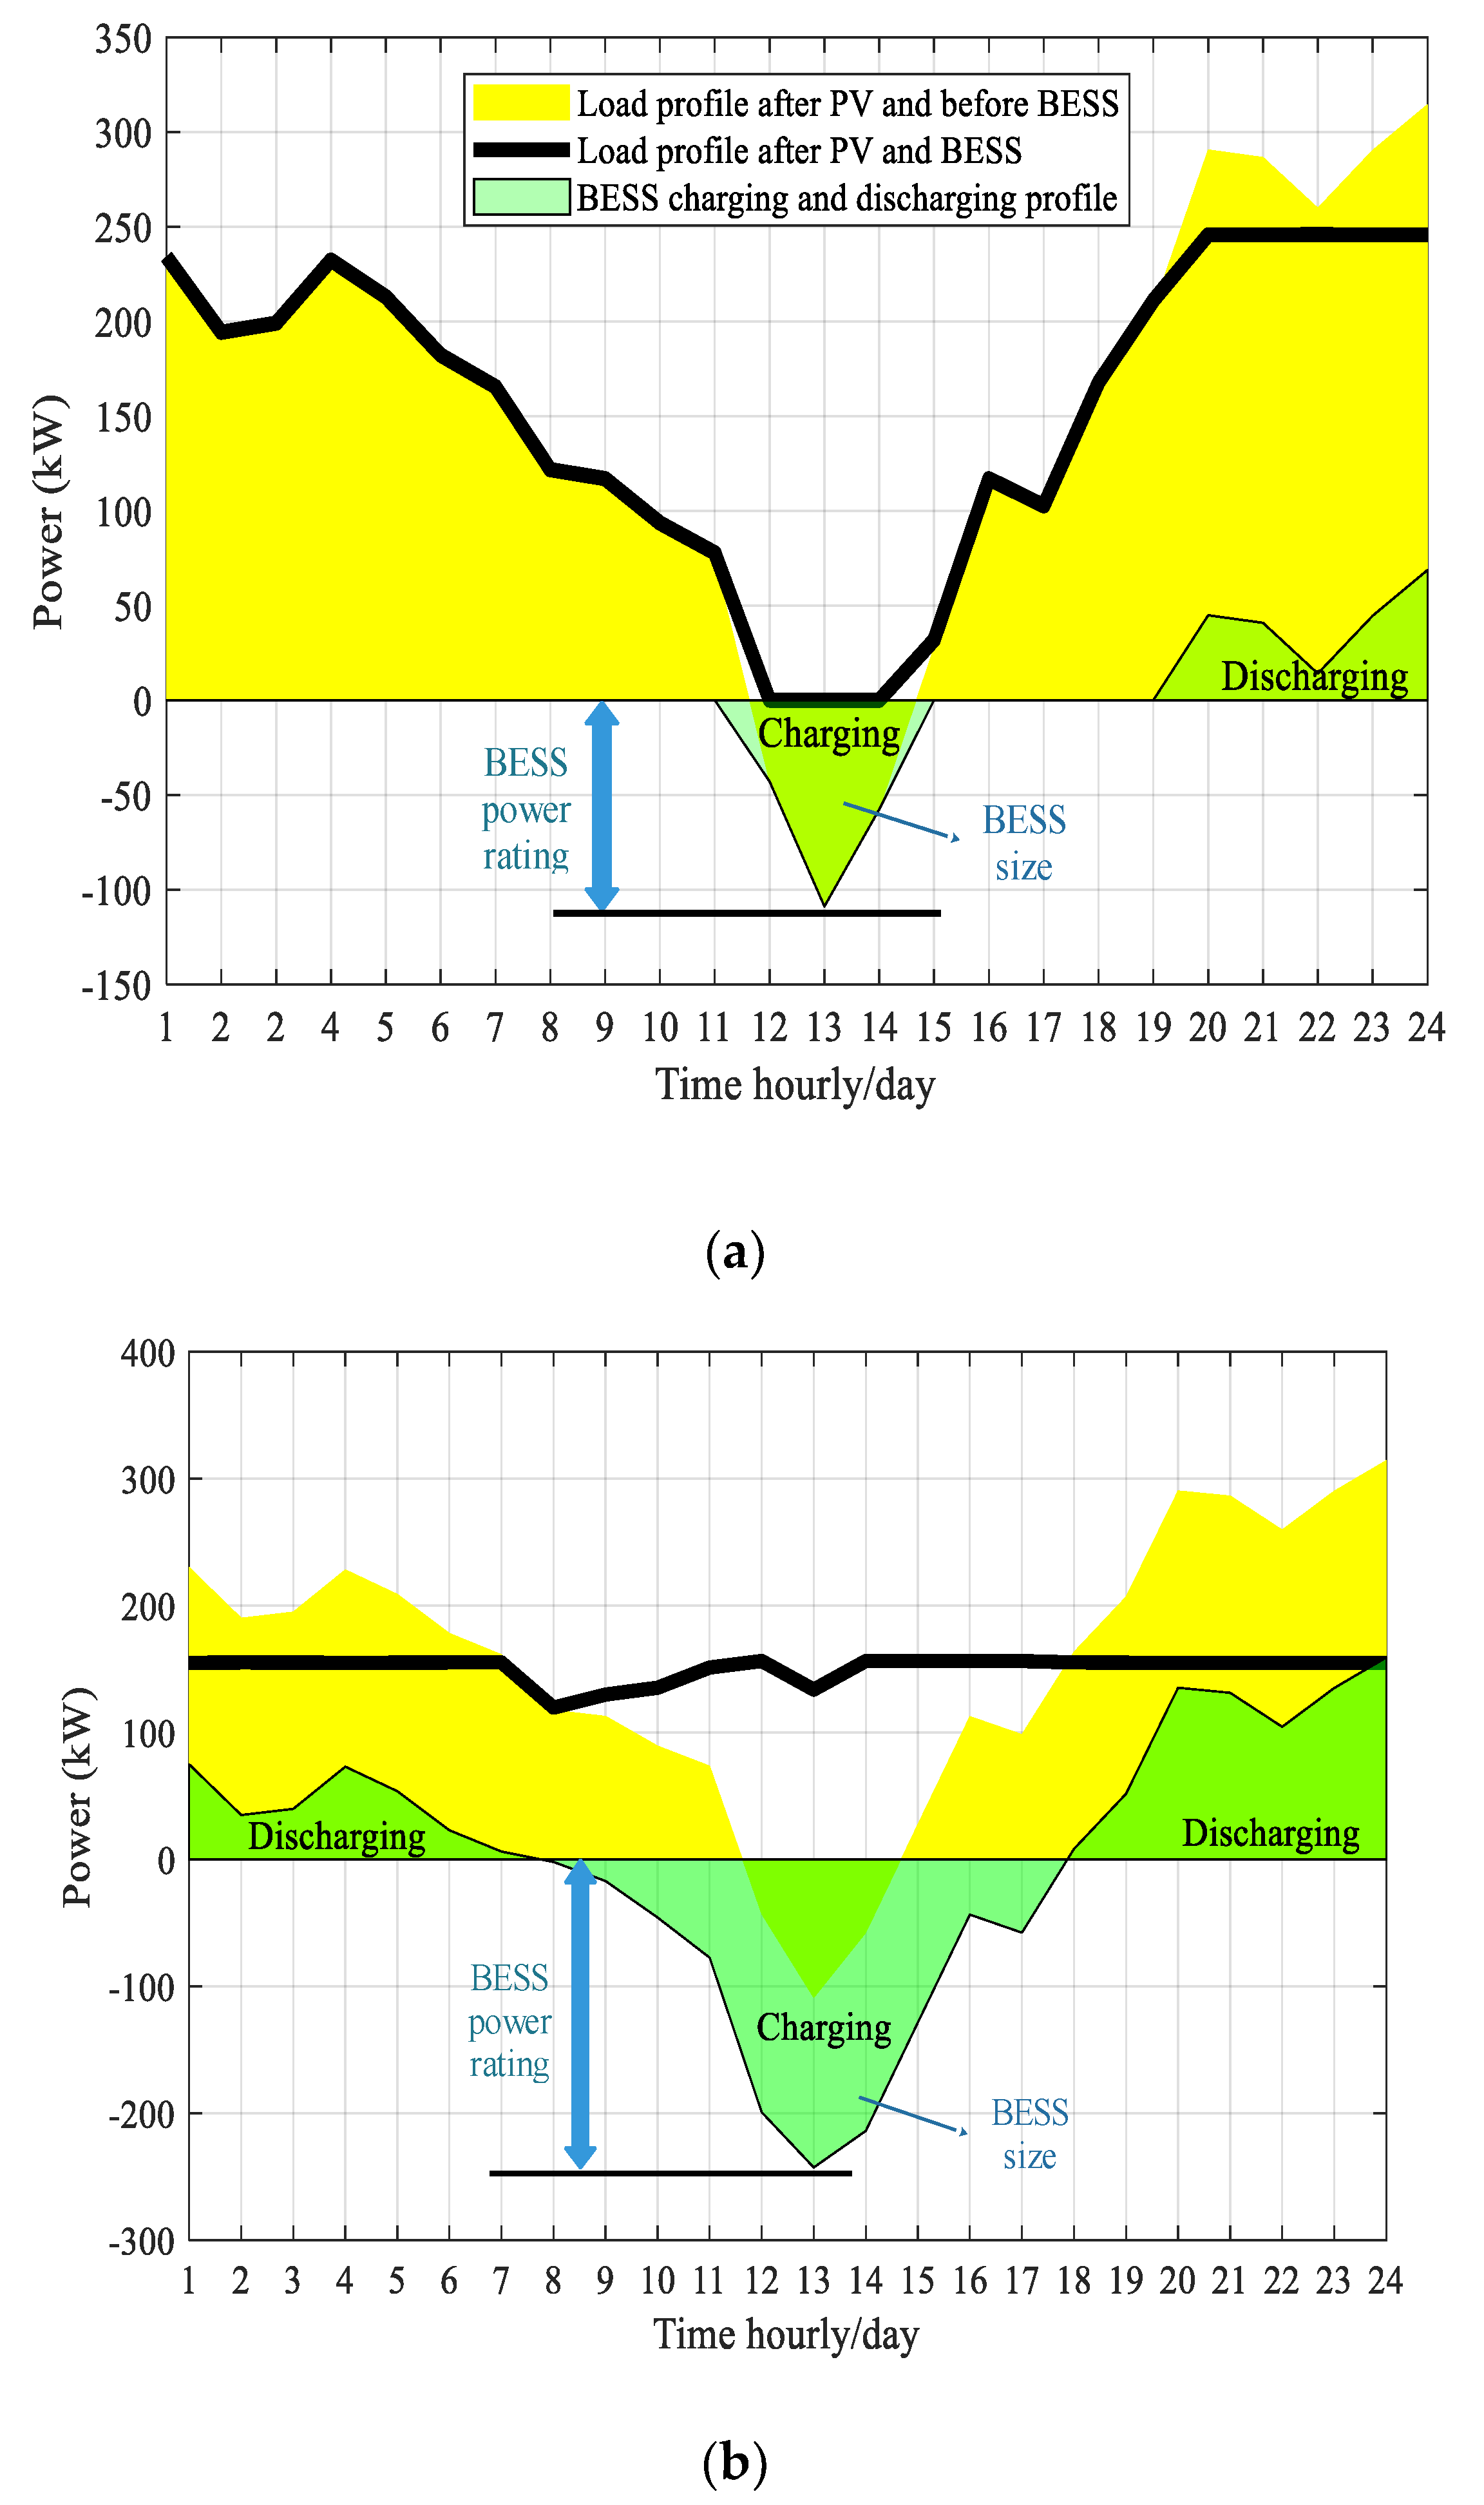
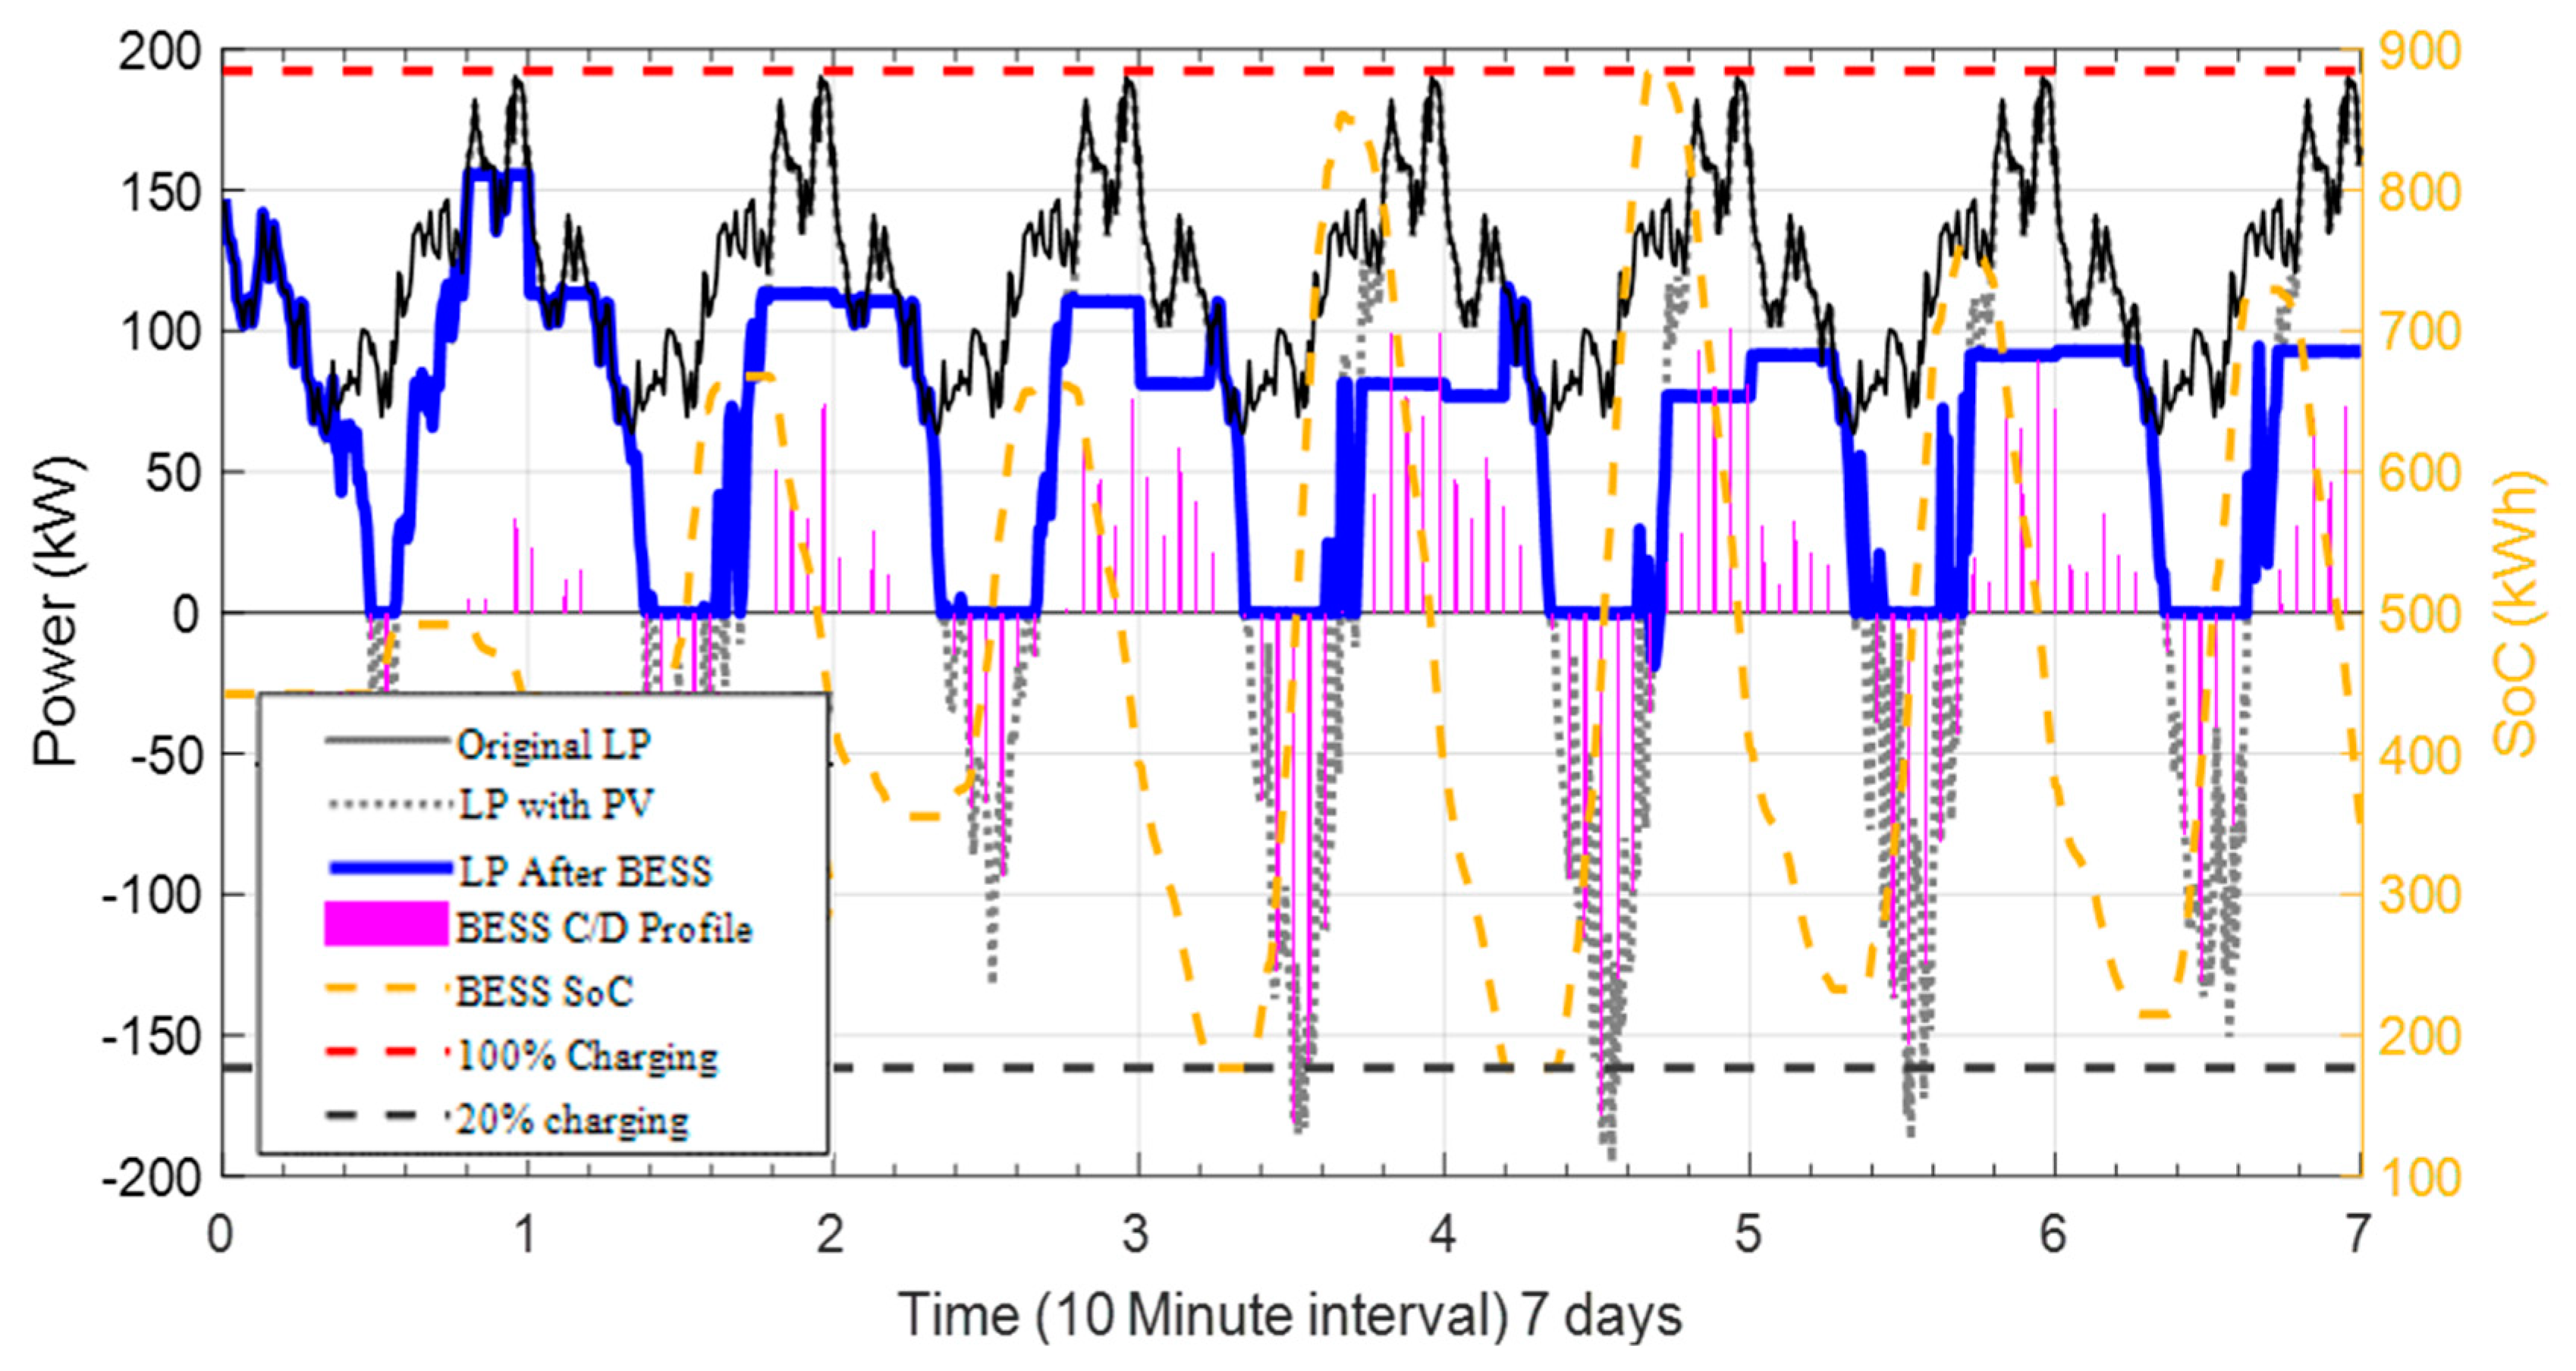
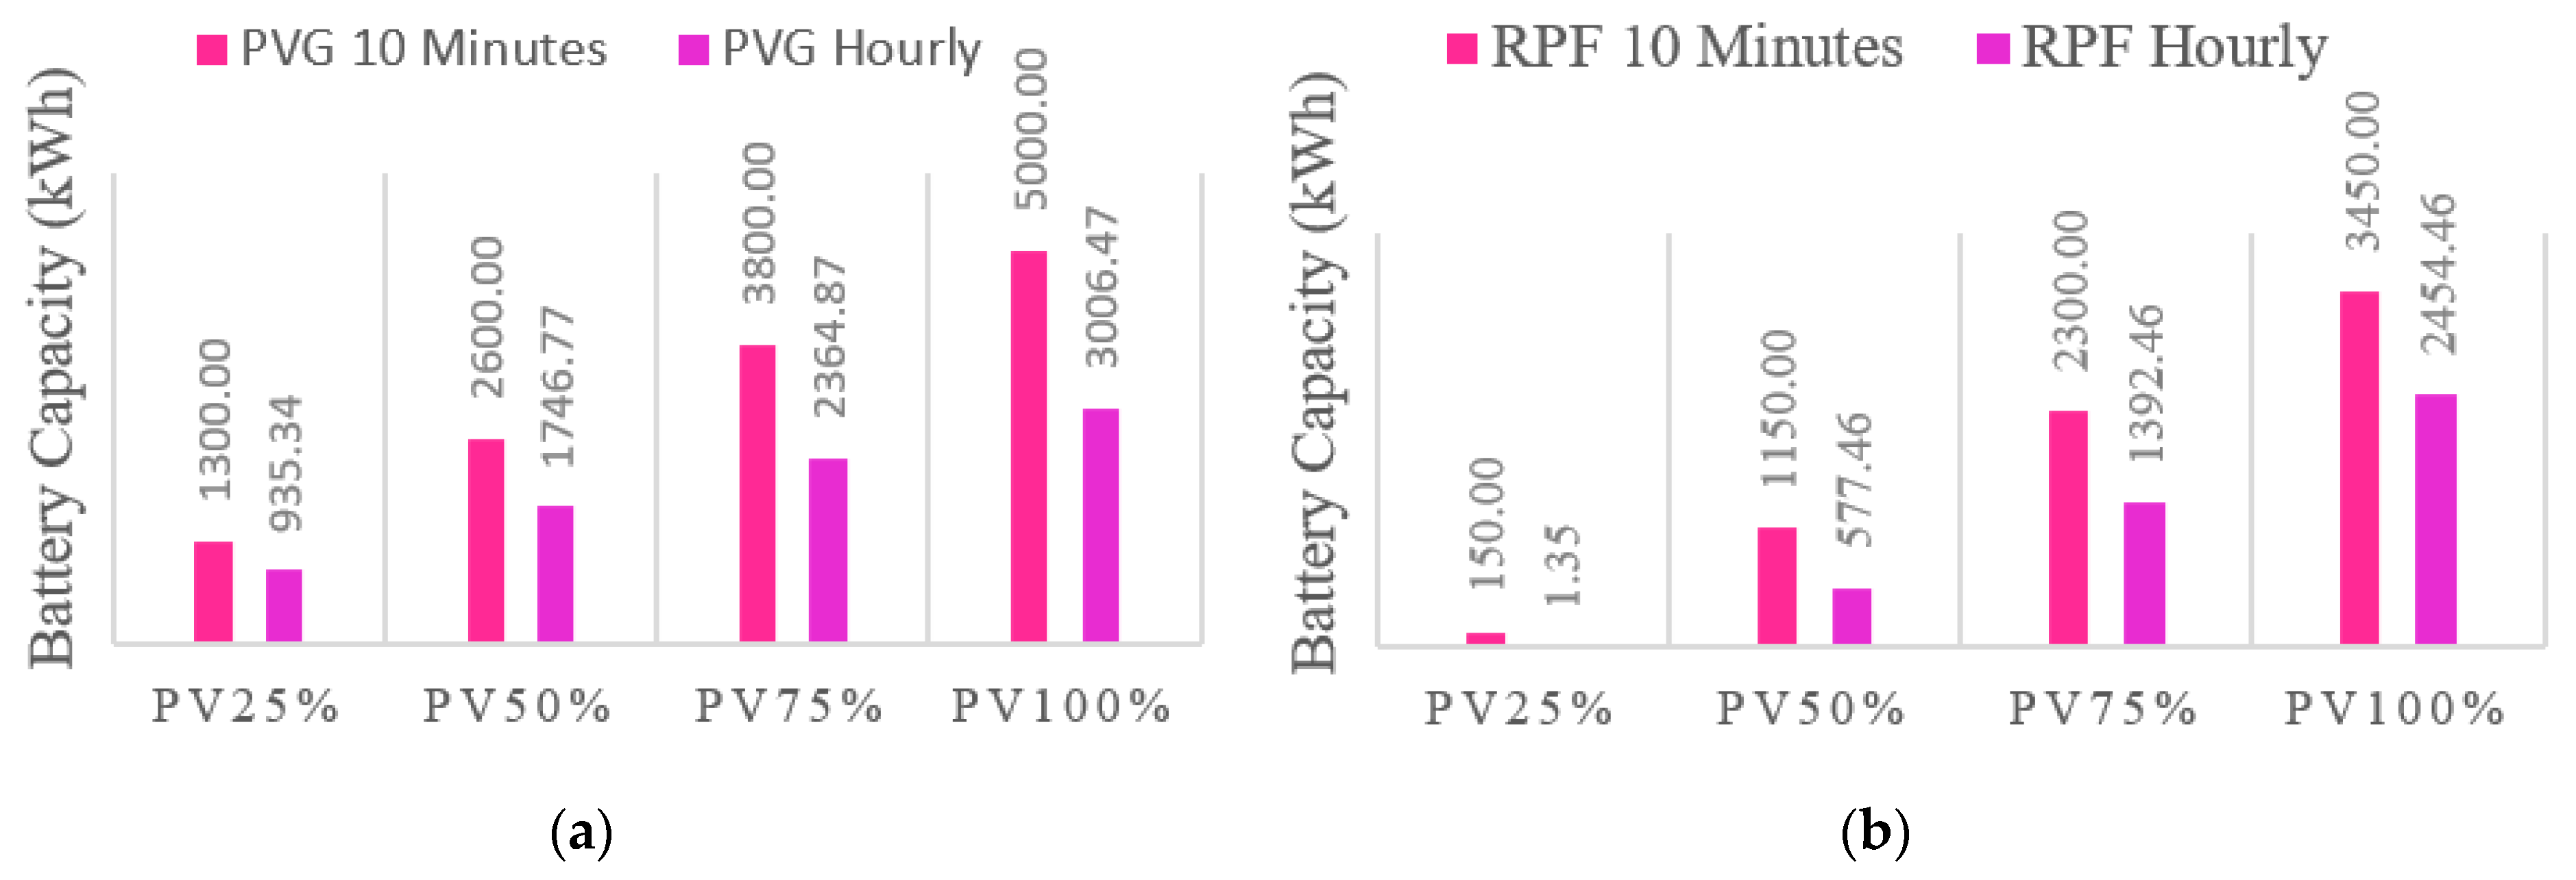
3.1. Reverse Power Flow Strategy (RPFS) for Charging BESS

The reverse power flow can adversely affect the operation of the distribution network. When the PV system generated power is greater than the demand, the surplus solar power will reverse back to the upstream grid. This will lead to network voltage rise and increased of network losses. Hence, the utility company will normally encourage the consumer to self-consume their PV generated energy instead of exporting it to the grid. Accordingly, the BESS can play an important role in this regard. This section introduces a strategy to store the amount of surplus PV generation into the BESS. This could avoid reverse power flow as well as utilize the stored energy for peak demand reduction. The main concept of RPFS strategy is shown in Figure 7. The total amount of stored energy in BESS can be calculated as in Equation (7). The BESS sizing is calculated based on the daily maximum stored energy. Equation (8) expresses BESS capacity in kWh and Equation (9) indicates the formulation of BESS power rating in kW.
B E S S S E ( d ) = t = 1 n t p s ( | P V A g r e g a t e d ( t ) | P A g r e g a t e d ( t ) ) ( n p t s / 24 ) × E f f c × A D
B E S S C a p a c i t y = max i : d n d ( B E S S S E ( i ) )
B E S S r a t i n g = max ( max i : t n p t s ( | P V A g r e g a t e d ( i ) | P A g r e g a t e d ( i ) ) ( n p t s / 24 ) )

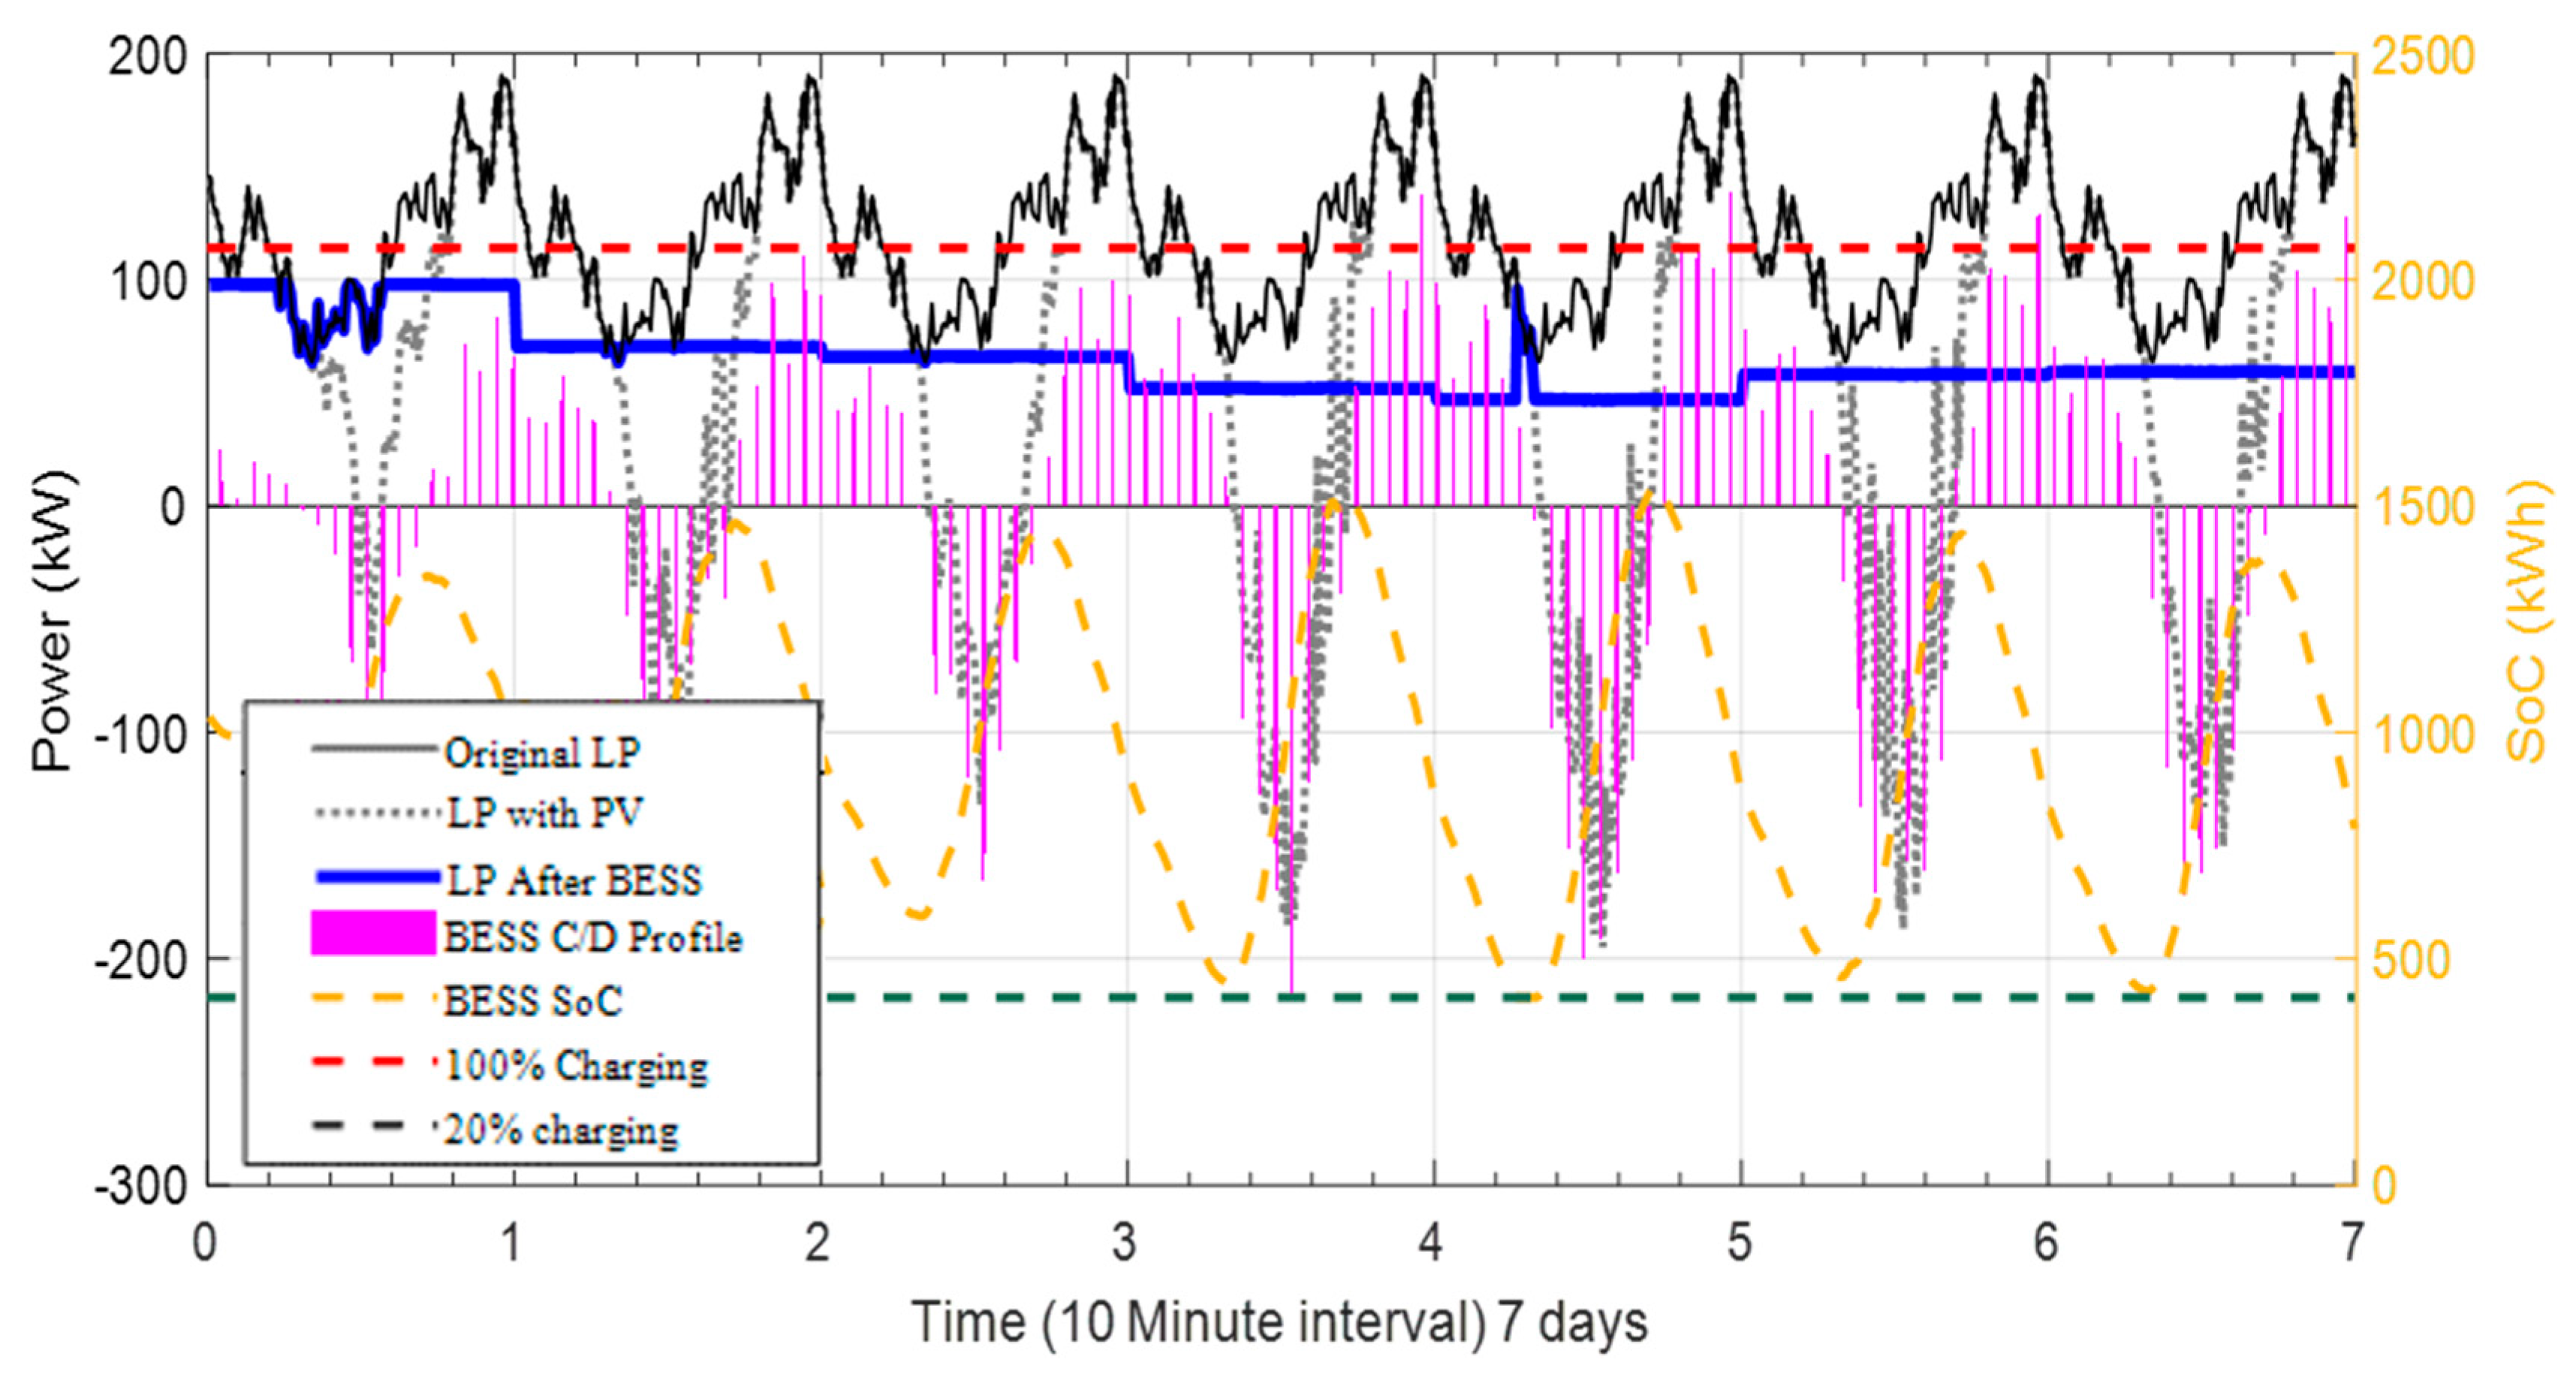
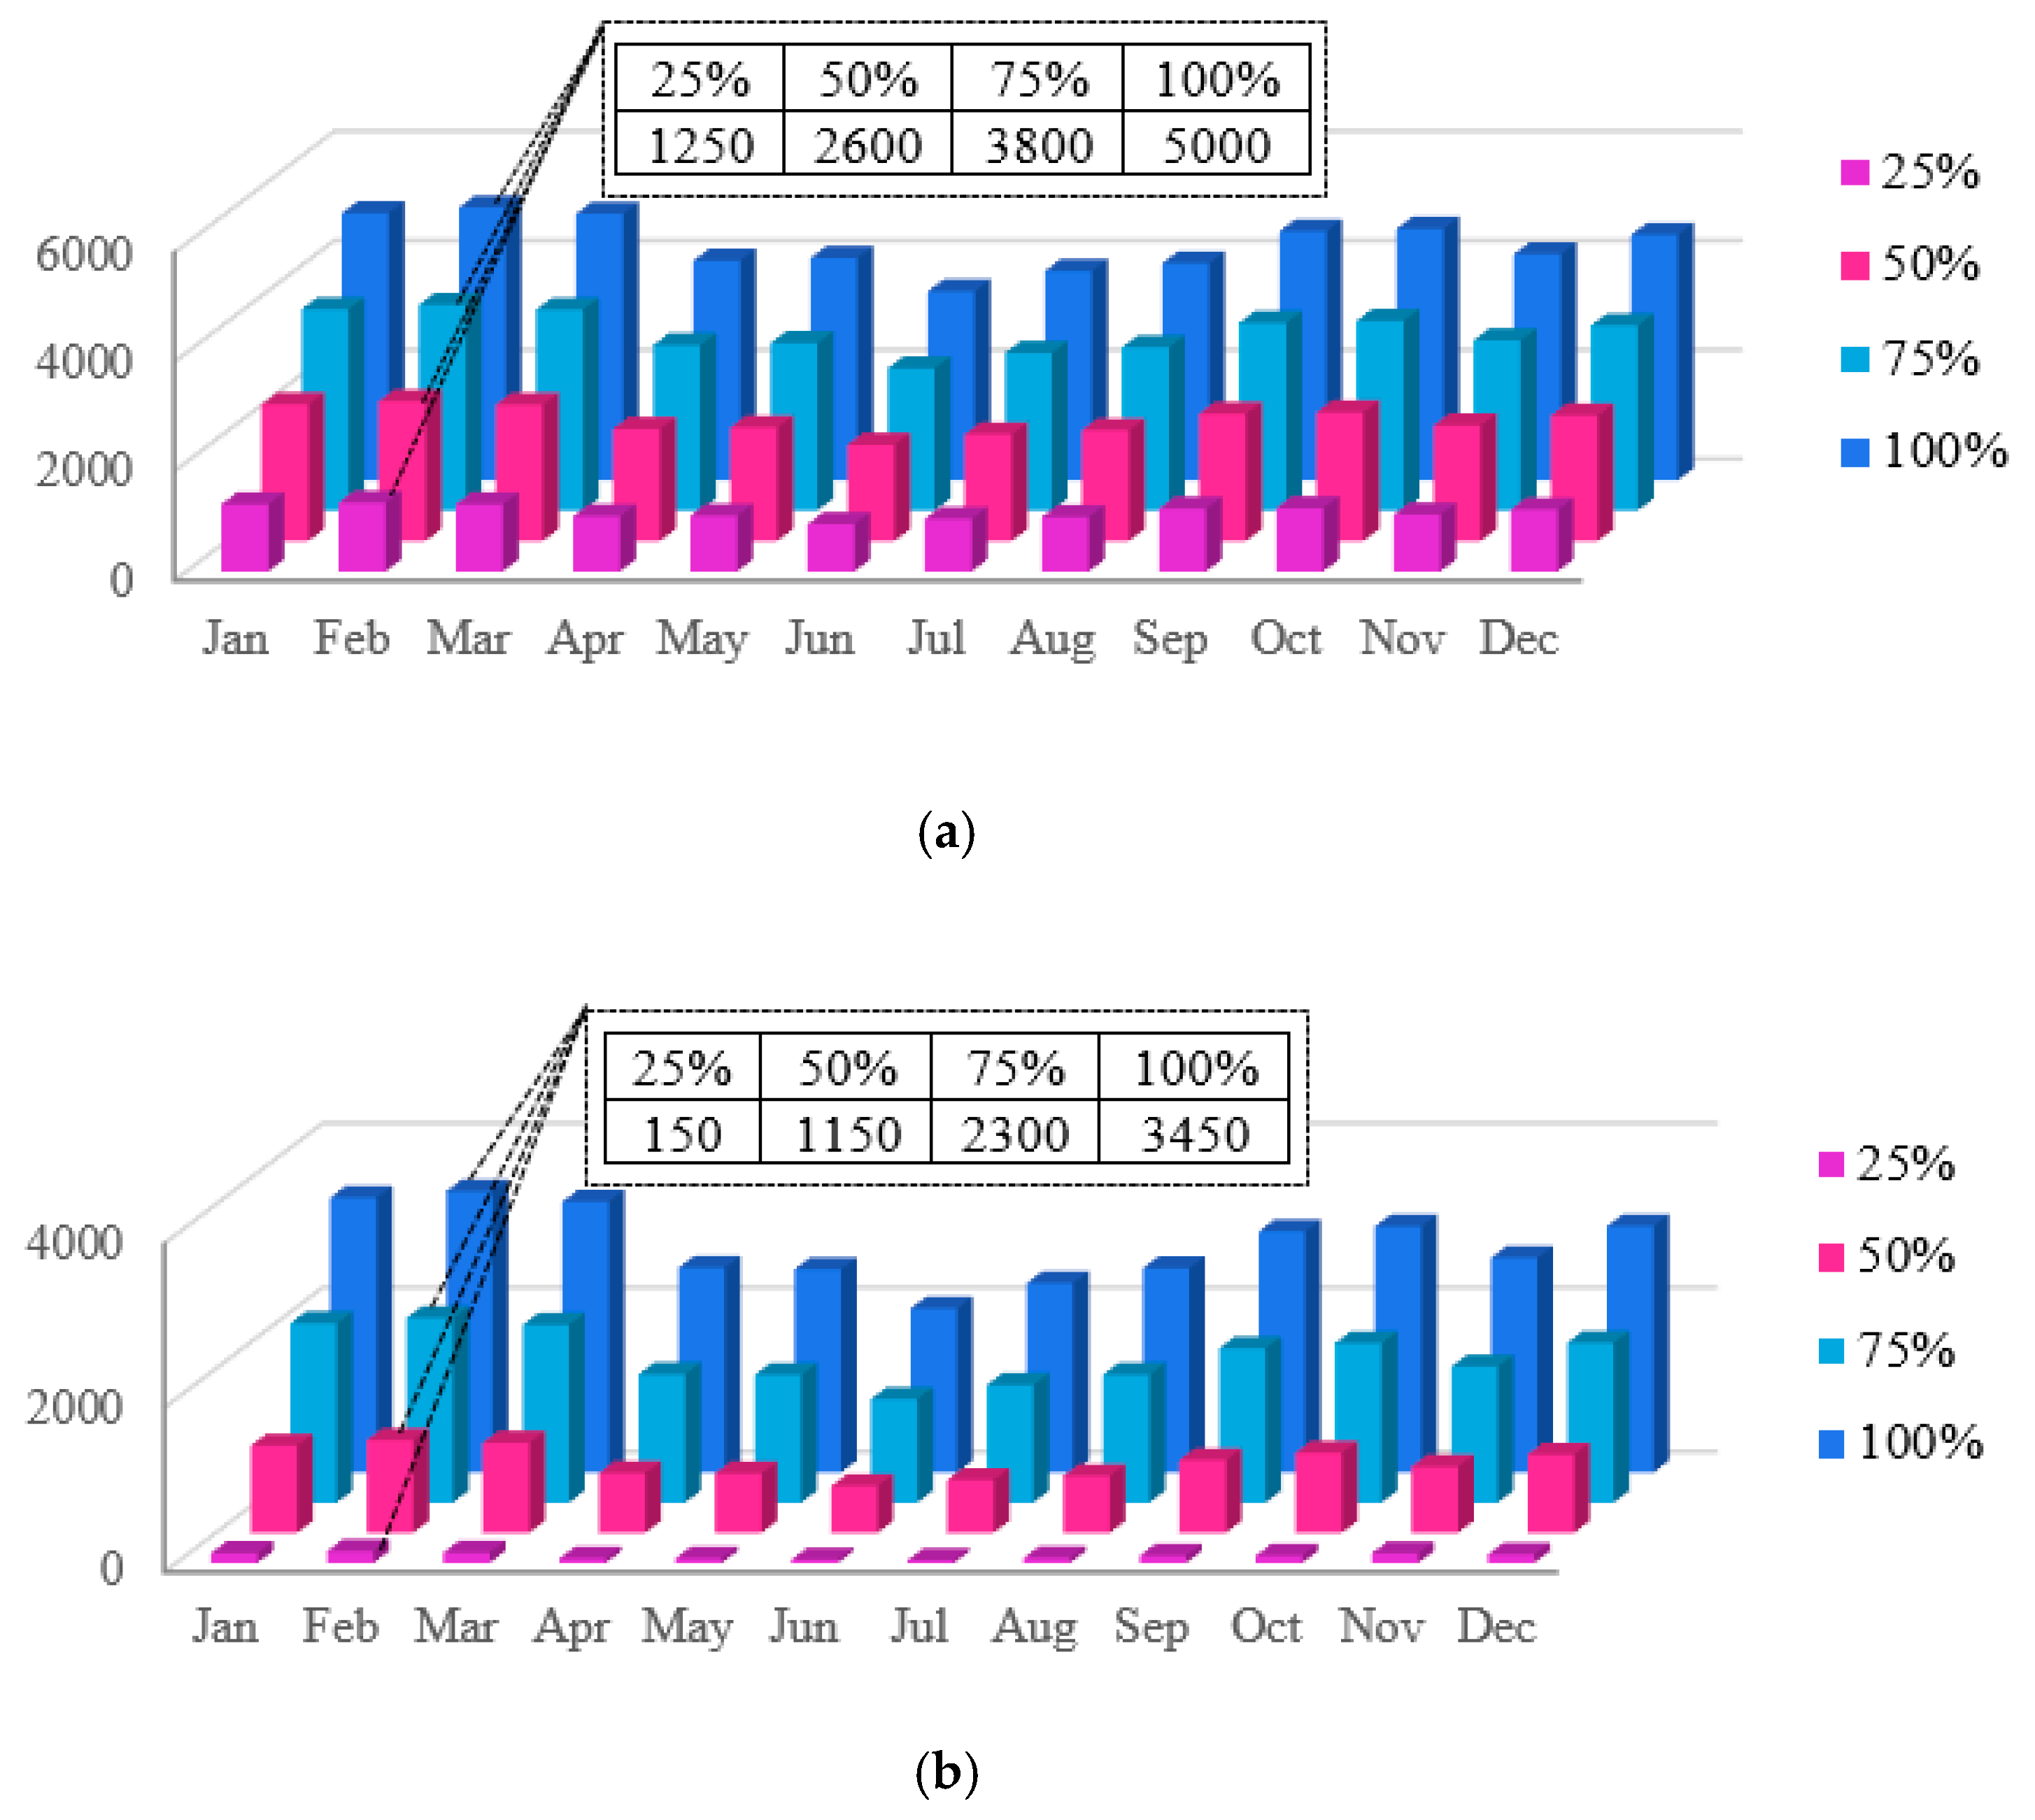
3.2. PV Generation Strategy (PVGS) for Charging BESS

The second strategy proposed for BESS charging is completely based on the total amount of PV generation power. Hence, it can be expected that the size and rating of the BESS unit will be larger than the previous strategy. Nevertheless, the amount of energy that can be delivered during the peak demand duration will be higher. Figure 7 shows the concept of BESS charging for this strategy. The amount of BESS stored energy is equal to the total PV generation of the day, as expressed in Equation (10) with its power rating calculated as in Equation (11). Similarly, the capacity of the battery is the same as in Equation (8).
B E S S S E ( d ) = t = 1 n t p s ( | P V A g r e g a t e d ( t ) | ) ( n p t s / 24 ) × E f f c × A D
B E S S r a t i n g = max ( max i : t n p t s ( | P V A g r e g a t e d ( i ) | ) ( n p t s / 24 ) )
It is worth noting that the AD value in Equations (7) and (10) are adjusted in an iterative manner with a 10% increment for every iteration. The higher value of AD might result in oversizing the BESS. Conversely, a lower value of AD might result in BESS charging and discharging failure. Hence, it is important to determine the suitable AD value for safe BESS operation.

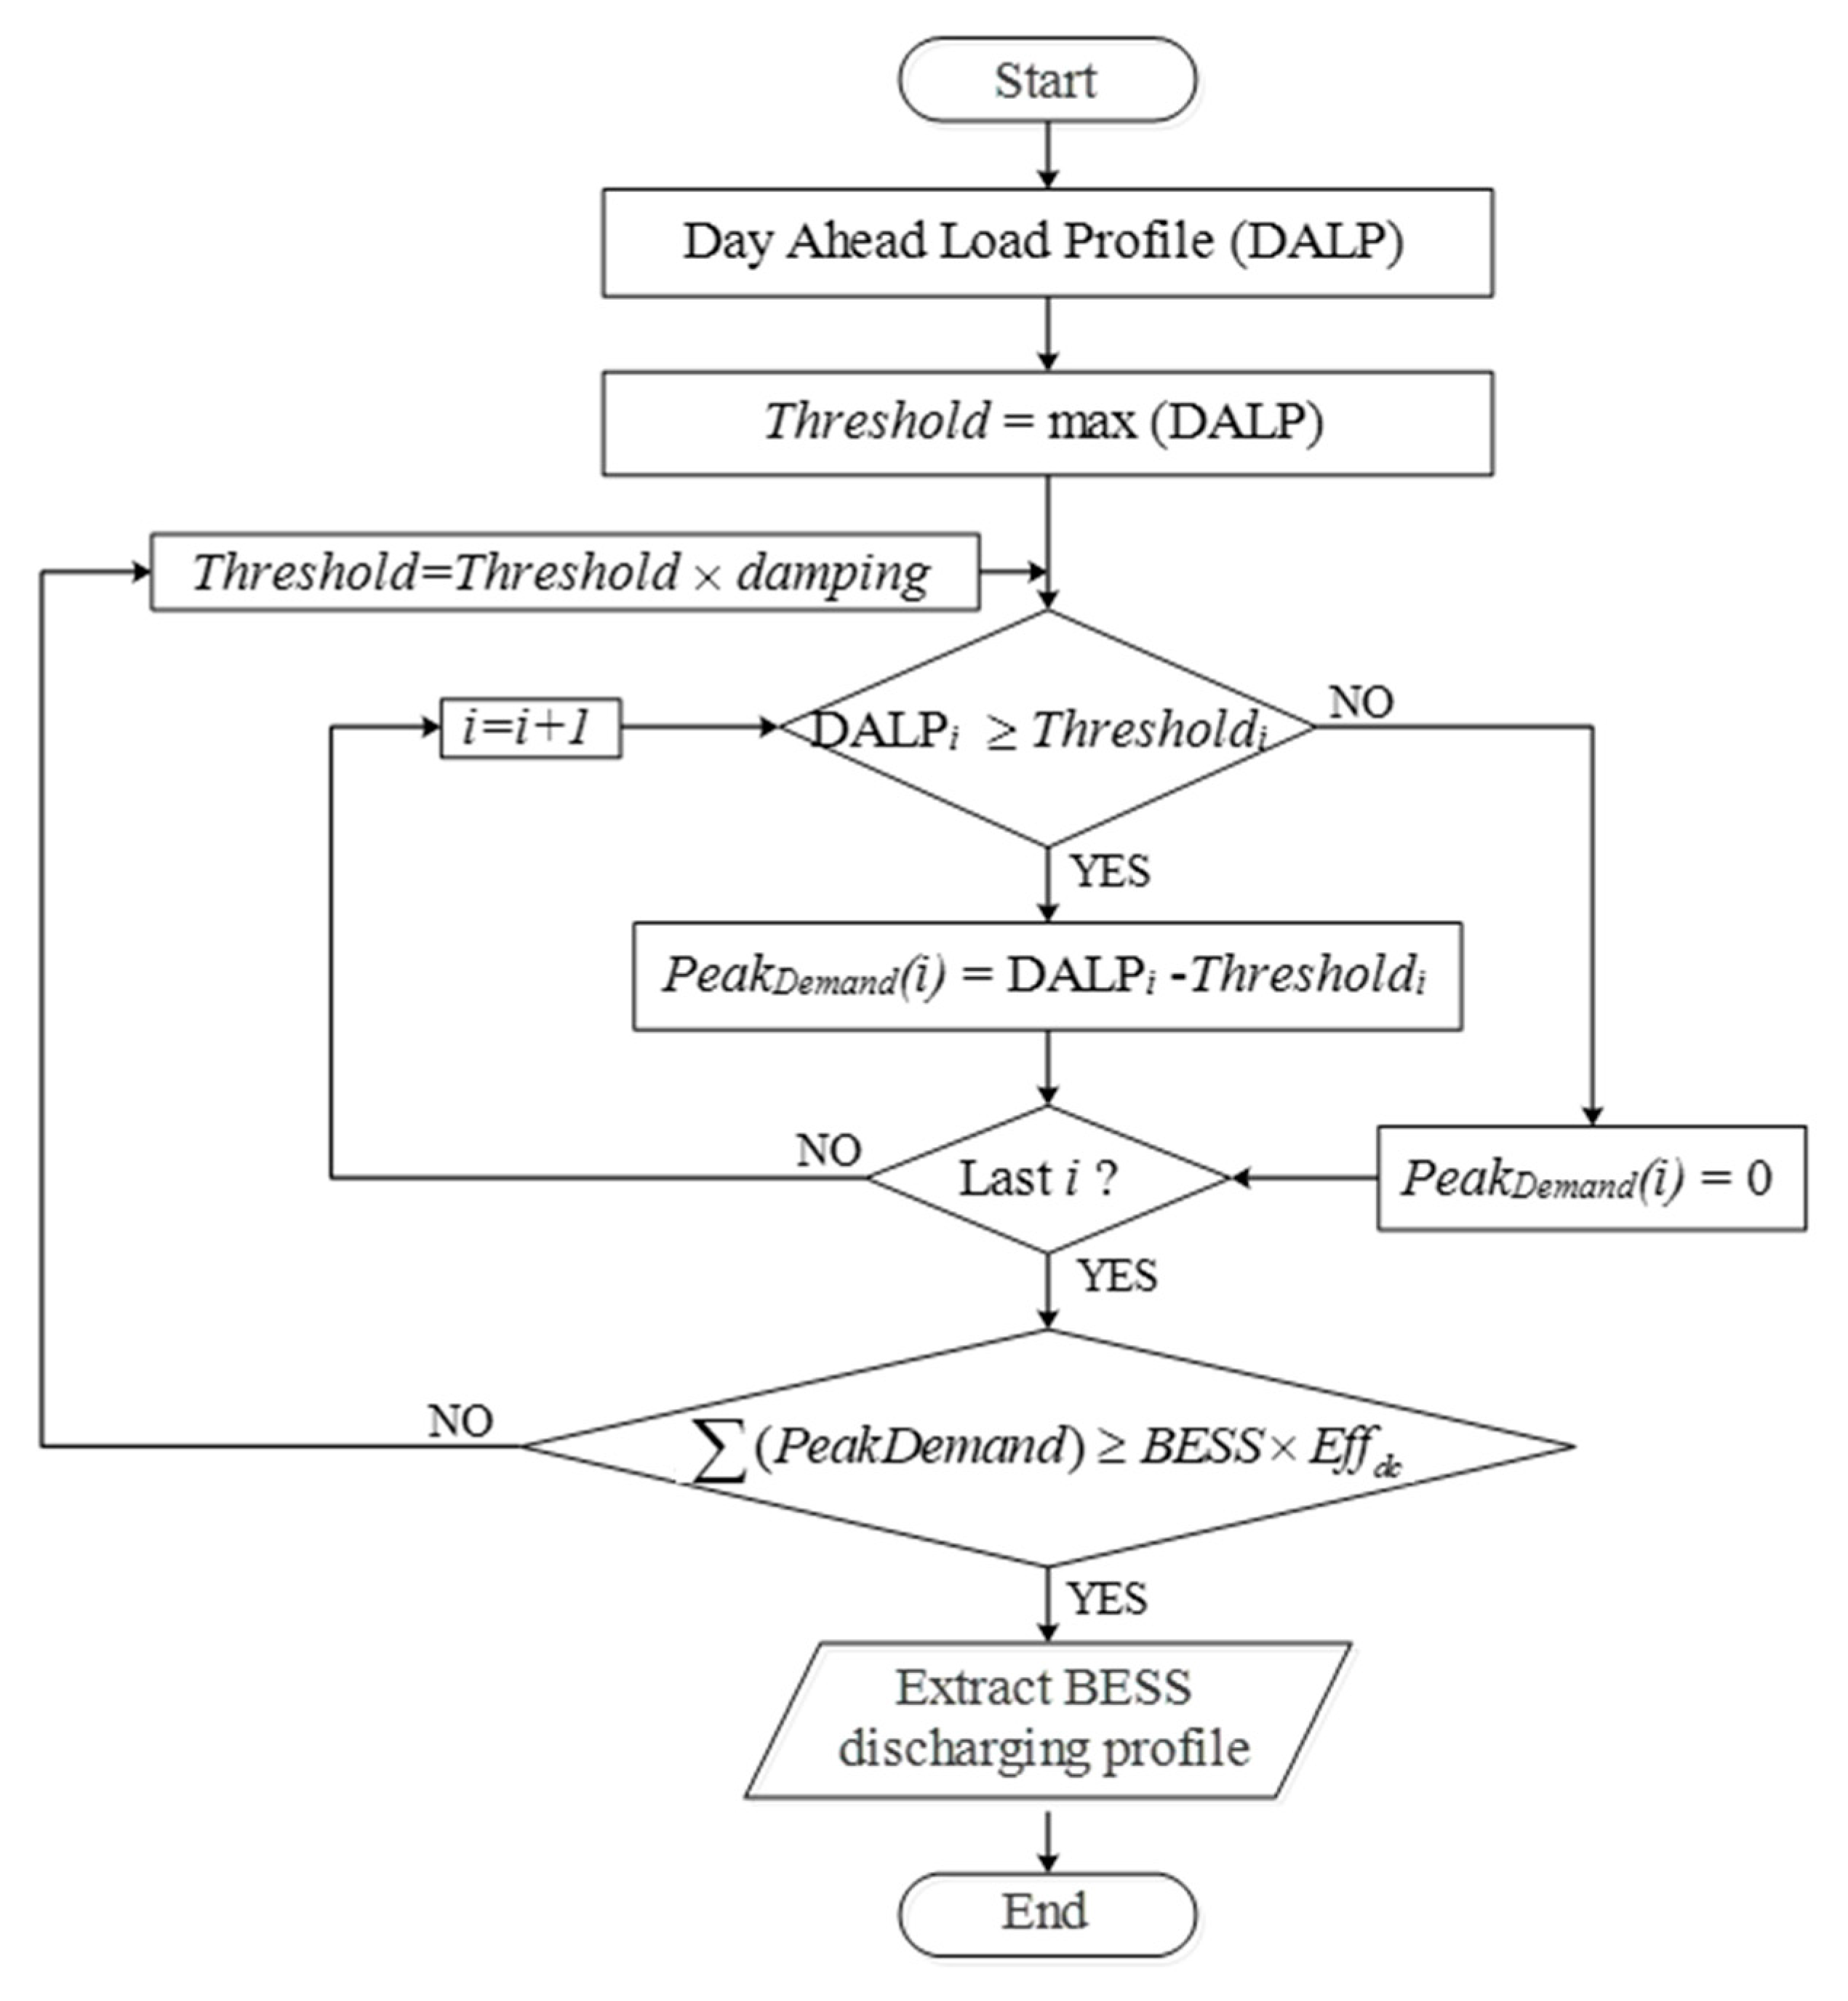
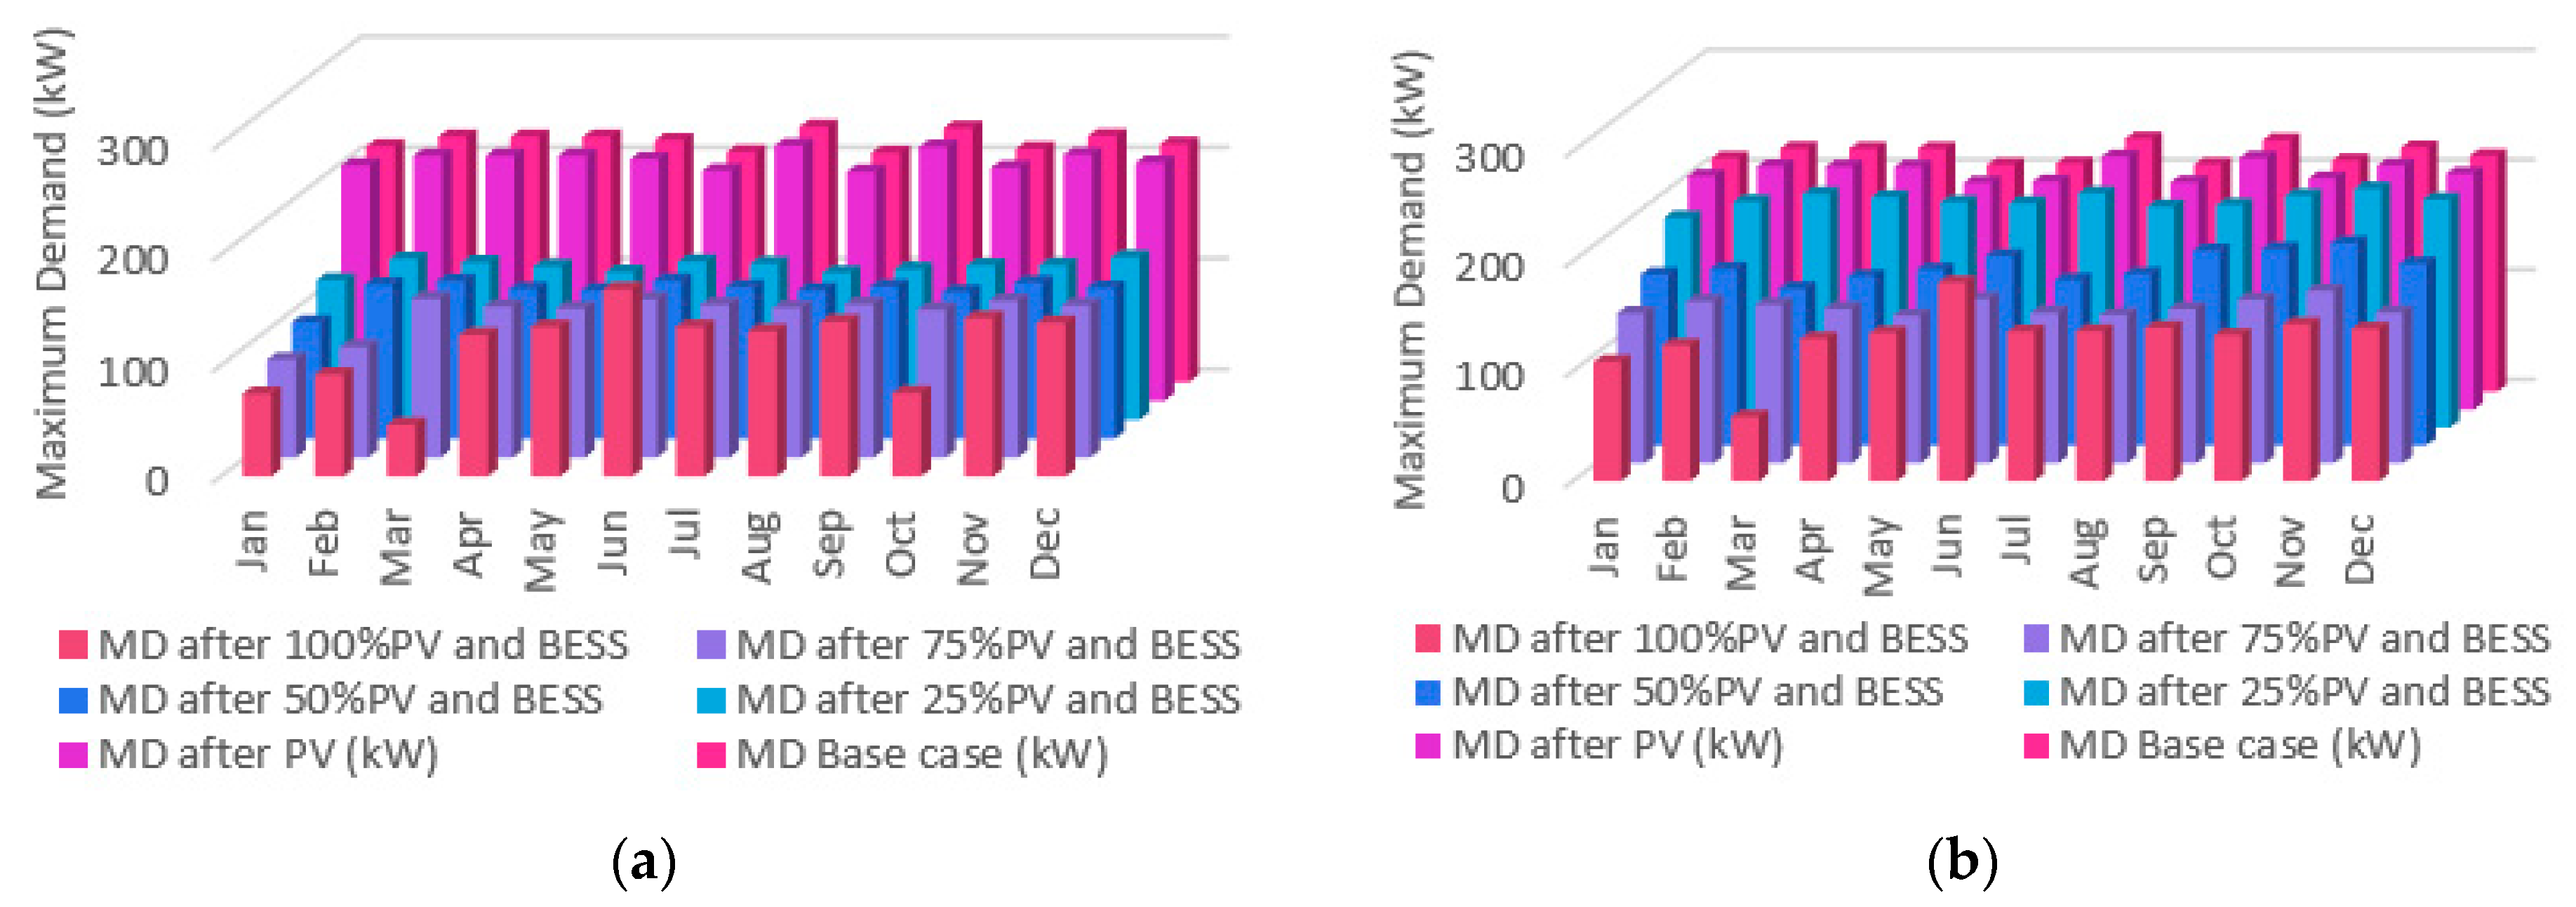
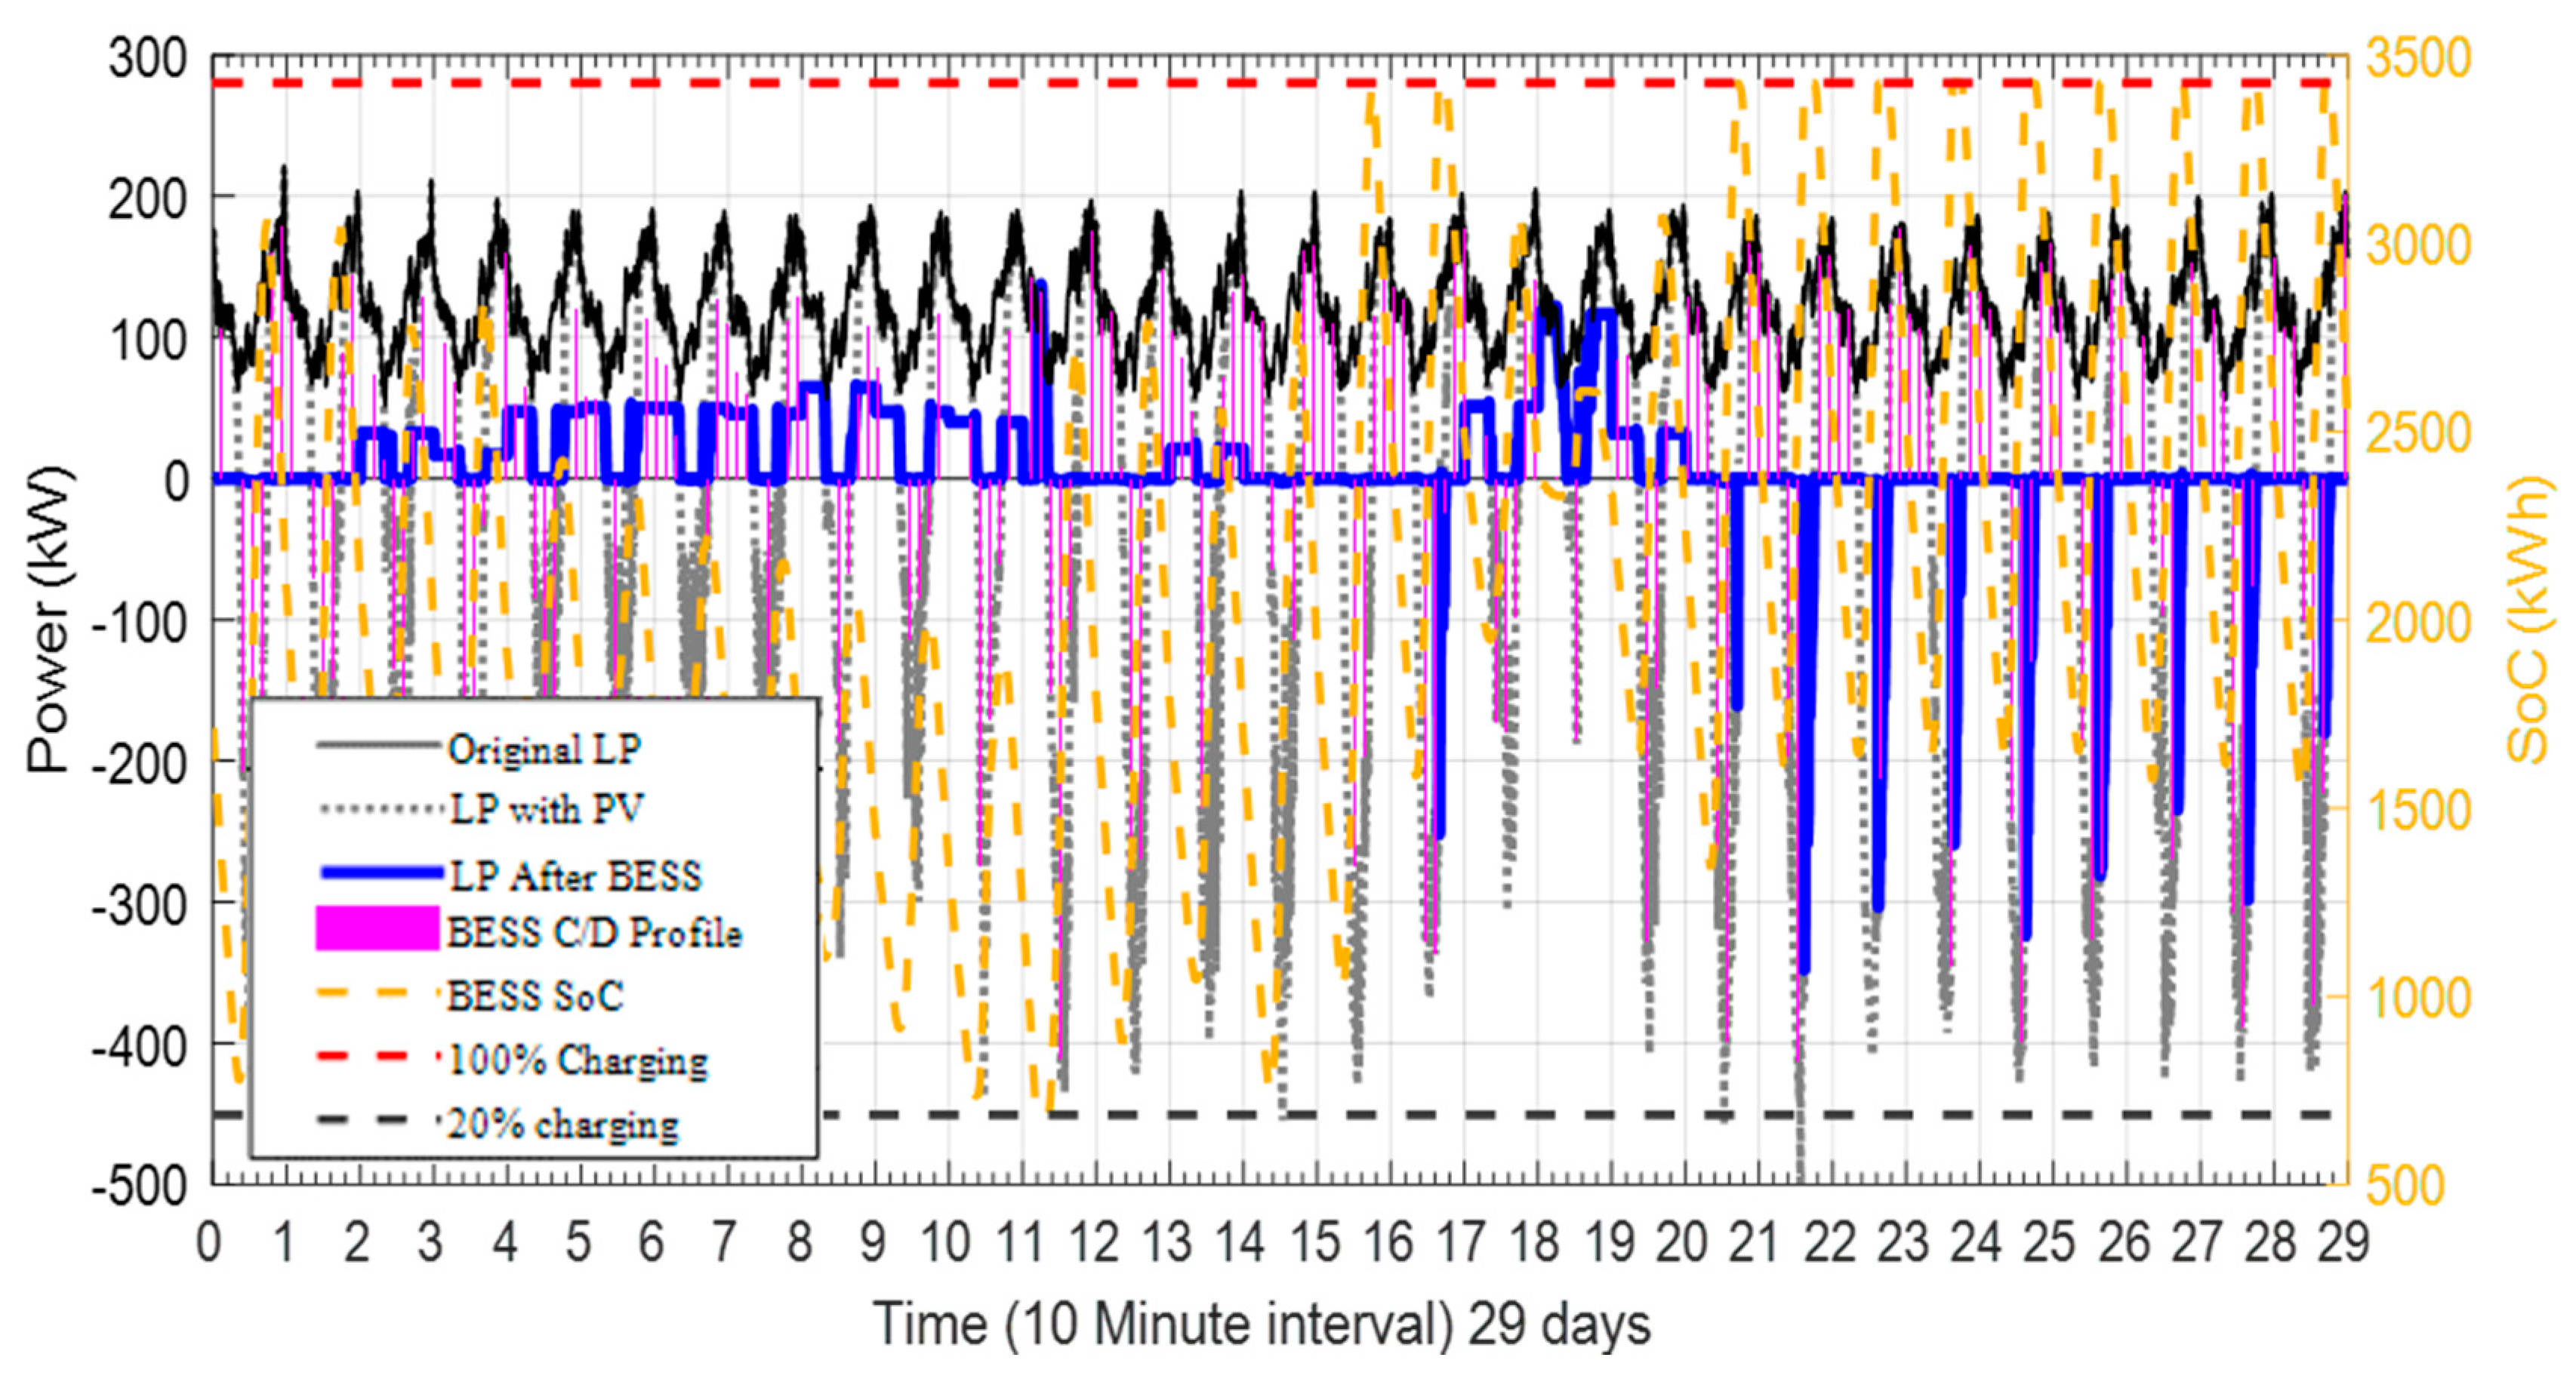
3.3. Peak Reduction Strategy (PRS) for Discharging BESS

The amount of stored energy in the BESS can be discharged based on different objectives. This paper considers discharging the BESS based on the peak reduction strategy (PRS). The main aim is to reduce the network peak demand by discharging the BESS stored energy for both RPFS and PVGS strategies, as discussed in the previous sections. The amount of energy stored in the BESS can be discharged equally with respect to the demand at peak hours. For this purpose, the first step is to find the day ahead equilibrium peak demand based on the amount of energy stored in BESS. Figure 8 shows the proposed algorithm to find this equilibrium peak demand. The formulation of equilibrium peak demand with BESS stored energy is shown in Equation (12). This equation determines the amount of energy that can be discharged to reduce the peak demand. It is based on the summation of power for day-ahead load profiles (DALP) above the equilibrium threshold line. DALP can be obtained from the methods and approaches that were presented in other research, e.g., [30,31]. The algorithm continues in an iterative manner to find the adequate threshold and equilibrium energy, which is equal to the BESS stored energy. The value of damping is set as 0.999 per iteration.
P e a k D e m a n d = { i n p t s { D A L P i t h r e s h o l d i ( D A L P i t h r e s h o l d i ) e l s e 0 i f ( P e a k D e m a n d B E S S S E × E f f d c ) t h r e s h o l d = t h r e s h o l d 1 o t h e r w i s e
Figure 9a shows the concept of RPFS charging strategies that stores the solar surplus energy during the reverse power flow period. The stored energy is then released during peak hours to reduce the network peak demand. It clearly indicates that the small amount of stored energy from reverse power flow could significantly help to reduce the daily peak demand. On the other hand, Figure 9b illustrates the PVGS charging strategy. The amount of energy that was generated from the PV system is stored at BESS and released back to the grid at peak hours. It can be observed from the figure that the battery size in PVGS is significantly larger than the one in RPFS. Hence, this study investigates both proposed charging strategies to determine the most effective strategy under various PV penetration scenarios.
Figure 10 shows the implementation of a rooftop PV system and BESS allocation. The process begins with initial data entry for load and PV profiles for each consumer (149 households) for a one year period with 10 min data intervals (144 samples). The test network under study is modeled in OpenDSS to establish base case characteristics with power flow simulation. The PV system is then integrated to the network with different penetration levels (25% to 100%). The results of power flow calculation after PV integration are obtained and stored in common-separated values file (CSV) format. The sizing and power rating of BESS are determined based on applied charging and discharging strategies. The obtained results of power flow calculations for before and after BESS, and PV integration are compared with the base case. This is to determine the most effective and adequate BESS sizing for each PV penetration level.

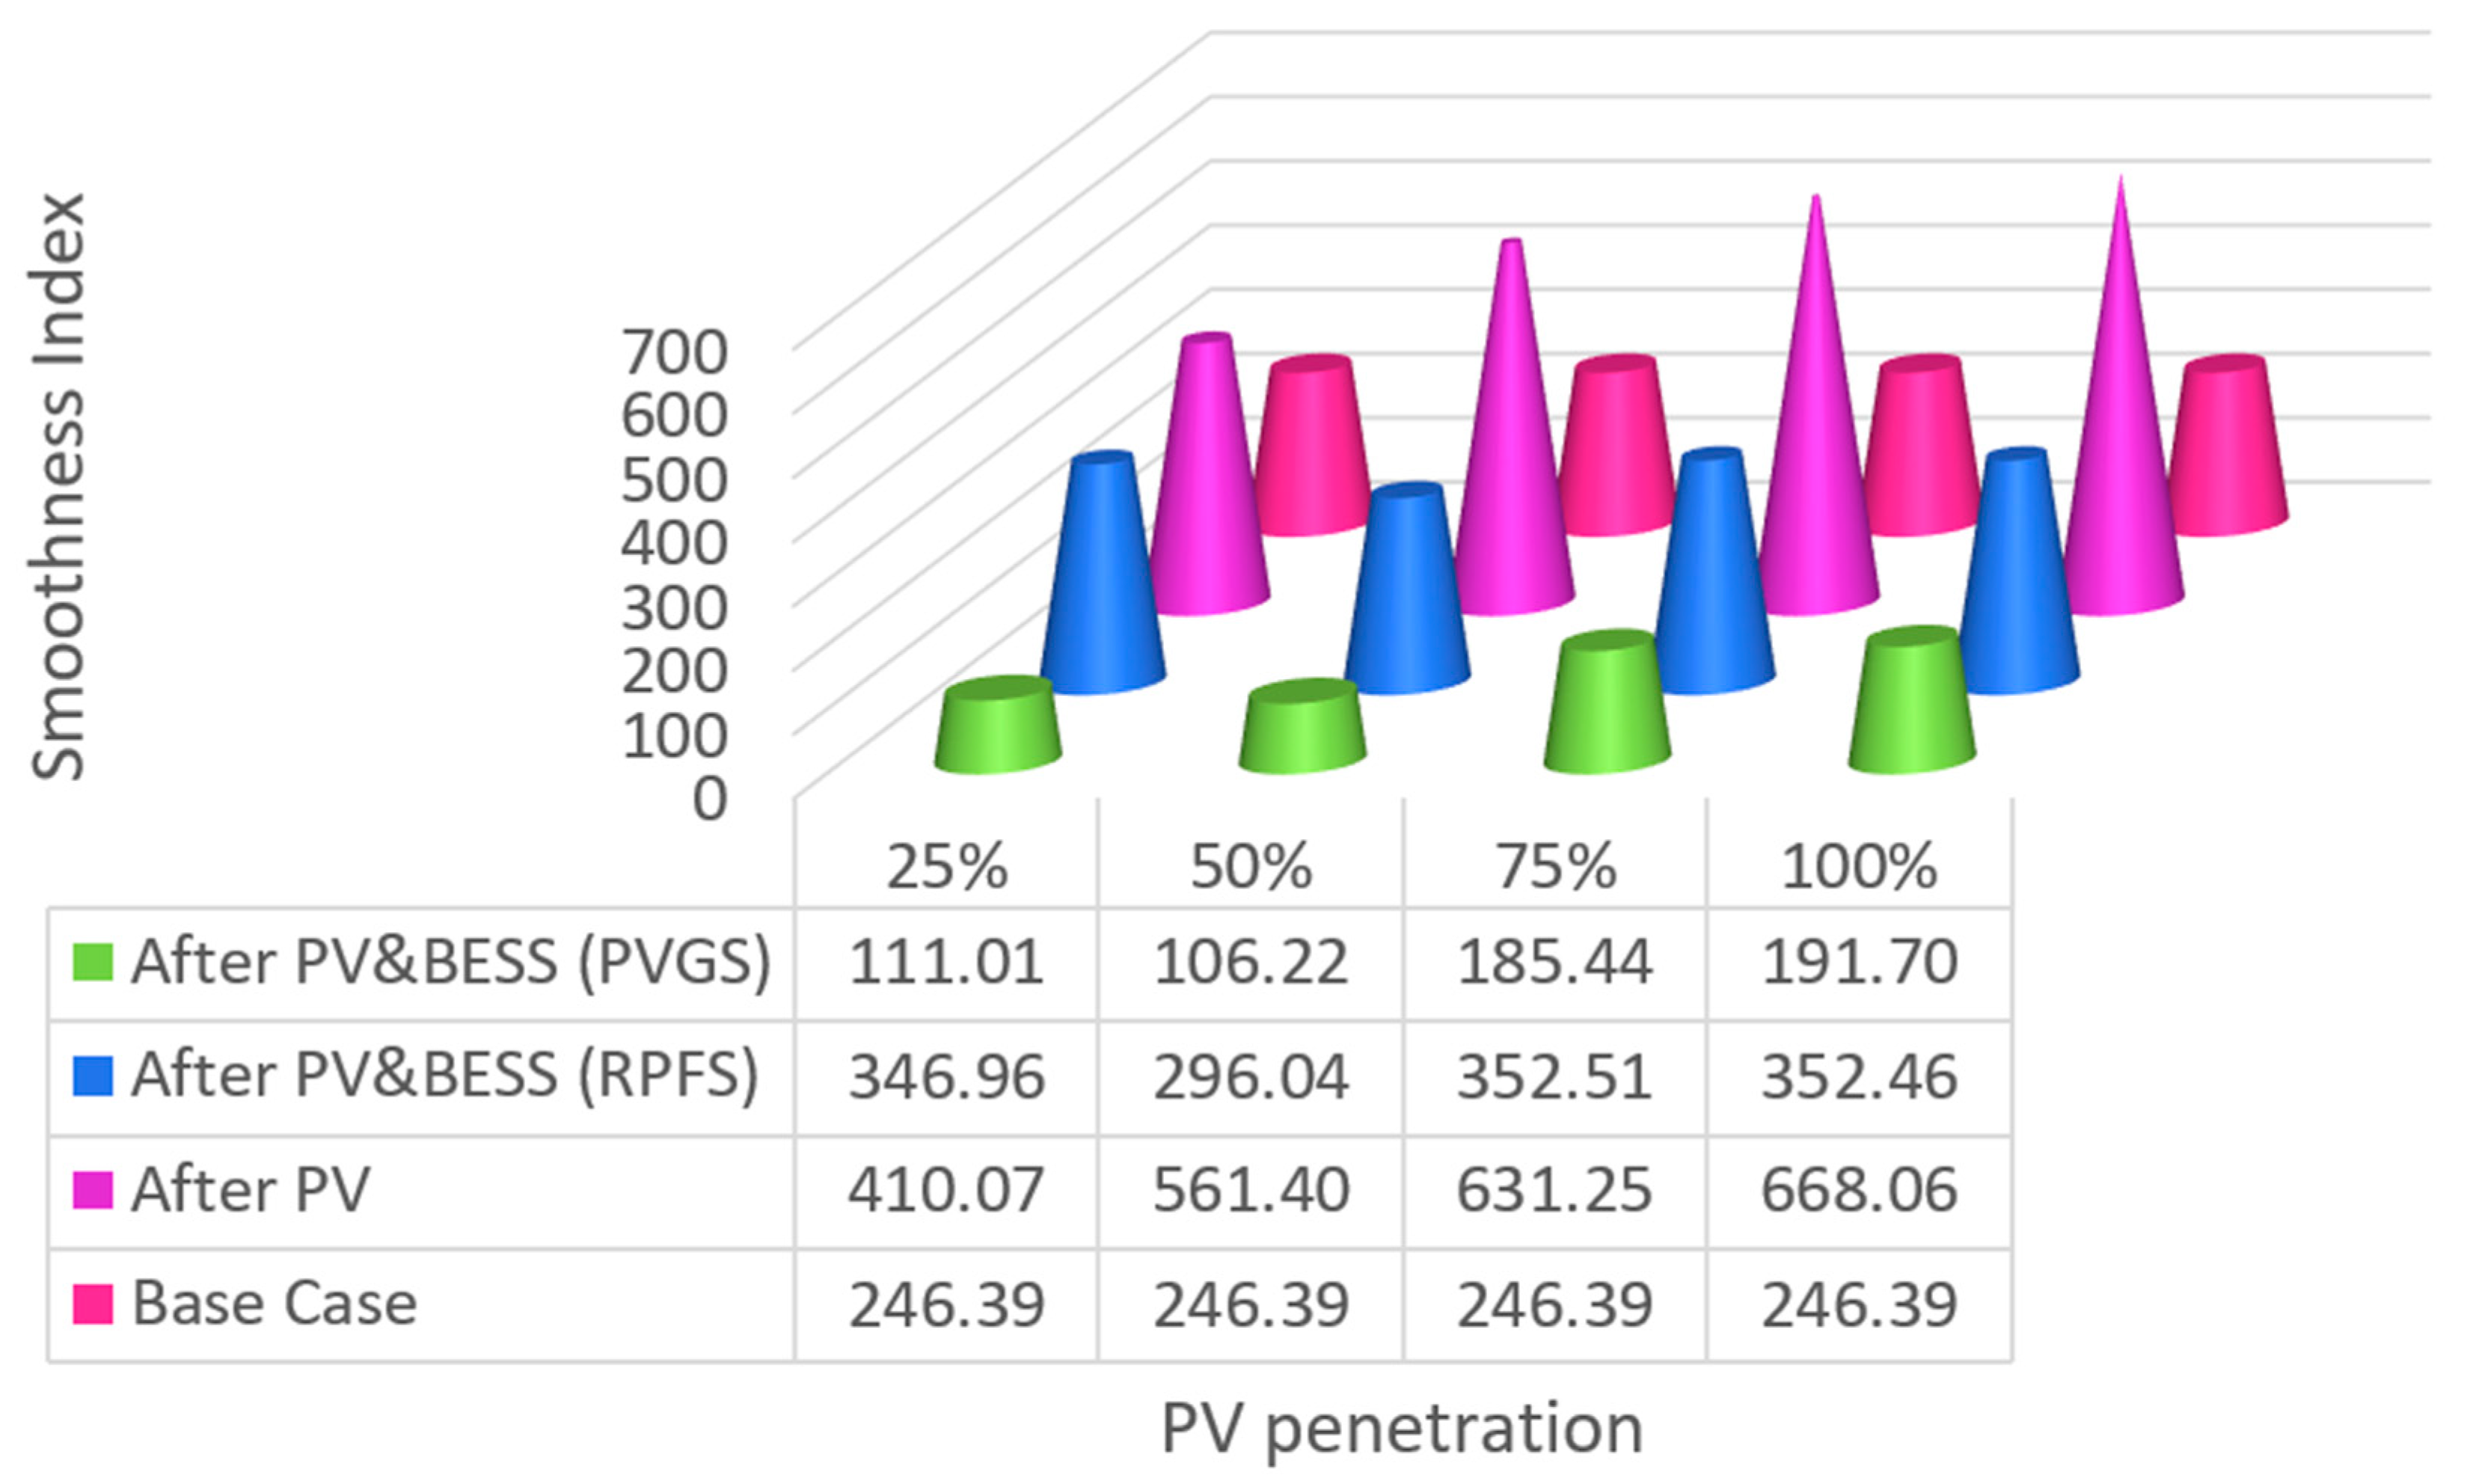
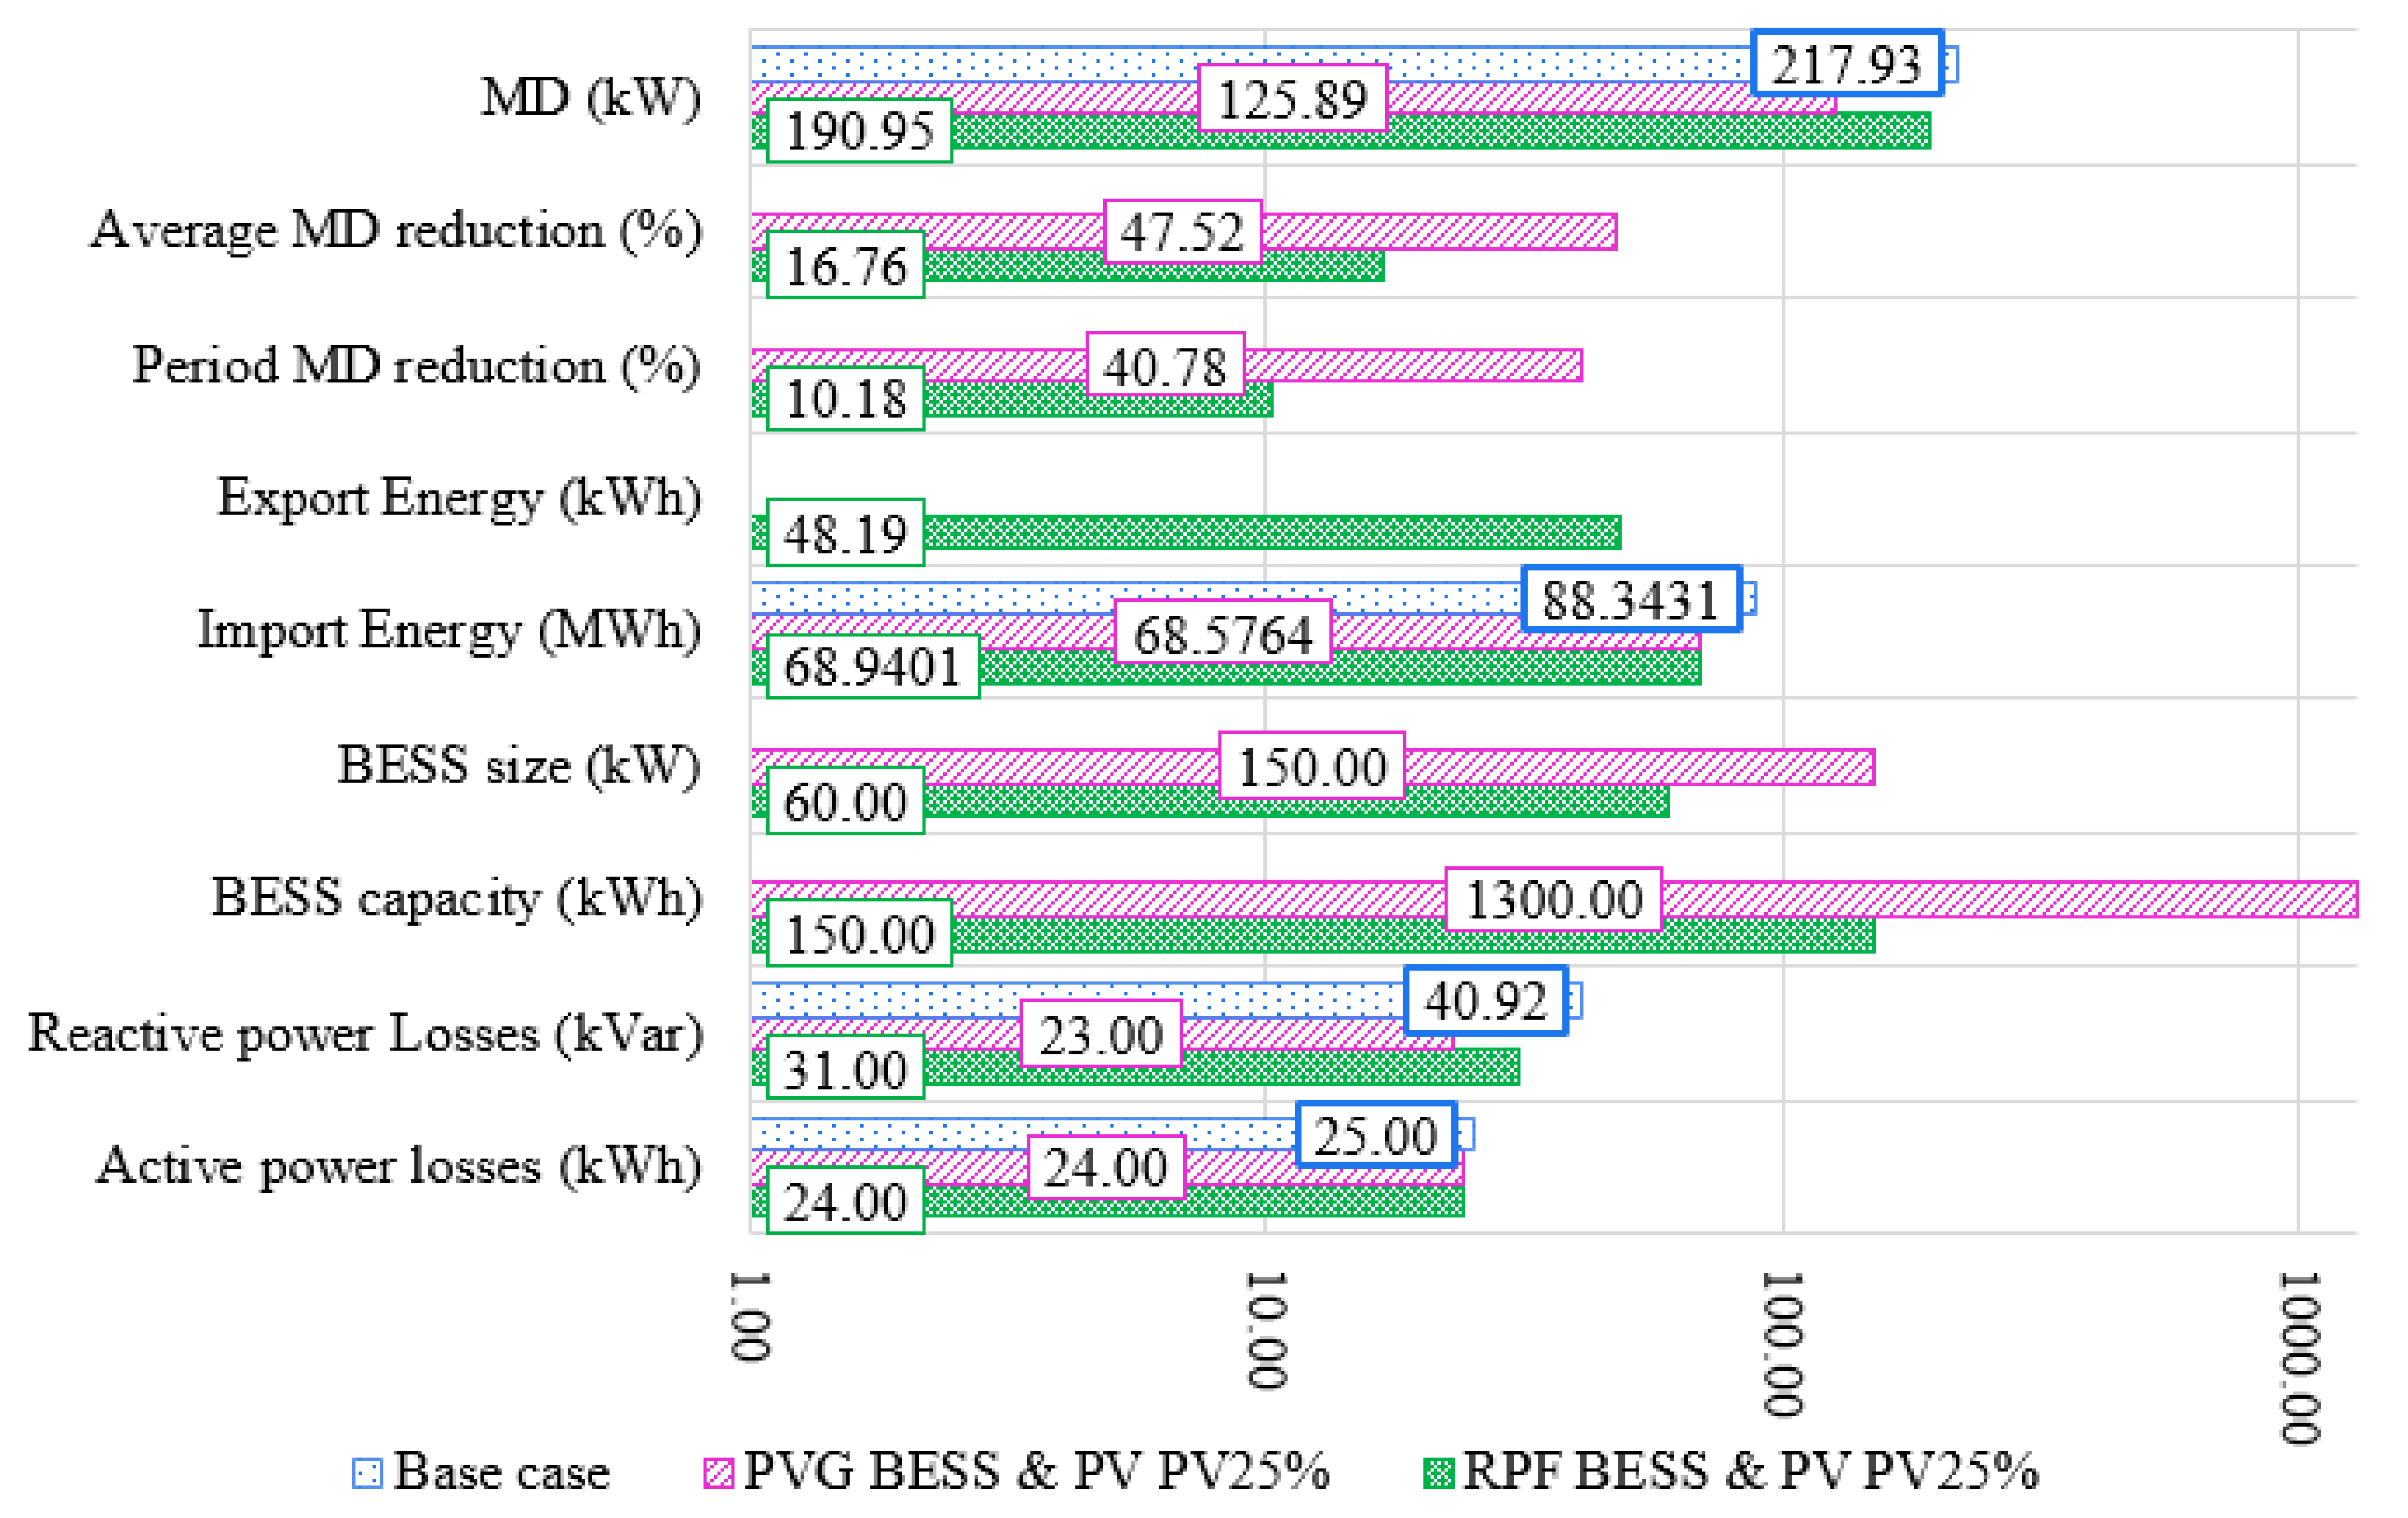
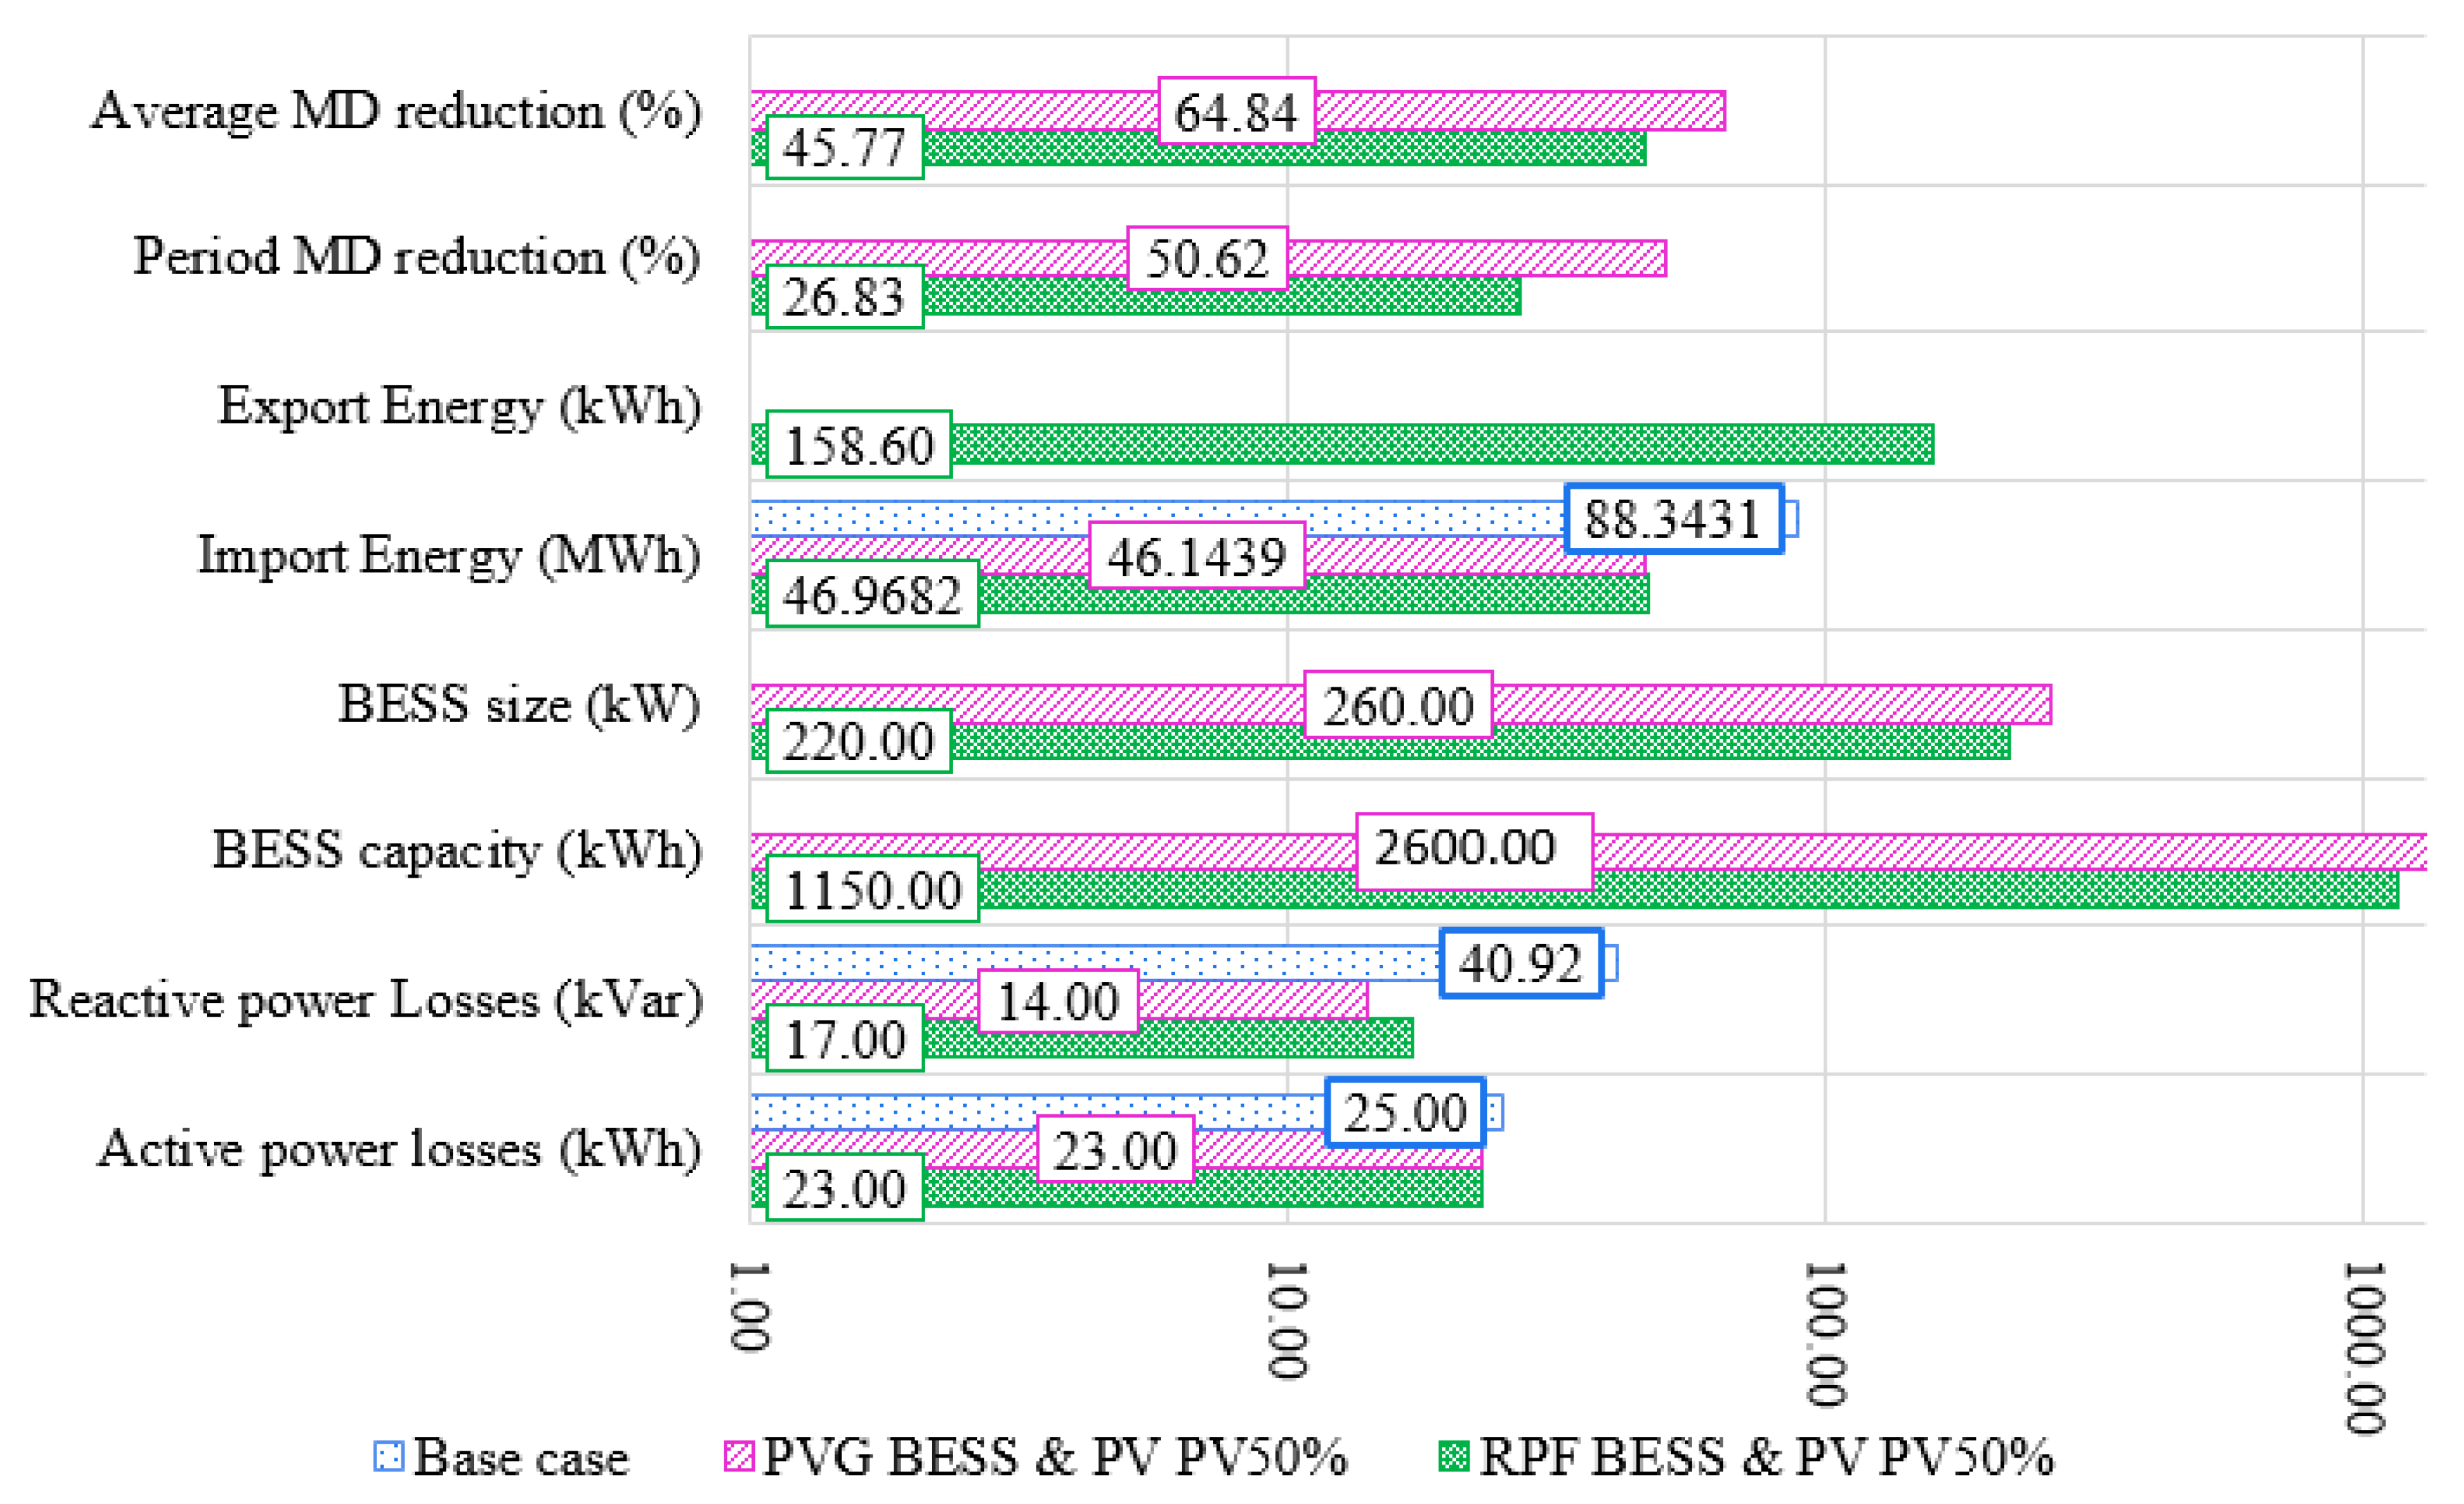
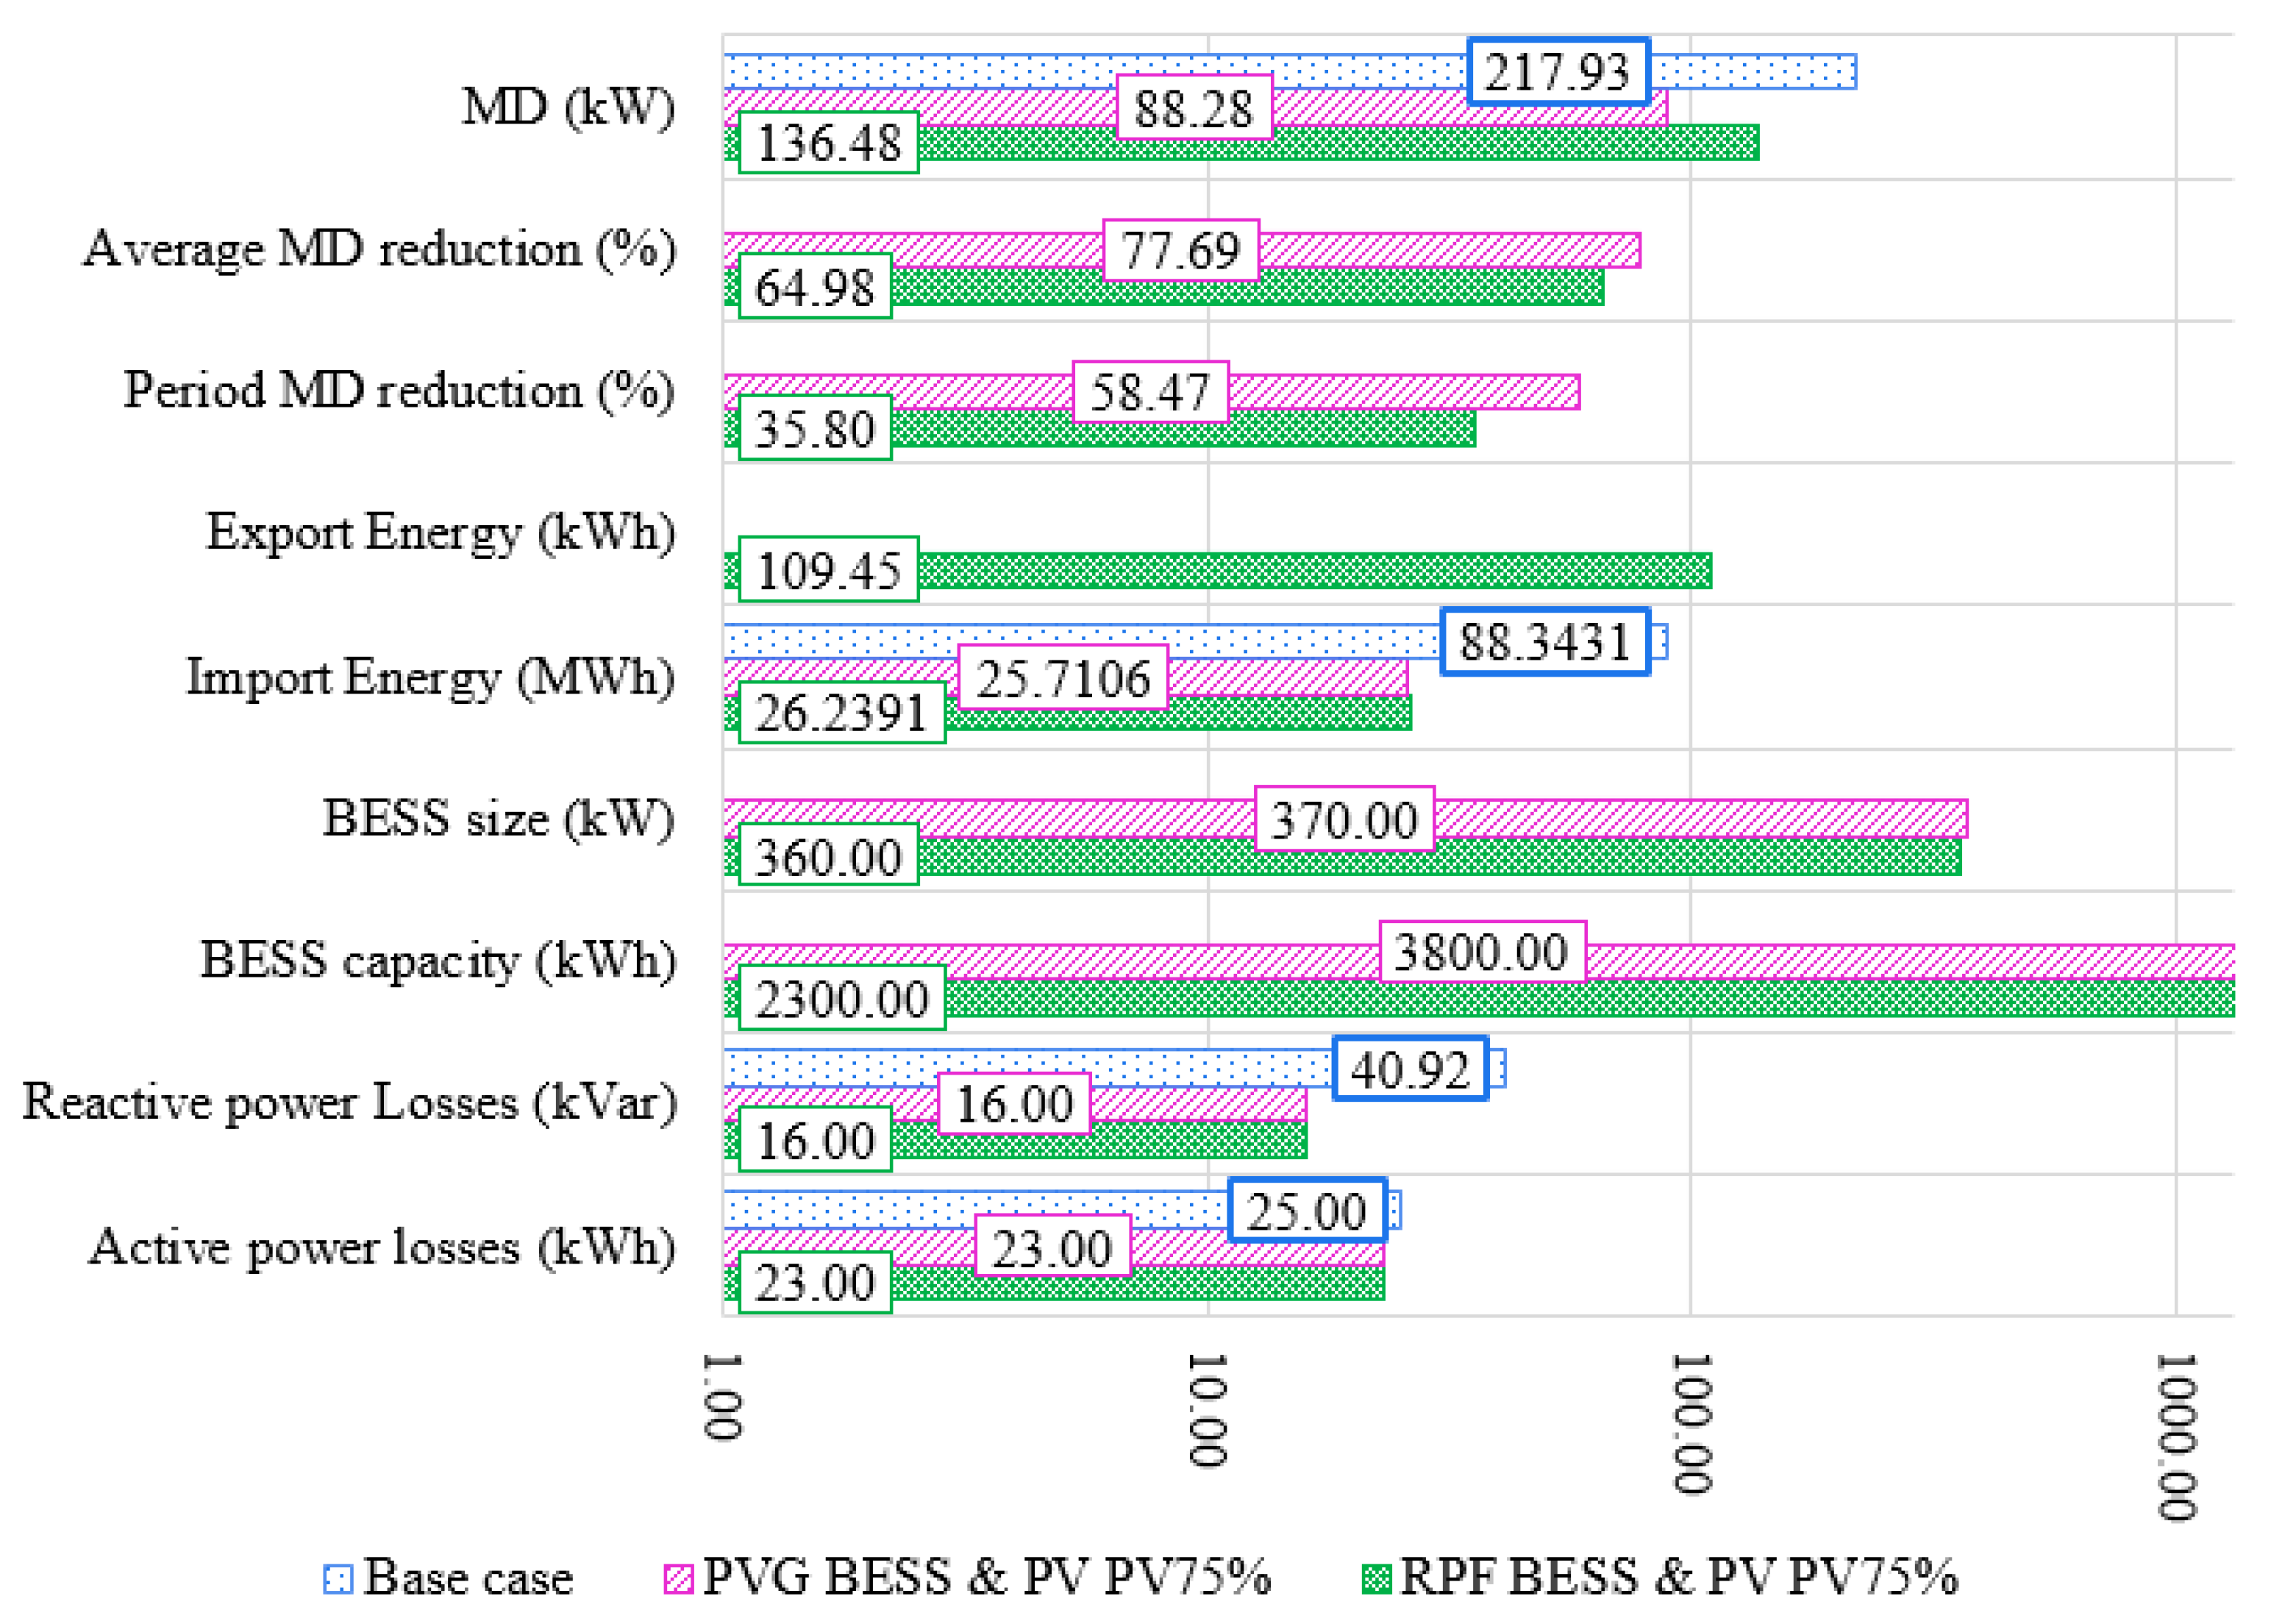
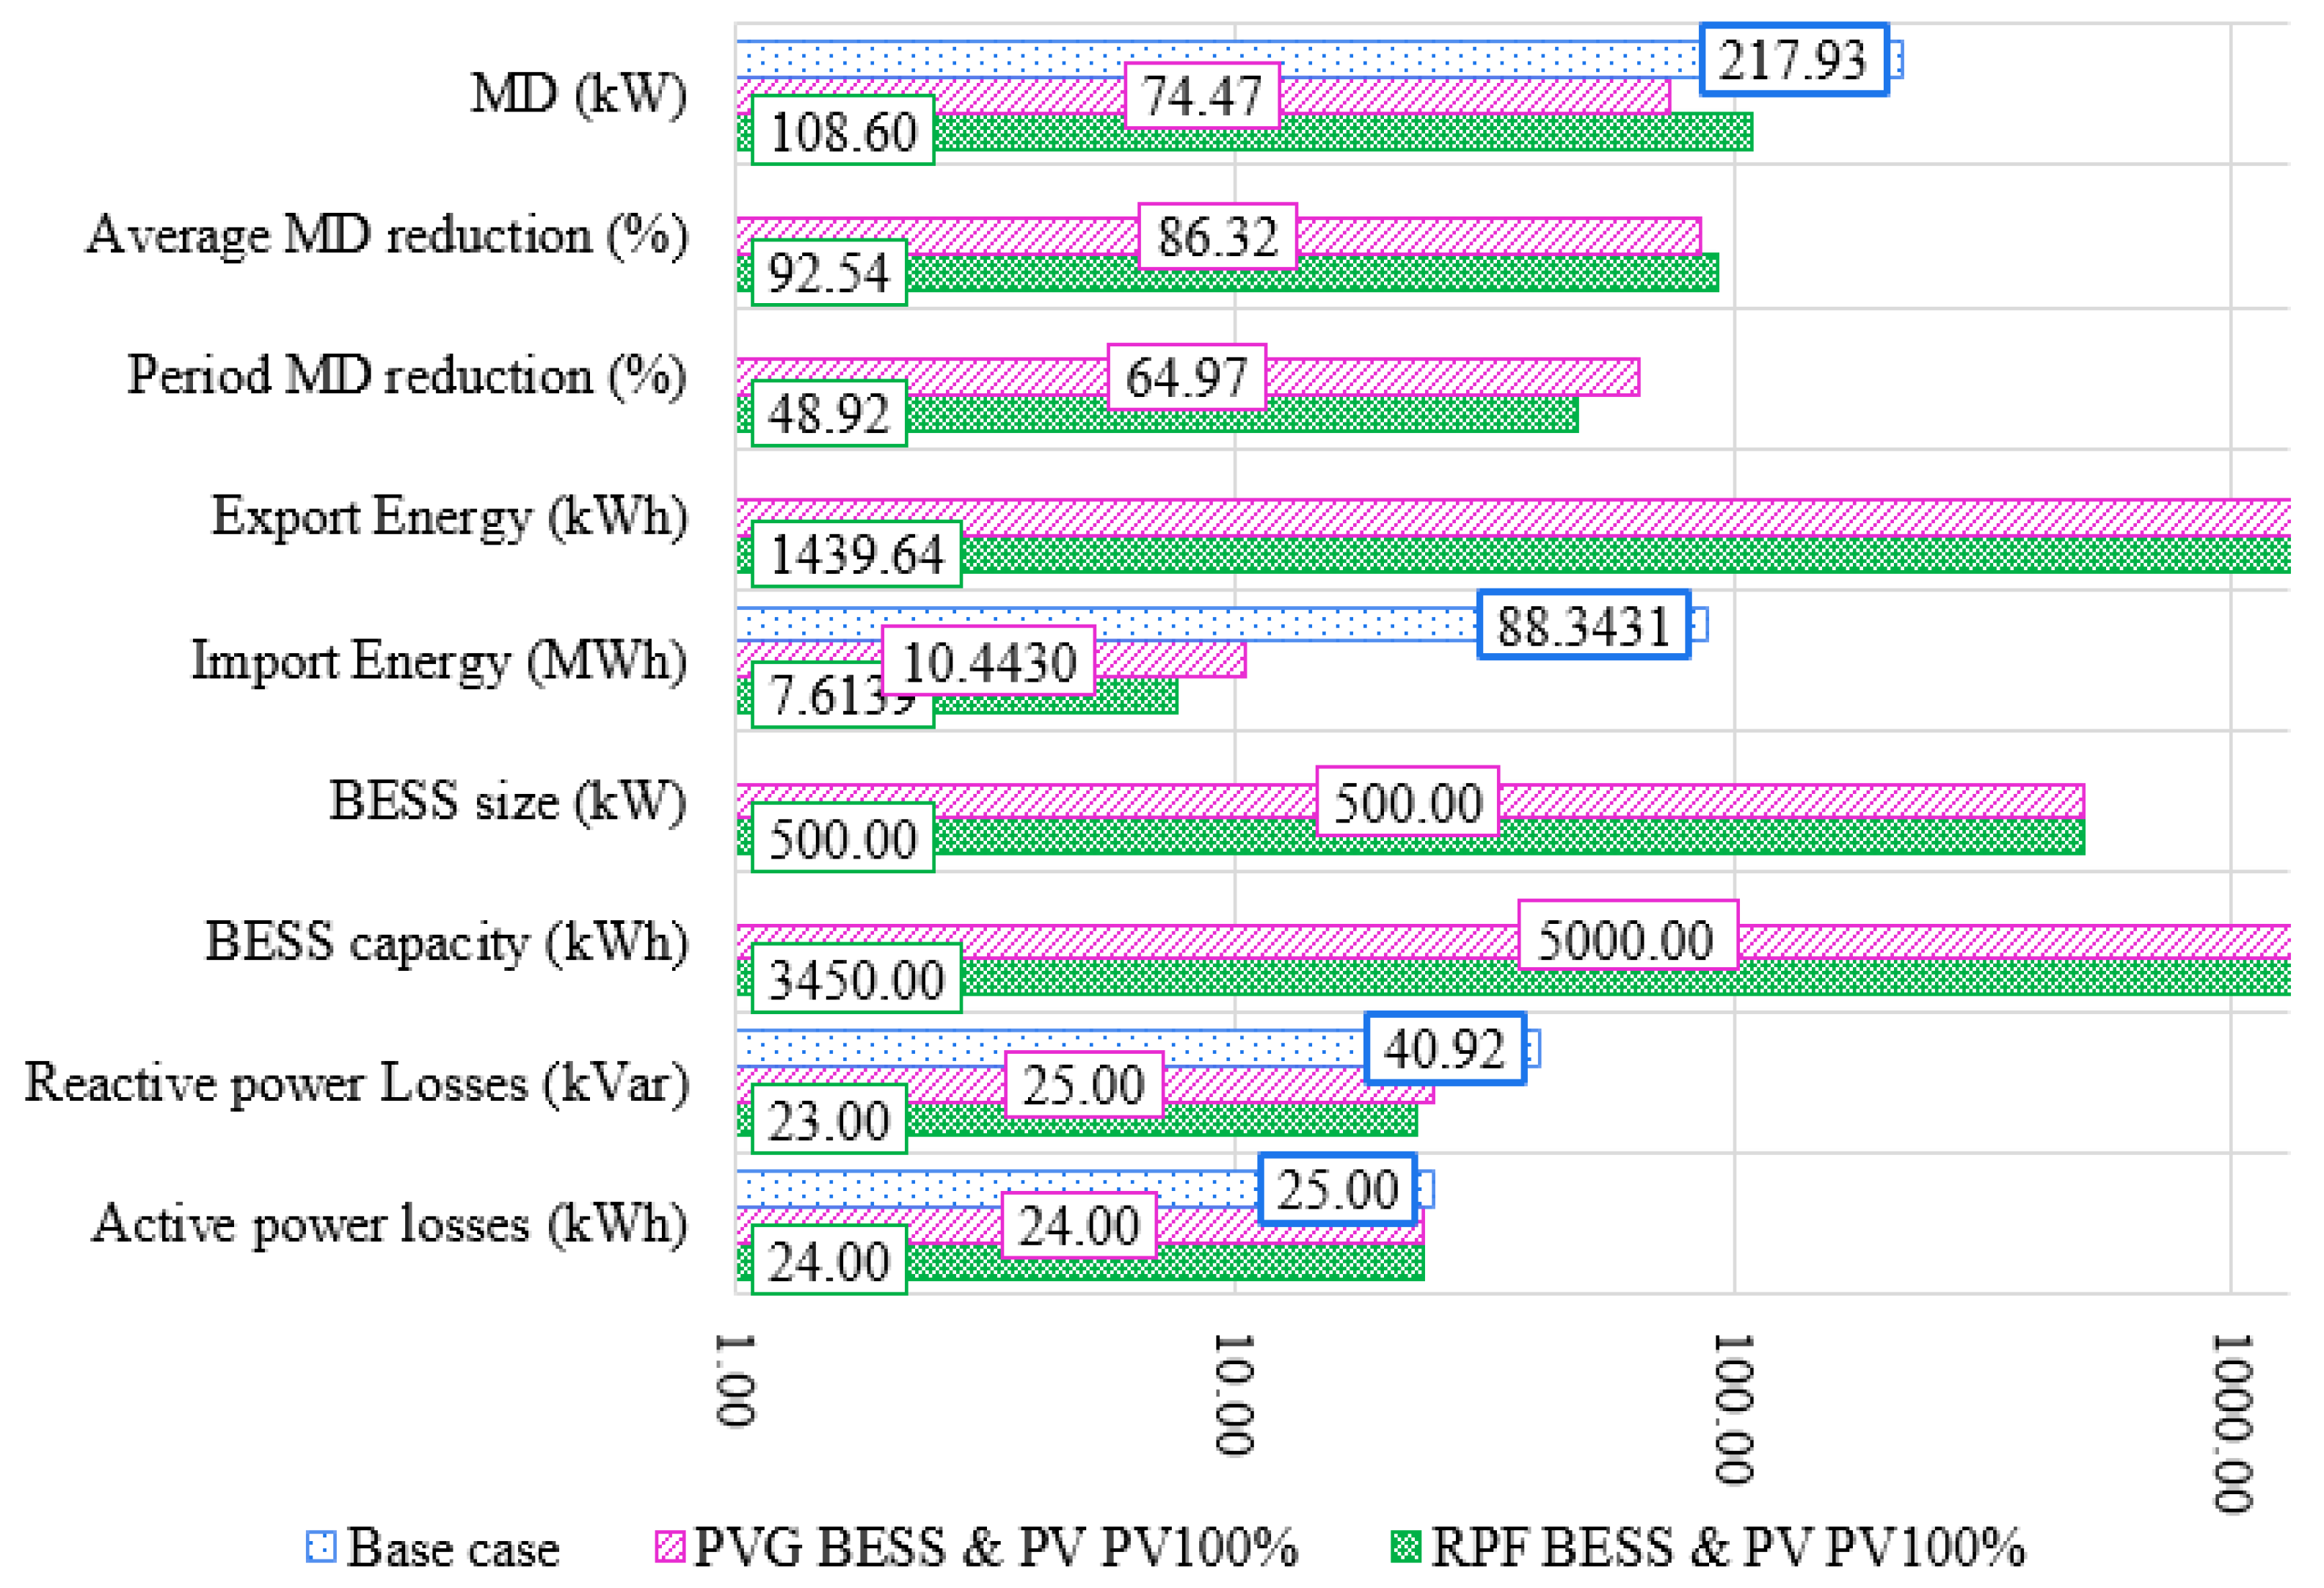
4. Results and Discussion of BESS Allocation

These strategies proposed for BESS integration are demonstrated through a residential LV distribution network in Malaysia. The proposed BESS is centrally installed at the distribution substation level. The case study aims to compare the BESS power rating and capacity, in the presence of residential PV systems. The time resolution of the sample data and duration of the study are the two important factors that significantly influence the design of BESS, which are demonstrated in the following analysis. Figure 11 and Figure 12 show the BESS design with the case study of PVGS and RFPS for seven consecutive days, 1–7 January 2016. The results show that the BESS capacity and power rating vary throughout the duration of the study. These can be seen in Table 3. Additional simulation days resulted in a more accurate BESS design. Hence, this paper utilized one year’s data from 2016 to design the optimum BESS for the test network with different PV penetration levels. Figure 13 shows the monthly BESS sizing for both RPFS and PVGS strategies. As expected, the BESS rating requirement for PVGS strategy is much higher than RPFS strategy. However, when the PV penetration increases, the BESS rating between these two strategies become less obvious. This is because the occurrence of reverse power flow will become more intense during high PV penetration levels.
Table 4 shows the strategies applied for charging (PVGS/RPFS) and discharging (PRS) of BESS design for 25% to 100% of PV penetrations. It shows that the BESS capacity and power ratings very much depend on the strategy and PV penetration levels that were considered. In addition, selecting higher resolution data sets is very important for designing the BESS ratings. Figure 14a shows the comparison of the BESS size with RPFS charging for two different time resolutions, i.e., 10 and 60 min. Figure 14b shows the PVGS charging and BESS size for different PV penetration level. It can be observed that the higher time resolution of input data resulted in a more accurate BESS sizing. Hence, this paper utilizes 10 min resolution data for the case studies.
In addition, this paper compares the outcome of various PV penetration scenarios based on the following factors: average maximum demand (MD) reduction, exported energy, imported energy, BESS size and capacity, reactive and active power losses, and MD reduction. The average MD reduction for BESS with under 25% PV integration is 9.5% for RPFS and 42% for PVGS, when compared with the base case. In addition, with 25% PV penetration, not much reverse power flow as observed. Hence, the size of the BESS in RPFS design is smaller than PVGS, but less MD reduction is obtained. Reduction of the net imported energy is 88.343 to 68.576 MWh with PVGS and 68.940 MWh with RPFS under 25% PV penetration scenario. Figure A1, Figure A2, Figure A3 and Figure A4 in Appendix A show the results for all of the scenarios considered.
Figure 15 illustrates the MD reduction in kW with different PV penetration level. It can be observed that the month of March has the maximum MD reduction for months during the year, approximately from 220 to 58 kW with RPFS and to 46 kW with PVGS.
The other important factor for designing BESS is the consideration of autonomy days (AD) to cope with the weather uncertainty. Figure 16 shows the BESS failures (blue line) due to inadequate BESS capacity. Discharging the BESS below its allowable limit is detrimental to its technical lifespan. Therefore, increasing the AD would address this problem satisfactorily. In this regard, this paper proposes optimum AD utilization to size the BESS. Figure 17 shows a similar case study as the one in Figure 16, but with increased AD from 20% to 40%. This helps the BESS to prevent sudden charging and stop discharging defects (spikes). In this case, by adjusting the AD to 40%, the capacity of the BESS increased from 3.45 to 4 MWh. The BESS power rating still remains the same at 500 kW. The results obtained show that the BESS successfully smoothes the load profile (LP) and lowers the peak demand.
This paper further proposes a smoothness index (SI) as an indicator to quantify the smoothness of the load profile. The SI is driven by the rate of changes of the load profile and can be written as Equation (13). Lower SI would indicate more smoothness load profile. The SI value for the flat load profile is equal to zero, which means there is no fluctuation in the load profile. More fluctuations in the load profile result in a higher SI. Figure 18 shows the SI comparison for the case study ranging from 25% to 100% of PV penetration for both PVGS and RPFS strategies. As can be seen from the figure, the SI for the base case remains constant with all of the PV penetration levels. It is interesting to observe that the SI index increased quite substantially after including the PV system. This mainly was caused by the intermittency of the PV system. After the BESS was integrated, the SI index reduced significantly due to the effects of BESS removing the PV intermittency. As expected, the results show that PVGS reduces the SI index more significantly than RPFS.
S I = t = 1 n p t s ( L P ( t ) L P ( t 1 ) ) 2 t = 1 n p t s L P ( t )
The main findings of the paper can be summarized as shown in Table 5. The BESS design for different PV penetration levels for both PVGS and RPFS are determined. The energy to power ratio of the BESS (Table 5) indicates that the battery is designed adequately based on the battery manufacturer requirements and range as reported in [25]. In general, it can be observed from the results, in terms of MD reduction, that the PVGS with 1300 kWh BESS can achieve 36.8% of MD reduction as compared to RPFS, with a significantly higher BESS of 3450 kWh, can only achieve a comparable 39.9% of MD reduction. In other words, the results show that PVGS is more suitable for lower PV penetration, and that RPFS has a reasonable MD reduction for higher PV penetration with a smaller battery size.

5. Conclusions

This paper focuses on the design of a BESS system at substation level for a residential area, which was installed with rooftop solar PV systems. Two BESS control strategies are considered, the first (RPFS) utilizes the amount of reverse power flow caused by the mismatch between solar generation and the demand consumption to reduce the network maximum demand. The second strategy (PVGS) aims to minimize the network peak demand by fully utilizing all the energy generated from the solar system. The finding suggests that at low PV penetrations, PVGS strategy can provide technical benefits to the network more cost effectively. On the other hand, as the PV penetration increases, the reverse power flow phenomenon will become more significant. By adopting the RPFS strategy, these amounts of reverse power energy can be utilized effectively to reduce the network maximum demand.

Author Contributions

Conceptualization, C.K.G. and M.S.; methodology, M.S. and C.K.G.; software, M.S.; validation, J.S. and M.T.A.; formal analysis, M.S. and W.H.T.; writing—original draft preparation, M.S. and C.K.G.; writing—review and editing, W.H.T.; supervision, C.K.G. All authors have read and agreed to the published version of the manuscript.

Funding

This research was funded by the Ministry of Higher Education Malaysia under the Fundamental Research Grant Scheme with grant number FRGS/2018/FKE-CeRIA/F00350.

Acknowledgments

The authors would like to gratefully acknowledge Universiti Teknikal Malaysia Melaka for providing the necessary facility support for this work.

Conflicts of Interest

The authors declare no conflict of interest.

Nomenclature

nhNumber of households
ndNumber of studied days
ntpsNumber of samples per daily profile
P i ( t ) Power at time t for i-th household
P A g r e g a t e d ( t ) Aggregated power at time t
E A g r e g a t e d ( d ) Aggregated energy for a day d
E T o t a l Total energy of the given period
P V i ( t ) PV power generation at time t for i-th household
P V A g r e g a t e d ( t ) Aggregated PV power generation at time t
P V E A g r e g a t e d ( d ) Aggregated PV energy generation for a day d
P V E T o t a l Total PV energy generation of the given period
B E S S S E ( d ) Stored energy of given day d
B E S S C a p a c i t y Battery energy storage system capacity in kWh
B E S S r a t i n g Battery energy storage system rating in kW
ADMDAfter-diversity maximum demand
BESSBattery energy storage system
C/DCharging and discharging
DALPDay-ahead load profile
DODDepth of discharging
LVLow voltage
LFLoad factor
PVGSPV generation strategy
PRSPeak reduction strategy
PVPhotovoltaic
RPFSReverse power flow strategy
SEDASustainable Energy Development Authority Malaysia
TNBMalaysia electricity distribution utility
VIVariability index

Appendix A

Figure A1. Comparison of PVGS and RPFS with 25% PV penetration level (January 2016).
Energies 13 04887 g0a1
Figure A2. Comparison of PVGS and RPFS with 50% PV penetration level (January 2016).
Energies 13 04887 g0a2
Figure A3. Comparison of PVGS and RPFS with 75% PV penetration level (January 2016).
Energies 13 04887 g0a3
Figure A4. Comparison of PVGS and RPFS with 100% PV penetration level (January 2016).
Energies 13 04887 g0a4

References

  1. Renewable Energy Policy Network for the 21st Century. Renewables 2019 Global Status Report; REN 21: Paris, France, 2019. [Google Scholar]
  2. Oh, T.H.; Hasanuzzaman, M.; Selvaraj, J.; Teo, S.C.; Chua, S.C. Energy policy and alternative energy in Malaysia: Issues and challenges for sustainable growth–An update. Renew. Sustain. Energy Rev. 2018, 81, 3021–3031. [Google Scholar] [CrossRef]
  3. Matschoss, P.; Bayer, B.; Thomas, H.; Marian, A.; Matschossa, P. The German incentive regulation and its practical impact on the grid integration of renewable energy systems. Renew. Energy 2019, 134, 727–738. [Google Scholar] [CrossRef]
  4. Alam, M.J.E.; Muttaqi, K.M.; Sutanto, D. Mitigation of Rooftop Solar PV Impacts and Evening Peak Support by Managing Available Capacity of Distributed Energy Storage Systems. IEEE Trans. Power Syst. 2013, 28, 3874–3884. [Google Scholar] [CrossRef] [Green Version]
  5. Hasheminamin, M.; Agelidis, V.; Salehi, V.; Teodorescu, R.; Hredzak, B. Index-Based Assessment of Voltage Rise and Reverse Power Flow Phenomena in a Distribution Feeder Under High PV Penetration. IEEE J. Photovolt. 2015, 5, 1–11. [Google Scholar] [CrossRef]
  6. Watson, J.D.; Santos-Martin, D.; Lemon, S.; Wood, A.R.; Miller, A.J.; Watson, N.R. Impact of solar photovoltaics on the low-voltage distribution network in New Zealand. IET Gener. Transm. Distrib. 2016, 10, 1–9. [Google Scholar] [CrossRef]
  7. Omran, W.A.; Kazerani, M.; Salama, M.M.A. Investigation of Methods for Reduction of Power Fluctuations Generated From Large Grid-Connected Photovoltaic Systems. IEEE Trans. Energy Convers. 2010, 26, 318–327. [Google Scholar] [CrossRef]
  8. Tie, C.H.; Gan, C.K. Impact of grid-connected residential PV systems on the malaysia low voltage distribution network. In Proceedings of the 2013 IEEE 7th International Power Engineering and Optimization Conference, PEOCO 2013, Langkawi Island, Malaysia, 3–4 June 2013; Institute of Electrical and Electronics Engineers (IEEE): Piscataway, NJ, USA, 2013. [Google Scholar] [CrossRef]
  9. Barcellona, S.; Piegari, L.; Musolino, V.; Ballif, C. Economic viability for residential battery storage systems in grid-connected PV plants. IET Renew. Power Gener. 2018, 12, 135–142. [Google Scholar] [CrossRef]
  10. Yunusov, T.; Frame, D.; Holderbaum, W.; Potter, B. The impact of location and type on the performance of low-voltage network connected battery energy storage systems. Appl. Energy 2016, 165, 202–213. [Google Scholar] [CrossRef] [Green Version]
  11. Alzahrani, A.; Alharthi, H.; Khalid, M. Minimization of Power Losses through Optimal Battery Placement in a Distributed Network with High Penetration of Photovoltaics. Energies 2019, 13, 140. [Google Scholar] [CrossRef] [Green Version]
  12. Kichou, S.; Skandalos, N.; Wolf, P. Evaluation of Photovoltaic and Battery Storage Effects on the Load Matching Indicators Based on Real Monitored Data. Energies 2020, 13, 2727. [Google Scholar] [CrossRef]
  13. Mazza, A.; Mirtaheri, H.; Chicco, G.; Russo, A.; Fantino, M. Location and Sizing of Battery Energy Storage Units in Low Voltage Distribution Networks. Energies 2019, 13, 52. [Google Scholar] [CrossRef] [Green Version]
  14. Koskela, J.; Rautiainen, A.; Järventausta, P. Using electrical energy storage in residential buildings–Sizing of battery and photovoltaic panels based on electricity cost optimization. Appl. Energy 2019, 239, 1175–1189. [Google Scholar] [CrossRef]
  15. Parra, D.; Patel, M.K. The nature of combining energy storage applications for residential battery technology. Appl. Energy 2019, 239, 1343–1355. [Google Scholar] [CrossRef]
  16. Achiluzzi, E.; Kobikrishna, K.; Sivabalan, A.; Sabillon, C.; Venkatesh, B. Optimal Asset Planning for Prosumers Considering Energy Storage and Photovoltaic (PV) Units: A Stochastic Approach. Energies 2020, 13, 1813. [Google Scholar] [CrossRef] [Green Version]
  17. Strbac, G.; Aunedi, M.; Konstantelos, I.; Moreira, R.; Teng, F.; Moreno, R.; Pudjianto, D.; Laguna, A.; Papadopoulos, P. Opportunities for Energy Storage: Assessing Whole-System Economic Benefits of Energy Storage in Future Electricity Systems. IEEE Power Energy Mag. 2017, 15, 32–41. [Google Scholar] [CrossRef]
  18. Li, X.; Hui, D.; Lai, X. Battery Energy Storage Station (BESS)-Based Smoothing Control of Photovoltaic (PV) and Wind Power Generation Fluctuations. IEEE Trans. Sustain. Energy 2013, 4, 464–473. [Google Scholar] [CrossRef]
  19. Worthmann, K.; Kellett, C.M.; Braun, P.; Grüne, L.; Weller, S.R. Distributed and Decentralized Control of Residential Energy Systems Incorporating Battery Storage. IEEE Trans. Smart Grid 2015, 6, 1914–1923. [Google Scholar] [CrossRef] [Green Version]
  20. De Sisternes, F.J.; Jenkins, J.; Botterud, A. The value of energy storage in decarbonizing the electricity sector. Appl. Energy 2016, 175, 368–379. [Google Scholar] [CrossRef] [Green Version]
  21. Zhuo, W.; Savkin, A.V.; Meng, K. Decentralized Optimal Control of a Microgrid with Solar PV, BESS and Thermostatically Controlled Loads. Energies 2019, 12, 2111. [Google Scholar] [CrossRef] [Green Version]
  22. Lamberti, F.; Calderaro, V.; Galdi, V.; Piccolo, A.; Graditi, G.; Francesco, L. Impact analysis of distributed PV and energy storage systems in unbalanced LV networks. In Proceedings of the 2015 IEEE Eindhoven PowerTech 2015, Eindhoven, The Netherlands, 29 June–2 July 2015; Institute of Electrical and Electronics Engineers (IEEE): Piscataway, NJ, USA, 2015. [Google Scholar] [CrossRef]
  23. Kodaira, D.; Jung, W.; Han, S. Optimal Energy Storage System Operation for Peak Reduction in a Distribution Network Using a Prediction Interval. IEEE Trans. Smart Grid 2020, 11, 2208–2217. [Google Scholar] [CrossRef]
  24. Baharin, K.A.; Rahman, H.A.; Hassan, M.Y.; Gan, C.K.; Sulaima, M.F. Quantifying Variability for Grid-connected Photovoltaics in the Tropics for Microgrid Application. Energy Procedia 2016, 103, 400–405. [Google Scholar] [CrossRef]
  25. Miranville, A. Annual Report 2018. AIMS Math. 2019, 4, 166–169. [Google Scholar] [CrossRef]
  26. Electricity Supply Application Handbook. Available online: https://www.tnb.com.my/assets/files/2020.04.14_ESAH_3.1.pdf (accessed on 14 June 2020).
  27. Shamshiri, M.; Gan, C.K.; Omar, R. Assessment of distribution networks performance considering residential photovoltaic systems with demand response applications. J. Renew. Sustain. Energy 2017, 9, 045502. [Google Scholar] [CrossRef]
  28. Gan, C.K.; Lau, Y.; Baharin, K.A.; Pudjianto. Impact of the photovoltaic system variability on transformer tap changer operations in distribution networks. CIRED Open Access Proc. J. 2017. [Google Scholar] [CrossRef] [Green Version]
  29. Datasheet for Lithium Strorage System TS. Available online: https://www.solarsense-uk.com/wp-content/uploads/2019/05/Tesvolt_TS_Storage_System_Solarsense.pdf (accessed on 14 June 2020).
  30. Asare-Bediako, B.; Kling, L.W.; Ribeiro, F.P. Day-ahead residential load forecasting with artificial neural networks using smart meter data. In Proceedings of the 2013 IEEE Grenoble Conference PowerTech, POWERTECH 2013, Grenoble, France, 16–20 June 2013; IEEE: Piscataway, NJ, USA, 2013. [Google Scholar] [CrossRef]
  31. Kong, W.; Dong, Z.Y.; Hill, D.J.; Luo, F.; Xu, Y. Short-Term Residential Load Forecasting Based on Resident Behaviour Learning. IEEE Trans. Power Syst. 2017, 33, 1087–1088. [Google Scholar] [CrossRef]
Figure 1. Single line diagram of residential LV distribution networks at Taman Impian Putra (BESS, battery energy storage system).
Energies 13 04887 g001
Figure 2. Typical daily residential load profile in Malaysia.
Energies 13 04887 g002
Figure 3. Normalized load profile of 149 households for 7 days in sequence.
Energies 13 04887 g003
Figure 4. PV generation profiles for five different solar variability types.
Energies 13 04887 g004
Figure 5. PV generation profiles and aggregated PV generation profile for the 365 days in 2016 that were captured at the Universiti Teknikal Malaysia Melaka (UTeM).
Energies 13 04887 g005
Figure 6. Probability of residential PV system capacity installed in Malaysia.
Energies 13 04887 g006
Figure 7. The BESS design and charging process for both reverse power flow strategy (RPFS) and PV generation strategy (PVGS) strategies.
Energies 13 04887 g007
Figure 8. Peak reduction strategy algorithm (discharging algorithm).
Energies 13 04887 g008
Figure 9. BESS operation for peak reduction strategy (PRS) concept under (a) RPFS and (b) PVGS.
Energies 13 04887 g009
Figure 10. The implementation flowchart of PV and BESS allocation.
Energies 13 04887 g010
Figure 11. Seven-day load profiles for 50% PV penetration with PV and BESS for PVGS (1–7 January 2016).
Energies 13 04887 g011
Figure 12. Seven-day load profiles for 50% PV penetration with PV and BESS for RPFS (1–7 January 2016).
Energies 13 04887 g012
Figure 13. Comparison of BESS sizing within the year 2016: (a) PVGS and (b) RFPS.
Energies 13 04887 g013
Figure 14. Comparison of BESS sizing for different time resolutions for strategies: (a) PVGS and (b) RFPS.
Energies 13 04887 g014
Figure 15. Maximum demand reduction in kW for both scenarios: (a) PVGS and (b) RFPS.
Energies 13 04887 g015
Figure 16. Load profiles for 100% PV penetration and BESS for RPFS with AD = 0.2 (1–29 February 2016).
Energies 13 04887 g016
Figure 17. Load profiles for 100% PV penetration and BESS for RPFS with AD = 0.4 (1–29 February 2016).
Energies 13 04887 g017
Figure 18. Smoothness index (SI) comparison before and after BESS in the presence of PV generation for PVGS.
Energies 13 04887 g018
Table 1. Size and types of cable used in the network.
Branch SectionType of Cable
FromTo
500 kVA transformerBus 24 × 500 mm2 PVC/PVC Al
Bus 2Piecing connection A,B,C,D185 mm2 PVC/PVC Al
Piecing connection A,B,C,DNodeAerial Bundle Cable (ABC) 3 × 185 mm2 + 120 mm2 Al
NodeHouse16 mm2 PVC /PVC Cu
Table 2. Feeder loading condition.
Type of HouseSingle StoryTerraceType of Network
Newly Developed NetworkMatured Network
ADMD (kW)3 kW5 kWTotal loading (kW)Total feeder loading (%) (185 mm2)Total loading (kW)Total feeder loading (%) (185 mm2)
Feeder A371510143.7125.654.6
Feeder B6409641.7120.052.2
Feeder C0339943.0123.853.8
Table 3. Comparison of the duration of study for BESS design.
ItemOne WeekOne MonthOne Year
PVGSRPFSPVGSRPFSPVGSRPFS
BESS Capacity (kWh)20708952554112626001150
BESS Power Rating (kW)245185255190260220
Table 4. BESS capacity and power rating for both strategies with a one year simulation period.
25%50%75%100%
BESS Capacity (kWh)PVGS1300260038005000
RFPS150115023003450
Difference (%)88564031
BESS Power Rating (kW)PVGS150260370500
RFPS60220360500
Difference (%)601530
Table 5. Comparison of the results.
Penetration Level (%)Discharging StrategyCharging StrategyBESS Capacity (kWh)BESS Power Rating (kW)Energy to Power RatioMD Reduction (%)Difference in MD Reduction (%)
25PRSPVGS13001508.736.832.1
RPFS150602.54.7
50PRSPVGS26002601038.313.5
RPFS11502205.224.8
75PRSPVGS380037010.340.15.7
RPFS23003606.434.4
100PRSPVGS50005001046.26.3
RPFS34505006.939.9

