Article

Machine Learning-Based Approach to Predict Energy Consumption of Renewable and Nonrenewable Power Sources

1
Department of Computer Engineering, Jeju National University, Jeju-si 63243, Korea
2
Power Technology Development Team, HODI, Mapo Ssangyong Geum Building 3f, Mapo-gu, Seoul 04178, Korea
3
Jeju Regional Headquarter, Korea Power Exchange, 81, Ora-NamRo, Jeju 63144, Korea
*
Authors to whom correspondence should be addressed.
Energies 2020, 13(18), 4870; https://doi.org/10.3390/en13184870
Submission received: 30 July 2020 / Revised: 7 September 2020 / Accepted: 11 September 2020 / Published: 17 September 2020
(This article belongs to the Special Issue Soft Computing Techniques in Energy System)

Abstract

:
In today’s world, renewable energy sources are increasingly integrated with nonrenewable energy sources into electric grids and pose new challenges because of their intermittent and variable nature. Energy prediction using soft-computing techniques plays a vital role in addressing these challenges. As electricity consumption is closely linked to other energy sources such as natural gas and oil, forecasting electricity consumption is essential for making national energy policies. In this paper, we utilize various data mining techniques, including preprocessing historical load data and the load time series’s characteristics. We analyzed the power consumption trends from renewable energy sources and nonrenewable energy sources and combined them. A novel machine learning-based hybrid approach, combining multilayer perceptron (MLP), support vector regression (SVR), and CatBoost, is proposed in this paper for power forecasting. A thorough comparison is made, taking into account the results obtained using other prediction methods.

Graphical Abstract

1. Introduction

In recent years, countries worldwide have actively researched the power sector. Deep learning technology has brought new opportunities and challenges to power load forecasting [1]. The power system’s main task is to provide a safe and reliable power supply for the consumers. Therefore, energy forecasting is of considerable significance to the power sector. Accurate power load forecasting is of great importance for saving energy, reducing power generation costs, and improving social and economic benefits. With the development of power reform and the deepening of power marketization, energy load forecasting has become more critical in the power system. It is also essential to increase power demand forecasting accuracy for the power system’s stable and efficient operation. Nonrenewable energy sources such as coal, oil, natural gas, fossil fuels, nuclear, minerals, etc., cannot be regenerated in a short period, and their consumption rate far exceeds their regeneration rate. For instance, fossil energy is not only limited and will eventually dry up, but also its price is increasing day by day [2]. Moreover, once these energy resources are exhausted, they cannot be mined anymore in the future. Therefore, the world is shifting towards renewable energy sources such as wind energy, waterpower, and solar energy. They do not emit greenhouse gases, so they will not increase the risk of the greenhouse effect. Renewable energy has become the mainstream preferred energy solution [3]. Solar and wind energy can gradually keep pace with traditional energy sources. At the same time, due to the fact that renewable energy is affordable, low-carbon, environmentally friendly, stable, and reliable, consumers in emerging markets and enterprises have continuously increased their demand for renewable energy [4]. These driving factors and demand trends are particularly evident in developed and developing regions around the world. The utilization efficiency of renewable energy needs to be improved, and the system’s absorption capacity needs to be improved. With the transformation of the global energy industry, renewable energy is gradually replacing traditional fossil energy. This transformation means that energy systems and power plants must improve the accuracy of renewable energy generation forecasts, optimize each desired power generation asset’s output, and coordinate the overall production of multiple sites and equipment. At the same time, it is necessary to ensure the economy of doing so and the impact on the stability of the power grid.
Renewable energy sources are increasingly integrated with nonrenewable energy sources into electric grids to meet energy demand requirements [5]. The historical data of power load are an ordered collection sampled and recorded at a particular time interval, so they are a time series. As a branch of artificial intelligence, soft computing technology aims to gain more reliable and accurate systems and has proven to be an excellent tool for solving various energy applications problems. We have used machine learning to predict the integrated energy consumption of renewable and nonrenewable power sources. A novel machine learning-based hybrid approach, combining multilayer perceptron (MLP), support vector regression (SVR), and CatBoost, is proposed in this paper for power forecasting. As a case study, we obtained the actual energy consumption time series data of Jeju Island. Jeju Island is the largest island in Korea. It has a total population of over 690,000 people, an area of 1826 square kilometers, with a humid climate. Jeju Energy Corporation (JEC) has set the goal to liberate electricity imported from the Korean Peninsula and use only renewable energy to meet all power demands [6]. The plan includes replacing fossil fuel generators with renewable energy technologies, and that renewable energy will be generated within the island. JEC aims to achieve this in three main steps. The first consists of turning Jeju’s small island (Gapa Island) into a test lab, making it the first carbonless island. Second is increasing the rate of renewable energy in the energy supply by 50% by 2020, and third is turning Jeju Island into a free of carbon city by 2030 [7].
The contributions of this paper are threefold:
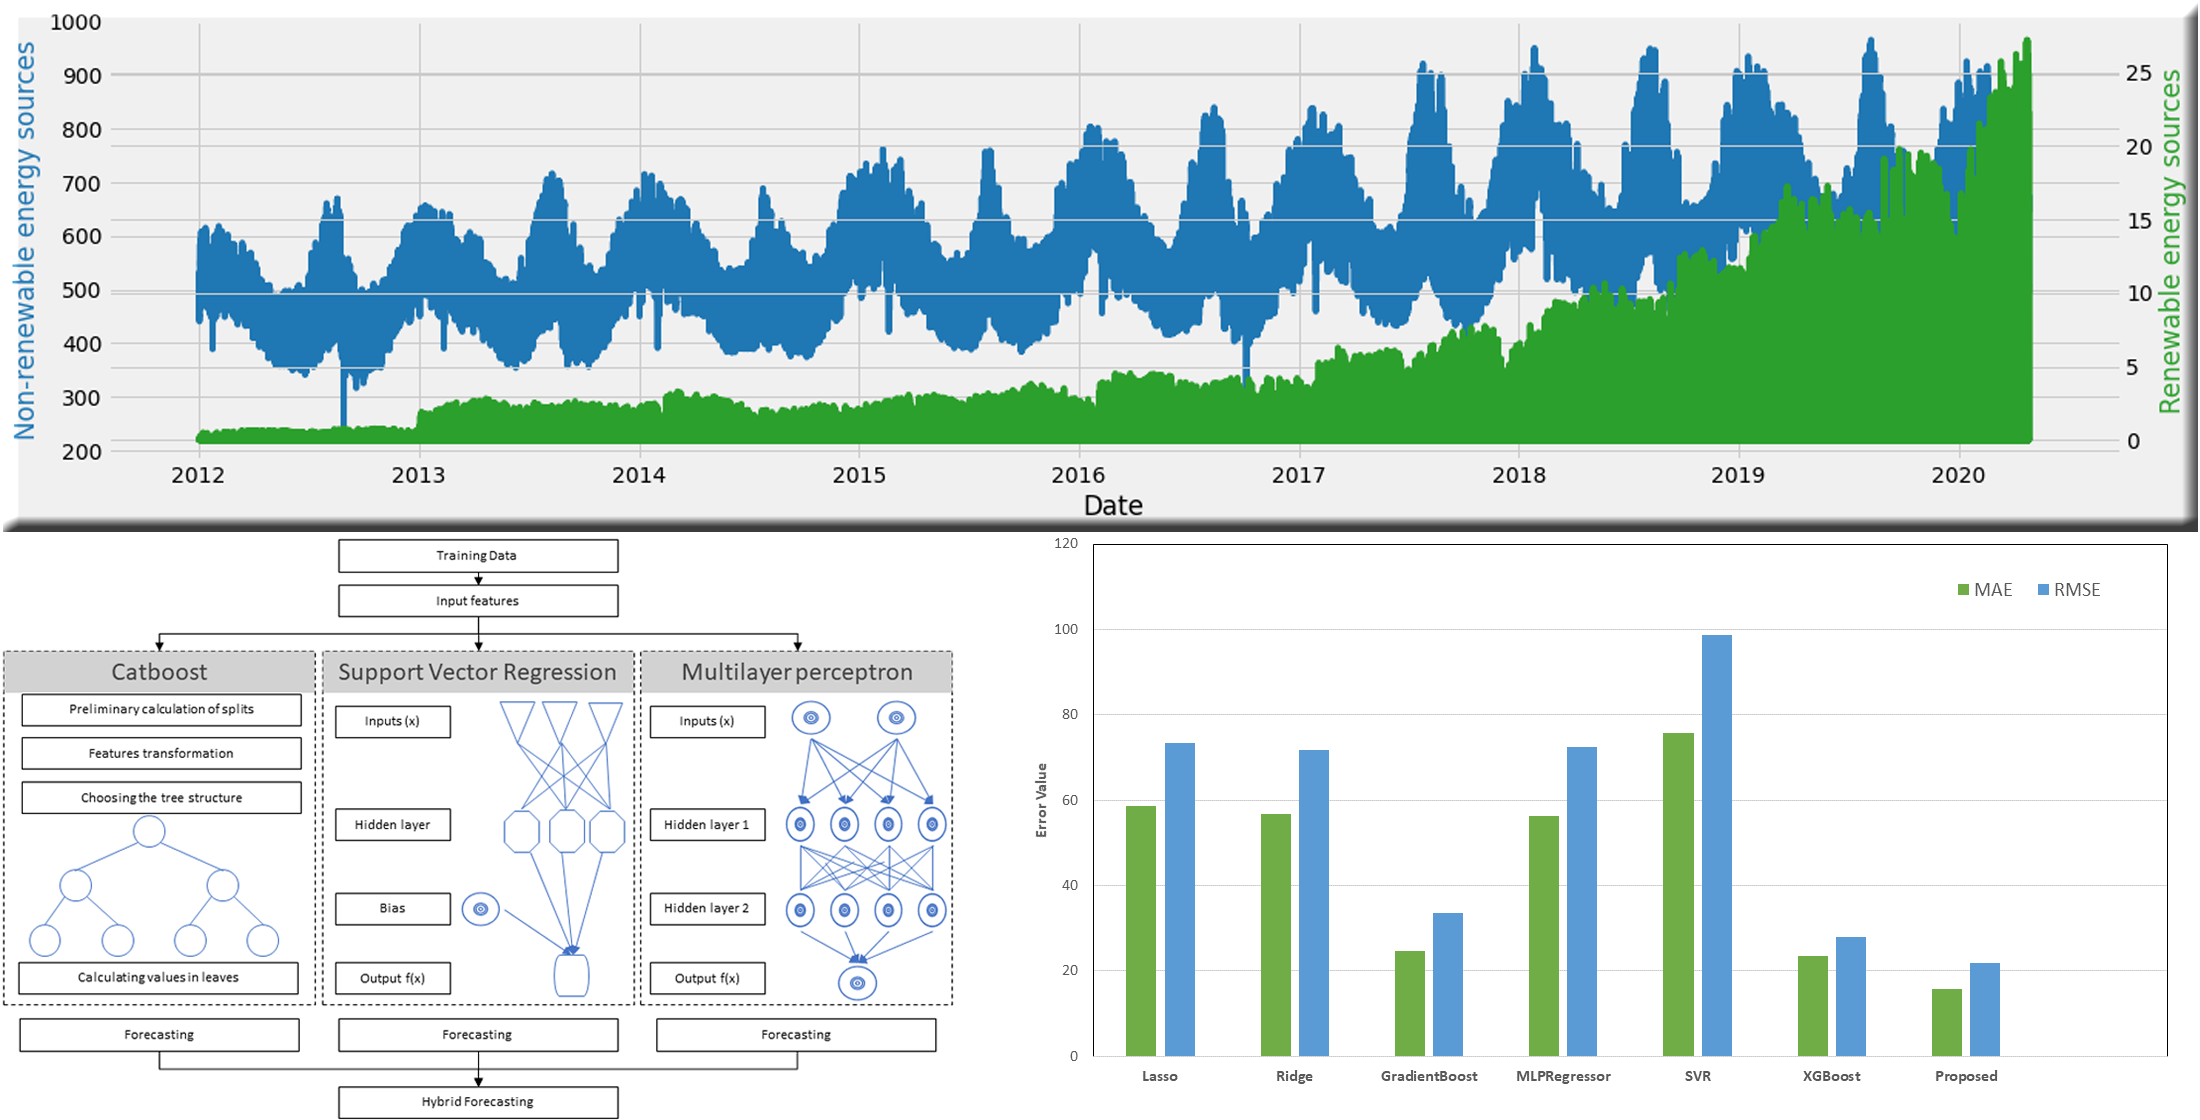
  • the data analysis of power consumption from renewable energy sources and nonrenewable energy sources;
  • to propose a novel hybrid approach for energy consumption forecasting;
  • to compare the proposed model with prediction algorithms.
The paper’s remainder is organized as follows: Section 2 discusses publications, articles, and related materials. Section 3 describes the process flow for predicting machine learning-based energy consumption and presents energy sources for data collection. Section 4 describes the proposed hybrid model and ML algorithms. Section 5 describes exploratory data analysis, preprocessing, and a training test division. Section 6 presents the performance results of the proposed model and analyzes the evaluation metrics. This paper is concluded in Section 7 after the discussion of experiments.

2. Related Works

The integration of solar energy to the energy system is increasing; hence, predicting solar power generation is becoming increasingly important to control energy quality and improve system reliability. The article by Asrari et al. [8] proposed using a hybrid prediction algorithm to estimate sunlight per hour. However, considering the competitiveness and burden of accounting, many cost-effective and cost-improvement methods and model structures have been developed. In the first stage, gradient-descent optimization is used to meet the artificial neural network’s initial criteria. In the second stage, a meta-optimization model called an ensemble empirical mode decomposition (EEMD) is developed to find the optimal artificial neural networks.
Ensemble empirical mode decomposition and support vector machine degradation were used by Hu et al. [9] to improve the quality of wind speed prediction utilizing a hybrid method. Improved prediction results were obtained using the proposed method. Ahmad et al. [10] presented an overview of the evolution of power forecasting results using artificial intelligence techniques such as support vector machine and the artificial neural network (ANN). They concluded that the hybrid method is more suitable for predicting energy consumption. The technical document by Rui et al. [11] uses the advanced cuckoo search-extreme learning machine (ELM) model as the base model. It combines the standard genetic algorithm and the auto-regressive and moving average model to create a hybrid model. It can be seen that the improved cuckoo search-extreme learning machine model, following the order of experimental analysis, overcomes the performance limitations; that is, the initial weight gain is not easy to produce; it is variable and stable. Based on the results, the distance between the test input vector and the distribution matrix was calculated. A possible predictive sample space was generated, and the upper and lower prediction limits of the predicted values were provided. The proposed method could avoid major single point prediction failures by improving the accuracy of the performance prediction range.
Predicting solar radiation in photovoltaic power generation is essential for integrating natural renewable energy into electrical utility grids. The study by Paiva et al. [12] evaluated two machine learning algorithms that can predict sunlight all day: multi-gene programming and multilayer perceptron. The results indicated that site definitions, prediction ranges, and error calculations affect the accuracy of the model. In [13], Ju et al. considered a degradation cost model and proposed a discreet two-tier management system with a hybrid energy storage system. They represented the problem in a way that solves low operating costs by taking into account the energy fluctuations of renewable energy. They also developed a more economical cost model for batteries and supercapacitors to turn long-term capital costs into short-term operational problems. The proposed energy management system is used for microgrids that include common points of connection with the public grid, hybrid energy storage systems, renewable energy systems, and total load. They performed a simulation and found that various energy storage devices, including super batteries and capacitors, can be used for multiple decision-making goals in different tiers. However, they did not consider combining random planning and the proposed energy management system with renewable energy prediction and modeling uncertainty in renewable energy production in their current work. Based on the weather observation and forecast dataset by the Beijing Meteorological Administration, wavelet noise reduction and CatBoost-based models were used by Li et al. [14] for short-term weather forecasting.
The work by Catalao et al. [15] proposed a new hybrid technology for predicting short-term wind power in Portugal. Their proposed method was based on the fusion of a wavelet transform, particle swarm optimization, and an adaptive network-based fuzzy inference system. The proposed technique is newly effective in applying wind energy predictions. The average results are better than the other approximations, allowing average calculation time. Therefore, the results confirm the validity of their proposed short-term wind energy prediction method. Yu et al. [16] introduced a new import selection program that combines the group method of data handling and SVR to predict short-term hourly load. After configuring the group method of data handling networks multiple times under the same experimental conditions, they also set the network numerous times. Each entry was different due to the random distribution of the training dataset. Only one network configuration could produce biased input selection results. To demonstrate the implementation of the method proposed in the experimental evaluation, they used hourly Korean datasets to compare the estimated effects for one hour, one day, and one week. Experimental results show that the expected performance of the proposed method outperforms other methods.
Zhaojing et al. [17] provided a hybrid ensemble deep learning model for probabilistic low voltage loads, whose predictions were consistent and generally reliable. Nonlinear relation diagrams were mapped with deep training models and deep belief networks. Five-way bagging and boosting algorithms were used to improve network stability. Various transmission methods were used in the installation process to ensure the site’s safety during the loading and unloading process. The accuracy of the augmented Dickey–Fuller test confirmed this. The experimental results show the enormous potential of real applications in the distribution network and significantly impact decision-making and assumptions.

3. Machine Learning-Based Energy Load Forecasting

Machine learning is widely used in the energy sector for energy load forecasting [18]. The machine learning method selects the load of the past period of time as the training sample, constructs a suitable network structure, and uses a particular training algorithm to train the network to meet the accuracy requirements. Figure 1 shows the flow of our proposed forecasting strategy. We took the two power sources and combined nonrenewable and renewable energy sources with the date and time. Renewable energy consists of fossil fuel (FF)-based power sources. Nonrenewable energy is obtained from small-sized solar energy generation without any contract called behind the meter (BTM), photovoltaic (PV), or generated solar energy and wind power (WP). We performed exploratory data analysis (EDA) to analyze and see the trends in data. After preprocessing, we split the data into training and test sets. Then, we trained the hybrid model, which consists of three base models, CatBoost, support vector regressor (SVR), and multilayer perceptron (MLP). We used the test dataset to validate the model. We used different error metrics to analyze the performance of the proposed model. Then, we got the forecasting results and compared them with existing ML models.

Power Sources

We used the energy consumption data of Jeju, South Korea, as the test data. Figure 2 represents the sources of data collection. Jeju Energy Corporation (JEC) is an energy distributor for Jeju province. Jeju energy corporation plans to actively promote and advance the photovoltaic power generation business along with wind power. It gets the electricity from two significant sources: Korea Electric Power Corporation (KEPCO) and Korea Power Exchange (KPX). These organizations are responsible for the electricity market’s operations, power system, and real-time dispatch to support the government’s planning and policy-making efforts. KEPCO provides renewable energy sources. It has three primary sources; small-sized solar energy generation without any contract called behind the meter (BTM), PV generated solar energy, and WP. KPX provides the energy sources generated from nonrenewable sources such as FF-based power sources.

4. Proposed Hybrid Ensemble Model

The main goal of machine learning is to train a stable model that performs well in all aspects, but the actual situation is often not ideal. Ensemble learning is the process of combining multiple models to obtain a better and more comprehensive strong supervised model [19]. The underlying idea of ensemble learning is that even if a particular weak classifier gets a wrong prediction, other weak classifiers can improve the mistakes. A novel machine learning-based hybrid approach, combining MLP, SVR, and CatBoost, is proposed in this paper to forecast energy consumption. Figure 3 shows the structure of the proposed hybrid model. It trains the CatBoost, MLP, and SVR models and ensembles the forecasting results of these models.

4.1. CatBoost

CatBoost is the open-source machine learning library. It belongs to the boosting algorithm family, similar to the XGBoost and LightGBM algorithms [20]. It is an improved implementation under the gradient boosting decision tree algorithm framework. This framework is based on a symmetric decision tree algorithm with few parameters, support for categorical variables, and high accuracy. It is mainly used to solve the problems efficiently and reasonably with processing the categorical features. CatBoost is composed of categorical variablesand boost, in addition to dealing with gradient bias and prediction shift problems. It improves the accuracy of the algorithm and the generalization ability [21]. High model quality can be obtained without parameter adjustment, and outstanding results can be obtained using default parameters, reducing the time spent on parameter adjustment. It also supports categorical variables without preprocessing non-numerical features.

4.2. Support Vector Regression

Support vector regression (SVR) is a machine learning method based on statistical learning theory. It is a learning method specialized in limited sample prediction [22]. The support vector regression method realizes the inductive principle of structural risk minimization. It can well solve small sample problems, nonlinearity, high dimensionality, and local minima, so it has been widely used in load forecasting. Support vector regression can be used for ultra-short and short-term load forecasting and medium- and long-term load forecasting. Its advantages are global optimization, simple structure, and strong generalization ability. However, the quality of SVR prediction results largely depends on its learning parameters, and the prediction accuracy is greatly affected by the parameters.

4.3. Multilayer Perceptron

There are many neural network variants, such as backpropagation neural networks [23], probabilistic neural networks [24], convolutional neural networks [25], time recurrent neural networks [26], long short-term memory networks [27], etc. However, the most straightforward and original neural network is the multilayer perceptron. The most typical MLP includes three layers: an input layer, a hidden layer, and output layer. The different layers of the MLP neural network are fully connected. Any neuron in the upper layer is connected to all neurons in the lower layer [28]. An MLP network takes a feature vector as input, passes the vector to the hidden layer, calculates the result through the weight and activation function, and passes it to the next layer until it is finally moved to the output layer. The MLP algorithm is trained to calculate and learn the weights, synapses, and neurons of each layer. y 0 is given as the input for the first layer to obtain the k t h output using Equation (1).
y k = σ ( i = 1 n ( w i , k y i + w k ) )
where the sigmoid function is σ , w is the weight, and k denotes the multilayer perceptron model’s output value, whereas y k is the output of the MLP. i indicates the number of hidden layer from one to n. w i , k is the connection between the i t h hidden layer neuron and the k t h output layer neuron.

5. Forecasting

Load forecasting is used to explain how much electricity power companies need to supply to balance demand [29]. We used the combined load data of renewable and nonrenewable energy sources to forecast energy consumption. We performed exploratory data analysis, pre-processing, and the train-test split before training of the model.

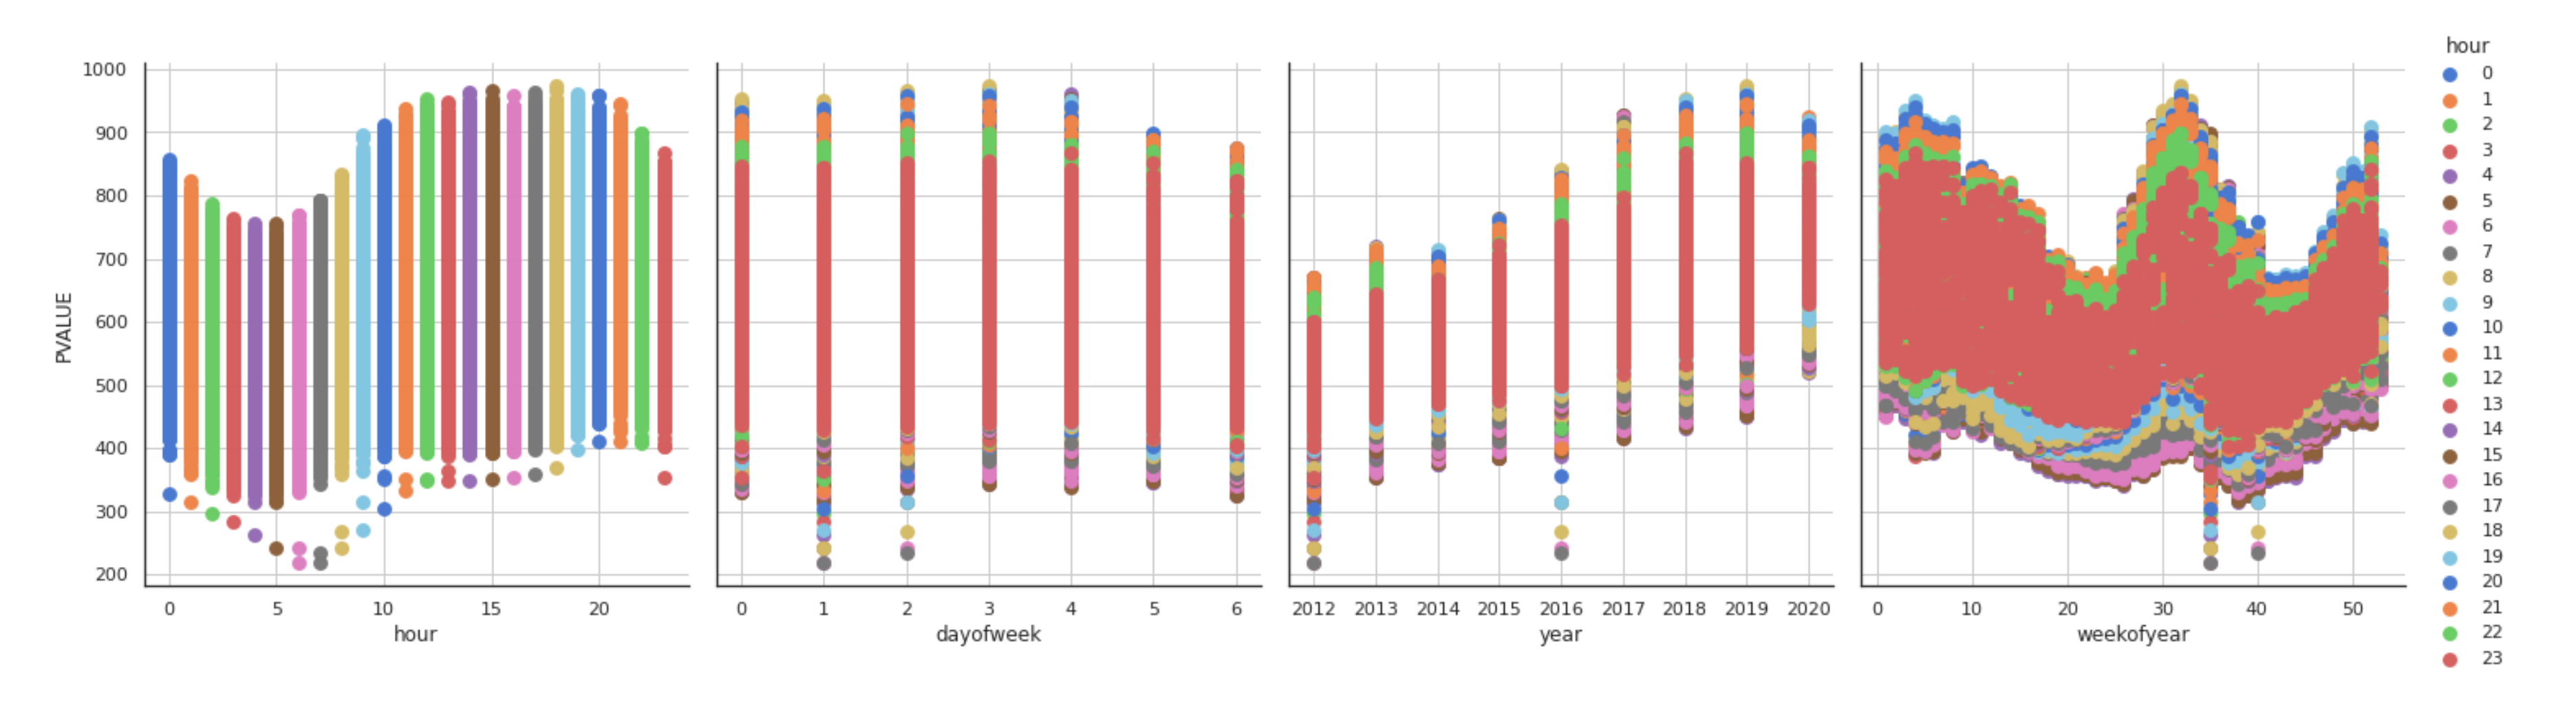
5.1. Exploratory Data Analysis
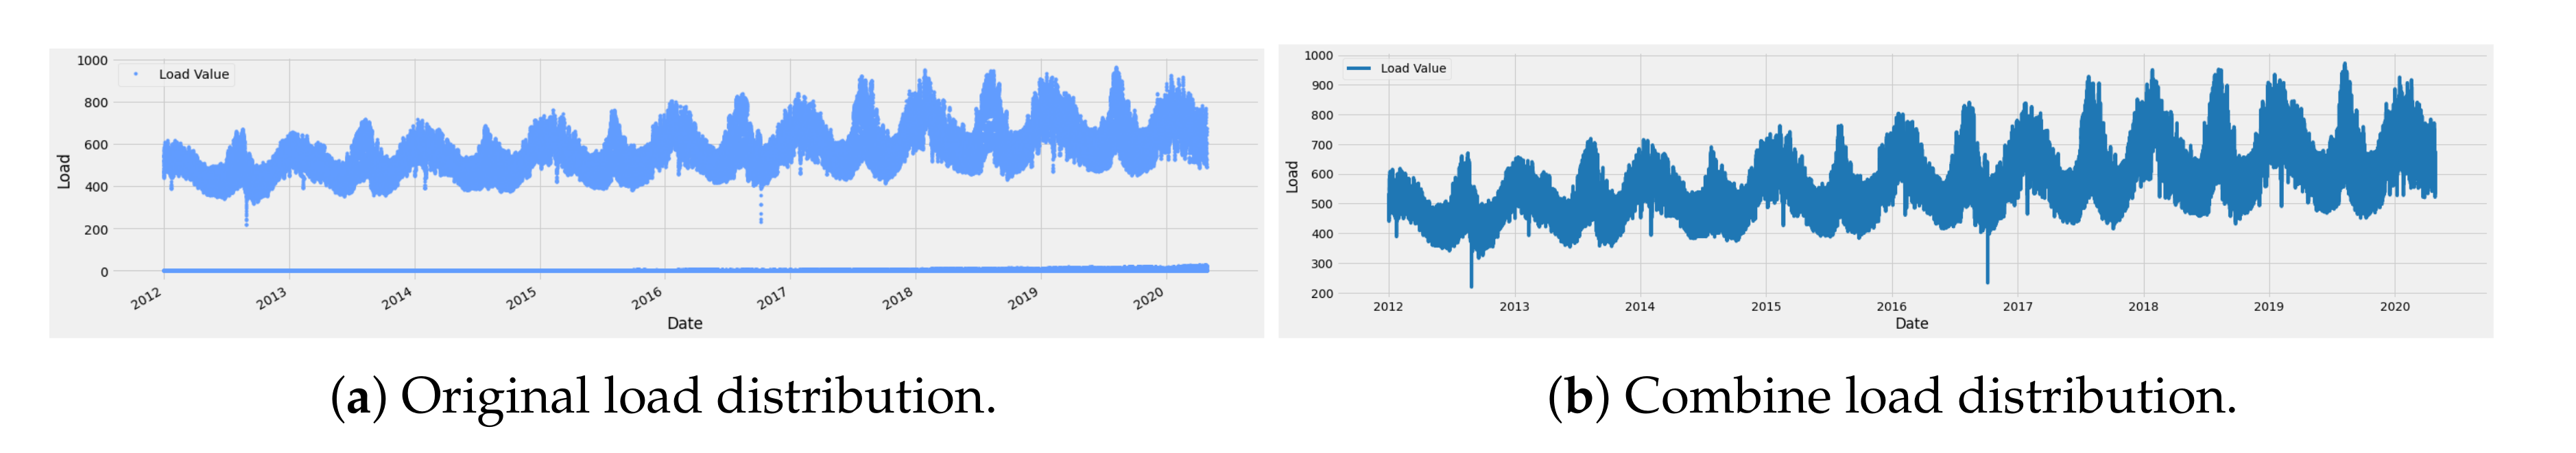
The recent actual energy consumption data of Jeju Island from the year 2012 to the middle of 2020 was collected for experimental purposes. Table 1 summarizes the energy source-wise dataset. It shows the count of each data source, mean, standard deviation, minimum, and maximum load.
Figure 4 shows the load values from different energy sources present in the dataset. Figure 4a shows that the amount of power generation from wind power is almost constant, but its contribution is very marginal. Figure 4b shows the solar energy obtained from PPAs, and Figure 4c represents the solar energy obtained from BTM. From these graphs, we conclude that the amount of the power generation of solar energy increased drastically from 2019. According to the decision of “New Energy and Renewable Energy Development, Use, and Distribution Promotion Act of Korea,” renewable energy facilities should be obligatorily installed. The energy is supplied by using new and renewable energy for more than a certain percentage of the estimated energy consumption calculated during the design [30]. This act leads to a significant increase in the use of renewable energy from 2019. Figure 4d represents the power load from the fuel-based energy sources.
To better understand the power used on an hourly basis, we provide Figure 5. These graphs show the hourly energy load distribution according to the hour, day of the week, year, and the week of the year. We can see that the energy consumption is high between 11 AM and 09 PM in the hour graph. On the day of the week graph, it is observed that the energy consumption is low during the weekend. In contrast, the yearly chart shows that energy consumption highly increased since 2016. The week of year graph shows that energy demand is high during the first eight weeks and the 30 to 35th weeks of the year.
Figure 6 shows the distribution of variable load over quarters. These graphs show the univariate distribution of load observations in the four quarters of a year. One quarter consists of three months, such that the first quarter (Q1) includes January, February, and March. The second quarter (Q2) consists of April, May, and June. The third quarter (Q3) consists of July, August, and September, and the fourth quarter (Q4) consists October, November, and December. We observed that in Q1, values mostly lie between 550 and 700. In Q2, they lie between 480 and 590, whereas in Q3, they are between 490 and 670, then from 500 to 610 in Q4.
It was observed during the data analysis that fossil fuel-based energy is very high compared to renewable energy. Figure 7 shows the comparison of combined renewable and nonrenewable energy sources. The Y-axis on the left side shows the load value obtained from fossil fuel energy sources, and the Y-axis on the right side shows the load value obtained from renewable energy sources. Figure 8 represents the count of each load value. Most of the load values lie between 500 and 600 MW.

5.2. Pre-Processing

The pre-processing phase is important to make data smooth for machine learning algorithms. Jeju has two options for the solar energy supply contract: KEPCO and KPX. In total, we have four types of energy sources in the dataset. The first one is from fossil fuel (FF). FF consists of the total amount of energy consumption hourly in Jeju acquired from KPX. The second source is behind the meter. BTM is the small sized solar energy generation without any contract received from KEPCO. The third is the generated photovoltaic solar energy contract acquired from KEPCO as a result of power purchase agreements (PPAs), and the final source is from wind power (WP). JEC receives this energy from KEPCO. We added all these types into one using Equation (2). The total number of rows becomes 72,936 from 291,744. Figure 9 shows the graph for the actual energy power generation in Figure 9a and the combined energy power generation in Figure 9b.
E ( t ) t o t a l = E ( t ) f f + E ( t ) b t m + E ( t ) p v + E ( t ) w p
Since these data contain only load values, time series features have been created from the date-time index. These features include hour, day of the week, quarter, month, year, day of the year, day of the month, and the week of the year.

5.3. Training

The processed data are used to establish a training model. There are many parameters for the training of the model. While tuning the hyperparameters, the root mean squared error (RMSE) is defined as the evaluation metric. RMSE is the square root of the variance, obtained by Equation (3), where y a is the actual value and y p is the predicted value. N represents the sample size in terms of numbers. This statistical parameter is also called the standard deviation of the fit of the regression system. The low value of the RMSE is the indicator of a well-trained model, while sampling frequency is set according to each tree, and a symmetric tree is used as a grow policy. The loss function for training purposes is set to the RMSE, and the score function is set to the cosine.
R M S E = 1 N y a y p 2

5.4. Train-And-Test Split

The combined dataset is divided into two parts, test and training sets. Training data consist of January 2012 to August 2018, while test sets include data from September 2018 to 27 April 2020. The input data are a time series energy load consumption pattern. Time series data contain daily, hourly, weekly, monthly, and yearly energy consumption patterns. Forecasting is predicting the future based on historical and current data, mostly through trend analysis. Hence, the actual time series data represented in successive order describe the problem adequately.

6. Experimental Results and Discussion

This section presents the results of our simulation and already existing algorithms.

6.1. Feature Importance Analysis

There are different ways to analyze feature importance. A correlation graph is an intuitive tool for studying correlation. It is an N × N table used to summarize the prediction effect of the regression model; that is, the association between the label and the classification predicted by the model. In the confusion matrix, one axis represents the model’s label, and the other axis represents the actual label. N represents the number of categories. Generally, before a detailed quantitative analysis, a correlation diagram can be used to roughly judge the direction, form, and closeness of the correlation relationship between features. Figure 10 represents the correlation graph of our training data.
Another method to analyze the feature importance is the Shapley value (SHAP). The purpose of SHAP is to calculate the contribution of each predictor function and to explain the prediction. The summary graph in Figure 11 combines the importance of features and their effect. Each point in the diagram has a unique value. The specified feature determines the Y-axis, and the Shapley value determines the X-axis position. The colors represent the value of the feature from the bottom to the top. The features are arranged according to their importance. The graph contains all the training data points. While features are categorized in descending order, the horizontal location means that the value is greater than or less than the expected value. The color indicates whether the variable is high (red) or low (blue). From the graph, we can observe that the “year” feature’s implementation has a significant positive effect, as seen in red, and the “positive” impact appears on the X-axis. In addition, the “day of the week” feature has a negative relationship with the targeted variable, while the “day of the month” has less impact on training data.

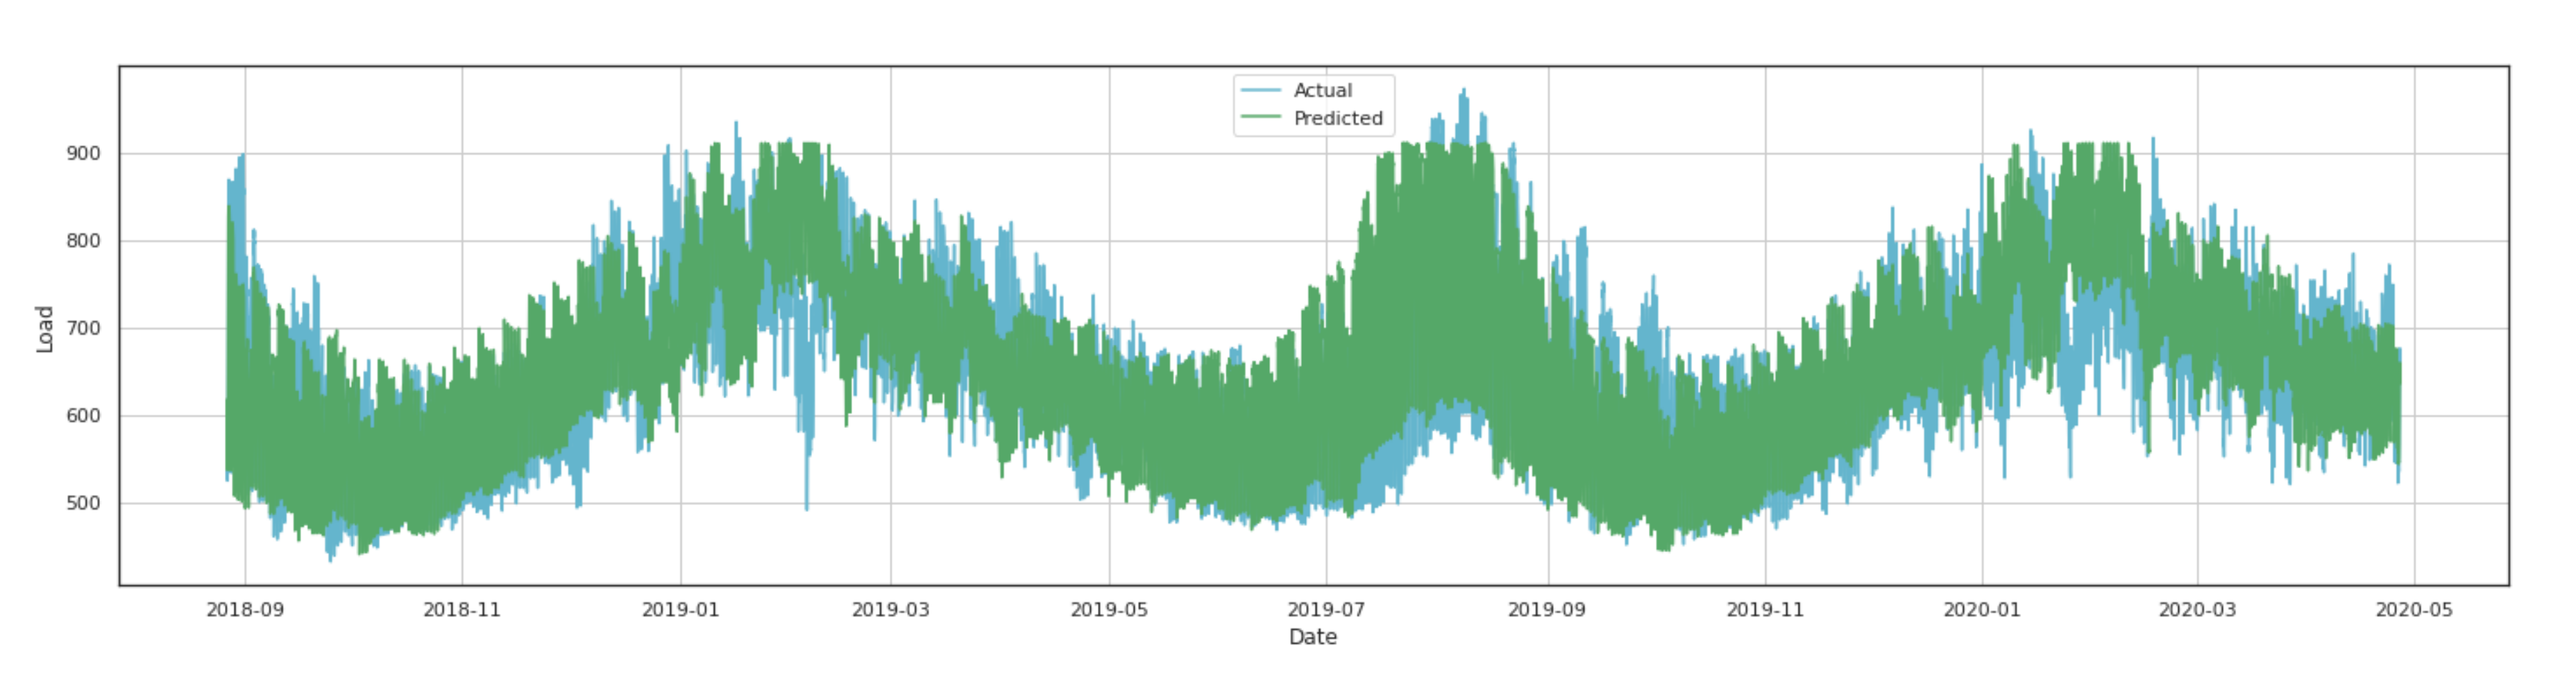
6.2. Forecasting Results

The comparison of actual and forecasted load values is depicted in Figure 12. As we mentioned, the proposed model is trained on Jeju Island’s actual energy consumption time series data. Therefore, the prediction is based on the training data. Figure 13 shows the forecast for June, and the error rate is calculated for the whole prediction model and not according to per month or day load forecasting. The error rate in Table 2 justifies that the proposed model is not 100% accurate, and the deviation in prediction is the reason for the error percentage. We demonstrate the graph of one day (25 May 2019) to better understand the forecasted result in Figure 14.

6.3. Model Goodness Inspection

Different evaluation metrics were used to inspect the goodness of the model, such as mean absolute error, mean absolute percent error, mean squared error, and root mean squared logarithmic error. We also chose the state-of-the-art models for the comparison with the proposed hybrid model. Table 2 shows the comparison of different evaluation metrics.

6.3.1. Mean Absolute Error

The mean absolute error (MAE) represents the difference between the original and expected values and is extracted as the dataset’s absolute difference mean. The MAE of the proposed model is 15.727 g, and it is calculated using Equation (4).
M A E = 1 N y a y p

6.3.2. Mean Squared Error

The mean squared error (MSE) is the difference between the original value and the expected value. It is extracted by squaring the mean squared error of the dataset using Equation (5).
M S E = 1 N y a y p 2

6.3.3. Root Mean Squared Logarithmic Error

The root mean squared logarithmic error (RMSLE) is obtained by Equation (6). The root mean squared logarithmic error is the logarithmic relationship between the actual data value and the model’s expected value. By applying the proposed model, we got an RMSLE score of 0.0378, which is the lowest compared to other models.
R M S L E = 1 N ( log ( y a + 1 ) log ( y p + 1 ) ) 2

6.3.4. Mean Absolute Percent Error

The mean absolute percent error (MAPE) is a measure of the accuracy of a prediction. It measures the size of the error, calculated using Equation (7) and expressed as a percentage. We got an MAPE of 4.2949% by applying the proposed model.
M A P E = 1 N y a y p y a × 100
Table 3 shows the comparison of our model’s MAPE to the scores of state-of-the-art methods. It also shows the minimum and maximum errors as a percentage. From the comparison, it is clear that the proposed hybrid model performed well compared to the other existing models.

6.3.5. Comparison with Existing Models

The proposed model is compared with the state-of-the-art models in this section. We compared our model with Lasso, Ridge, GradientBoost, MLP, SVR, and XGBoost. Figure 15 shows the graphical representation of the comparison with these models.

7. Conclusions

This article gives a brief introduction to the basic knowledge and classification of power systems’ load forecasting. It focuses on classifying some load forecasting methods, the advantages, and disadvantages, into traditional and modern smart forecasting methods. In today’s world, renewable energy is integrated with nonrenewable energy to empower electric grids, which introduces new challenges because of its interference and volatility. Energy forecasting using soft computing technologies plays an essential role in solving these challenges. When predicting electricity consumption, it is necessary to determine an appropriate prediction method according to the expected forecasting results and characteristics of the prediction model. Besides, individual forecasting models have some limitations to overcome. Therefore, combinations of prediction methods are receiving increasing attention. Consequently, we propose a new hybrid method based on machine learning. The proposed model combines multi-layered perceptron, support vector regression, and CatBoost. We used the combined load data of renewable and nonrenewable energy sources to forecast energy consumption. We performed exploratory data analysis, pre-processing, and train-test split before training the model. We used various metrics to test the advantages of the proposed model: mean absolute error, mean absolute percent error, mean squared error, and root mean squared logarithmic error. We also selected the latest model for comparison with the proposed hybrid model.

Author Contributions

Conceptualization, P.W.K.; formal analysis, P.W.K.; funding acquisition, Y.-C.B.; methodology, S.-J.L.; data curation, D.-H.K.; resources, J.-Y.K.; writing, review and editing, S.-J.L.; investigation, H.-S.P.; methodology, P.W.K.; project administration, Y.-C.B.; supervision, Y.-C.B. All authors read and agreed to the published version of the manuscript.

Funding

This research received no external funding.

Conflicts of Interest

The authors declare no conflict of interest regarding the design of this study, the analyses, and the writing of this manuscript.

Abbreviations

The following abbreviations are used in this manuscript:
SVRSupport vector regression
JECJeju Energy Corporation
MLPMultilayer perceptron
ANNArtificial neural network
FFFossil fuel
BTMBehind the meter
PVPhotovoltaic
WPWind power
EDAExploratory data analysis
KEPCOKorea Electric Power Corporation
KPXKorea Power Exchange
PPAPower purchase agreement
RMSERoot mean squared error
EEMDEnsemble empirical mode decomposition
ELMExtreme learning machine
MAEMean absolute error
MSEMean squared error
RMSLERoot mean squared logarithmic error
MAPEMean absolute percent error

References

  1. Wang, H.; Lei, Z.; Zhang, X.; Zhou, B.; Peng, J. A review of deep learning for renewable energy forecasting. Energy Convers. Manag. 2019, 198, 111799. [Google Scholar] [CrossRef]
  2. Apergis, N.; Payne, J.E. Renewable and non-renewable energy consumption-growth nexus: Evidence from a panel error correction model. Energy Econ. 2012, 34, 733–738. [Google Scholar] [CrossRef]
  3. Pérez-Ortiz, M.; Jiménez-Fernández, S.; Gutiérrez, P.A.; Alexandre, E.; Hervás-Martínez, C.; Salcedo-Sanz, S. A review of classification problems and algorithms in renewable energy applications. Energies 2016, 9, 607. [Google Scholar]
  4. Marczinkowski, H.M.; Alberg Østergaard, P.; Roth Djørup, S. Transitioning island energy systems—Local conditions, development phases, and renewable energy integration. Energies 2019, 12, 3484. [Google Scholar] [CrossRef] [Green Version]
  5. Badal, F.R.; Das, P.; Sarker, S.K.; Das, S.K. A survey on control issues in renewable energy integration and microgrid. Prot. Control. Mod. Power Syst. 2019, 4, 8. [Google Scholar] [CrossRef] [Green Version]
  6. 100-Percent. 100% Renewable Energy Atlas Practical Steps Towards a Sustainable World. 2019. Available online: https://www.100-percent.org/tag/work-in-progress/page/5/ (accessed on 7 May 2020).
  7. Jeju Weekly. Jeju to Be Carbon Free by 2030. 2012. Available online: http://www.jejuweekly.com/news/articleView.html?idxno=2679 (accessed on 3 June 2020).
  8. Asrari, A.; Wu, T.X.; Ramos, B. A hybrid algorithm for short-term solar power prediction—Sunshine state case study. IEEE Trans. Sustain. Energy 2016, 8, 582–591. [Google Scholar] [CrossRef]
  9. Hu, J.; Wang, J.; Zeng, G. A hybrid forecasting approach applied to wind speed time series. Renew. Energy 2013, 60, 185–194. [Google Scholar] [CrossRef]
  10. Ahmad, A.; Hassan, M.; Abdullah, M.; Rahman, H.; Hussin, F.; Abdullah, H.; Saidur, R. A review on applications of ANN and SVM for building electrical energy consumption forecasting. Renew. Sustain. Energy Rev. 2014, 33, 102–109. [Google Scholar] [CrossRef]
  11. Wang, R.; Li, J.; Wang, J.; Gao, C. Research and application of a hybrid wind energy forecasting system based on data processing and an optimized extreme learning machine. Energies 2018, 11, 1712. [Google Scholar] [CrossRef] [Green Version]
  12. Mendonça de Paiva, G.; Pires Pimentel, S.; Pinheiro Alvarenga, B.; Gonçalves Marra, E.; Mussetta, M.; Leva, S. Multiple Site Intraday Solar Irradiance Forecasting by Machine Learning Algorithms: MGGP and MLP Neural Networks. Energies 2020, 13, 3005. [Google Scholar]
  13. Ju, C.; Wang, P.; Goel, L.; Xu, Y. A two-layer energy management system for microgrids with hybrid energy storage considering degradation costs. IEEE Trans. Smart Grid 2017, 9, 6047–6057. [Google Scholar] [CrossRef]
  14. Diao, L.; Niu, D.; Zang, Z.; Chen, C. Short-term Weather Forecast Based on Wavelet Denoising and Catboost. In Proceedings of the 2019 Chinese Control Conference (CCC), Guangzhou, China, 27–30 July 2019; pp. 3760–3764. [Google Scholar]
  15. Catalao, J.; Pousinho, H.; Mendes, V. Hybrid wavelet-PSO-ANFIS approach for short-term wind power forecasting in Portugal. IEEE Trans. Sustain. Energy 2010, 2, 50–59. [Google Scholar] [CrossRef]
  16. Yu, J.; Park, J.H.; Kim, S. A New Input Selection Algorithm Using the Group Method of Data Handling and Bootstrap Method for Support Vector Regression Based Hourly Load Forecasting. Energies 2018, 11, 2870. [Google Scholar] [CrossRef] [Green Version]
  17. Cao, Z.; Wan, C.; Zhang, Z.; Li, F.; Song, Y. Hybrid ensemble deep learning for deterministic and probabilistic low-voltage load forecasting. IEEE Trans. Power Syst. 2019, 35, 1881–1897. [Google Scholar] [CrossRef]
  18. Khan, P.W.; Byun, Y.C.; Lee, S.J.; Park, N. Machine Learning Based Hybrid System for Imputation and Efficient Energy Demand Forecasting. Energies 2020, 13, 2681. [Google Scholar]
  19. Polikar, R. Ensemble learning. In Ensemble Machine Learning; Springer: Berlin/Heidelberg, Germany, 2012; pp. 1–34. [Google Scholar]
  20. Zhang, F.; Fleyeh, H. Short Term Electricity Spot Price Forecasting Using CatBoost and Bidirectional Long Short Term Memory Neural Network. In Proceedings of the 2019 16th International Conference on the European Energy Market (EEM), Ljubljana, Slovenia, 18–20 September 2019; pp. 1–6. [Google Scholar]
  21. Dorogush, A.V.; Ershov, V.; Gulin, A. CatBoost: Gradient Boosting with. arXiv 2018, arXiv:1810.11363. [Google Scholar]
  22. Drucker, H.; Burges, C.J.; Kaufman, L.; Smola, A.J.; Vapnik, V. Support vector regression machines. In Advances in Neural Information Processing Systems; MIT Press: Cambridge, MA, USA, 1997; pp. 155–161. [Google Scholar]
  23. Hernández-Lobato, J.M.; Adams, R. Probabilistic backpropagation for scalable learning of bayesian neural networks. In Proceedings of the International Conference on Machine Learning, Lille, France, 7–9 July 2015; pp. 1861–1869. [Google Scholar]
  24. Morin, F.; Bengio, Y. Hierarchical probabilistic neural network language model. In Proceedings of the Tenth International Workshop on Artificial Intelligence and Statistics, Bridgetown, Barbados, 6–8 January 2005; pp. 246–252. [Google Scholar]
  25. Ghorbanzadeh, O.; Blaschke, T.; Gholamnia, K.; Meena, S.R.; Tiede, D.; Aryal, J. Evaluation of different machine learning methods and deep-learning convolutional neural networks for landslide detection. Remote. Sens. 2019, 11, 196. [Google Scholar] [CrossRef] [Green Version]
  26. Tsoi, A.C.; Back, A. Discrete time recurrent neural network architectures: A unifying review. Neurocomputing 1997, 15, 183–223. [Google Scholar] [CrossRef]
  27. Cheng, J.; Dong, L.; Lapata, M. Long short-term memory-networks for machine reading. arXiv 2016, arXiv:1601.06733. [Google Scholar]
  28. Tang, J.; Deng, C.; Huang, G.B. Extreme learning machine for multilayer perceptron. IEEE Trans. Neural Netw. Learn. Syst. 2015, 27, 809–821. [Google Scholar] [CrossRef] [PubMed]
  29. Almeshaiei, E.; Soltan, H. A methodology for electric power load forecasting. Alex. Eng. J. 2011, 50, 137–144. [Google Scholar] [CrossRef] [Green Version]
  30. Korea Legislation Government. The Act on The Promotion of the Development, Use and Diffusion of New and Renewable Energy. 2014. Available online: http://www.law.go.kr/lsInfoP.do?lsiSeq=150378#J12:3 (accessed on 22 July 2020).
Figure 1. Flow diagram of the proposed forecasting model.
Energies 13 04870 g001
Figure 2. Power sources of renewable and nonrenewable energy for Jeju Island.
Energies 13 04870 g002
Figure 3. Structure of the proposed hybrid model.
Energies 13 04870 g003
Figure 4. Load values from different energy sources.
Energies 13 04870 g004
Figure 5. Power use in MW by hour, day of week, year, and week of year.
Energies 13 04870 g005
Figure 6. Quarter-wise energy consumption.
Energies 13 04870 g006
Figure 7. Comparison of renewable and nonrenewable energy sources.
Energies 13 04870 g007
Figure 8. Distribution of variable load.
Energies 13 04870 g008
Figure 9. Actual and combined energy power generation.
Energies 13 04870 g009
Figure 10. Correlation graph of the training data.
Energies 13 04870 g010
Figure 11. Shapley additive explanations (SHAP) graph.
Energies 13 04870 g011
Figure 12. Comparison of actual and forecasted load values.
Energies 13 04870 g012
Figure 13. Forecasted load values for the month of June 2019.
Energies 13 04870 g013
Figure 14. Forecasted load values for a single day (25 May 2019).
Energies 13 04870 g014
Figure 15. Comparison of MAE and RMSE with different models.
Energies 13 04870 g015
Table 1. Energy source-wise data summary.
CountMeanStdMinMax
FF72,936574.00105.53219.20965.50
WP72,9360.02400.02660.000.1619
BTM72,9360.93112.51940.0025.443
PV72,9360.78772.33400.0027.198
Total291,744143.93253.850.00965.50
Table 2. Evaluation metrics.
Model NameMAEMSERMSERMSLE
Lasso58.694455373.68273.305410.128073
Ridge56.650125151.02771.770660.125468
GradientBoost24.764771119.64933.461160.056788
MLPRegressor56.228755250.29872.458940.123721
SVR75.81369753.18598.758220.171825
XGBoost23.51242777.475327.883250.049442
Proposed15.72754472.964421.747740.037885
Table 3. Comparison of mean absolute percent error.
NameMin Error %Max Error %Over all MAPE %
Lasso0.00007648.0944610.3914
Ridge0.00077347.8170210.41394
GradientBoost0.00003939.006096.864313
MLPRegressor0.00163657.740519.52188
SVR0.00700680.1932721.61039
XGBoost0.0001842.217125.769542
Proposed0.00138835.263214.294916

