Article

Proof-of-Concept of High-Pressure Torrefaction for Improvement of Pelletized Biomass Fuel Properties and Process Cost Reduction

by
Bartosz Matyjewicz
1,
Kacper Świechowski
1,*,
Jacek A. Koziel
2 and
Andrzej Białowiec
1,2
1
Faculty of Life Sciences and Technology, Institute of Agricultural Engineering, Wrocław University of Environmental and Life Sciences, 51-630 Wrocław, Poland
2
Department of Agricultural and Biosystems Engineering, Iowa State University, Ames, IA 50011, USA
*
Author to whom correspondence should be addressed.
Energies 2020, 13(18), 4790; https://doi.org/10.3390/en13184790
Submission received: 18 August 2020 / Revised: 3 September 2020 / Accepted: 11 September 2020 / Published: 14 September 2020
(This article belongs to the Special Issue Biomass for Energy Application)

Abstract

:
This paper provides a comprehensive description of the new approach to biomass torrefaction under high-pressure conditions. A new type of laboratory-scale high-pressure reactor was designed and built. The aim of the study was to compare the high-pressure torrefaction with conventional near atmospheric pressure torrefaction. Specifically, we investigated the torrefaction process influence on the fuel properties of wooden-pellet for two different pressure regimes up to 15 bar. All torrefaction processes were conducted at 300 °C, at 30 min of residence time. The initial analysis of the increased pressure impact on the torrefaction parameters: mass yields, energy densification ratio, energy yield, process energy consumption, the proximate analysis, high heating value, and energy needed to grind torrefied pellets was completed. The results show that high-pressure torrefaction needed up to six percent less energy, whereas energy densification in the pellet was ~12% higher compared to conventional torrefaction. The presence of pressure during torrefaction did not have an impact on the energy required for pellet grinding (p < 0.05).

1. Introduction

1.1. Background

Rapid economic development resulted in a significant increase in demand for energy. The importance of renewable energy sources (RES) has been growing in recent decades. One of the most abundant RES is biomass that can be obtained from energy crops and agricultural waste. Moreover, biomass is an inexhaustible, controlled, and flexible energy source [1,2], and for these reasons, it plays an essential role in the energy supply chain in the European Union (EU) and around the world. An underestimated potential for energy production lies in residual biowaste, which cannot be easily recycled, and whose mass is increasing from a growing population and industrial production.
The main drawback of raw biomass and residual biowaste is its high moisture content, which results in low calorific value and low energy density. The consequence of it is that these materials have to be processed before energetic use. One of the ways to process these materials before energetic use is torrefaction, a process that increases carbon and calorific values, and converts the biomass to a stable and hydrophobic material.
The growing problem with (bio)waste management and energy supplies prompts society to look for new solutions. One of the many ways to manage biowaste is the concept of ‘Waste-to-Carbon’ with the torrefaction process [3]. In recent times, more research-grade installations for torrefaction are built [4]. The products of the torrefaction process can be used as fuel or as an additive to processes [5] and soils [6]. The use of torrefaction to produce fuel is noticeable worldwide. For example, in Portugal, a 720 kg∙h−1 pilot industrial-scale plant for torrefaction and torrefied wood pelletization was built [7]. In Burkina Faso, small units for valorizing cashew nut shells were set up [8]. In Steiermark, Austria, a 1 Mg·h−1 pilot plant was built in 2011 [9]. Industrial installation for biomass torrefaction in eastern Oregon (USA) is under construction [10].

1.2. Torrefaction for Organic Material Valorization

The torrefaction process (also known as biomass ‘roasting’) is a type of thermochemical treatment of the organic matter, consisting of a slow heating rate <50 °C∙min−1 [11] to a temperature above 200 °C, usually 280–320 °C, at a pressure close to atmospheric and in the absence of oxygen [12]. The residence time varies from several minutes up to several hours. The torrefaction is assumed to be suitable for processing material with moisture content under 15% [13]. Torrefaction takes place in five steps. At first, the treated material is (I) preheated, followed by (II) pre-drying, where some of the water is evaporated. The next stages are (III) drying and (IV) post-drying and intermediate heating where remaining water is removed. When water is removed, the proper (V) torrefaction process takes place. Two products are formed. Solid fraction (torrefied material) and a gas fraction (torrgas), wherein the liquid fraction may be separated from the torrgas, dividing it between the condensable fraction (water, oils, tars, and other compounds) and the non-condensable fraction (CO, CO2, CH4, and other gases). The solid fraction can be used as fuel or as an additive to industry. Torrgas can be used for further processing or for supplying the heat for the torrefaction process [14]. The resulting solid product is a uniform hydrophobic material with lower humidity, higher calorific value, and improved milling properties compared to raw material. The hydrophobicity guarantees the stability of the fuel in varying storage conditions, protects against the bio-decomposition, the development of mold, and microorganisms’ growth [12].
A relatively new approach to torrefaction is hydrothermal carbonization (HTC), which resolves problems of wet organic materials (with moisture >15%). The HTC material is processed in subcritical water at 180–250 (300) °C and pressure >1 MPa. The process residence time varies in a wide range but is usually shorter than in the case of the conventional (atmospheric pressure) torrefaction and is ranging from a few minutes to several hours [15]. An additional technological parameter of HTC is solids loading, which ranges from 7 to 25% [16].
The proposed novel concept lies in the selection of the process conditions that are between conventional torrefaction and HTC. A high-pressure torrefaction is proposed herein, where the material is torrefied in temperature and time consistent with traditional torrefaction but under elevated pressure.
Two strategies of process performance may be derived: (1) under steady pressure starting from the beginning and maintained for the whole process, and (2) released gasses in the closed reactor vessel continue to increase the pressure during the process. In this second scenario (during high-pressure torrefaction), the heated material begins to degas, which causes an increase in pressure inside the reactor, which causes an increase in the fixed carbon content, and therefore, the possibility of obtaining better quality material. Wannapeera and Worasuwannarak [17] examined that high-pressure torrefaction allows obtaining a material with a higher calorific value (HHV). Also, high-pressure torrefaction changes the structure of the crosslinking of the material and causes an increase in charring performance compared to the torrefaction under atmospheric pressure [17].
High-pressure torrefaction creates a new pathway for biochar production. The trapped gases increase the pressure, which causes a faster temperature increase compared to conventional torrefaction; as a result, less energy is consumed. Moreover, the biochar from pressured torrefaction has a higher calorific value. For this reason, a high-pressure unit on an industrial scale could allow achieving higher efficiency with lower energy expenditure for a process, and better fuel quality compared with conventional technologies.

1.3. The Pellet Role in Energy Chain Supply

Pelletization is used to concentrate the energy in the material, resulting in lower transport costs, easier storage (takes less place, emits less dust and organic compounds), and facilitates dosing into a household and industrial energy device [18]. For example, wood pellet is used in the Turów power plant in Poland [19], where pellets are ground and mixed with lignite coal at eight percent share. Recently, a combined technology of pelletization and torrefaction at different (downstream and upstream) configurations are considered to increase energy densification and cost reduction. It has been shown that in the EU, the torrefied pellet can be less expensive than the conventional one (4.7 €∙GJ−1 vs. 5.8 €∙GJ−1, respectively) [3,20].

1.4. The Importance and the Aim of the Study

The increased energy demand and residual biowaste overproduction are important problems to solve. One of the solutions is the torrefaction process that is capable of converting residual biomass and residual biowaste to solid fuel for the powerplant. Despite the constant development of torrefaction technology and small industrial-scale plant, there is a need to optimize the torrefaction technology. New solutions, leading to a decrease in the energy demand for the process, and increasing the efficiency should be developed.
In this work, the new type of batch lab-scale reactor for high-pressure torrefaction was built and tested. The aim of the study was to compare the high-pressure torrefaction with conventional atmospheric pressure torrefaction. Specifically, we investigated the torrefaction process influence on the fuel properties wooden-pellet for two different pressure regimes. Additionally, the main operational observations of a new type of reactor were described.

2. Materials and Methods

The experiment of high-pressure torrefaction was conducted in a designed reactor. The reactor design allowed us to perform conventional torrefaction (at atmospheric pressure) and high-pressure torrefaction. The full experiment setup is presented in Figure 1. Before the torrefaction process, the wooden-pellets were dried in a laboratory oven. Then, dry wooden-pellets were placed in the reactor, where torrefaction tests took place (the torrefaction at atmospheric pressure and at high-pressure). During each test, the energy demand for heating the reactor, the temperature inside the reactor, pressure in the reactor, and fractions mass yields were measured. Next, raw pellets and torrefied ones were subjected to the proximate analysis and grinding test. The thermogravimetric analysis of the raw pellet was conducted to better understand the influence of the reactor temperature and pressure changes during the process. Finally, the obtained data analysis and comparisons of the effects of pressure regimes were completed.

2.1. Materials

A commercially available softwood pellet made from sawdust was chosen for the torrefaction experiment (Figure 1). Wooden pellets (instead of woodchips) were selected for several reasons: (i) a higher homogeneity of pellets, (ii) to study the impact of pressure on pellets, (iii) practical aspect—is easier to integrate a torrefaction as a downstream operation in a pellet plant compared to torrefaction as upstream operation. Pellet parameters are: moisture content 6.6–8.3%, ash content 0.8–1.1%, sulfur content 0.01%, low heating value 16 MJ∙kg−1, pellet’s diameter 6 mm. The pellets were bought in a DIY store located in Wroclaw, Poland. The conducted analysis of pellets showed that moisture content, organic matter content, combustible parts, and ash content were 9.94, 99.63, 99.74, and 0.26%, respectively.

2.2. Methods

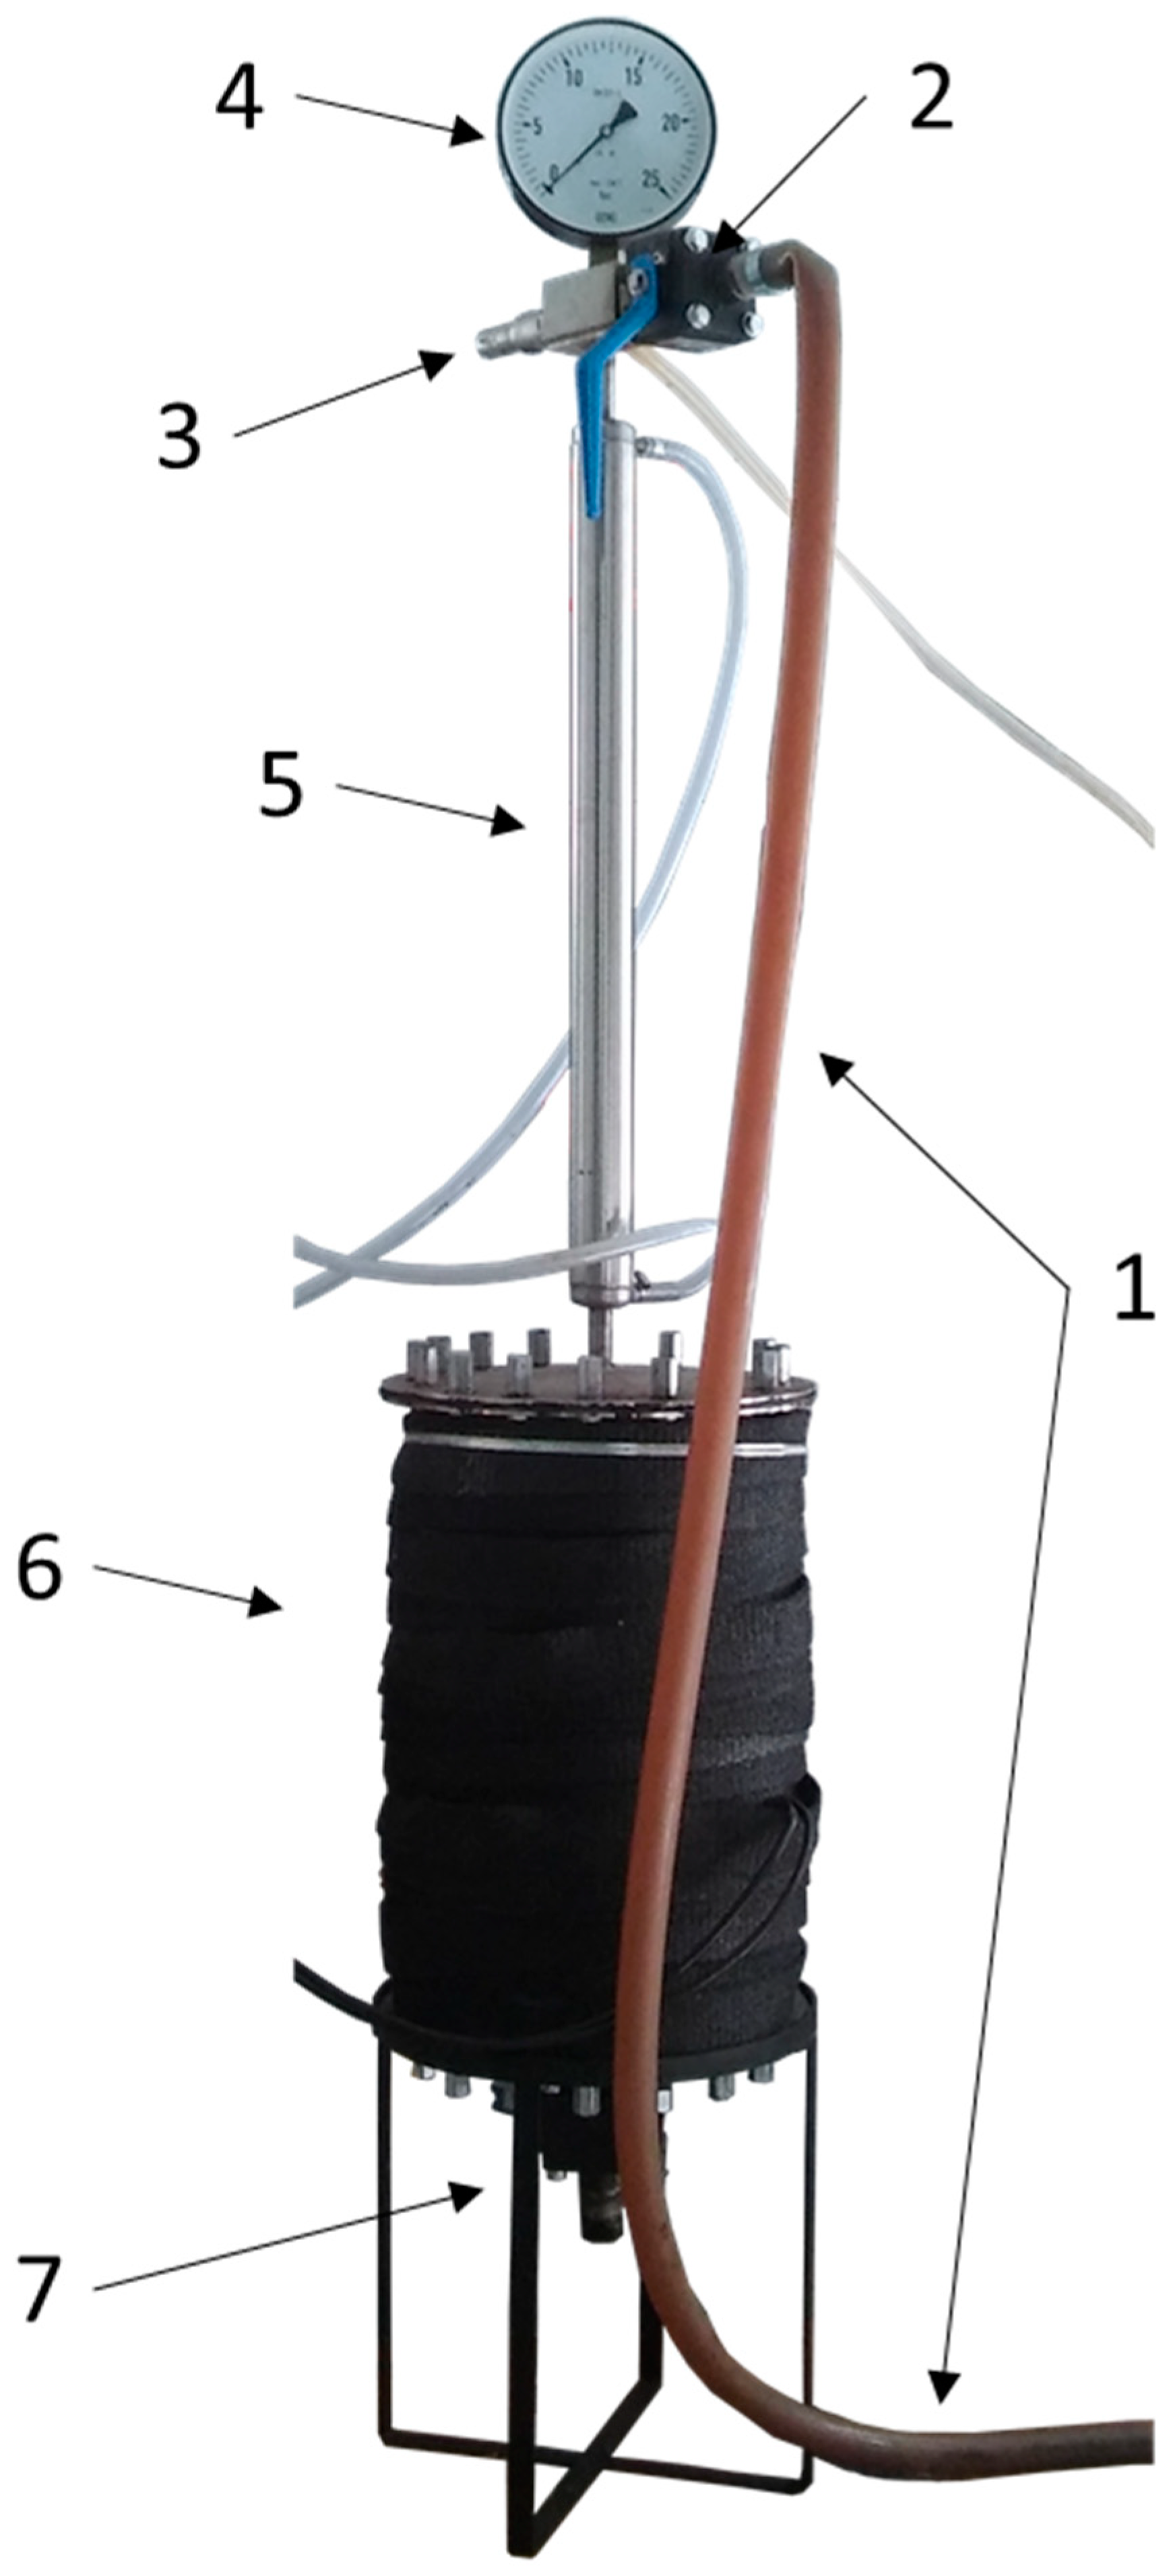
2.2.1. Reactor Design

The reactor used in this experiment was a prototype dedicated to torrefaction (Figure 2). The reactor can operate at a maximum pressure of 15 bar and a temperature of 300 °C. When the pressure exceeds 15 bar, the safety valve opens (3); it can also be done manually at any time. The safety valve protected the device from bursting. The measuring equipment includes a manometer (4) and a temperature sensor located inside the reactor (6). Heating takes place in an indirect system, where heat is supplied through the walls of the reactor (heat-resistant steel, thickness 4 mm) by two electric heating mats (Conbest, SKU 189-11-3, Kraków, Poland), the total power of 1560 W, controlled by temperature regulator (RKT, REX-C100, China). The heating mats were thermally isolated from the environment by fiberglass insulation tape (thickness~7.5 cm, λ~0,05 W·m−1·K−1). The biomass was placed inside of the reactor on the special grille (Figure 3a). The grille was placed at 1/3 of the height of the chamber of the reactor. The total reactor volume was 22.3 dm3.

2.2.2. Torrefaction Process Procedure

The torrefaction process was conducted in the above-mentioned reactor. Before each torrefaction test, the pellet was dried in a laboratory dryer (WAMED, KBC-65W, Warsaw, Poland) for 24 h at 105 °C. A 600 ± 1 g piece of dry pellet sample was used for each torrefaction test. First, samples were placed into the bottom part of the reactor, on the grille (Figure 3a) (to prevent/limit the adsorption of condensed fraction into a solid fraction after the end of the process when temperature decreased). Next, the reactor was filled with CO2 inert gas and then was sealed.
Three scenarios were tested:
  • In the case of torrefaction at atmospheric pressure, the upper valve was open, and the end of the rubber pipe (exhaust pipe) was placed into the bottle half-filled with water (acting as a water seal to prevent the oxygen entering into the reactor). The rubber pipe was tightly placed into the bottle (To limit water evaporation resulting from the infusion of high-temperature torrgas at ~70 °C. The torrgas was allowed to escape from the bottle by small holes in the top part of the bottle) (Figure 3b). Then the heating mats were turned on, and the reactor has been heated from room temperature ~20 °C to a setpoint temperature of 300 °C with an average heating rate of 2.6 °C∙min−1. After the reactor temperature reached the setpoint, the process residence time of 30 min was counted. Finally, the heating mats were turned off, and the upper valve was closed (to stop the water suction from the bottle, which resulted from cooled down gasses in the reactor), and the reactor was left to cool down. The samples from this process are named ‘ap1′–‘ap3′ (atmospheric pressure, numbers represent individual repetitions);
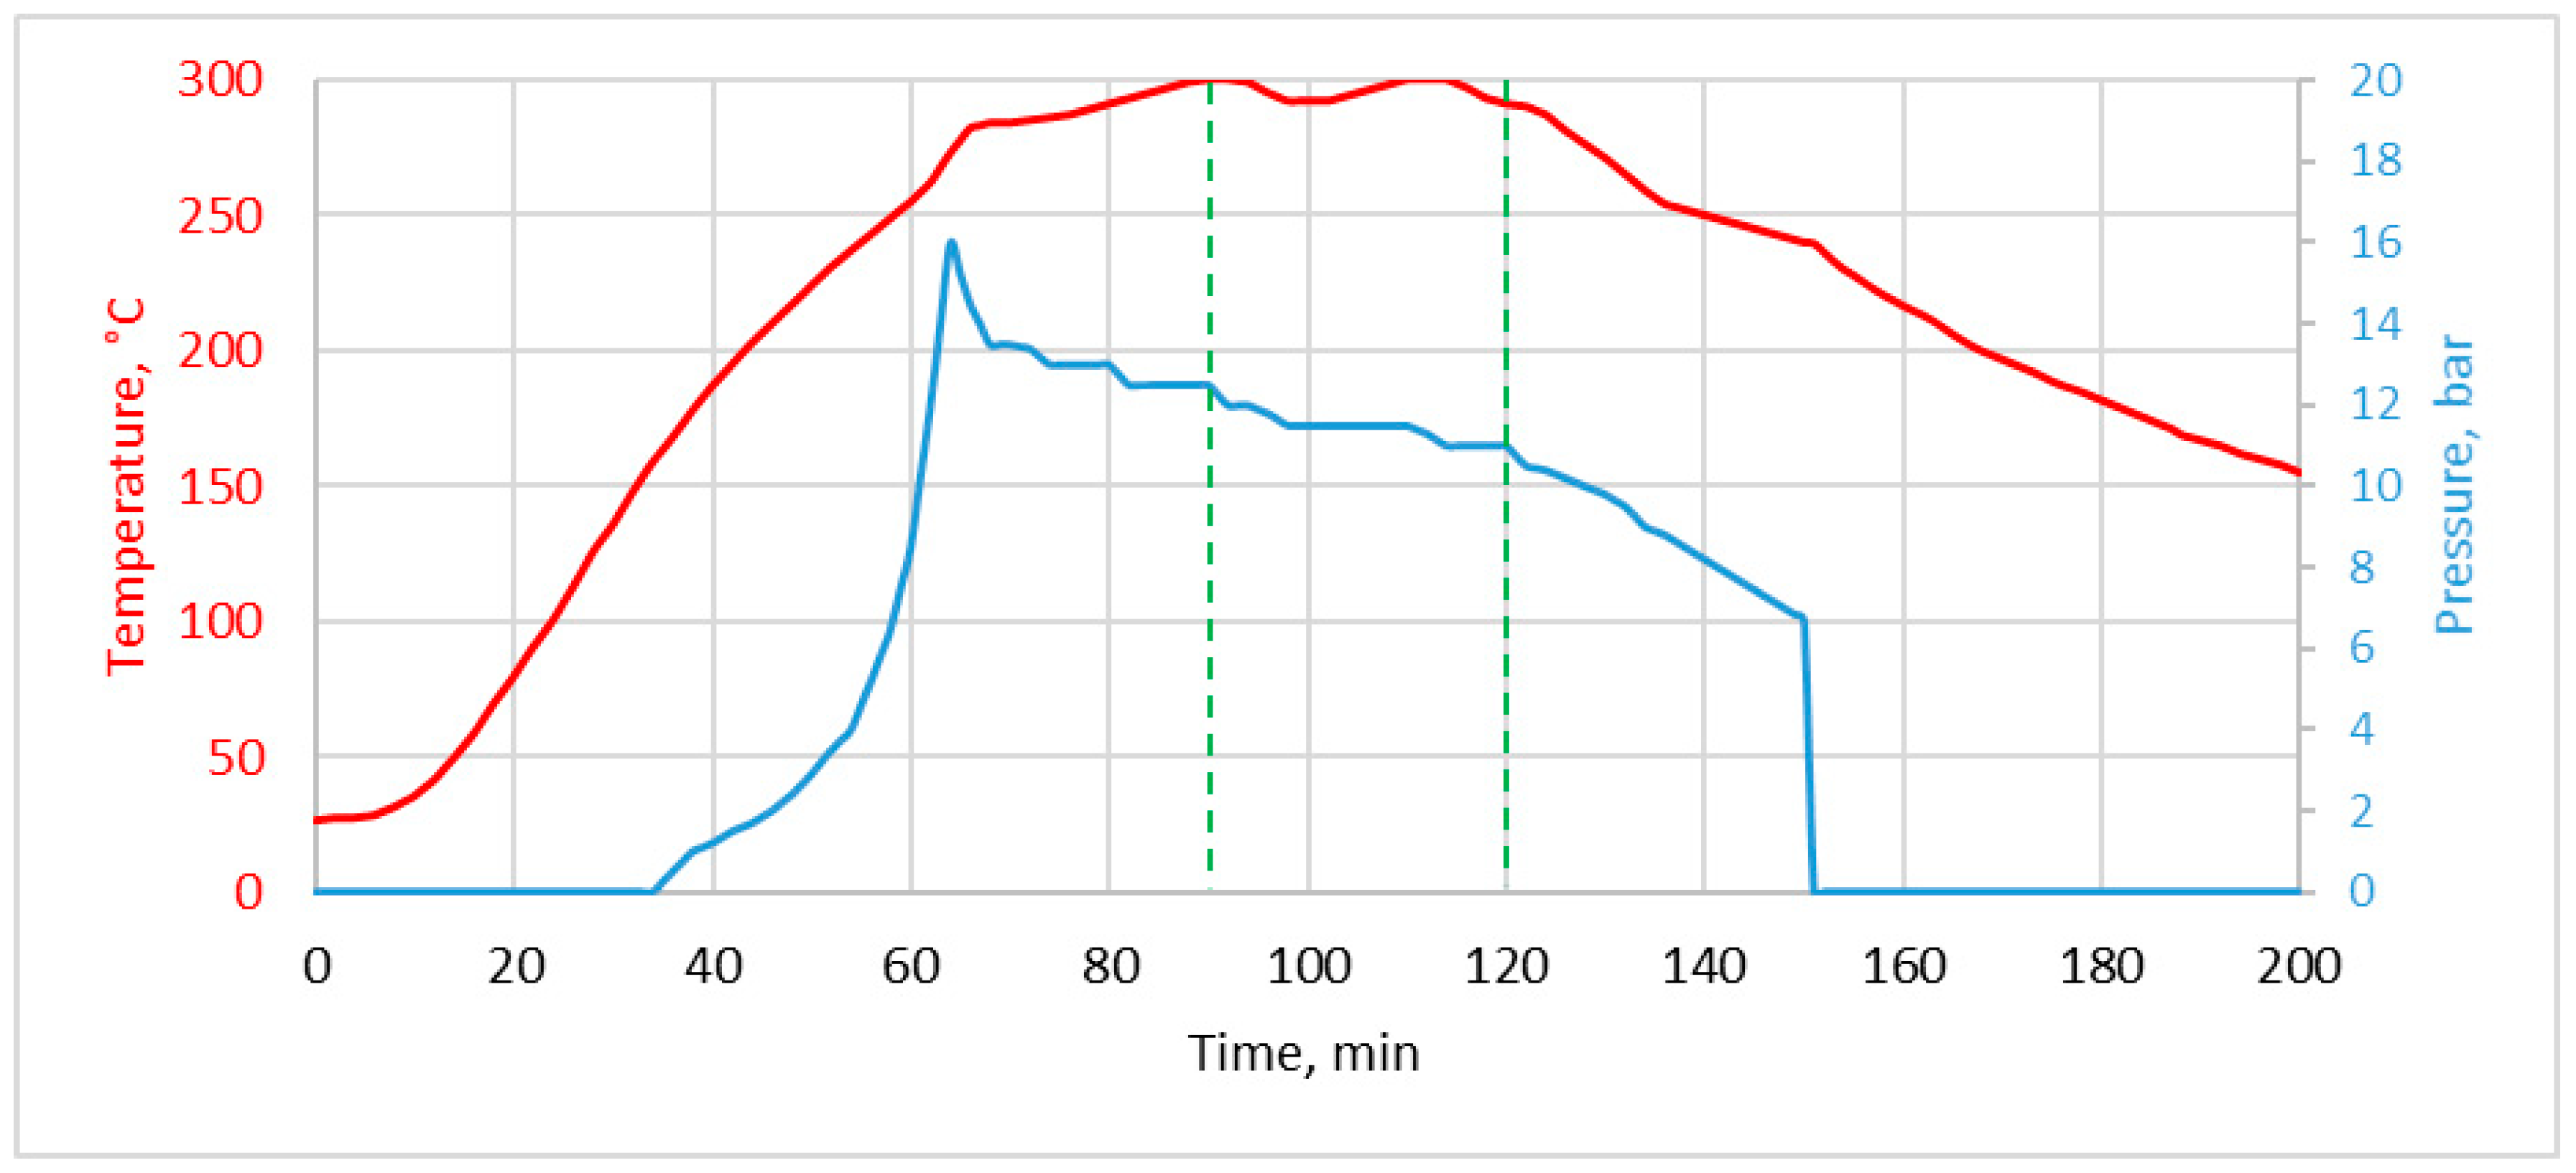
  • In the case of torrefaction at high-pressure, all valves were closed. The heating mats were turned on, and the reactor has been heated from room temperature ~20 °C to a setpoint temperature of 300 °C with an average heating rate of 2.9 °C∙min−1. As the temperature rose, the pressure increased (as a result of temperature rise and pellet degassing). In four repetitions for this variant, the pressure was not controlled, which led to the opening of the safety valve. As a result, the pressure decrease occurred. After gas release, the upper valve was closed, and the reactor was left to cool down. The samples for which the safety valve opened were labeled as ‘hpd1′–‘hpd4′ (high-pressure-decrease, numbers represent individual repetitions);
  • During the next four tests, the pressure increase was controlled not to exceed the upper-pressure threshold value (15 bar); therefore, the high-pressure conditions were maintained for the whole process. After the reactor temperature reached the setpoint, the residence time of 30 min was counted, and (if needed) pressure was relieved manually to keep it at 14 ± 1 bar. Finally, the heating mats were turned off, and the upper valve was opened to release pressure from the reactor. The samples where pressure was kept at one steady level have names ‘hps1′–‘hps4′ (high-pressure-steady, numbers represent individual repetitions).
Each experiment ended when the torrefied pellets were retrieved from the reactor, and a condensed fraction trapped on the bottom of the reactor was drained by the lower valve.

2.2.3. Torrefaction Process Analysis

For each torrefaction experiment, the energy demand was measured using a power network analyzer (LUMEL, ND40, Zielona Góra, Poland). After the torrefaction at the atmospheric pressure, the solid fraction was measured as solid parts that were found in the reactor (over and under the sieve, grille). Some parts of the pellets crumbled and fell under the sieve of the grille, but did not contact the liquid fraction (all liquid fraction was found inside the bottom valve). In the case of high-pressure torrefaction, the solid fraction was measured separately for the over- and under-side of the grille. Due to the valve closure after gas release at the process end, residual gases and gases that were produced during reactor cooling time, after the cooling down, condensed at the bottom part of the reactor, and were mixed with pellets under the grille.
After the torrefaction at the atmospheric pressure, the condensable fraction was measured as the mass of condensed liquid in a rubber pipe, bottle with water, and bottom of the reactor. After the torrefaction at high-pressure, the condensable fraction was measured as the mass of condensed liquid in a rubber pipe and at the bottom of the reactor.
The mass of the non-condensable fraction was measured by subtraction. The mass yield (MY) of particular fractions were calculated as follow:
Mass yield of the solid fraction was calculated according to Equation (1).
M Y S F = m a s s   o f   t o r r e f i e d   p e l l e t i n i t i a l   m a s s   o f   p e l l e t · 100
Mass yield of the condensable fraction was determined according to Equation (2).
M Y C F = mass   of   condensed   fraction i n i t i a l   m a s s   o f   p e l l e t · 100
Mass yield of the non-condensable fraction was estimated according to Equation (3).
M Y N C F = 100 % M Y S F M Y C F
For solid fraction, the energy densification ratio (EDr), and the energy yield (EY) were calculated in accordance with the following Equations (4) and (5) [21]:
E D r = the   high   heating   value   of   torrefied   pellet h i g h   h e a t i n g   v a l u e   o f   p e l l e t
E Y = M Y S F · E D r

2.2.4. Thermogravimetric Analysis

The pellet was subjected to the thermogravimetric analysis (TGA) to better understand the reactions that occurred during the torrefaction. In the case of torrefaction under atmospheric pressure, the reactor heating rate was slowing down at around 225–250 °C to accelerate again above 250 °C. Interestingly, for high-pressure torrefaction, that temperature phenomenon was not observed.
The thermogravimetric analysis was performed using the stand-mounted tubular furnace (Czylok, RST 40 x 200/100, Jastrzębie-Zdrój, Poland) coupled with the laboratory balance (RADWAG, PS 750.3Y, Radom, Poland). The CO2 gas was subjected to the tubular furnace to provide the inert condition during analysis. The ~4 g pellet samples were heated from room temperature ~25 °C to 850 °C at three different heating rates: 2.5, 5.0, and 7.5 °C∙min−1. The heating rates were chosen to be consistent with the heating rate of the torrefaction reactor. The pellet mass changes were reported with intervals of 1 s. The mass measurements were done within an accuracy of 0.001 g. Obtained raw TGA data were smoothed before further processing. For smoothing, the locally estimated scatterplot smoothing (LOESS) method was used. The calculation of LOESS with parameter Span = 0.1 was done using OrginPro 2019b software (OriginLab, OrginPro 2019b, Northampton, MA, USA). Then, from the smoothed TG curve, the derivative curve (DTG) was calculated. DTG is defined as dTG/dT where dTG—mass change, %, dT—temperature change, °C [22].

2.2.5. Proximate Analysis

For pellet and torrefied pellets, the proximate analysis was conducted. The analysis contained moisture content (MC), organic matter content, also known as loss on ignition (OM), ash content (ash), combustible part content (CP), and high heating value (HHV). The used devices and standards for particular variable analysis are given in Table 1. Each analysis was performed in 6 replications.

2.2.6. Pellet Grinding Test

The samples of the raw pellets (with natural moisture content), dried pellets, and torrefied pellets were subjected to the grinding analysis to measure the influence of high-pressure and conventional torrefaction on the energy consumption of the grinding process. The grinding test was performed with the laboratory knife mill (Testchem, LMN-100, Pszów, Poland). The 2.2 kW knife mill was operated at 2800 rpm. For the test, a 1-mm screen was used. The samples of raw pellets (with the residual moisture in storage) and torrefied pellets were subjected to the grinding to measure the influence on grinding energy consumption of high-pressure torrefaction in comparison to the conventional one. The energy consumed for grinding was measured using a power network analyzer (LUMEL, ND40, Zielona Góra, Poland). The power measurements were taken every 0.2 s. First, the sample (100 ± 1 g) was placed in a knife mill chute, next power analyzer and knife mill were turned on, then after a while (when the knife mill reached an optimal speed), a sample was pushed onto the blades from the top. For each material, three replications were made.
Power data was used to calculate the total specific energy (Es) and the total effective energy (Ee). The Es was calculated by integration of the power vs. time and divided by the sample mass (to show a total consumed energy per pellet mass). The Ee was calculated by subtracting the specific idle energy from Es [27]. The Es and Ee units were recalculated to Wh∙kg−1.

2.2.7. Statistical Data Analysis

The data obtained from the proximate analysis and pellet grinding test were subjected to the statistical analysis to determine if different process conditions had a statistically significant impact on examined properties. The level of statistical significance was assumed at α = 0.05. The one-way analysis of variance (ANOVA) was used. The post-hoc Tukey’s HSD test was used when the ANOVA showed that there were significant differences between groups (p < 0.05). The statistical analysis was performed using software StatSoft, Statistica 13.3 (TIBCO Software Inc., Palo Alto, CA, USA).
The results of the post-hoc HSD Tukey’s test are presented in particular figures in the Results section. The results of the post-hoc test are marked by letters A, B, C. If the letters were the same, there was no statistical difference (p < 0.05) between groups. Letters are valid only for a particular plot. At each plot, the value and standard deviation were presented.

3. Results and Discussion

Raw data from the experiments are given in the Supplementary Material.xlsx. Supplementary Material has “Read me” sheet, which serves as a guide on how to find and interpret the data.

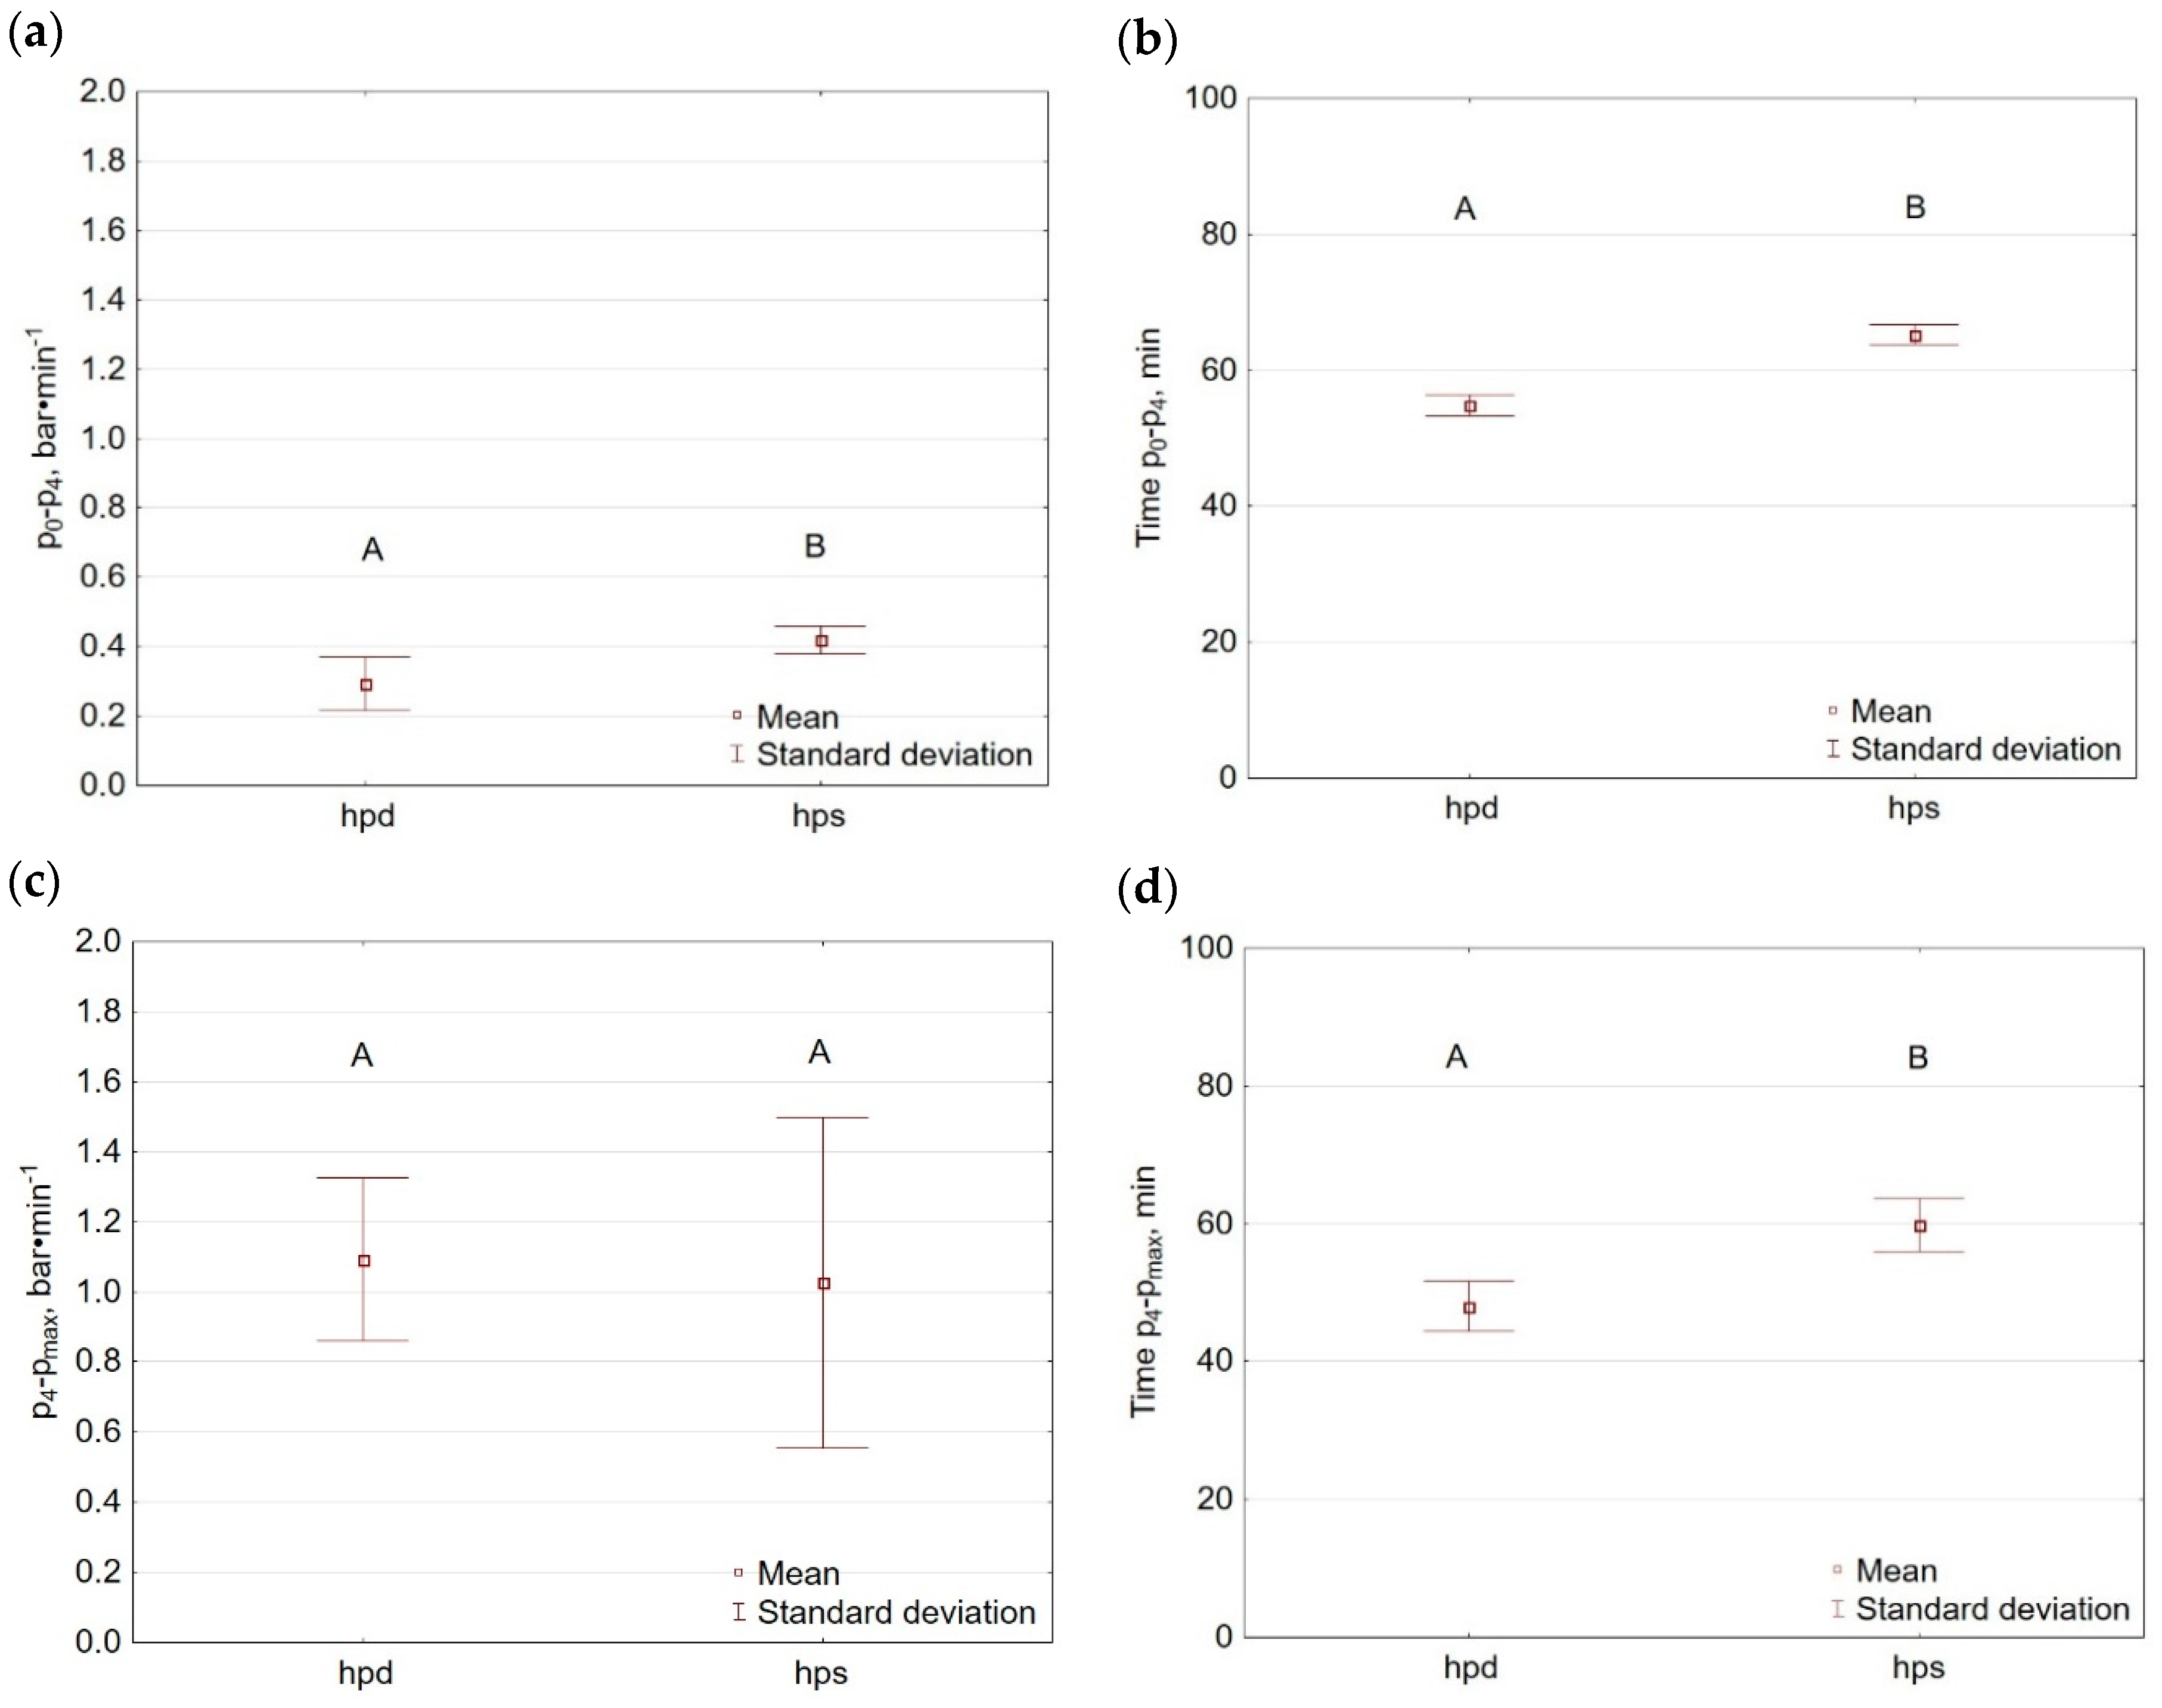
3.1. Torrefaction Process

Figure 4, Figure 5 and Figure 6 show examples of temperature and pressure patterns during torrefaction. Figure 4 presents the results for atmospheric pressure (ap) torrefaction. Figure 5—high-pressure torrefaction with decreasing pressure (hpd), and Figure 6—high-pressure torrefaction with steady pressure (hps). The average heating rate from 25–300 °C was ~2.6, ~2.90, and ~4.95 °C∙min−1 for ap, hpd, and hps, respectively (Figure 7d). The heating rate for each torrefaction process was the greatest in the range from 50–225 °C (Figure 7a–c). The heating rate for a range of 50–250 °C for ap, hpd, and hps was ~4.73, ~4.56, and ~4.69 °C∙min−1, respectively (Figure 7c).
The observed differences in the torrefaction processes for particular heating rates were not significant (p < 0.05) (Figure 7a–c). In all cases above ~225–250 °C, the heating rate slowed down. The greatest slowdown was measured for the ap variant (Figure 4, temperature range ~200–250 °C). The heating rate decrease was most likely associated with hot torrgas escape from the reactor—which is illustrated in the results of a TGA test. In the case of hpd and hps, the heating rate decrease was likely a result of insufficient insulation and heat loss. The side of the reactor was wrapped by fiberglass insulation tape (λ~0,05 W·m−1·K−1, thickness~7.5 cm), whereas the top and bottom of the reactor were not insulated. The endothermic reaction of the torrefied pellet was excluded as the reason for the drop in the heating rate, based on the differential scanning calorimetry (DSC) analysis from previous research [28]. There was no additional endothermic phenomenon for wood under this temperature range.
Different heating rates resulted in the starting point of the torrefaction process on the timeline scale. In the case of ap, the torrefaction started in ~101 min of the experiment, while in the case of hpd and hps in ~99, and ~85 min, respectively, the starting points did not differ significantly (p < 0.05) (Figure 7e).
It was observed that after the temperature reached 168–211 °C in hpd, and 183–223 °C in hps, the pressure started to increase, at 36 and 44 min (hpd and hps) (Figure A1). The pressure increase rate was not steady. The pressure started to increase after 34–42 process time (hpd and hps) (Figure A1). Initially, the pressure increases up to 4 bar was relatively slow (pressure rate of ~0.29 and ~0.42 bar∙min−1 for hpd and hps, respectively, was observed) (Figure 8a). After that, the pressure rate accelerated up to ~1.09 and ~1.03 bar∙min−1 for hpd and hps, respectively (Figure 8c). The time needed to reach 4 bar was similar to the time needed for pressure increase from 4 bar up to the maximum of 14 ± 1 bar (Figure 8b,d). The pressure increase rates were similar for hpd and hps. However, for hps, the pressure increase rate was significantly higher (p < 0.05). In each process, pressure increase was linked with temperature increase, which is illustrated in the dT and dp diagrams presented in Appendix A, Figure A2.
The energy demand for the torrefaction process is presented in Figure 9. The graphic presents the cumulative energy demand. The mean energy demand for torrefaction types was 2892, 2823, and 2705 Wh, for ap, hpd, and hps, respectively. The energy demand for hpd and hps to ap was decreased by around 2 and 6%, respectively. These differences are not statistically significant (p < 0.05).
The energy needed for the torrefaction of pellets is presented in Figure 10. The Enraw is the energy needed to process 1 kg of the raw pellet into a torrefied pellet (Figure 10a), whereas the Entorrefeid is the energy needed to produce 1 kg of the torrefied pellet with account for the weight loss of biomass (Figure 10b). The results show that the average energy demand for processing a pellet by conventional torrefaction was 1.2 Wh∙kg−1, and high-pressure torrefaction led to decreasing of this energy demand up to 1.18 (hpd) and 1.13 (hps), respectively. The results also show that the energy needed to produce 1 kg of the torrefied pellet was the lowest for hpd (Entorrefied = 2.06 Wh∙kg−1) and the highest for hps (Entorrefied = 2.13 Wh∙kg−1), respectively. For ap, the Entorrefied was 2.03 Wh∙kg−1. There were no statistical differences in energy needs (p < 0.05) (Figure 10).
Figure 11 illustrates pellets after torrefaction at different conditions. The pellet size decrease after torrefaction is apparent. Figure 11 presents a solid fraction from above the grille. Pellets torrefied at atmospheric pressure had partially disintegrated, and part of them fell under the grille. After each ap torrefaction, a part of the pellet that was on the center of the grille partially disintegrated and was not completely torrefied (Figure 12a). Such a problem did not occur for any of high-pressure torrefaction (Figure 12b). This observation may be explained by the inferior heat transfer from the reactor wall to the pellet located inside of the reactor. The used pellets were dried before torrefaction, and this likely resulted in lower thermal conductivity of pellets, and as a result, some pellets did not heat to the setpoint temperature. Whereas, in the case of high-pressure torrefaction, the heat could be better transferred due to the presence of steam that was held inside the reactor.
Figure 13 shows the fractional mass yields from the torrefaction process. Mean values of the solid fraction at atmospheric torrefaction (ap), at high-pressure torrefaction with decreasing pressure (hpd), and at high-pressure torrefaction with steady pressure (hps) were as follows: 58.1, 51.1, and 46.0%. The results show that, in most cases, the more condensable fraction was collected from the torrgas exhaust pipe (Figure 13c,d). The mean value of total condensable fractions was 23.2, 16.4, and 21.0% for ap, hpd, and hps, respectively. The mean value of non-condensable fraction was similar in the case of hpd and hps and was 26.3 and 26.1%, respectively, while for ap, the non-condensable fraction was 18.6%. There were no statistical differences in solid mass yield between processes (p < 0.05). The significant differences occurred for condensable fraction where hpd showed lower mass yield than ap, and hps (p < 0.05). On the other hand, the mass yield of the non-condensable fraction was the lowest for the ap process (p < 0.05).
Figure 14 shows the energy densification ratio (EDr) and energy yield (EY) for the solid fraction. In general, all torrefaction processes caused an increase in EDr and a decrease of EY. The mean value of EDr for over grille fractions was ~1.32, 1.38, and 1.44 for ap, hpd, and hps, respectively. In the case of the under-grille fractions, the EDr increased to 1.4 and 1.38 for hpd and hps, respectively. The EY for pellets from over grille were ~77, 70, and 66% for ap, hpd, and hps, respectively. In the case of under grille fraction, EY was 9 and 10% for hpd and hps, respectively. The total EY of solid fraction in each process was similar and was 76.8, 78.8, and 75.9% for ap, hpd, and hps, respectively. Observed differences were not statistically different (p < 0.05).
In the work of Manouchehrinejad and Mani [29], the softwood pellet was torrefied at a laboratory scale reactor at 290 °C and 30 min. The MY and EY of the solid fraction were ~59% and ~82%, respectively. The MY of the non-condensable fraction was ~18%, and MY of the condensable fraction was 23%. In the work of Arriola et al. [30], a pellet made of forest residues was subjected to the torrefaction experiment in a horizontal tube furnace in at 300 °C and 30 min. The MY, EDr, and EY of solid fraction were 50.5, 1.33, and 67.2%. These results are very similar to those obtained in the present work for the ap torrefaction.
Due to a novelty of the high-pressure torrefaction, research on high-pressure pellet torrefaction was not found. Nevertheless, a Tong et al. [31] conducted a pressure torrefaction of pine sawdust in a batch autoclave reactor (sample mass 15 g, heating rate 10 °C∙min−1, pressure 25–50 bar, residence time 15 min, temperature 300 °C) and compared with atmospheric pressure torrefaction. The results showed that MY of pressure torrefaction for solid, liquid, and gas fraction were ~42, ~39, and ~19%, respectively, and for the traditional torrefaction, these values were ~58, ~31, ~11%, respectively [31]. The obtained results (Figure 13e–g) and [31] show that pressure during torrefaction leads to the solid mass yield decrease in favor of liquid and gas fraction. On the other hand, Qin et al. [32] showed that during pressure pyrolysis (1–20 bar), pressure favored the increase of fixed carbon instead of volatile matter, which was due to the fact that a vapor pressure can limit the escape of volatile matter from a substrate. Nevertheless, despite the difference in that fact, this and previous research [31,32] showed the pressure increases HHV of the solid fraction.
The impact of pressure on an increase of energy densification ratio (HHV enhancement factor) of the solid fraction was also studied by Tong et al. [33]. Tong et al. [33] showed that the increase of EDr could also be facilitated by secondary reactions that take place between volatiles and biomass, but with an increase of process residence time, the pressure has more impact.

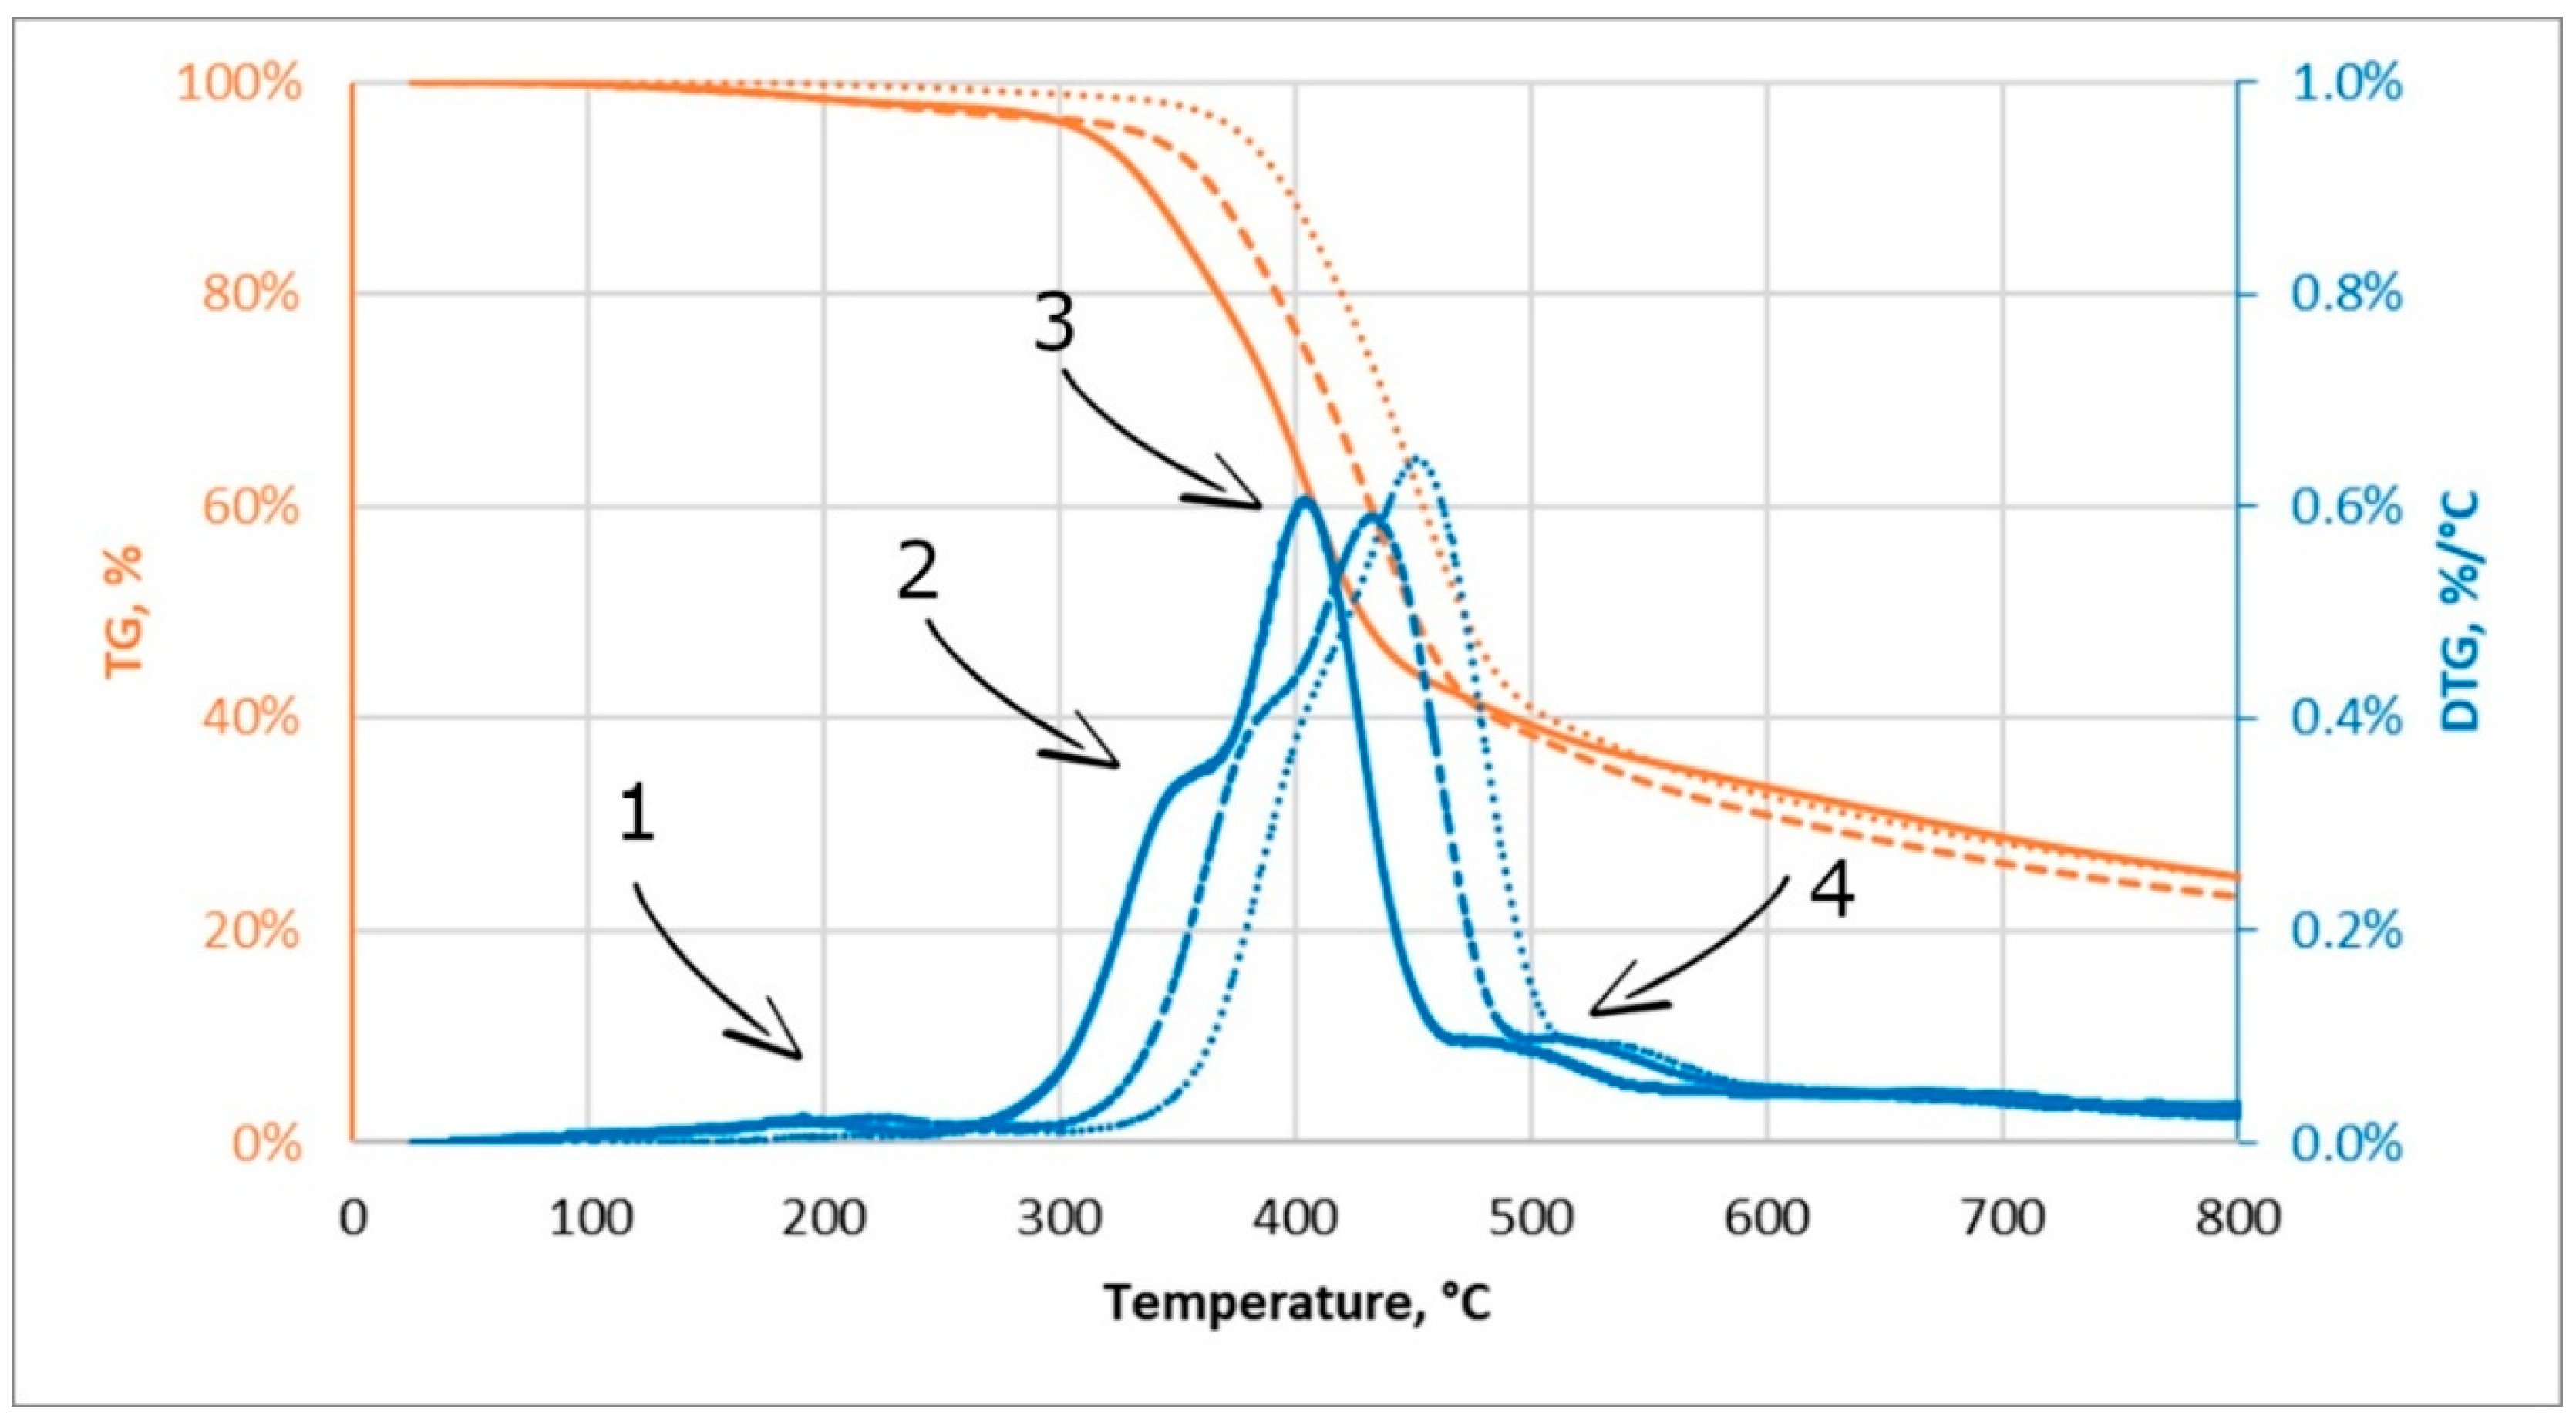
3.2. Thermogravimetric Analysis

The wooden pellet was subjected to the TGA/DTG analysis at the three-heating rates: 2.5, 5.0, and 7.5 °C∙min−1. The results of the analysis are presented in Figure 15. The TGA/DTG analysis also revealed that a tested pellet has a typical composition consisted of hemicellulose (peak 2), cellulose (peak 3), and lignin (peak 4) determined on the base of the degradation temperature peak. At each heating rate, the pellet started losing mass before the main torrefaction process took place <200 °C. This mass loss is probably associated with bounded water release (peak 1) [34].
These results match well with the observation of pressure increase in the reactor that started when temperature increased over ~150 °C (Figure 5 and Figure 6). At the 2.5 C∙min−1 heating rate, a mass loss associated with water evaporation started at ~150 °C and ended at ~250 °C. At 5.0 C∙min−1, the mass loss started earlier at 100 °C and ended at 250 °C with the greatest peak at around ~225 °C. At 7.5 C∙min−1, the mass losses associated with water evaporation were less visible, but the highest mass loss took place at ~250 °C (likely at this temperature, other volatile compounds were also degassed simultaneously). It is worth mentioning that at this torrefaction temperature, hemicellulose is already degraded (220–315 °C) [35].
The temperature range of 200–225 (250) °C (Figure A1) is also the place in which the greatest slowdown of the reactor heating rate was observed in atmospheric torrefaction, which is likely associated with hot gases released from the reactor. It shows that within this range, more energy is required to heat the reactor. For the high-pressure torrefaction, this phenomenon has a positive impact on the process and leads to faster heating of the reactor and, as a result, leads to energy savings.

3.3. Proximate Analysis

Figure 16 shows the results of the post-hoc HSD Tukey’s test for MC, OM, CP, ash, and HHV of raw and torrefied pellets. At each plot, the median value, lower and upper quartile, and the minimum and maximum value are presented. Raw data from the proximate analysis is available in the Supplementary Materials.
The mean values of moisture content were 5.44, 6.48, 6.79, and 3.90% for raw pellet, ap, hpd, and hps, respectively (Supplementary Materials). The moisture of raw pellet varied, which likely was a result of variations in the storage and time between separating each repetition. The post-hoc test showed that MC in hps is statistically (p < 0.05) lower than in the case of ap and hpd torrefaction (Figure 16a). The torrefaction had no impact on OM content (Figure 16b). The mean values of OM were 96.63, 98.79, 97.95, and 98.53% for raw pellet, ap, hpd, and hps, respectively (Supplementary Materials). The post-hoc test for the combustible part (Figure 16c) and ash content (Figure 16d) also showed that high-pressure torrefaction (hpd, hps) had a significant (p < 0.05) impact on it. The mean values of CP were 99.74, 99.50, 99.31, and 99.27%, for raw pellet, ap, hpd, and hps, respectively. In the case of ash, the mean values were 0.26, 0.50, 0.69, 0.73% (Supplementary Materials). These results show that high-pressure torrefaction leads to a higher reduction of CP and a higher increase in ash content compared with conventional torrefaction.
The greatest impact of high-pressure pellet torrefaction was seen on the HHV. The mean value of HHV for raw pellet, ap, hpd, and hps process was 20,371 J∙g−1, 26,901 J∙g−1, 28,028 J∙g−1, 29,398 J∙g−1, respectively (Supplementary Materials). This means that the conventional torrefaction increased a HHV by ~32%, and high-pressure torrefaction increased it by ~37% (hpd) and ~44% (hpd), and these changes were statistically significant (p < 0.05) (Figure 16e).
The post-hoc test was conducted for HHV results of under the grille fraction. We hypothesized that under grille fraction would have a higher value of HHV because this fraction mixed with the oil, which condensed after the process end and drained down into the bottom part of the reactor. In the case of hpd, there were no statistical differences in HHV between over and under grille fraction. For hps, the post-hoc test showed that under grille fraction has lower HHV than over grille fraction, which shows that the initial hypothesis was wrong.

3.4. Pellet Grinding Test

Figure 17a,b show the results of the post-hoc test for the grinding test. The plots present the total specific energy (Es), and effective energy (Ee), respectively. The mean value of the required energy needed to grind raw pellets was Es = 7.35 Wh∙kg−1, and Ee = 4.98 Wh∙kg−1 (Supplementary Materials). The torrefaction in all cases decreased significantly (p < 0.05), the energy requirements for pellet grinding (Figure 17). The mean value of the total specific energy and effective energy for the ap was Es = 2.58 Wh∙kg−1, and Ee = 1.58 Wh∙kg−1, while for the hpd it was Es = 2.45 Wh∙kg−1 and Ee = 1.29 Wh∙kg−1, and for hps was Es = 2.58 Wh∙kg−1 and Ee = 1.36 Wh∙kg−1. No improvements to grinding were observed for high-pressure torrefaction in comparison to the conventional one. In general, energy for pellet grinding after torrefaction decreased by ~65.5%.
The fact that the energy requirement for biomass grinding after the torrefaction is decreasing is well known [36]. Due to a wide range of grinding equipment types (also known as planetary ball mill, bond ball mill, ring roller mill, knife mill) with different energy consumption and optimal capacity [37], the obtained grinding results in this work cannot be directly compared to another research. Nevertheless, based on this limited dataset, it is valid to conclude that wood pellets torrefied at atmospheric pressure and under high-pressure required 2.5 to 3.9 times less energy than the dry pellets. Additionally, the pressure did not have a significant impact on the change of Ea and Es value (p < 0.05) when compared to atmospheric torrefaction (Figure 17).

4. Conclusions

This paper provides a comprehensive description of the new approach to biomass torrefaction under high-pressure conditions. A new type of laboratory pressure reactor was described and tested along with the experience gained during its operation. The initial results of the pressure impact on the key parameters of torrefaction were described, namely: energy demand for torrefaction process, mass and energy yields of particular fractions, proximate analysis with HHV of solid fraction, the energy demand to raw and torrefied pellet grinding. Based on the results, the following main conclusions arise from this research:
  • High-pressure torrefaction requires up to six percent less energy than a conventional one;
  • High-pressure torrefaction causes less disintegration of pellet compared to the conventional one;
  • High-pressure torrefaction leads to higher energy densification in pellets of up to 44% compared to the conventional one up to 32%;
  • The presence of high-pressure during torrefaction has no impact on torrefied pellet grinding energy demand in comparison to the conventional one; therefore, this factor appears to be less relevant in the future technology development process.
Pressure-aided torrefaction presents new opportunities to consider designing more efficient waste treatment installations. Such installations may be more expensive to build, but the additional benefits of pressure torrefaction, such as lower energy needs for the process and better quality of biochar, warrant future studies on these types of reactors.
In general, the study indicated that there is a potential to produce better quality solid fuels at a lower cost in comparison to conventional torrefaction. Further study is warranted due to the importance of the topic and gaps in knowledge.

Supplementary Materials

The following are available online at https://www.mdpi.com/1996-1073/13/18/4790/s1, The supplementary materials file contains data on the Initial tests and analysis of high-pressure torrefaction on wood pellets. The spreadsheet “T&p vs t” contains data of temperature and pressure changes of the reactor during torrefaction. The spreadsheet “Torrefaction energy demand” contains data of the power consumption for each torrefaction process. The spreadsheet “Torrefaction process analysis” contains data of fractions mass yield. The spreadsheet “TGA” contains data from the thermogravimetric analysis of the pellet. The spreadsheet “Proximate analysis” contains data of proximate analysis of the raw and torrefied pellets. The spreadsheet “HHV” contains data of the high heating value of raw and torrefied pellets. The spreadsheet “Grinding energy demand)” contains data of the energy used to raw and torrefied pellet grinding.

Author Contributions

Conceptualization, A.B.; methodology, K.Ś., B.M. and A.B.; validation, K.Ś.; formal analysis, B.M. and K.Ś.; investigation, B.M. and K.Ś.; resources, A.B.; data curation, K.Ś.; writing—original draft preparation, K.Ś. and B.M.; writing—review and editing, K.Ś., A.B., B.M. and J.A.K.; visualization, K.Ś. and B.M.; supervision, A.B. and J.A.K. All authors have read and agreed to the published version of the manuscript.

Funding

Partial support came from the Iowa Agriculture and Home Economics Experiment Station: project number IOW05556 (Future Challenges in Animal Production Systems: Seeking Solutions through Focused Facilitation, sponsored by Hatch Act and State of Iowa funds).

Acknowledgments

The presented article results were obtained as part of the activity of the leading research team Waste and Biomass Valorization Group (WBVG), https://www.upwr.edu.pl/research/50121/waste_and_biomass_valorization_group_wbvg.html.

Conflicts of Interest

The authors declare no conflict of interest. The funders had no role in the design of the study; in the collection, analyses, or interpretation of data; in the writing of the manuscript, or in the decision to publish the results.

Appendix A

Figure A1. Temperature/pressure patterns during the torrefaction of all experiments.
Energies 13 04790 g0a1aEnergies 13 04790 g0a1bEnergies 13 04790 g0a1cEnergies 13 04790 g0a1d
Figure A2. Derivatives of temperature/pressure patterns during the torrefaction of all experiments.
Energies 13 04790 g0a2aEnergies 13 04790 g0a2bEnergies 13 04790 g0a2c

References

  1. Stanek, W.; Czarnowska, L.; Gazda, W.; Simla, T. Thermo-ecological cost of electricity from renewable energy sources. Renew. Energy 2018, 115, 87–96. [Google Scholar] [CrossRef]
  2. Stanek, W.; Simla, T.; Gazda, W. Exergetic and thermo-ecological assessment of heat pump supported by electricity from renewable sources. Renew. Energy 2019, 131, 404–412. [Google Scholar] [CrossRef]
  3. Białowiec, A.; Micuda, M.; Koziel, J.A. Waste to carbon: Densification of torrefied refuse-derived fuel. Energies 2018, 11, 3233. [Google Scholar] [CrossRef] [Green Version]
  4. Peng, J.H.; Bi, X.T.; Sokhansanj, S.; Lim, C.J. Torrefaction and densification of different species of softwood residues. Fuel 2013, 111, 411–421. [Google Scholar] [CrossRef]
  5. Dudek, M.; Świechowski, K.; Manczarski, P.; Koziel, J.A.; Białowiec, A. The effect of biochar addition on the biogas production kinetics from the anaerobic digestion of brewers’ spent grain. Energies 2019, 12, 1518. [Google Scholar] [CrossRef] [Green Version]
  6. Medyńska-Juraszek, A. Biochar as a soil amendment. Soil Sci. Ann. 2016, 67, 151–157. [Google Scholar] [CrossRef] [Green Version]
  7. Nunes, L.J.R. A case study about biomass torrefaction on an industrial scale: Solutions to problems related to self-heating, difficulties in pelletizing, and excessive wear of production equipment. Appl. Sci. 2020, 10, 2546. [Google Scholar] [CrossRef] [Green Version]
  8. Ábrego, J.; Plaza, D.; Luño, F.; Atienza-Martínez, M.; Gea, G. Pyrolysis of cashew nutshells: Characterization of products and energy balance. Energy 2018, 158, 72–80. [Google Scholar] [CrossRef] [Green Version]
  9. Energy Innovation Austria, Current Austrian Developments and Examples of Sustainable Energy Technologies. Available online: https://www.energy-innovation-austria.at/article/torrefizierung/?lang=en (accessed on 25 July 2020).
  10. Banse, T. Your Word of the Day is “Torrefaction.” First-of-Its Kind Plant to Open in Eastern Oregon. Available online: https://www.kuow.org/stories/your-word-of-the-day-is-torrefaction-first-of-its-kind-plant-to-open-in-eastern-oregon (accessed on 25 July 2020).
  11. Kanwal, S.; Chaudhry, N.; Munir, S.; Sana, H. Effect of Torrefaction Conditions on the Physicochemical Characterization of Agricultural Waste (Sugarcane Bagasse). Waste Manag. 2019, 88, 280–290. [Google Scholar] [CrossRef] [PubMed]
  12. Wei, W.; Mellin, P.; Yang, W.; Wang, C.; Hultgren, A.; Salman, H. Utilization of Biomass for Blast Furnace in Sweden-Report I: Biomass Availability and Upgrading Technologies; Technical Report for KTH Royal Institute of Technology: Stockholm, Sweden, December 2013. [Google Scholar] [CrossRef]
  13. Babinszki, B.; Jakab, E.; Sebestyén, Z.; Blazsó, M.; Berényi, B.; Kumar, J.; Krishna, B.B.; Bhaskar, T.; Czégény, Z. Comparison of hydrothermal carbonization and torrefaction of azolla biomass: Analysis of the solid products. J. Anal. Appl. Pyroly 2020, 149, 104844. [Google Scholar] [CrossRef]
  14. Bergman, P.C.A.; Boersma, A.R.; Zwart, R.W.R.; Kiel, J.H.A. Torrefaction for Biomass Co-Firing in Existing Coal-Fired Power Stations. BIOCOAL. The Netherlands. 2005; p. 71. Available online: https://www.osti.gov/etdeweb/biblio/20670903 (accessed on 25 July 2020).
  15. Surup, G.R.; Leahy, J.J.; Timko, M.T.; Trubetskaya, A. Hydrothermal carbonization of olive wastes to produce renewable, binder-free pellets for use as metallurgical reducing agents. Renew. Energy 2020, 155, 347–357. [Google Scholar] [CrossRef]
  16. Ahmad, F.; Silva, E.L.; Varesche, M.B.A. Hydrothermal processing of biomass for anaerobic digestion–A review. Renew. Sustain. Energy Rev. 2018, 98, 108–124. [Google Scholar] [CrossRef]
  17. Wannapeera, J.; Worasuwannarak, N. Upgrading of woody biomass by torrefaction under pressure. J. Anal. Appl. Pyroly. 2012, 96, 173–180. [Google Scholar] [CrossRef]
  18. Malik, B.; Pirzadah, T.B.; Islam, S.T.; Tahir, I.; Kumar, M.; ul Rehman, R. Biomass pellet technology: A green approach for sustainable development. Agric. Biomass Based Potent. Mater. 2015, 403–433. [Google Scholar] [CrossRef]
  19. Kułażyński, M.; Kaczmarczyk, J.; Świątek, Ł.; Pstrowska, K. Technological problems occurring during the implementation process of co-firing brown coal with biomass. Logistyka 2015, 277–282. Available online: http://yadda.icm.edu.pl/yadda/element/bwmeta1.element.baztech-2416d3f1-2fe1-489a-b3a5-b968e2d2280d (accessed on 25 July 2020).
  20. Chen, W.H.; Peng, J.; Bi, X.T. A state-of-the-art review of biomass torrefaction, densification and applications. Renew. Sustain. Energ. Rev. 2015, 44, 847–866. [Google Scholar] [CrossRef]
  21. Świechowski, K.; Liszewski, M.; Babelewski, P.; Koziel, J.A.; Białowiec, A. Fuel properties of torrefied biomass from pruning of oxytree. Data 2019, 4, 55. [Google Scholar] [CrossRef] [Green Version]
  22. Stępień, P.; Świechowski, K.; Hnat, M.; Kugler, S.; Stegenta-Dąbrowska, S.; Koziel, J.A.; Manczarski, P.; Białowiec, A. Waste to carbon: Biocoal from elephant dung as new cooking fuel. Energies 2019, 12, 4344. [Google Scholar] [CrossRef] [Green Version]
  23. PN-EN 14346:2011 Standard. Waste Characteristics. Calculation of Dry Mass Based on Dry Residue or Water Content. Available online: https://infostore.saiglobal.com/en-au/Standards/PN-EN-14346-2011-932471_SAIG_PKN_PKN_2197939 (accessed on 25 July 2020).
  24. PN-EN 15169:2011 Standard. Waste Characteristics. Determination of Organic Matter Content for Waste, Slurry and Sludge. Available online: http://sklep.pkn.pl/pn-en-15169-2011p.html (accessed on 25 July 2020).
  25. PN-Z-15008-04:1993 Standard. Municipal Solid Waste. Analysis of Combustible and Non-Combustible Content. Available online: http://sklep.pkn.pl/pn-z-15008-04-1993p.html (accessed on 25 July 2020).
  26. PN-G-04513:1981 Standard. Solid fuels. Determination of the Higher Heating Value and the Lower Heating Value. Available online: http://sklep.pkn.pl/pn-g-04513-1981p.html (accessed on 25 July 2020).
  27. Williams, O.; Lester, E.; Kingman, S.; Giddings, D.; Lorimor, S.; Eastwick, C. Benefits of dry comminution of biomass pellets in a knife mill. Biosyst. Eng. 2017, 160, 42–54. [Google Scholar] [CrossRef]
  28. Świechowski, K.; Syguła, E.; Koziel, J.A.; Stępień, P.; Kugler, S.; Manczarski, P.; Białowiec, A. Low-temperature pyrolysis of municipal solid waste components and refuse-derived fuel—process efficiency and fuel properties of carbonized solid fuel. Data 2020, 5, 48. [Google Scholar] [CrossRef]
  29. Manouchehrinejad, M.; Mani, S. Torrefaction after pelletization (TAP): Analysis of torrefied pellet quality and co-products. Biomass Bioenerg. 2018, 118, 93–104. [Google Scholar] [CrossRef]
  30. Arriola, E.; Chen, W.H.; Chih, Y.K.; De Luna, M.D.; Show, P.L. Impact of post-torrefaction process on biochar formation from wood pellets and self-heating phenomena for production safety. Energy 2020, 207, 1–13. [Google Scholar] [CrossRef]
  31. Tong, S.; Xiao, L.; Li, X.; Zhu, X.; Liu, H.; Luo, G.; Worasuwannarak, N.; Kerdsuwan, S.; Fungtammasan, B.; Yao, H. A gas-pressurized torrefaction method for biomass wastes. Energ. Convers. Manag. 2018, 173, 29–36. [Google Scholar] [CrossRef]
  32. Qin, L.; Wu, Y.; Hou, Z.; Jiang, E. Influence of biomass components, temperature and pressure on the pyrolysis behavior and biochar properties of pine nut shells. Bioresour. Technol. 2020, 313, 123682. [Google Scholar] [CrossRef]
  33. Tong, S.; Sun, Y.; Li, X.; Hu, Z.; Dacres, O.D.; Worasuwannarak, N.; Luo, G.; Liu, H.; Hu, H.; Yao, H. Gas-pressurized torrefaction of biomass wastes: Roles of pressure and secondary reactions. Bioresour. Technol. 2020, 313, 1–8. [Google Scholar] [CrossRef] [PubMed]
  34. Grycova, B.; Pryszcz, A.; Krzack, S.; Klinger, M.; Lestinsky, P. Torrefaction of biomass pellets using the thermogravimetric analyser. Biomass Convers. Biorefinery 2020. [Google Scholar] [CrossRef]
  35. Yang, H.; Yan, R.; Chen, H.; Lee, D.H.; Zheng, C. Characteristics of hemicellulose, cellulose and lignin pyrolysis. Fuel 2007, 86, 1781–1788. [Google Scholar] [CrossRef]
  36. Repellin, V.; Govin, A.; Rolland, M.; Guyonnet, R. Energy requirement for fine grinding of torrefied wood. Biomass Bioenerg. 2010, 34, 923–930. [Google Scholar] [CrossRef] [Green Version]
  37. Williams, O.; Newbolt, G.; Eastwick, C.; Kingman, S.; Giddings, D.; Lorimor, S.; Lester, E. Influence of mill type on densified biomass comminution. Appl. Energ. 2016, 182, 219–231. [Google Scholar] [CrossRef]
Figure 1. Experiment setup to determine fuel properties of torrefied pellets produced at atmospheric and high-pressure conditions.
Energies 13 04790 g001
Figure 2. Reactor design. (1) exhaust torrgas pipe, (2) upper valve, (3) safety valve, (4) manometer, (5) cooler, (6) reactor chamber wrapped by heating mats and insulation, (7) lower valve.
Energies 13 04790 g002
Figure 3. (a) Loading of pellets into the reactor, (b) Protection against air ingress into the reactor. Legend: (1) grille handle, (2) thermocouple pocket, (3) bottle with water and holes in the cover, (4) the terminal of exhaust torrgas pipe.
Energies 13 04790 g003
Figure 4. An example of temperature patterns during the atmospheric torrefaction (ap), green dashed line stands for start and end of the torrefaction process (30 min).
Energies 13 04790 g004
Figure 5. An example of temperature/pressure patterns during the high-pressure torrefaction with decreasing pressure (hpd) torrefaction, green dashed line stands for start and end of the torrefaction process (30 min).
Energies 13 04790 g005
Figure 6. An example of temperature/pressure patterns during the high-pressure torrefaction with steady pressure (hps) torrefaction, green dashed line stand for start and end of the torrefaction process (30 min).
Energies 13 04790 g006
Figure 7. The heating rate of the reactor and heating time to setpoint temperature for a particular torrefaction process, (a) heating rate from 20 to 50 °C, (b) heating rate from 50 to 225 °C, (c) heating rate from 50 to 250 °C, (d) heating rate from 25 to 300 °C, (e) heating time up to 300 °C.
Energies 13 04790 g007
Figure 8. The pressure-increase rate of the reactor and time to a particular pressure point, (a) pressure rate for 0 to 4 bar, (b) time from pressure increase start to pressure 4 bar, (c) pressure rate from 4 bar to max process pressure, (d) time from pressure 4 bar to max pressure.
Energies 13 04790 g008
Figure 9. Cumulative energy demand for the torrefaction process.
Energies 13 04790 g009
Figure 10. Energy demand to torrefied pellet production, (a) energy used to convert 1 kg of the pellet, (b) energy needed to produce 1 kg of the torrefied pellet.
Energies 13 04790 g010
Figure 11. Samples of pellets before and after torrefaction (a) raw pellet, (b) ap, (c) hpd, (d) hps.
Energies 13 04790 g011
Figure 12. Torrefied pellet at (a) atmospheric pressure, (b) over atmospheric pressure. 1—pellet that was partially disintegrated and not fully torrefied during the ap process.
Energies 13 04790 g012
Figure 13. Torrefaction process fractions mass yields, (a) mass yield of solid fraction from over grille, (b) mass yield of solid fraction from under grille, (c) mass yield of condensable fraction from exhaust fraction, (d) mass yield of condensable fraction from the bottom valve, (e) total mass yield of solid fraction, (f) total mass yield of condensable fraction, (g) total mass yield of the non-condensable fraction.
Energies 13 04790 g013
Figure 14. Energy densification ratio (EDr) and energy yield (EY) of the solid fraction, (a) EDr of over grille fraction, (b) EDr of under grille fraction, (c) EY of over grille fraction, (d) EY of under grille fraction, (e) EY of the total solid fraction.
Energies 13 04790 g014
Figure 15. Results of thermogravimetric analysis (TGA)/derivative curve (DTG) analysis Heating rates are presented by different lines. Solid line—2.5 °C∙min−1, dashed line—5.0 °C∙min−1, dotted line—7.5 °C∙min−1. 1—bound water, 2—hemicellulose, 3—cellulose, 4—lignin.
Energies 13 04790 g015
Figure 16. The results of the post-hoc HSD Tukey’s test for proximate analysis of torrefied pellet (a) moisture content (MC), (b) organic matter content (OM), (c) combustible part (CP), (d) ash, (e) high heating value (HHV).
Energies 13 04790 g016aEnergies 13 04790 g016b
Figure 17. The results of the post-hoc HSD Tukey’s test for the grinding test, (a) total specific energy (Es), (b) specific effective energy (Ee).
Energies 13 04790 g017
Table 1. Proximate analysis list and standard methods.
VariableAnalysis Device (Manufacturer, Model, City, Country)Analysis StandardReference
MCLaboratory dryer (WAMED, KBC-65W, Warsaw, Poland)PN-EN 14346:2011 [23]
OMMuffle furnace (SNOL, 8.1/1100, Utena, Lithuania)PN-EN 15169:2011[24]
CPMuffle furnace (SNOL, 8.1/1100, Utena, Lithuania)PN-Z-15008-04:1993[25]
AshMuffle furnace (SNOL, 8.1/1100, Utena, Lithuania)PN-Z-15008-04:1993[25]
HHVCalorimeter (IKA® Werke GmbH, C200, Staufen, Germany)PN-G-04513:1981[26]

