Abstract
Operations and Maintenance (O&M) can make up a significant proportion of lifetime costs associated with any wind farm, with up to 30% reported for some offshore developments. It is increasingly important for wind farm owners and operators to optimise their assets in order to reduce the levelised cost of energy (LCoE). Reducing downtime through condition-based maintenance is a promising strategy of realising these goals. This is made possible through increased monitoring and gathering of operational data. SCADA data are useful in terms of wind turbine condition monitoring. This paper aims to perform a comprehensive comparison between two types of normal behaviour modelling: full signal reconstruction (FSRC) and autoregressive models with exogenous inputs (ARX). At the same time, the effects of the training time period on model performance are explored by considering models trained with both 12 and 6 months of data. Finally, the effects of time resolution are analysed for each algorithm by considering models trained and tested with both 10 and 60 min averaged data. Two different cases of wind turbine faults are examined. In both cases, the NARX model trained with 12 months of 10 min average Supervisory Control And Data Acquisition (SCADA) data had the best training performance.
1. Introduction
Reducing downtime through predictive or condition-based maintenance is one way of improving asset availability in an effort to decrease the levelised cost of energy (LCoE), which is a key aspect to improve the competitiveness of renewable energy investments, particularly in offshore wind turbines [1,2]. Extracting as much information from existing Supervisory Control And Data Acquisition (SCADA) systems as possible is beneficial for operators to help make informed maintenance decisions, especially in such cases where condition monitoring (CM) systems are not readily available.
There are many approaches and models that can be used to detect faults throughout wind turbine (WT) drivetrains, with much of the literature today focusing on normal behaviour modelling. Typically, these types of models will be tailored to a specific component by developing a model to predict a chosen parameter based on multiple inputs. The error between the model output and measured value is then compared and tracked, giving a good indication to whether or not the component or parameter is operating as expected. They do, however, rely on enough data to effectively describe and model normal behaviour prior to any faults existing in a particular component or subsystem. Additionally, they cannot be used for detailed fault diagnostics, only really having the ability to state whether or not there is anomalous behaviour within the entire subsystem. This, however, is still a useful exercise, flagging potential issues and allowing for investigative inspection and maintenance to occur before a major catastrophic failure might develop.
With so many different models in the literature currently tailored to very specific components each with a unique dataset, as Tautz-Weinert and Watson describe in [3], it becomes difficult to compare approaches and understand which algorithms and methodologies are better suited to a particular problem. The main aim of this paper is to evaluate the effect of including the time history within the normal behaviour model. With that being said, this paper aims to provide, for the first time in Wind Energy literature, a comprehensive comparison of the following. It will do this using two single failure case studies.
- Comparison of the two main types of Normal Behaviour Modeling (NBM): full signal reconstruction (FSRC) and autoregressive models with exogenous inputs (ARX).
- Explore the effects of the training time period on each models ability to detect anomalies by considering models trained with both 12 months and 6 months.
- Analyse the effects of time resolution fault diagnostics for each algorithm by considering models training and testing with both 10 min and 1 h averaged data.
- Understand the effects different decision metrics have on anomaly detection over different time windows leading up to failure.
This paper aims to answer the question surrounding the amount of appropriate training data required for normal behaviour modelling, and whether a lower resolution of data can be substituted effectively. It is assumed that the autoregression quality of the NARX model with 12 months of training data and finer resolution of data will perform best.
2. Literature Review
Supervisory Control and Data Acquisition (SCADA) systems provide a cost-effective solution for wind turbines condition and performance monitoring. Analysing SCADA data for failure detection has been widely researched in the literature using a variety of approaches.
Trending is one of the first methods that was implemented, as it is easily interpreted and monitors the progressive change of parameters over time. Trending using principal component analysis with an auto-associative neural network can be used to train normal operation data and the principal components produced are evaluated through statistic model variations in [4]. A technique using correlations among relevant SCADA data is investigated in [5]. The relationship between gearbox temperature, power output and efficiency are derived using the first law of thermodynamics in [6,7]. It is shown that temperature trend rises, while the efficiency drops months before a planetary gear failure. Clustering has been applied to tackle the challenges that trending introduces when a large fleet of data needs to be analysed. Self-organising maps have proven to be a popular technique because of their ability to represent large datasets [4,8].
Both trending and clustering have limitations in online monitoring because of the difficulty in interpreting the results and changes in data. Normal behaviour models (NBM) have therefore gained more popularity in condition monitoring applications, including SCADA data analysis.
NBM is a form of regression-based anomaly detection. Regression aims to model the relationship between a dependent variable and one or more independent variables. In the context of wind turbine anomaly detection, this relationship is captured by having a training phase, where regression models are fit when the system is considered to be in a healthy state. The new data that are used as input in the system is compared to the model’s prediction. The residual of measured minus modelled signal acts as a clear indicator for a possible fault. In successfully trained models, normal condition residuals are close to 0 with a small tolerance, whereas for abnormal conditions (or conditions not captured by the model), the residuals are shifted away from 0.
The model selection is particularly significant as it determines the ability to learn from past data and generalise into the future. Models can be linear or nonlinear. Normal behaviour models have been introduced in SCADA data analysis using either linear and polynomial approaches or Artificial Neural
Networks (ANNs). ANNs are suitable for SCADA data because of their ability to capture nonlinear relationships between observations, as shown in [9,10] for gearbox bearing and cooling models.
2.1. Neural Networks (NN)
Neural Networks have been used for anomaly detection, either for regression or normal behaviour modelling. Typically, a neural network will take external inputs and predict a target variable, and these external inputs will have been decided upon through either domain knowledge, or some data-driven procedure.
A back-propagation neural network (BPNN) was used in [11] for both feature selection and anomaly detection. The paper uses the error from the output of a BPNN to analyse the relevance of various features. The selected parameters are used as inputs into another BPNN that again uses the root mean squared error (RMSE) to detect anomalies. The RMSE is the square root of the mean of the squared error between the actual and predicted outputs. In the case study of SCADA data from a 1.5 MW wind turbine, it was found that the RMSE trended upwards before failure. One figure shows that this started around 20 days to failure.
One paper [12] has looked at using various different configurations of regression neural networks for anomaly detection on SCADA data from operational offshore wind turbines. The three configurations examined were quantile regression, distribution regression and multi-task learning distribution regression. All three models were found to predict the power accurately, and could detect failures an hour ahead.
Anomaly detection for the various power electronics was explored in [13]. This paper looked at using BPNN to develop a prediction model, and then different models were trained on different types of sample data with the models being selected based on accuracy. Abnormality of the wind turbine condition was quantified, and anomalies were then evaluated in each wind turbine condition parameter using fuzzy synthetic evaluation.
Other techniques have also been tested on simulations and test rigs when operational data is unavailable. One paper [14] has used Restricted Boltzmann Machines (RBM) for anomaly detection, first on a 5 MW wind turbine model that simulated the faults, and then on experimental test rig data. The technique uses a spatiotemporal pattern network to learn both the spatial and temporal features, then the RBM learns the patterns and captures the behaviour. Low probability events are then flagged as anomalous. When the model was tested on anomalous data mixed with normal data, the framework could still find anomalies.
2.2. NARX
Nonlinear Autoregressive Neural Network with Exogenous Inputs (NARX) is a neural network that also takes into account the previous target variable along with some current external inputs. This has been used previously for anomaly detection, both in the wind energy field and beyond.
In [15], the authors utilised a NARX model for anomalies in the wind turbine gearbox SCADA data. The Mahalanobis distance (MHD) of the vector, which takes into account the inverse correlation of the data, of errors and the target values was used as the metric to evaluate the model. The probability of these distances were then found, and a threshold was based upon this. It was shown to perform better than multiple other methods from the literature, specifically for the gearbox bearing temperature.
Another use of NARX and MHD was explored in [16], with SCADA data as an input again. However, a different threshold was used, this being the maximum MHD observed in the training period. In the test stage, if this threshold is crossed, then it is considered a warning, and then continuous warnings triggers an alarm. For the case study of a 2MW wind turbine, a fault in the gearbox bearing model was detected 6 months before failure.
Outside of wind energy NARX has been used for condition monitoring. In [17], a comparison between dynamic neural networks and NARX was made. This was for detecting faults within the cooling system fan of a motor. NARX was shown to be the best of the two, and was then tested on unseen data afterwards. In [18], NARX was used to detect known faults introduced to a distillation column, with these faults being detected when the error between the predicted and measured values exceeded the upper or lower control limits. It was noted that the missed detection rate of the model increased when there was a slow response on other variables from the fault. Solar irradiance prediction is another use for NARX, shown in [19]. The frequency, phase and wavelet coherence was used to validate the model. The data was then processed by scaling the data between −1 and 1, and then outliers were removed using the MHD. NARX was then shown to be best at predicting the solar irradiance.
It can then be seen that NARX is appropriate for various predictive uses, and has also been shown to be suitable for anomaly detection and condition monitoring for a wind turbine.
2.3. Previous Comparisons in Literature
This subsection presents previous comparative studies between NARX and other NN techniques. These studies were for other areas of interest than wind energy. One paper [20] compares three techniques for predicting water inflow for two different case studies of reservoirs. It was found that for both case studies the NARX and artificial NN models behaved comparatively, whereas a nonlinear autoregression NN was shown to perform best out of the three, with almost half the RMSE of the other two models. However, this was for very low resolution data, looking at monthly aggregates over the span of years.
Another example [21] compares a deep back-propagation NN to a deep NARX model for predicting opening stock prices, based on a sliding window of previous data. This was quite a limited comparison, with only one metric being compared (the R-value of the predictions). It showed a very slight increase when using the NN compared to NARX, a difference of 0.02.
Another paper [22] has compared Elman NN and NARX for flood prediction on some short-term data with a 10 min aggregate time resolution in a river in Malaysia. It was unclear what was being input to the models. Both models were tested on the same case to predict the water level, and it was found that Elman NN outperformed the NARX model slightly, with NARX underestimating the water level throughout most of the time period. Again, similar to before, this was one limited case and not a thorough comparison between the two models.
One study [23] compared different neural networks for “data obtained by wood pellet and pine coneparticle gasification in a downdraft gasifier”. It compared four different NN models and a NARX model, these include an Elman NN and a feed-forward back-propagation NN, for two different case studies. This paper was a very thorough comparison with different case studies and model configurations, with different metrics of quality. This paper stated overall that NARX was best for predicting the “syngas” composition for this gasifier. Overall, time delayed models were best.
A final comparison [24] investigated two multiple-input multiple-output (MIMO) neural networks for modelling a gas turbine engine. The study found that the NARX model was better at generalising than the standard NN, however it did take longer to train. Moreover, the performance was comparable between the two.
In summary, it does appear that NARX can outperform NN in various applications, it can also be seen that NN is either comparable, or better than NARX, in a range of applications. It would appear that there is a degree of specificity to these comparisons.
While this section has reviewed various examples of NARX and NN models for wind energy, there has not been (to the authors’ knowledge) a thorough comparison of the effect of autoregression between identical models for wind turbines. Therefore, this paper has examined the effect of autoregression for wind turbines, through neural networks and nonlinear autoregression neural networks with exogenous inputs. Those papers that were comparisons between the two were not in the field of wind energy, and, for many of them, were not comprehensive.
3. Methodology
This section describes the two models compared: Full Signal Reconstruction using a feed-forward neural networks and autoregression with exogenous inputs using NARX. Different training periods (6 or 12 months), time resolutions (1 h or 10 min averaged SCADA data) and RMSE windows are demonstrated.
This paper examines two case studies, both for the same turbine model and same failure case. The turbines failed due to a fault in the high speed shaft of the drivetrain. Case 1 is examined in Section 4.1, with comparisons made to case 2 in Section 4.3.
The SCADA data were processed before training and testing. This involved both cleaning the data and selecting the features for training the models. The data were cleaned by simply removing data where the turbine was producing negative power values. Features were then selected using domain knowledge. The input features were the average values for Generator Speed, Generator Temperature, Bearing Temperature, Wind Speed, Power and Nacelle Temperature. The output feature was the average value of the gearbox temperature.
3.1. Training and Testing Case Studies
Two of the main types of normal behaviour models are FSRC and ARX, with the key difference between them being that ARX also take into consideration the time history of the target variable. This study will use feed-forward neural network model for FSRC and nonlinear autoregressive exogenous neural network (NARX) for the ARX model. These two algorithms are compared for a variety of cases to study the impact of training period, time resolution and error window has on fault detection rate and time. Table 1 describes all the training cases used for the investigation, in which the same NN and NARX models were used in order to maintain a fair comparison. Training periods of both 6 and 12 months are demonstrated for the two models, each one with time resolution of 10 min and 1 h. This gave a total of 8 trained algorithms to be used to test new observations leading up to failure.

Table 1.
Case studies
When it came to testing the trained algorithms on the final 6 months leading up to failure, additional cases were introduced for each trained algorithm which considered the time window, in which the RMSE was calculated to compare to the training period. These windows were chosen to be on a daily, weekly and monthly basis to investigate which was best at detecting anomalies or longer term changes in behaviour. Again, these cases are summarised in Table 1 along with the 8 training cases described in the previous section. The purpose of these cases was to effectively compare the effects of using varied training lengths and different time resolutions during training and testing of the two models.
3.2. Model Description
The models were generated using Matlab’s neural network time series and neural network fitting applications. Each model was generated with 10 neurons in 1 hidden layer, with 1 input layer and 1 output layer. These models were trained on 6 input features and 1 output feature, which was a delayed input for the NARX models. The number of hidden neurons is typically selected to be around the order of input features, as there are 6 input features. For the NARX model the timestep delay was set at 2. The configuration is shown in Figure 1.
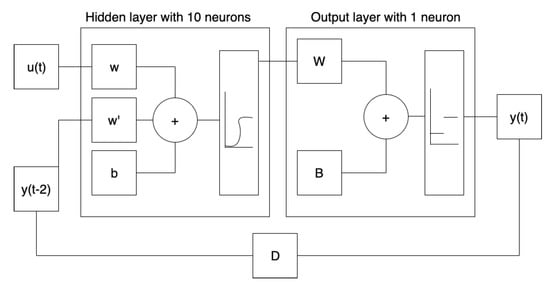
Figure 1.
Nonlinear autoregressive exogenous neural network (NARX) model configuration.
Here, the u(t) values are the exogenous (other) inputs, and the y(t-2) are the delayed outputs. The w (or W) terms are weights that act upon these inputs and delayed outputs. These are used in an activation function, where the weighted sum of the inputs and delayed outputs have to exceed some bias (b or B) before the neuron is activated and sends information to the next layer. These weights and biases are iteratively learned during training to reduce some cost function, which is dependent on the error between the actual outputs and the predicted ones.
The number of neurons was chosen as it was of the order of the number of inputs, and would also improve the computational time. Both models are essentially the same, with the exception of the autoregression in the NARX model. The similarity was decided upon as the purpose of this study was to examine the difference between regression that does, and does not, take into account the time history of the target variable. Therefore, by keeping the models the same other than the autoregression element, this can be observed.
3.3. Algorithm Training and Validation
Each of the 8 algorithms were trained with a set training period and time resolution as described in Table 1. That training period was split further into three groups: 70% for training the algorithm, 15% for validating the algorithm to reduce overfitting and finally 15% for independent testing of the algorithm once trained and validated. The models were trained with the Levenberg–Marquardt algorithm on Matlab, which uses more computational power but is quicker. For each of these three groups, the performance of the algorithm can be described by both the mean squared error (MSE) and the correlation coefficient (R-value), which if looked at independently give a good indication how well the model can predict the output for any given set of inputs. By comparing the groups for each model also indicates how well its generalises to new observation, with a small difference in both MSE and R-value meaning the model has minimal overfitting, or in other words good generalisation. In practical terms, higher generalisation gives higher confidence to any anomalies which are detected for new data observations. During the training stage, each model was “retrained”, using Matlab’s option to retrain the model, until good generalisation was achieved. Figure 2 shows the R-value for the three training phases for each model examined, the training, validation and testing phases. Each data point represents the training, testing and validation performance for each of the 8 models.
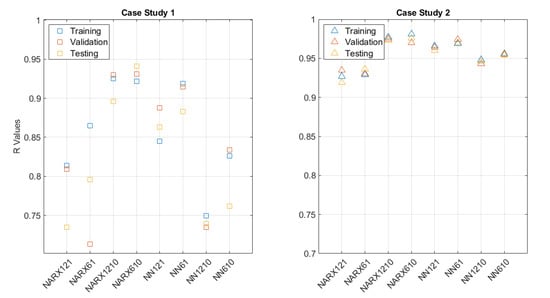
Figure 2.
Comparison of the R-values for both cases investigated in this paper, during training.
The models are used for anomaly detection, with the error between the predicted and actual target variable being used as the metric. This error is compared to the training RMSE of the specific model in Table 1. This was done with the assumption that the data during training would be considered healthy compared to the data in the testing period. As the period examined ends with failure, it is expected that the errors should increase in magnitude and frequency in the lead up to the end of the data.
3.4. Result Processing
The output of the 8 algorithms was a prediction of the target variable based on the external inputs and, in the case of NARX, the previous target variable. These predictions were then compared to the actual target values, and an error was produced. As these errors could also be negative, the absolute error was found and then plotted. This was compared to the root mean square of the absolute error of the training period (RMSAE). Therefore, this is the square root of the mean of the squared absolute error between the actual and predicted outputs from the model.
Thresholds that were used for deciding upon anomalies were the RMSAE, the RMSAE plus the first standard deviation of the absolute error, and the RMSAE plus the second standard deviation. These thresholds defined whether a particular value was an anomaly, and how strong an anomaly this was.
To further analyse the absolute error, both a moving and sliding window were applied to compare the models. The moving window moved the window forward one time-step per iteration and found the previous day, week, or month’s RMSE. The sliding window looked at the first day, week, or month’s worth of time-steps, then moved on to the next day, week, or month and continued this for the rest of the training or testing period. This is shown in Figure 3. It is hypothesised that the sliding window will be more appropriate as it looks at each time period independently, so a short-term anomaly would only show in the window examined; however, the moving window will capture it over a longer period as the first iteration of that time period will capture it until the last iteration.
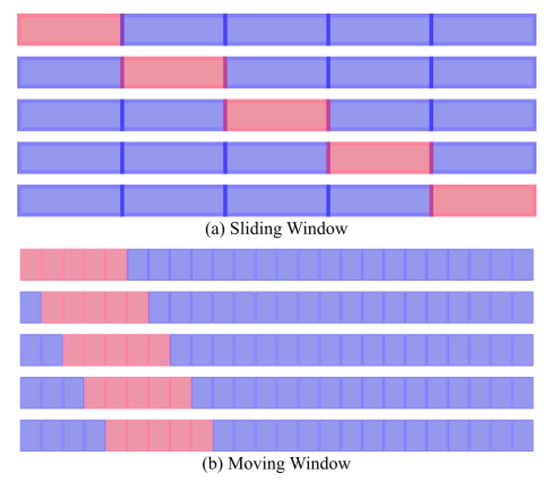
Figure 3.
The difference between sliding and moving window.
4. Results
4.1. Case Study 1
The results presented here are for Case Study 1 and examine the effects of each different factor considered in this paper, such as time resolution and training period. This is later compared to the results from Case Study 2.
4.1.1. Effects of Autoregression
This section presents the results to evaluate the effects of autoregression. This compares some results from the NARX and NN models examined in this paper.
Table 2 covers the training and testing performance of each model for Case Study 1. The training performance is evaluated by the r values for the training, validation and testing of the training period. When each model was trained, the data was split into three. Seventy percent of the data was for training, 15% was for validation and 15% was utilised in testing. The r values were recorded and the more consistent this value was between training, validation and testing, the more robust the model.

Table 2.
Comparison of models’ anomaly detection performance from case study 1.
The testing performance was evaluated by anomaly percentage difference, which took the percentage of anomalies found in testing, and subtracted this from the percentage found in training. Each row of Table 2 shows the results for each model.
Table 2 shows that the NARX models trained on 10 min resolution data, and NN models trained on 1 h resolution data, have the best R-values during training, and therefore generalise best so should not have overfitted on the training case alone, whereas the NARX and NN models trained on the other time resolutions have much poorer generalisation.
Figure 4 compares the NARX and NN models trained on 12 months of 10 min averaged SCADA data. Figure 4a,b plots the daily sliding window, and Figure 4c,d plots the daily moving windows. The light yellow lines show the RMSE for the training period, with the dark brown lines showing the RMSE for the testing period. It can be seen that the NARX models have, on average, a lower RMSE than that of the NN. Overall their peaks appear to be at the same times, however those peaks appear taller for the NN.
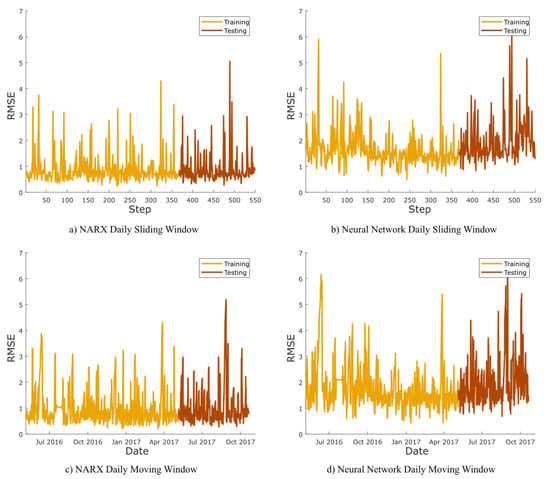
Figure 4.
Comparison of daily root mean squared error (RMSE) for NARX vs. Neural Network considering 12 months training period and 10 min mean data resolution.
4.1.2. Effects of Training Period
Figure 5 compares the model performance for both the NARX and NN models trained on either 12 or 6 months of data. The graphs show the daily sliding window RMSE, with the light yellow line representing errors from the training period, and the brown line representing the testing period. One thing that is immediately obvious from this graph is that the RMSE of the NN610 model is much higher during testing, compared to the others. It does appear for the other models that the peaks are again consistent.
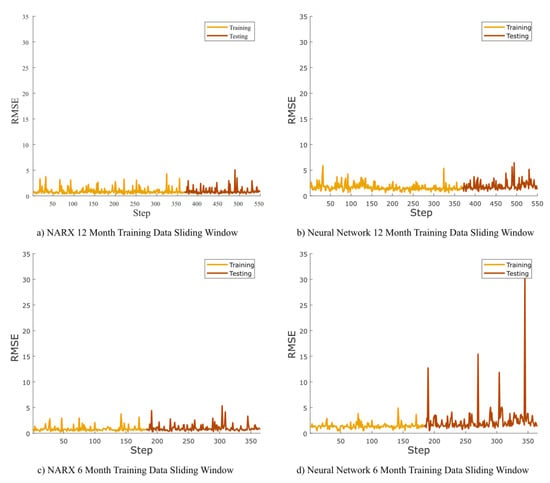
Figure 5.
The daily sliding window RMSE for the 10 min resolution NARX and NN models.
4.1.3. Effects of Time Resolution
The effects of time resolution are compared in Figure 6; this was done for the NARX model trained on 12 months of data. The daily sliding window RMSE was compared, with the yellow lines being for the training period and the brown lines being for the testing period. The time resolutions compared were 10 min averaged, and 1 h averaged, SCADA data. Figure 6 shows that the RMSE for the NARX1210 model was much lower on average than the NARX121. The tallest peak for the 1 h resolution model is almost 3 times greater than the equivalent peak in the 10 min resolution model. It appears that the NARX model generalises better with finer resolution data.
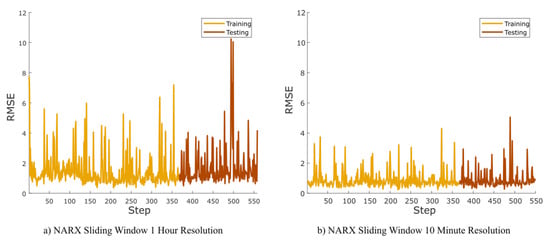
Figure 6.
Comparison between 1 h and 10 min time average SCADA data for the NARX model with 12 months of training data.
4.2. Effects of Testing Window
This section presents the postprocessing results from varying the window length of the moving and sliding window techniques. Figure 7 presents the results for the four models trained with 12 months of data, with the sliding window RMSE. From left to right it is increasing window length, from daily to monthly. The line graphs on the bottom were plotted to visualise where all models agree.
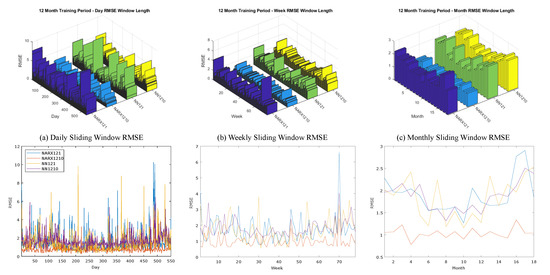
Figure 7.
Effect of window length for the RMSE.
Figure 8 shows the moving window RMSE graphs for the NARX model trained on 12 months of data with 10 min averaged SCADA data. These were used to compare with the results shown in Figure 7 as a second opinion. It can be seen with there appears to be a reduction of noise with each increase in window length for both Figure 7 and Figure 8. The monthly window appears to smooth out the RMSE, and lose some of the features, possibly making it harder to detect when a failure were to occur.
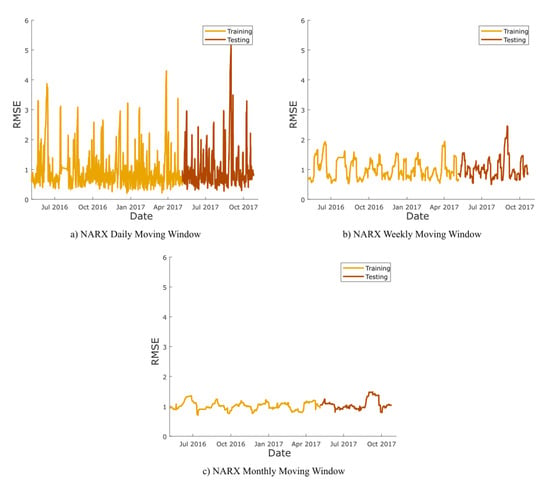
Figure 8.
Effect of window length for Moving RMSE for NARX model with 12 month training period and 10 min time resolution.
4.3. Case Study 2
This section presents the results from the second case study examined in this paper. Again this turbine failed from a high speed shaft fault. The results presented here are similar to those examined in Section 4.1, and are used to compare the results of both case studies to ensure the results are consistent for each model.
Table 3 shows the training and testing performance for each of the models examined in case study 2. The training performance is again evaluated by the r values for the training, validation, and testing of the training period. The testing performance was also evaluated by anomaly percentage difference. Each row of Table 2 shows the results for each model.

Table 3.
Comparison of models’ anomaly detection performance for case study 2.
Figure 9 shows one of the data channels available for both turbines. This is plotted to show any gaps in the data, and the general turbine behaviour for the entire period examined. This shows the full 12 months of training data and the 6 months of testing data. The blue data is the training data, and the red data is the testing. For case study 1, it can be seen that there is a small gap in the training period, near the start. This gap could affect the performance of the model due to the missing data in this time period.
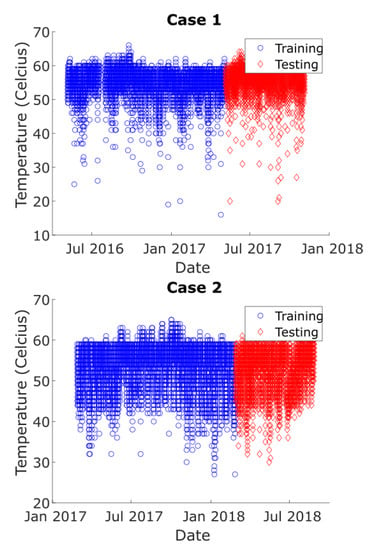
Figure 9.
SCADA data for Case Studies 1 and 2.
Again, the performance of the NARX and NN models was compared for the 12 month trained with 10 min averaged SCADA data, shown in Figure 10. This shows the daily sliding window RMSE for the models for case study 2.
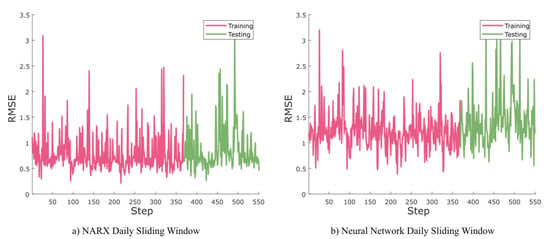
Figure 10.
Comparison between the daily moving window RMSE for the NARX and NN models with 12 months of training data and 10 min time resolution, for Case 2.
Figure 11 shows the effect of changing the window length from daily to monthly for all models trained on 12 months of 10 min averaged SCADA data.
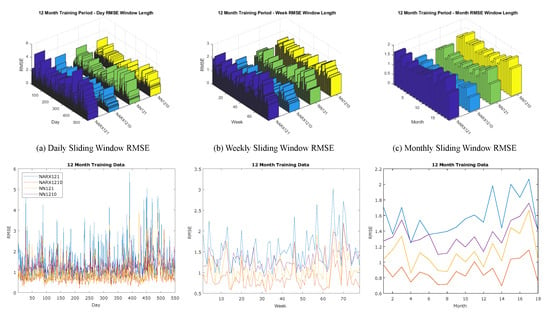
Figure 11.
Effect of window length for the RMSE, for Case 2.
Figure 12 compares the moving window length for the NARX model trained on 12 months of 10 min averaged SCADA data. This compares the daily, weekly, and monthly moving window lengths.
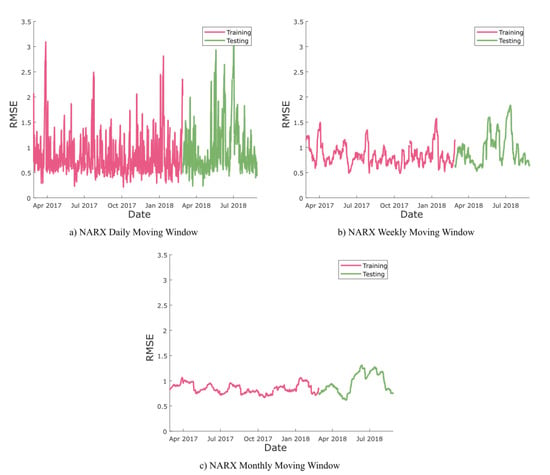
Figure 12.
Effect of window length for Moving RMSE for NARX model with 12 month training period and 10 min time resolution, for Case 2.
Both figures show the effect of changing the window length of when the RMSE is averaged. This is daily, weekly, or monthly. This was done to examine which is the most appropriate for identifying anomalous behaviour during the post-processing stage of Anomaly Detection.
5. Discussion
5.1. Case Study 1
5.1.1. Effects of Autoregression
One of the main aims of this paper was to investigate the effect of autoregression for normal behaviour modelling, for wind turbine condition monitoring. This section looks at the effects of autoregression, and compares the training performance and testing results of the NN and NARX models.
In terms of the training performance, the aim was for better generalisation of the model, as this would mean the model was more robust and would predict the target variables better. It can be seen in Table 2 that the NARX R-values were greater and more consistent than that of the NN. An R-value close to 1 implies there is a greater correlation learned from the data between the inputs and target variables. A greater, and more consistent, correlation could imply that the models are learning the relationships between input and target, rather than just memorising the data. The models would therefore be considered more robust.
The models with both a correlation closer to 1 and good consistency were the NARX models trained on 10 min averaged data, and the NN model trained on 6 months of 1 h averaged data. A more robust model can therefore be considered capable of handling typical variations in the data, such as turbulent wind periods.
Figure 2 shows the different R-values for each stage of training for all models compared in each case. It can be seen that the NARX61 model has quite a large deviation in R-values between each stage. This occurred when training the model, and this was as close to good generalisation that could be achieved. This, along with the general spread of R-values in case study 1, could be due to both the gap and greater range in the temperature data for case study 1 when compared to case study 2 in Figure 9. It is also likely that during training of the models that the NARX61 and, to a lesser extent, the NARX121 models could not find as good a generalisation during retraining compared with other models.
During testing it can be seen that NARX models had fewer anomalies than their respective NN alternatives. This implies that there are more large errors in the testing period for these NN models, compared to those for the NARX models.
An example of this is shown in Figure 4. The NARX model overall has a lower error, which is consistent with the training results. The graphs show a lower and more consistent error for the full duration examined for the NARX models, which is consistent with Table 2. The NN models have greater errors throughout the duration, with a greater RMSE.
For the models shown in Figure 4, there is also a decrease in third threshold anomalies for the NARX model. What may affect these models, is the gap that is visible in the training data before 6 months. Thus, this gap may skew the anomaly percentages and R-values.
Due to the poorer generalisation, it is expected that the NN will have greater errors during the training period as the model is less robust for new data. Overall, it appears that NARX will produce fewer anomalies, due to the improved ability to predict the target variables, even in previously unseen data. This improved robustness implies that if an anomaly is detected by this NARX model, it is more likely to be an anomaly in the data rather than a poor prediction from the model. While from the perspective of percentage increase of anomalies, it appears that the NN model is better; however, the model is inherently less accurate due to the worse ability to predict unseen data. This observation would seem to be localised to this paper here, further work would be required to examine whether NARX would always perform better than NN. One study of reservoir inflow prediction [20] compared the use of artificial neural networks (ANN), nonlinear autoregression neural networks (NAR) and NARX. It was found that NAR models outperformed both NARX and ANN, for monthly resevoir data, while NARX and ANN had comparable results. Therefore, further study is required on different failure modes to examine if NARX is still most suitable.
5.1.2. Effects of Training Period
Another effect of time that is investigated in this report is the difference between 12 and 6 months of training period. The question here is whether a longer training period is more appropriate for condition monitoring.
Table 2 shows the poorer generalisation for the models trained with 6 months of data, other than the NARX model trained with 10 min averaged data. The models trained with 6 months of data also have a greater increase in anomalies, compared to the models trained on 12 months of data. Similar to the results shown for the effect of autoregression, this worse generalisation will lead to greater errors.
It is also reasonable to assume that by using 12 months of training data you capture the natural changes in the data due to the changing of the seasons. Using 6 months may lead to only capturing either the summer or winter months, leading to greater errors due to this not capturing the full variations in the year. From Figure 9, it can be seen there is also a gap in the data before the six month point, which will be captured by the 12 month training period, but not the six month training period.
Figure 5 shows the comparison between the training periods used in this paper. This illustrates the effects of using a 12 month, or a 6 month, training period for the NARX and NN models. For both the NARX and NN models, the 6 month training period appears to have much lower error in the healthy period with greater errors in the unhealthy period; however, with 6 months of training data this does not capture the full seasonality of the year. This is illustrated in Figure 5a,b, where the last 6 months of training differs from the first 6 months.
It is more appropriate to use the 12 months of training data, or more if it is available, for long-term time series modelling. This allows more time to capture the changing behaviour of the turbine, meaning that much of the normal behaviour is known by the model so it should be capable of better predicting previously unseen data. This better generalisation should therefore mean that any errors are more likely to be a true anomaly.
5.1.3. Effects of Time Resolution
The time resolution of the data was also investigated, comparing between 10 min and 1 h averaged SCADA data. The use of 1 h averaged data does mean there is a lesser requirement for data storage, and the processing and training time is reduced. Conventionally 10 min average SCADA data has been used for condition monitoring and anomaly detection, however it may still be appropriate to use 1 h average.
Looking at Table 2, the performance of the models varied with the use of different time resolutions. For the NARX model, the generalisation and training performance was better using 10 min averages, whereas for the NN it was better with 1 h averages.
Figure 6 shows the difference in sliding window RMSE for the NARX model using 10 min or 1 h averages. It can be seen for the model trained on 1 h averaged data, there are more large magnitude errors compared to that of the model trained on 10 min averaged data. There is a general agreement between the models that there is a peak at roughly 500 days, implying that there is an actual data anomaly at this point. This peak can be seen partially in previous figures presented.
Both models have similar positions for the peaks on the graph, however for the 10 min time resolution the RMSE is roughly halved. This is consistent with the better generalisation of the NARX 10 min time resolution compared to the NARX 1 h time resolution.
For those faults that develop over a longer time period, such as a bearing fault, it may be beneficial to utilise the lower resolution data. It could therefore be optimal to use a model more suitable to the lower resolution, such as the full signal reconstruction model, rather than NARX.
5.1.4. Effects of Testing Window
The use of both the moving and sliding windows to analyse the results from the regression techniques. Different window lengths were examined, these being day, week and month.
Figure 7 shows the effect of sliding window length, for models utilising 12 month training period. Figure 8 shows the effect of moving window length, for the NARX model with 12 months training period and 10 min resolution. It can be seen that the different window lengths affect the resolution of the results.
The longer the window, the more the results are smoothed and the resolution is reduced. Therefore, some information can be lost, however it means that errors that are not as strong are smoothed out, with greater anomalies still showing through. For Figure 7, it can be seen that the monthly sliding window is much smoother compared to the weekly and daily sliding windows. There is still a peak visible for all four models at roughly 500 days, which is equivalent to 70 weeks or 16 months.
The graphs at the bottom in Figure 7 are the four models plotted together. It can be seen that in the daily window, it is unclear where the models agree; however, the monthly window may have too low resolution to be able to detect when an anomaly has occurred. The weekly window still incorporates the greater RMSE whilst making it clearer to determine where the models agree. Similarly, the graphs in Figure 8 smooth out the errors. The weekly and monthly window lengths help to remove some of the noise visible in the daily window graphs.
From looking at both figures it appears that the weekly window is the best balance between the two. It helps to eliminate the noise that appears in the daily window, however it does not remove too much information as shown in the monthly window. The ability to pinpoint roughly when anomalies occur is still apparent in the weekly graph, however a monthly window does not allow any specification of when an anomaly occurred. It would therefore be more beneficial for a wind farm operator to use the weekly window to help pinpoint roughly when a fault may have occurred, without it being masked by the higher frequency daily window graphs.
5.2. Case Study 2
The second case study looked at another turbine of the same model with a similar fault as considered in case study 1. Table 3 shows the training performance and anomaly increase from training to testing for the 8 different combinations examined in this paper. When compared to the same table for case study 1, see Table 2, it can be seen that the models perform better in training for the second case study. The anomaly percentage difference is lower for case study 2 than case 1, however for the NARX 10 min resolution case study 2 has a greater difference.
The improved training performance could be explained by the gap in the data for the first case, as shown in Figure 9. Figure 9a shows the SCADA data for the full duration of the data, and a significant gap in the data can be seen during training. Another factor that may explain this improved performance is the greater range of data in the data for case 1, which would lead to a worse ability to predict the training target values. Case study 1 has temperatures that drop below 20 degrees Celsius, whereas case study 2 temperatures do not drop below 25 degrees Celsius.
Again, similar to case study 1, the NARX models trained on 10 min averaged data has an R-value much closer to 1 and is more consistent than others. The NN models trained with 1 h averaged data does perform better than those NN models trained on 10 min averaged data. Again, for most thresholds, the anomaly percentage increases for those models trained on 6 months of data.
Overall it appears the models trained on data for case study 2 have a better performance than those for case study 1. This is most likely due to the quality of the data for case study 2 as discussed previously.
Figure 10 compares the sliding window RMSE for the NARX and NN models using 10 min time resolution data trained on 12 months of data. It can be seen that the NARX model RMSE is approximately half that for the NN, similar to that shown in Case 1. It can also be seen that singular peaks are much easier to distinguish for the NARX model, compared to the graph of the NN errors.
When looking at Figure 11 and Figure 12, it can be seen that the errors within the testing period tend to be greater than those in training. The graphs do show a slight trend upwards during the final 6 months, compared to the training period, which is more clear than those shown in Figure 7 and Figure 8. Again, the observations made in the previous section are visible here, with the weekly sliding and moving windows being clearer than the daily window errors. Individual peaks are also more easily observed for the weekly errors compared to the monthly errors. Again, the models can be seen to agree at between roughly 60 and 70 weeks, which is seen in the monthly data after 10 months.
Overall, the performance of those models trained on data from case study 2 is far improved from those models trained on data from case study 1. However, many of the results observed in case study 1 were observed again, with similar effects discussed due to autoregression, training lengths and error window length.
5.3. Summary
In summary, it appears that using a NARX model trained on 12 months of 10 min averaged data is the most optimal technique. However, in some situations it would seem appropriate to change this. For example, the use of 1 h averaged data allows for a reduction in data use, and therefore in computation time. If using 1 h averaged data, it also appears appropriate to use FSRC over ARX models. NARX in general should be more appropriate than FSRC due to the extra information that autoregression captures compared to other regression techniques. One paper [15] has shown that NARX can perform better than other techniques, however this could be due to the use of Mahalanobis distance as a metric for detection. This paper was also looking to detect anomalies, rather than compare the ability to reconstruct the data using NARX.
In terms of postprocessing, it seems most suitable to investigate the anomalies in a weekly scale, rather than monthly or daily. The reduced resolution removes much of the noise in the data, however it provides more clarity than a monthly scale. Over short periods, between 6 months to 2 years, a monthly scale is inappropriate, and possibly more suited to examining longer term trends.
Overall, there are some recommendations that can be made from this paper.
- NARX appears to perform better here, however NN do work better with lower time resolution. If lower time resolution is only available, then NN should be used.
- For SCADA data, longer training periods are beneficial, as this will capture more of the various temporal features in the data, such as seasonality.
- Time resolution is dependent on faults, as some faults (as shown in [20]) can develop over longer time periods, and therefore may not show up in higher resolution data. Therefore, it may not be necessary to use high resolution data.
- In terms of window type, it appears that sliding window is most appropriate for filtering out the noise from the 10, or 60, minute averaged data.
- A weekly sliding window appears most suitable, as it removes much of the noise from the daily windows, whilst displaying more detail than the monthly window.
This paper, along with the literature examined in Section 2, shows that condition based maintenance can be treated as an analytical problem. Data science techniques can be used to predict failure in wind turbines, or at least assist in the task. It can be used, as in this paper, to detect anomalous behaviour in the build up to failure, which can be used as an indicator of failure or as a tool an operator can use to monitor their asset.
6. Conclusions
This paper has compared the use of FSRC and ARX models while exploring the effects of different training time periods and time resolution used during the training and testing of the models. The NN and NARX models were compared over the various configurations of the data; both the training performance and the results of the test predictions were used as metrics.
Two different cases were examined, both of the same model of turbine with similar faults that led to their failure. In both cases, the NARX model trained with 12 months of 10 min average SCADA data had the best training performance. This model configuration had the best training performance, leading to a better ability to predict the target values of previously unseen data. It was shown that those models that performed better during training would have lower errors during the testing period, thus fewer anomalies were detected. However, it follows that the anomalies detected by a model with better training performance are therefore more likely to be true negatives.
- For the comparison between FSRC and ARX models, it was found the autoregressive quality improved performance.
- The use of more training data was found to be more appropriate as it captures more temporal features of the data.
- It was found the finer resolution worked better for the NARX model, with the 1 h averaged data being more suitable for the FSRC model.
- When the length of time windows were compared, it was found that sliding and moving windows of a week’s length were more appropriate.
Tautz-Weinert and Watson [3] stated that a comprehensive comparison between FSRC and autoregression was required for wind turbines. This study has provided that comparison. In Section 2, a collection of recent comparisons between NARX and NNs for various applications was presented. These papers showed that there is some specificity to the comparisons, and that NARX could outperform NN, and vice versa. It appears that while some of the findings here can be generalised, a degree of model selection should be undertaken.
This paper has examined the effects of time on anomaly detection for wind turbine condition monitoring. Further work can be done for other data, such as vibration, or for other applications, this could examine the use of models other than regressors. Future work would be required to investigate if the use of NARX1210 would still be best suited for other failure modes, such as scour [25] or fatigue [26] caused failures. These failure modes can occur over different timescales, which some models (or data resolutions) may not be sensitive to. This could also be done to examine other offshore structures, not just offshore wind turbines. Further study would also be required to examine other regression techniques, particularly those that are not neural networks, and to examine NAR models [20]. Furthermore, investigating these techniques for turbines that did not fail during the time period investigated would be useful so that no failures are present to alter performance.
Author Contributions
Conceptualisation, C.M., A.T. and S.K.; Methodology, C.M. and A.T.; Formal analysis, C.M. and A.T.; Investigation, C.M. and A.T.; Data curation, A.T.; Writing—original draft preparation, C.M., A.T. and S.K.; Writing—review and editing, C.M., A.T., S.K., J.C. and A.M.; Visualisation, C.M. and A.T.; Supervision, J.C. and A.M. All authors have read and agreed to the published version of the manuscript.
Funding
This research was funded by EPSRC grant number EP/L016680/1.
Conflicts of Interest
The authors declare no conflict of interest.
References
- Taveira-Pinto, F.; Rosa-Santos, P.; Fazeres-Ferradosa, T. Marine renewable energy. Renew. Energy 2020, 150, 1160–1164. [Google Scholar] [CrossRef]
- Fazeres-Ferradosa, T.; Rosa-Santos, P.; Taveira-Pinto, F.; Vanem, E.; Carvalho, H.; Correia, J. Editorial: Advanced research on offshore structures and foundation design: Part 1. Proc. Inst. Civ. Eng. Marit. Eng. 2019, 172, 118–123. [Google Scholar] [CrossRef]
- Tautz-Weinert, J.; Watson, S.J. Using SCADA data for wind turbine condition monitoring—A review. IET Renew. Power Gener. 2016, 11, 382–394. [Google Scholar] [CrossRef]
- Kim, K.; Parthasarathy, G.; Uluyol, O.; Foslien, W.; Sheng, S.; Fleming, P. Use of SCADA data for failure detection in wind turbines. In Proceedings of the ASME 2011 5th International Conference on Energy Sustainability, Washington, DC, USA, 7–10 August 2011; pp. 2071–2079. [Google Scholar]
- Yang, W.; Court, R.; Jiang, J. Wind turbine condition monitoring by the approach of SCADA data analysis. Renew. Energy 2013, 53, 365–376. [Google Scholar] [CrossRef]
- Feng, Y.; Qiu, Y.; Crabtree, C.J.; Long, H.; Tavner, P.J. Monitoring wind turbine gearboxes. Wind Energy 2013, 16, 728–740. [Google Scholar] [CrossRef]
- Feng, Y.; Qiu, Y.; Crabtree, C.J.; Long, H.; Tavner, P.J. Use of SCADA and CMS signals for failure detection and diagnosis of a wind turbine gearbox. In Proceedings of the European Wind Energy Conference and Exhibition 2011, EWEC 2011, Brussels, Belgium, 14–17 March 2011; pp. 17–19. [Google Scholar]
- Catmull, S. Self-organising map based condition monitoring of wind turbines. In Proceedings of the EWEA Annual Conference, Leuven, Belgium, 27–28 October 2011. [Google Scholar]
- Garcia, M.C.; Sanz-Bobi, M.A.; del Pico, J. SIMAP: Intelligent System for Predictive Maintenance: Application to the health condition monitoring of a windturbine gearbox. Comput. Ind. 2006, 57, 552–568. [Google Scholar] [CrossRef]
- Zaher, A.; McArthur, S.; Infield, D.; Patel, Y. Online wind turbine fault detection through automated SCADA data analysis. Wind Energy 2009, 12, 574–593. [Google Scholar] [CrossRef]
- Yan, Y.; Li, J.; Gao, D.W. Condition Parameter Modeling for Anomaly Detection in Wind Turbines. Energies 2014, 7, 3104–3120. [Google Scholar] [CrossRef]
- Vogt, S.; Otterson, S.; Berkhout, V. Multi-task distribution learning approach to anomaly detection of operational states of wind turbines. J. Phys. Conf. Ser. 2018, 1102. [Google Scholar] [CrossRef]
- Li, J.; Chen, J.; Sun, P.; Li, H.; Xie, K.; Ran, L. Operational risk assessment of wind turbines. In Proceedings of the 2016 International Conference on Condition Monitoring and Diagnosis (CMD), Xi’an, China, 25–28 September 2016; pp. 14–19. [Google Scholar] [CrossRef]
- Yang, W.; Liu, C.; Jiang, D. An unsupervised spatiotemporal graphical modeling approach for wind turbine condition monitoring. Renew. Energy 2018, 127, 230–241. [Google Scholar] [CrossRef]
- Bangalore, P.; Letzgus, S.; Karlsson, D.; Patriksson, M. An artificial neural network-based condition monitoring method for wind turbines, with application to the monitoring of the gearbox. Wind Energy 2017, 20, 1421–1438. [Google Scholar] [CrossRef]
- Cui, Y.; Bangalore, P.; Tjernberg, L.B. An anomaly detection approach based on machine learning and scada data for condition monitoring of wind turbines. In Proceedings of the 2018 International Conference on Probabilistic Methods Applied to Power Systems, PMAPS, Boise, ID, USA, 24–28 June 2018; pp. 1–6. [Google Scholar] [CrossRef]
- Yusuf, S.A.; Brown, D.J.; Mackinnon, A.; Papanicolaou, R. Application of dynamic neural networks with exogenous input to industrial conditional monitoring. In Proceedings of the International Joint Conference on Neural Networks, Dallas, TX, USA, 4–9 August 2013; pp. 1–8. [Google Scholar] [CrossRef]
- Taqvi, S.A.; Tufa, L.D.; Zabiri, H.; Maulud, A.S.; Uddin, F. Fault detection in distillation column using NARX neural network. Neural Comput. Appl. 2018, 0123456789. [Google Scholar] [CrossRef]
- Hussain, S.; Al-Alili, A. A new approach for model validation in solar radiation using wavelet, phase and frequency coherence analysis. Appl. Energy 2016, 164, 639–649. [Google Scholar] [CrossRef]
- Hadiyan, P.P.; Moeini, R.; Ehsanzadeh, E. Application of static and dynamic artificial neural networks for forecasting inflow discharges, case study: Sefidroud Dam reservoir. Sustain. Comput. Inform. Syst. 2020, 27, 100401. [Google Scholar] [CrossRef]
- Botto-tobar, M.; León-acurio, J.; Cadena, A.D. Advances in Intelligent Systems and Computing 1066 Advances in Emerging Trends and Technologies; Springer International Publishing: Quito, Ecuador, 2020; Volume 1, p. 2020. [Google Scholar] [CrossRef]
- Zainorzuli, S.M.; Afzal Che Abdullah, S.; Adnan, R.; Ruslan, F.A. Comparative study of elman neural network (ENN) and neural network autoregressive with exogenous input (NARX) for flood forecasting. In Proceedings of the ISCAIE-2019 IEEE Symposium on Computer Applications and Industrial Electronics, Kota Kinabalu, Malaysia, 27–28 April 2019; pp. 11–15. [Google Scholar] [CrossRef]
- Yucel, O.; Aydin, E.S.; Sadikoglu, H. Comparison of the different artificial neural networks in prediction of biomass gasification products. Int. J. Energy Res. 2019, 43, 5992–6003. [Google Scholar] [CrossRef]
- Ibrahem, I.M.; Akhrif, O.; Moustapha, H.; Staniszewski, M. Neural networks modelling of aero-derivative gas turbine engine: A comparison study. In Proceedings of the ICINCO 2019-Proceedings of the 16th International Conference on Informatics in Control, Automation and Robotics, Prague, Czech Republic, 29–31 July 2019; 1, pp. 738–745. [Google Scholar] [CrossRef]
- Wu, M.; De Vos, L.; Chavez, C.E.A.; Stratigaki, V.; Fazeres-Ferradosa, T.; Rosa-Santos, P.; Taveira-Pinto, F.; Troch, P. Large scale experimental study of the scour protection damage around a monopile foundation under combined wave and current conditions. J. Mar. Sci. Eng. 2020, 8, 417. [Google Scholar] [CrossRef]
- Mourão, A.; Correia, J.A.; Ávila, B.V.; De Oliveira, C.C.; Ferradosa, T.; Carvalho, H.; Castro, J.M.; De Jesus, A.M. A fatigue damage evaluation using local damage parameters for an offshore structure. Proc. Inst. Civ. Eng. Marit. Eng. 2020, 173, 43–57. [Google Scholar] [CrossRef]
© 2020 by the authors. Licensee MDPI, Basel, Switzerland. This article is an open access article distributed under the terms and conditions of the Creative Commons Attribution (CC BY) license (http://creativecommons.org/licenses/by/4.0/).