Article

Impacts of Increasing Private Charging Piles on Electric Vehicles’ Charging Profiles: A Case Study in Hefei City, China

1
School of Management, Hefei University of Technology, Hefei 230009, China
2
Key Laboratory of Process Optimization and Intelligent Decision-making, Hefei University of Technology, Ministry of Education, Hefei 230009, China
3
Power Technology Centre, State Grid Anhui Electric Power Corporation Electric Power Research Institute, Hefei 230601, China
*
Author to whom correspondence should be addressed.
Energies 2020, 13(17), 4387; https://doi.org/10.3390/en13174387
Submission received: 19 July 2020 / Revised: 20 August 2020 / Accepted: 24 August 2020 / Published: 26 August 2020
(This article belongs to the Section E: Electric Vehicles)

Abstract

:
Electric vehicles (EVs) and charging piles have been growing rapidly in China in the last five years. Private charging piles are widely adopted in major cities and have partly changed the charging behaviors of EV users. Based on the charging data of EVs in Hefei, China, this study aims to assess the impacts of increasing private charging piles and smart charging application on EVs’ charging load profiles. The charging load profiles of three types of charging piles which are public, employee-shared, and private ones, are simulated in three different scenarios. The results of scenario simulation indicate that the increase in EVs will reinforce the peak value of the total power load, while increasing private charging piles and the participation rate of smart charging piles will have peak-load shifting effects on the power load on weekdays. Specifically, 12% of the charging load will be shifted from public piles to private ones if the ratio of EVs and private piles increases from 5:3 to 5:4. The adoption of smart charging in private piles will transfer 18% of the charging load from the daytime to the night to achieve peak-load shifting. In summary, promoting the adoption of private piles and smart charging technology will reshape the charging load profile of the city, but the change will possibly reduce the utilization rate of public charging piles. The results suggest that urban governments should consider the growth potential of private piles and promote smart charging in charging infrastructure planning.

Graphical Abstract

1. Introduction

The transport sector is one of the key drivers of energy consumption and CO2 emissions growth around the world [1]. In particular, the increase in road vehicles has brought about serious environmental and energy problems. Many countries are actively exploring a combination of clean energy and road transportation electrification. Compared with traditional fuel vehicles, electric vehicles (EVs) take advantage of lower energy consumption costs and more environmentally friendly features [2]. Promoting the use of EVs is an effective way to deal with road traffic pollution and global climate change [
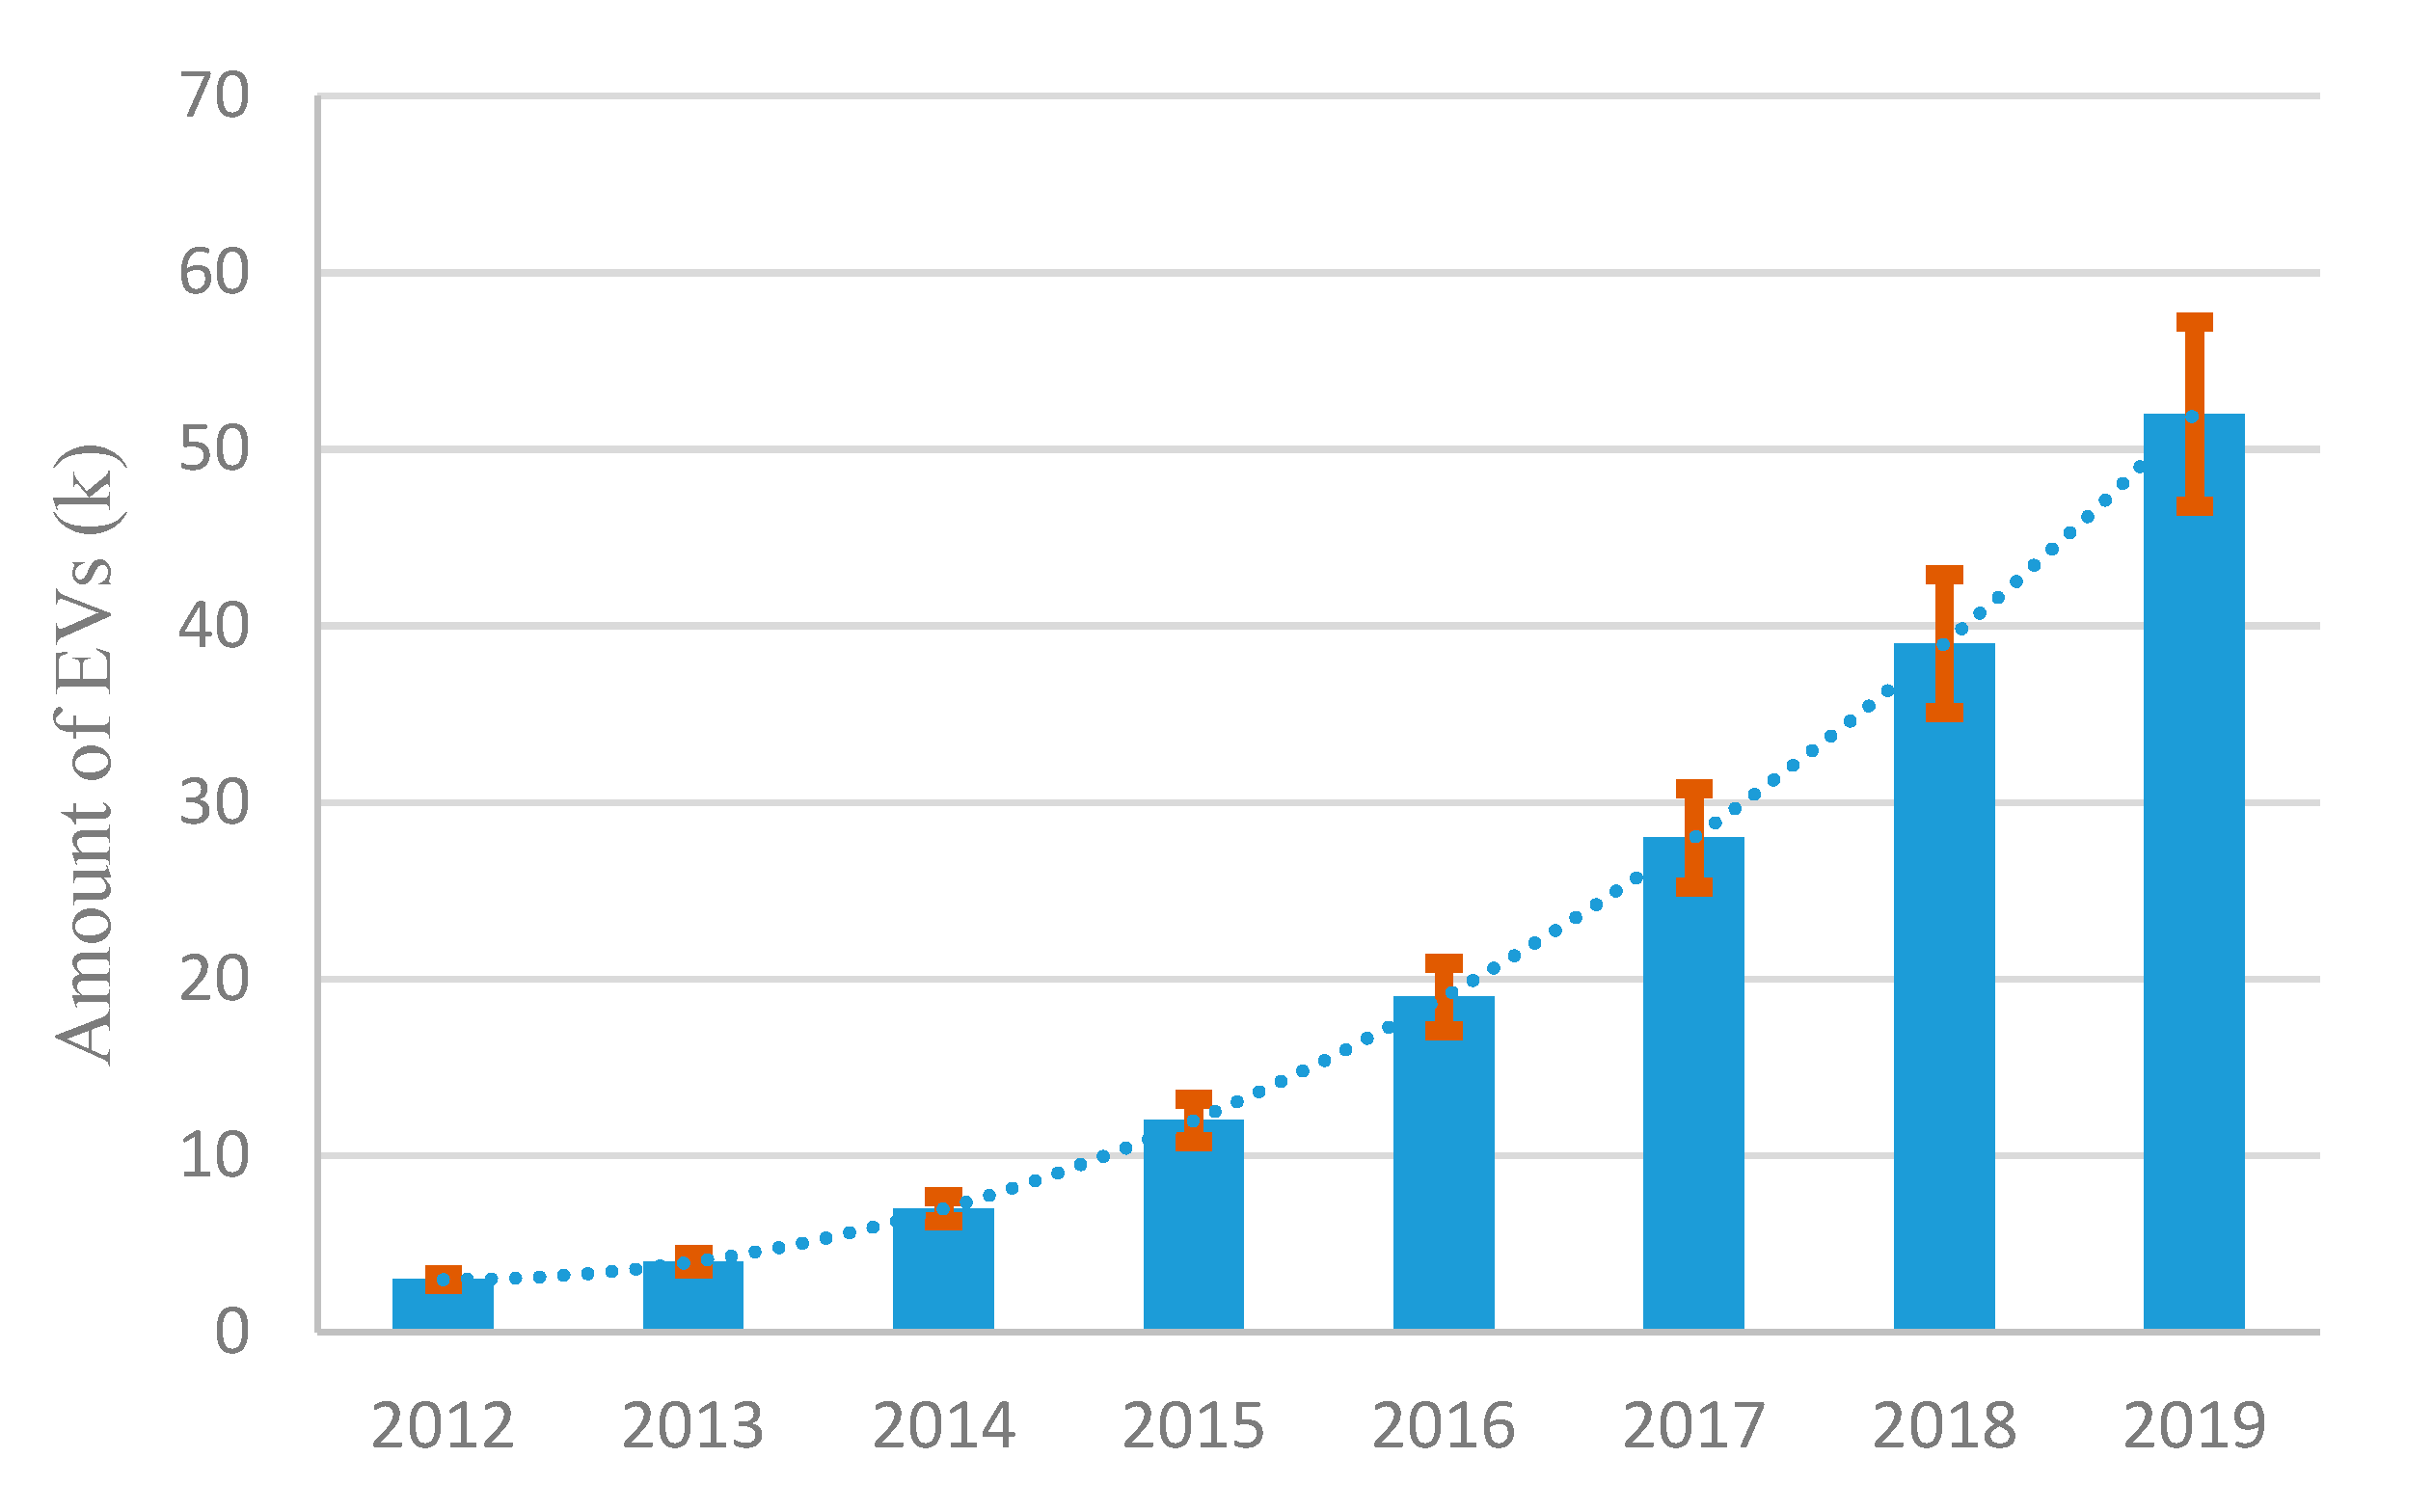
3]. In recent years, driven by government policies and investment from auto manufacturers, China’s EVs and supporting infrastructure have developed rapidly [4]. From 2015 to 2019, the number of EVs in China increased from 0.33 to 3.81 million [5]. The average growth rate of EVs was 263.6% in the period, representing a steady and rapid growth. At the end of 2019, the number of charging piles in China reached 1.22 million, increasing the vehicle:pile ratio to 3.1:1. Of that total, about 42% were public charging piles and 58% were private ones [6]. At present, promoting investment in the development of charging piles is plagued by several issues. First, uneven spatial distribution makes it difficult for EV drivers to find charging piles, especially in small- and medium-sized cities and rural areas. Second, the utilization rate of public charging piles is as low as 2% on average, which makes them unprofitable. Third, the required investment in power infrastructure for charging is ambiguous as the total and distributed charging load profiles are difficult to predict.
There have been many studies focusing on the challenges posed by EVs and charging infrastructure to the operation of the power grid. On the one hand, the adoption of electric vehicles (EVs) will have a direct impact on the electricity grids, mainly due to the additional power demand during current peak hours on the grid [7]. Some old regional power grids may not be able to sustain the charging load of EVs due to a limited supply capacity, especially during peak charging periods [8,9]. By coordinating the charging and discharging of EVs and providing auxiliary power services, the operation of the power grid can be improved [10,11]. On the other hand, the investment in charging infrastructure is too high to be recovered due to a very low utilization rate of charging piles. There is great potential for cost savings for future investment if the spatial distribution and charging schedule can be optimized [12]. Moreover, the dynamic evolution of private charging piles and public charging piles produces great uncertainty about future investments. Scientific prediction of EV charging demand is the basis for rational planning and the construction of charging infrastructure.
Some crucial factors should be considered in the planning, construction, and operation of charging piles. First, traffic flow [13,14] and areas’ function [15] are important to select charging station sites to meet the charging demands of EVs when driving. Second, drivers’ charging behaviors, as well as key factors, such as the accessibility and crowdedness of charging piles, EV types and performances, electrovalence policy [16,17], and smart energy management systems [18,19], will contribute to shaping the charging load profile [20,21]. Against the backdrop of the large-scale use of EVs in the future, optimal adjustment of charging loads will be beneficial to the safety and efficiency of power grid operation [8,22]. The temporal characteristics and determinants of EV charging loads are important to consider. Third, the optimization of the distribution network with a combination of charging load adjustments will make a great contribution to cost savings and efficiency improvement as a whole, as proven by several optimization and application studies [23,24]. Based on the immediate and long-term considerations, prediction and scenario analysis of regional and urban charging load is important to guide power grid operation and load optimal adjustment, as well as the decision making of charging pile investment and site selection, by identifying key factors.
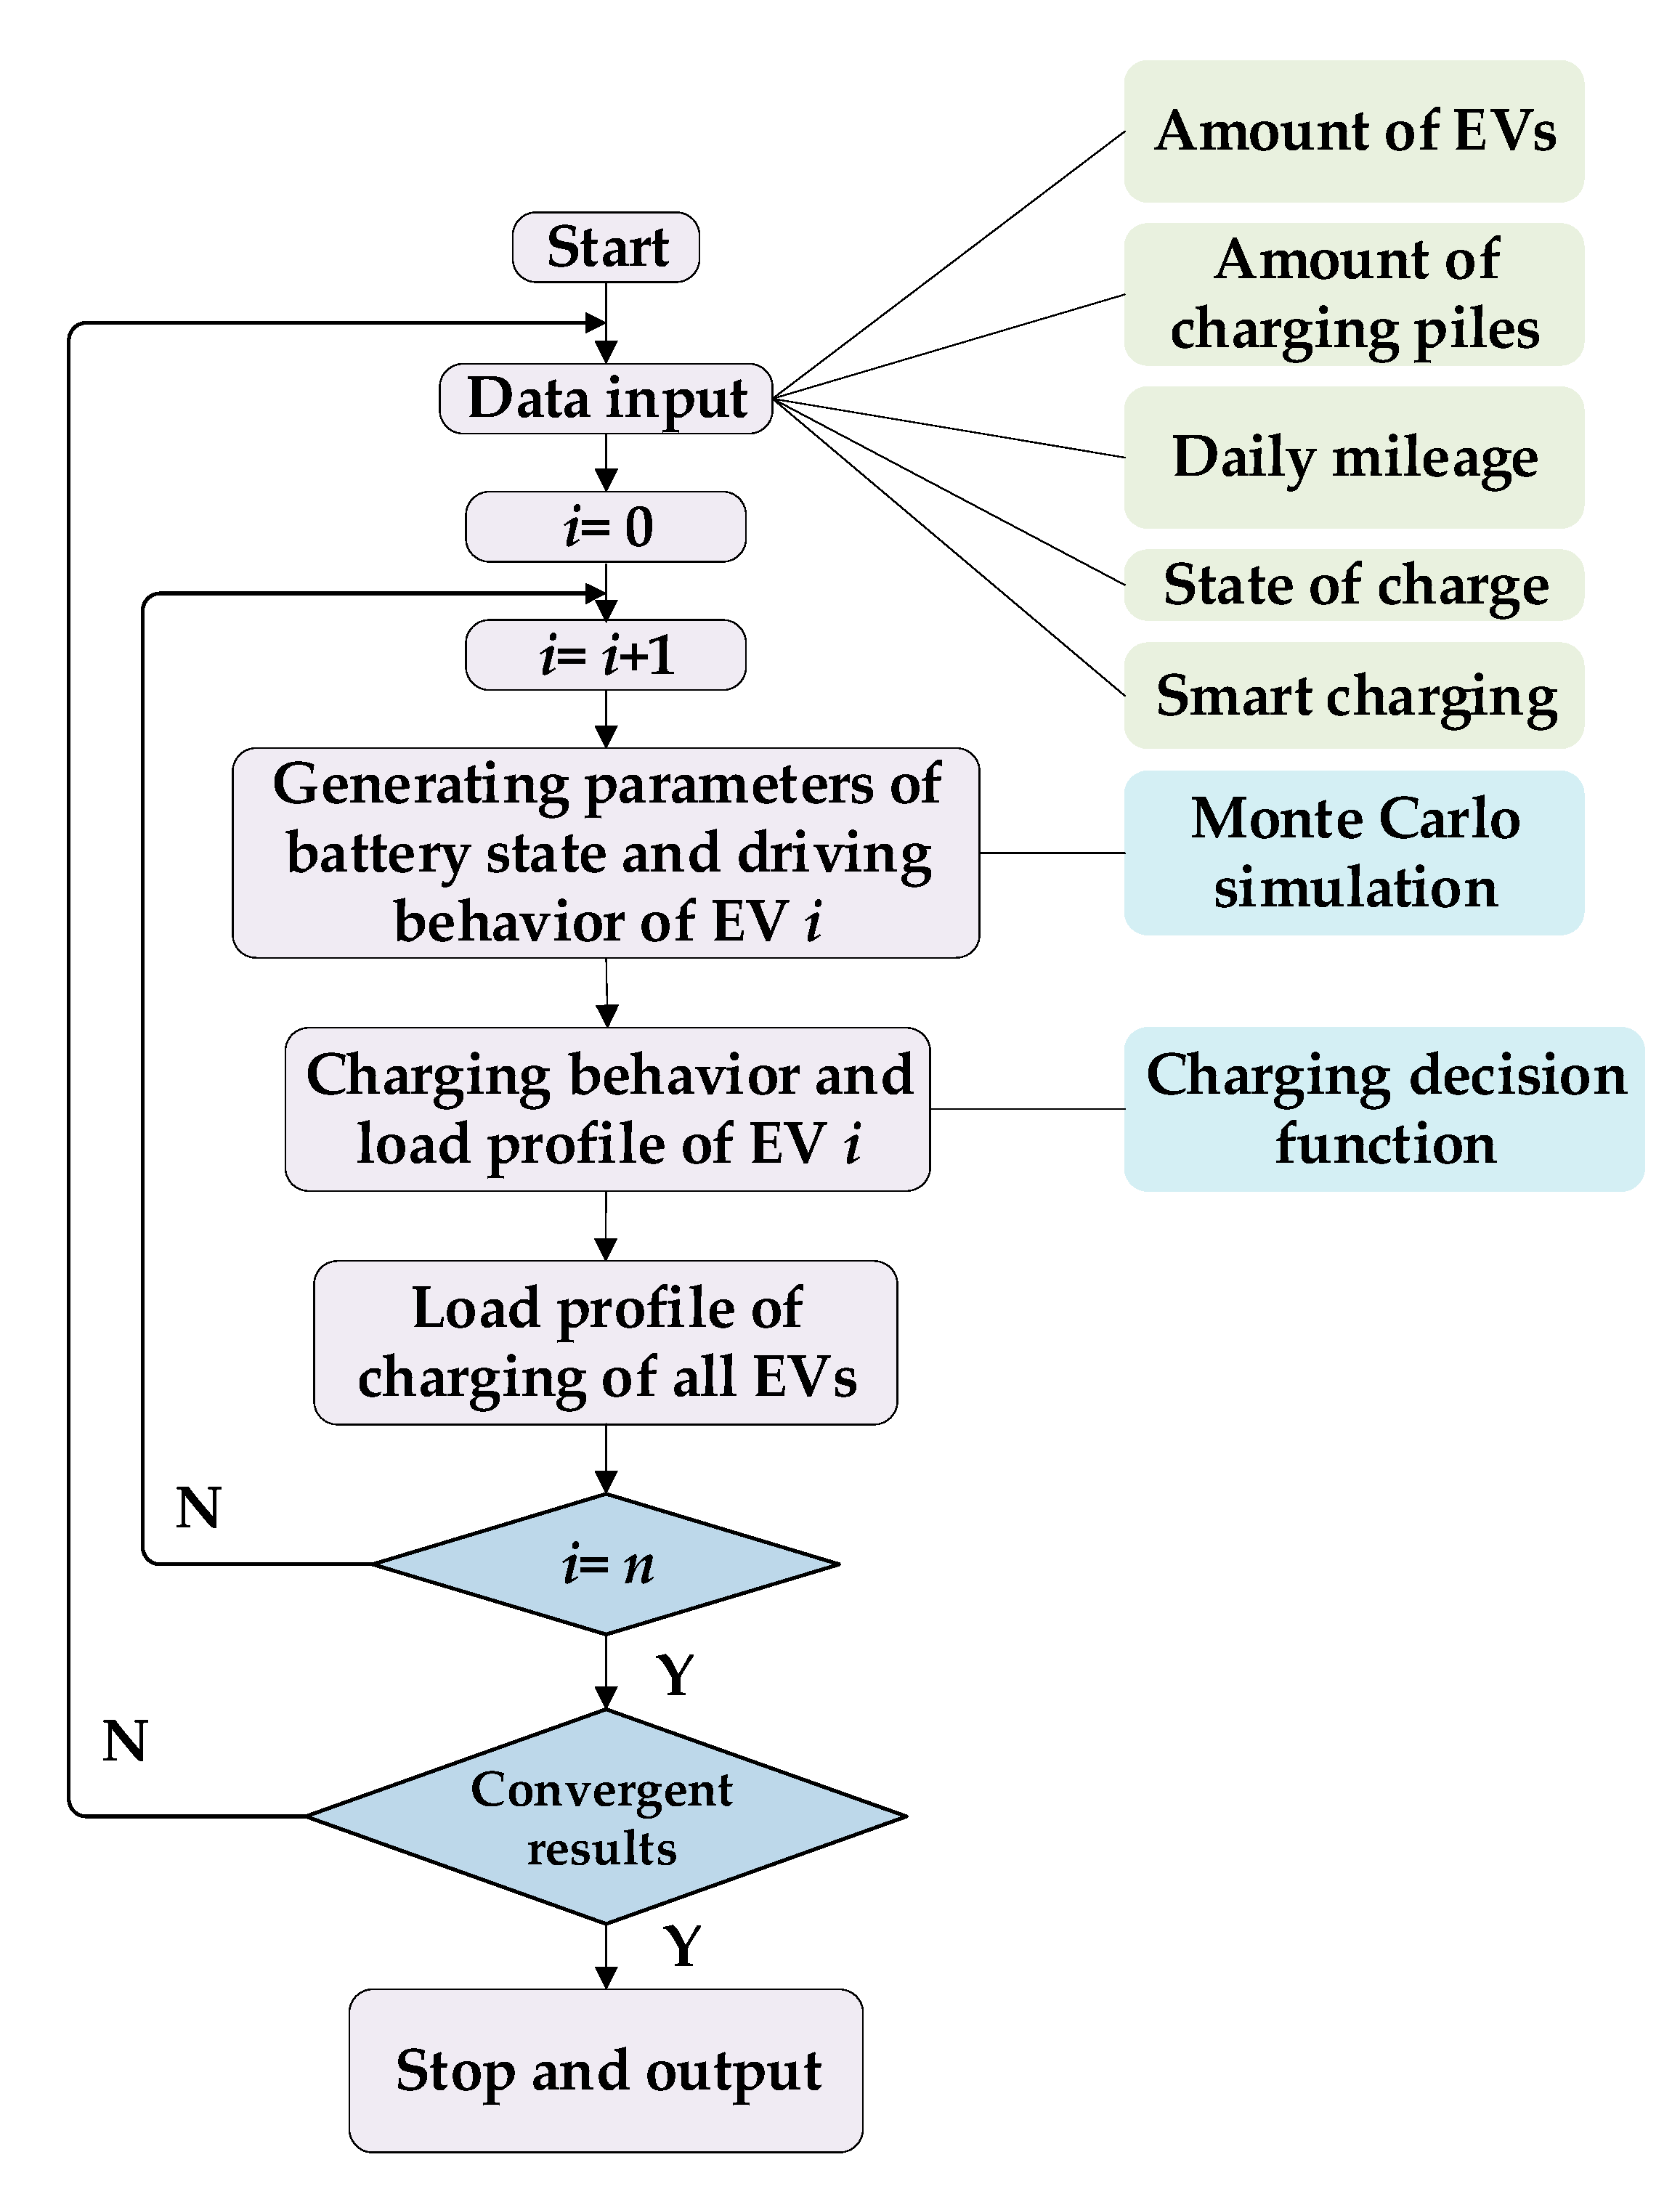
Research methods are mainly divided into simulation analysis, behavior analysis, and statistical analysis. (1) Simulation analysis is a method of calculation based on the probability of scene changes. Most scholars simulate the travel situation according to the user’s travel rules, and then compare the simulation results with the actual results. Monte Carlo is a widely used method for simulation [25,26]. (2) Behavioral analysis involves scholars analyzing the travel characteristics of users or vehicles in a certain time or space, and then using this to build a model of corresponding characteristics, such as a travel chain [27,28], Markov chain [29,30], agent-based model [31], etc. (3) Statistical analysis refers to the use of traditional methods such as mathematical statistics and probability estimation to analyze historical data and predict the future. Cluster analysis of classified traffic patterns based on big data is employed to predict EVs’ charging demands [32].
Studies of EV charging load prediction can be categorized into short-term ones and mid- to long-term ones [33,34]. Short-term load forecast methods are always used to predict the EV charging demands within a month [35]. The mathematical methods applied are mainly divided into several clusters, for instance, probabilistic models [36], diffusion theory [37], support vector machine algorithms [
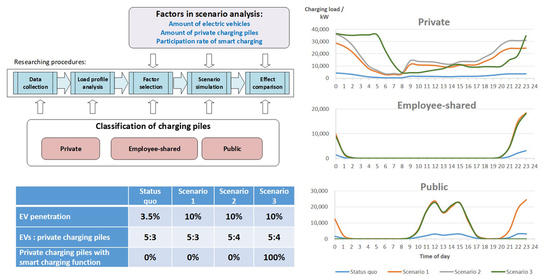
38], etc. In general, the EV adoption remains unchanged in such studies. The mid- and long-term load forecasting methods are devoted to the EV charging demand prediction for the next few years or for some time in the future. It is highly likely that EV adoption will see a remarkable increase in future scenarios. It can be seen from the above literature review that scholars’ research on EVs’ charging demand and load profile covers various factors, but there are still some limitations. (1) Due to the lack of Chinese EV data, many studies about China had to use data from the National Household Trip Survey (NHTS) of the United States. However, Chinese users’ behavior is different from Americans’, so there will be some deviations. (2) Scholars focused on the micro factors (such as price, traffic conditions, etc.) in all of the possible influencing factors; only a few scholars consider the impacts of an increased number of EVs on the charging demand, which is as important as the micro factors since EV penetration is growing rapidly in many Chinese cities. (3) The growing number of private charging piles has reduced the profit margin of public charging piles, and private ones are more conducive to smart charging. The impacts of increasing private piles and smart charging on the charging load profile are not clear. Therefore, this study aims to examine the impacts of EV amount, as well as increasing private charging piles and the popularity of smart charging technology on the charging load profile, based on a scenario analysis. Using the actual data of EV charging in Hefei, a typical city in China, this study will build different future scenarios based on separate analyses of three types of charging piles: public, employee-shared, and private. The future scenarios are simulated based on real-world traffic volume and actual charging data from Hefei. Furthermore, the results of scenario comparison will help identify key factors for peak-load shifting of EVs and provide references for future development of charging piles.

2. Materials and Methods

2.1. Materials

In order to establish an EV charging demand prediction model, the basic dataset used in this study includes driving data of individual EVs and charging data of individual charging piles. The driving data of EVs are provided by an automobile company in Anhui Province [39], collected from users of EVs under real traffic conditions. The maximum battery capacity of EV is 200 kWh, and the energy consumption is 0.2 kWh/km. The data were collected by sensors installed on the EVs and then sent to the database every 10 s. The driving data consisted of 2,555,530 EVs’ status data points, collected from 1463 different EVs. The data had 85 attributes, including information on vehicle data, location data, extreme value, etc.
Charging pile data were collected from a charging platform, provided by the State Grid Anhui Electric Power Co., Ltd. The platform connects more than 9000 charging piles in Anhui Province, so as to obtain real-time information on charging. The data of charging piles include the charging pile code, location, user’s code, start time, end time, charging capacity, etc.

2.2. Research Framework

Figure 1 shows the research scheme of this study. This study divides the urban charging piles into private, public, and employee-shared onesbecause of their different charging load profiles. We aimed to simulate their respective impacts on the regional power grid in the case of a large number of EVs charging. Moreover, the development of charging piles and the EV penetration rate are two important factors. Compared with commercial charging piles, private charging piles have higher availability and convenience. The amount of private charging piles may affect the charging behavior of EVs, thereby affecting the charging grid to a certain extent. The EV penetration rate directly affects the number of EVs. An increase in the number of EVs will also produce a large number of uncertain power loads on the grid. With the addition of smart charging popularity, this study integrates these three factors into the simulation process to explore the impacts of them on the charging load profile in different scenarios in the future. Smart charging is defined as a kind of charging mode. Examples of smart charging options include power management systems enabling the optimization of the use of available power capacity (taking into account network-related constraints), load shifting, the provision of system flexibility services, and the use of bidirectional power flows in vehicle-to-X (grid as an example) applications [40].

2.3. Methodologies

2.3.1. Charging Behavior Simulation

The data of three types of piles are extracted from original data and then transformed into normal distribution. Normal distribution is often used as a probability density model because many real-world phenomena are normally distributed when their samples are large enough [32]. It is used to describe the stochastic nature of the number of EVs that start charging at a certain time. The expectation and variance of the number is speculated based on the observed data. After obtaining the charging probability density curve of each type, the intraday charging demand curve is simulated by the Monte Carlo simulation method, with the consideration of penetration rate of EVs and the popularity of private charging piles.
The Monte Carlo method in computer simulation is also called the random sampling technique or statistical inspection method. The most important feature of this method is that it is based on the theory of probability and statistics [41]. With the development of science and technology and the advances in computing, the Monte Carlo method has been widely used in various fields due to its advantages of describing physical development characteristics and the experiment process. The flowchart of the simulation is shown in Figure 2. Assuming that the grid does not control the charging behavior of EVs, and the four factors of charging mode, initial state of charge (SOC), initial charging time, and daily mileage are independent of each other, Monte Carlo is used to simulate the charging load of EVs.
The input information includes the number of EVs, battery capacity, initial charging time, and daily mileage. For an EV, first we determine its battery capacity and daily mileage, then we extract the SOC and initial charging time using the above-mentioned charging load model to obtain the load time distribution of the vehicle, and then add it to the EV load curve of the day. Finally, the obtained results are statistically processed to obtain a one-day EV charging load profile.
Users’ charging behavior is a key factor affecting the distribution of EV charging load in time, which includes daily mileage and initial charging time. The survey on U.S. vehicles by the U.S. Department of Transportation shows that daily mileage meets log-normal distribution [32]. Following the study, the probability density function of daily mileage in this study is as follows:
f ( l ) = 1 2 π l σ l e ( l n l     μ l ) 2 2 σ l 2
In the equation, l is the daily mileage, μ l is the average travel distance, and σ l is the standard deviation of the travel distance. We use data from a survey report in Beijing, China [42]: cars travel 50.2 km per day, with an average of 11.2 km per trip. So, we assume μ l = 11.2   km , σ l = μ l 4 = 2.8   km .
Based on the EV driving data, the probability density curve of EV daily travel is obtained, and the charging start time of EV is determined according to the curve. On weekdays, the use of EVs is more frequent than on weekends and at festivals. Therefore, this study assumes that the charging location of each EV is fixed. The charging start time of EVs in different regions depends on the curve characteristics analyzed through data. In addition, the charging start time of each region obeys the normal distribution.
The initial SOC of an EV is mainly related to the SOC after the previous charge and the distance traveled between two adjacent charges. Assuming that the battery is fully charged before driving, the SOC calculation process can be obtained:
E t = ( 1     δ l l m ) * 100 %
where δ is the time interval between two adjacent charging and l m is the maximum driving mileage. Substituting Equation (2) into Equation (1), the probability density function of SOC is:
f ( E t ) = 1 d m δ ( 1     E t ) 2 π σ l e ( l n d m δ + l n ( 1     E t )     μ l ) 2 2 σ l 2
When residents arrive at their own charging place, they will decide whether to charge or not according to their SOC. Only when the SOC cannot meet the travel schedule of tomorrow will residents choose to charge.
C h a r g e S t a t e = { Y e s N o       i f   S O C s t a t e < ( e l t + 1 ) / B   i f   S O C s t a t e ( e l t + 1 ) / B ,
where   S O C s t a t e represents the SOC of the EVs at arrival, e is the energy consumption, and B is the battery capacity.

2.3.2. EV Charging Demand Forecasting

The initial SOC and initial charging time of EVs are two of the key factors in the model of load prediction. Before the analysis, it was assumed that the SOC and the initial charging time are two independent variables.
It takes a period of time from the beginning of battery charging to full load, which will be randomly distributed in a day. Assume that the power of an EV at any time t is P j , and the EV starts to charge at k ( k t ) , regardless of whether the charging target is full load. Then, the power at time k is P j ( t k ) , and the SOC is S O C j ( t k ) . Therefore, the probability density function φ ( P j , t ) of the charging of a battery of a single EV at time t and a power of P j can be expressed as Equation (5).
    φ ( P j , t ) = k = 1 t f ( E j ( t k ) ) f T ( k )
where f ( E j ( t k ) ) and f T ( k ) are the probability density function of SOC and the initial charging time, respectively.
The expected value μ ( P ) and standard deviation σ ( P ) of the probability density function can be calculated from Equation (5). Equation (6) gives the expected value of a single EV at time t , and Equation (7) gives the standard deviation:
μ ( P ) = j = 1 n b P j φ ( P j , t )
σ ( P ) = ( j = 1 n b ( P j μ ( P ) ) 2 φ ( P j , t ) ) 1 / 2
where n b is the time required for the EV to be fully charged.
In fact, there are a certain amount of EVs charging at time t . It is assumed that the same type of EV has the same charging characteristics. Suppose that X 1 ,     X 2 , X 3 ,…, X n is the charging load of n groups of EVs with corresponding same load characteristics at time t . X i is the charging load of the EV with the same load characteristics at time i , and n is the number of EV groups with the same load characteristics. Each group of EVs has a corresponding expected value μ i and variance σ i 2 ( i = 1 , 2 , , n ) . Then, the average power of n groups of rechargeable batteries at time t can be equivalent to i = 1 n μ i . Therefore, the charging load P n of multiple EVs at t is expressed as Equation (8).
P n = i = 1 n j = 1 n b P j φ ( P j , t )
After the charging demand at time t is obtained, the charging load curve of a day can be obtained by superposing the charging demand at each time.

2.3.3. Scenario Design

The number of EVs reached 3.81 million in China at the end of 2019, with a penetration rate of 1.5% [5]. The configuration rate of private charging piles of EV users is between 60% and 70% [6]. The scenarios are designed based on the status quo of Hefei and the national average of China. Hefei is the capital of Anhui Province in central China, has a population of about 8 million, and is a pilot city of EV adoption. The number of cars in Hefei reached 2.18 million in 2019, and the amount of EVs was estimated to be between 50,000 and 60,000. The growth curve of EV amount with ±5% error is shown in Figure 3. In the status quo, we set the EV penetration rate to 3.5% based on current data for Hefei, and set the ratio of EVs/public charging piles to 7:1, and the EVs/private charging piles to 5:3 according to the average level of China [6]. Users who own a private pile also use public piles when they need to charge on the road.
Scenarios are designed with an EV penetration rate of 10% in the future, to predict the charging load profiles of different piles and explore the impacts of different factors on the charging load demand. In Scenario 1, it is assumed that the EV penetration rate will rise to 10%. In Scenario 2, the ratio of EVs/private charging piles increases to 5:4 as an increasing number of EV owners prefer installing private charging piles. Scenario 3 is designed with the consideration of smart charging, which means all private charging piles are directly operated by smart software provided by operation companies. Companies will directly control the time of charging based on optimization according to the load of the grid. Different from smart charging, disordered charging without a shifting function is based on the assumption that the charging events of each EV at each time are independent of time. The parameters in each scenario are shown in Table 1.

3. Results

3.1. Status Quo of EV Usage and Charging

By filtering and processing the EV driving data, the distribution of the driving frequency of EVs at different times is obtained. With 10-min intervals, 24 h are divided into 144 time points, as shown in Figure 4. The blue line represents the mean of driving frequency at each time point, and the orange part represent the error margin based on the standard deviation of observed value.
It can be seen from Figure 4 that there are three peak travel points within a day, appearing around 8:00, 13:00, and 17:00. There are three peaks of travel, named the morning peak (MP), the noon peak (NP), and the evening peak (EP). The MP and EP are in line with people’s daily commuting. The NP can be attributed to traveling for lunch and for work after lunch.
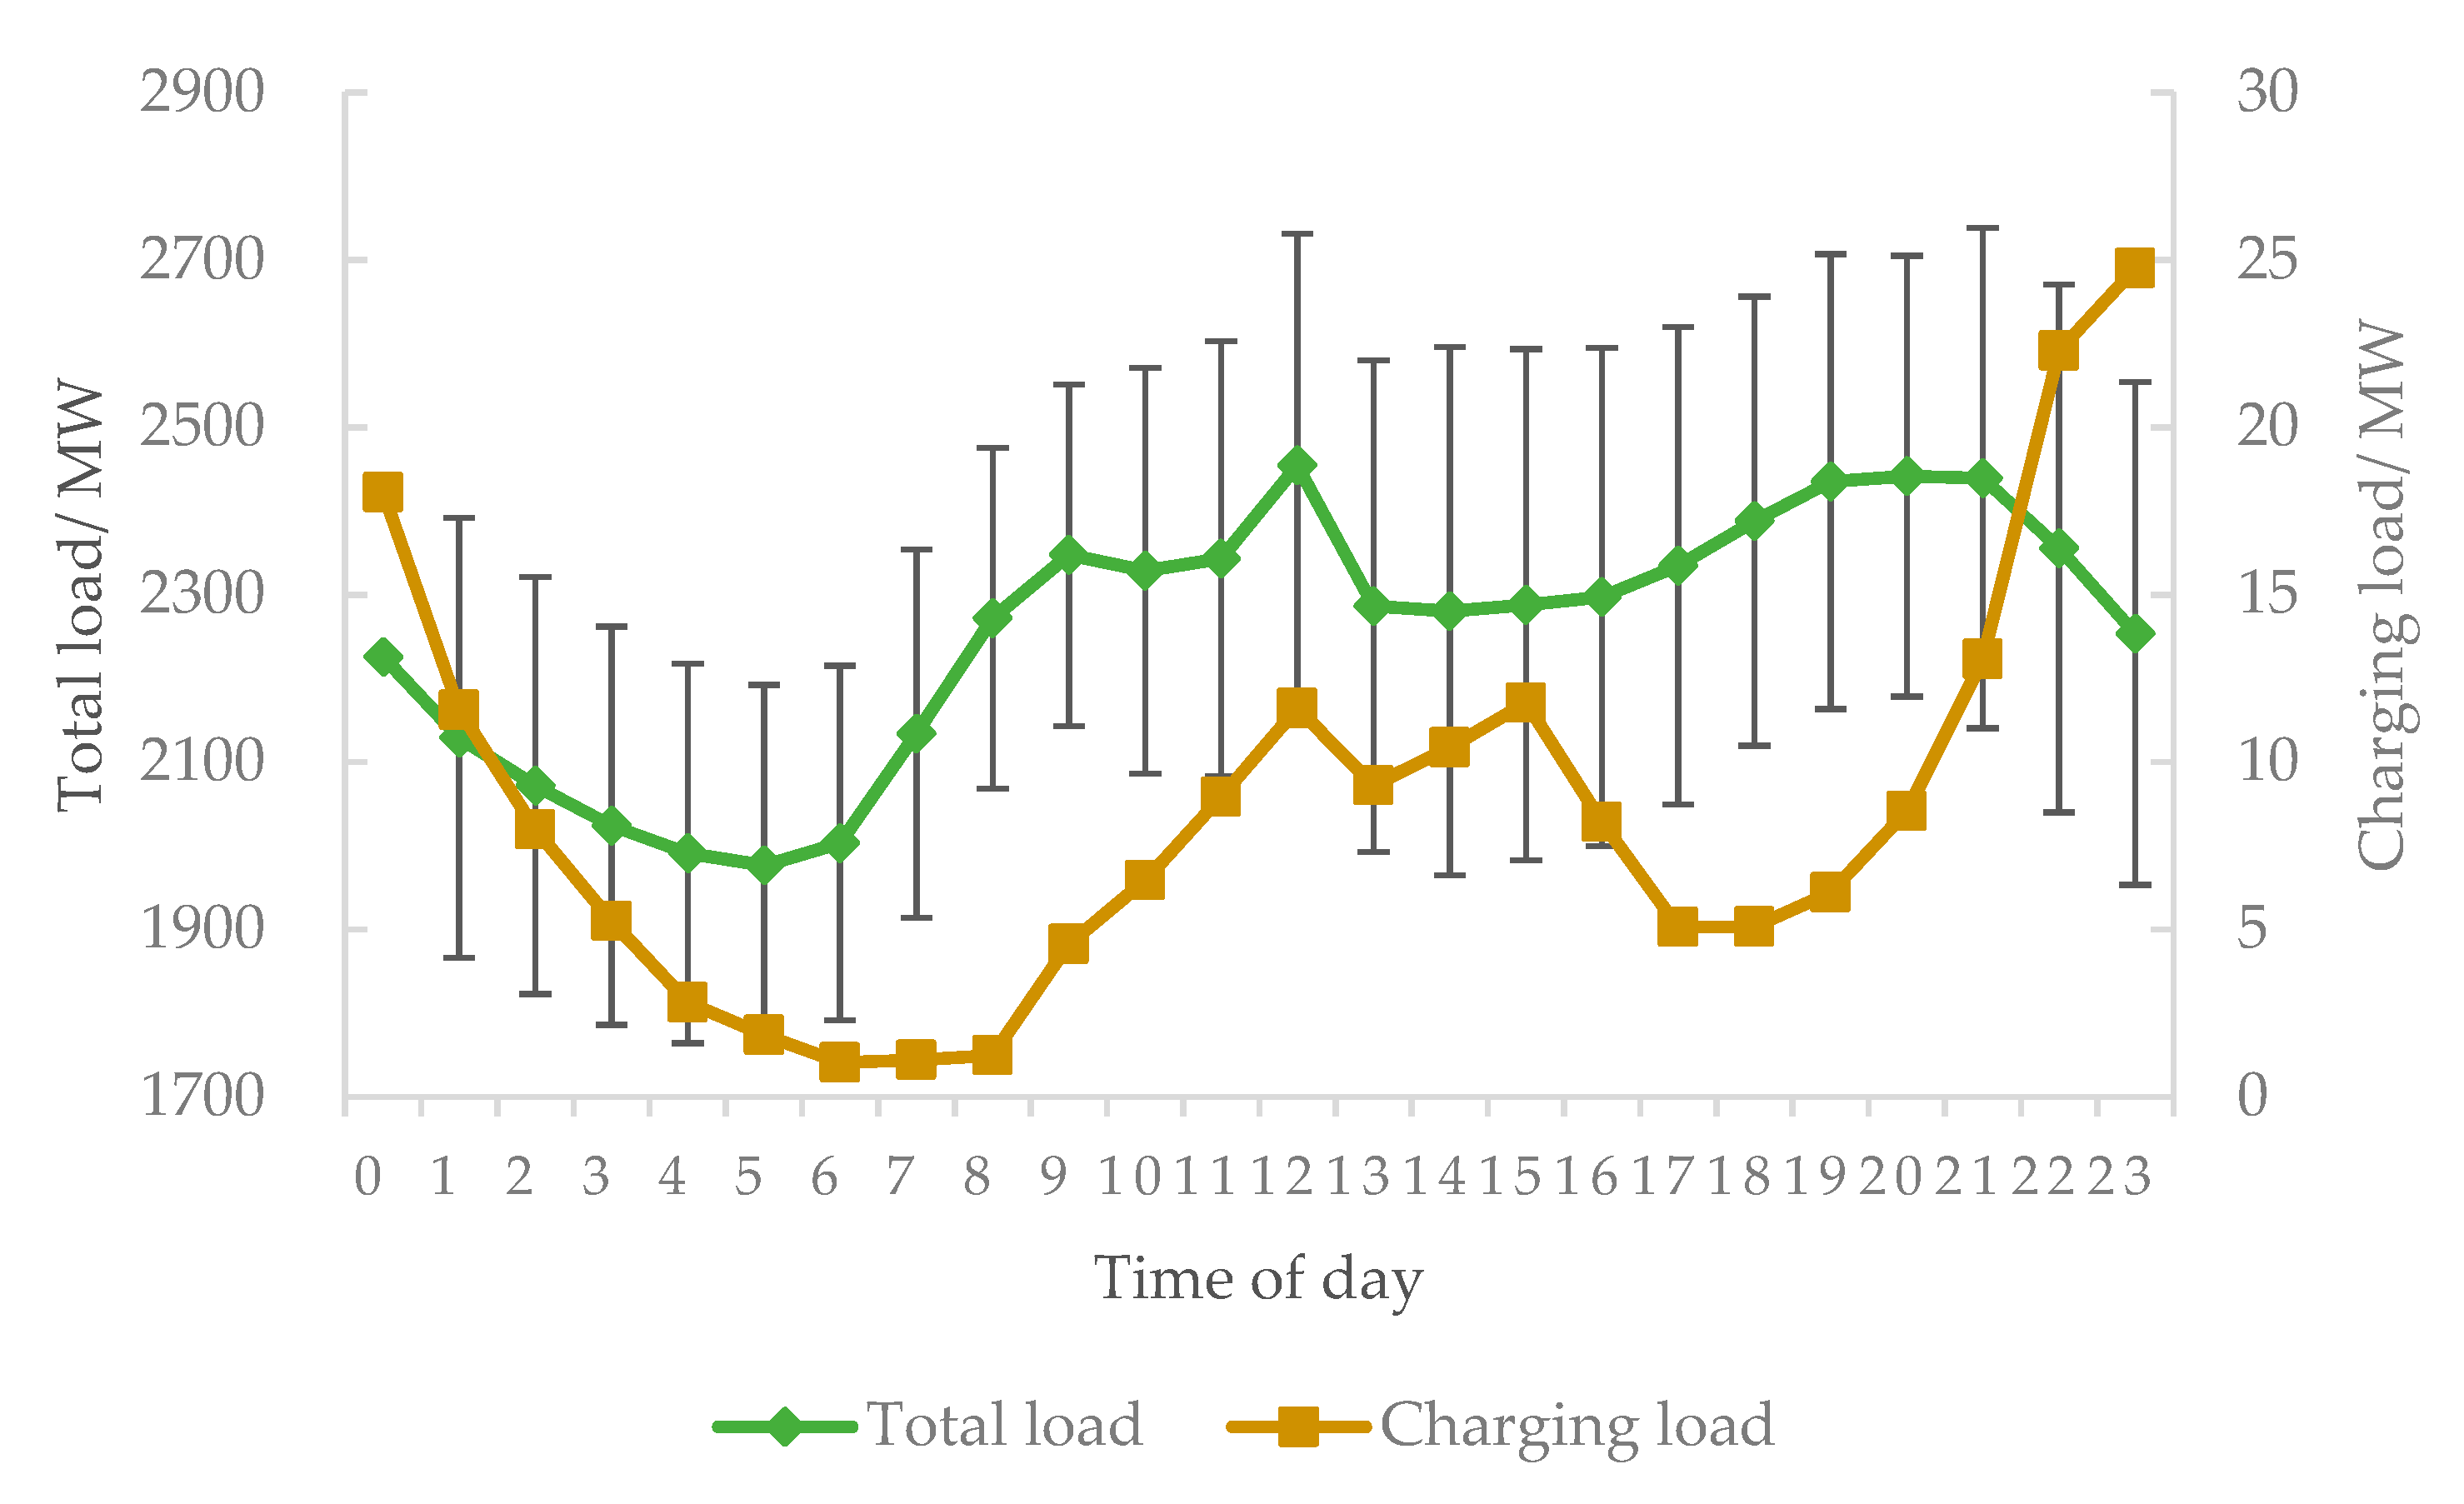
We obtained the 24-h charging load curves of different types of piles by selecting and integrating the charging pile data. The status quo of the charging load profile in Hefei is illustrated in Figure 5 and Figure 6. Charging demand is generated from 1 to 25 MW at each time within one day, which is 0.38% of the total load at average. Among them, private charging piles contribute 59% of the total demand, employee-shared piles account for 10%, and public ones account for 31%.
The charging load curves in Figure 5 show different temporal characteristics. The charging load of private ones presents a wide distribution and slow gradient, which means some EVs are on charge at any time throughout the day. As most of private charging piles are low power, this prolongs the charging time and increases the charging frequency. In order to make full use of the valley price and save money, users will choose to charge the EV at night after a day’s journey. The charging load of employee-shared ones is concentrated at 21:00–01:00, presenting a large peak and rapid change. The load rises rapidly and then quickly falls in a short time. The load of public piles is concentrated at 10:00–17:00 and 21:00–01:00, which are the two peaks during working hours and before midnight. As most of the public charging piles are fast ones, the charging time of an EV is as short as 2 h. The load change indicates that the charging habits of users are different. Some users tend to charge when they are at work in the morning and afternoon, while some choose to charge at night. Therefore, the structural adjustment of charging piles and charging demand will affect the gross charging load profile.
The temporal distribution of EV charging load and the average load of Hefei are shown in Figure 6. In general, the charging load presents a wavy distribution. Its minimum appears around 6:00 and its maximum at 23:00. After the residents finish their one-day trip, the EV will be charged at night, so the charging demand starts to increase after nightfall. Based on the comparison of the two curves in Figure 6, the peaks and valleys of the two coincide most of the time except 16:00–23:00. This shows that the disordered charging of EVs will increase the burden of the power grid around noon and in the evening.

3.2. Charging Load Profiles in Different Scenarios

Assuming that all EVs have the same parameters as the prototype vehicle collected, each scenario is simulated based on realistic data and fixed parameters. The charging load at each time is calculated for different types of charging piles, and then superimposed together. The charging load of each time is only related to the number of EVs charging, while the variation of charging power is not considered.
The results of simulation are presented in this section. 
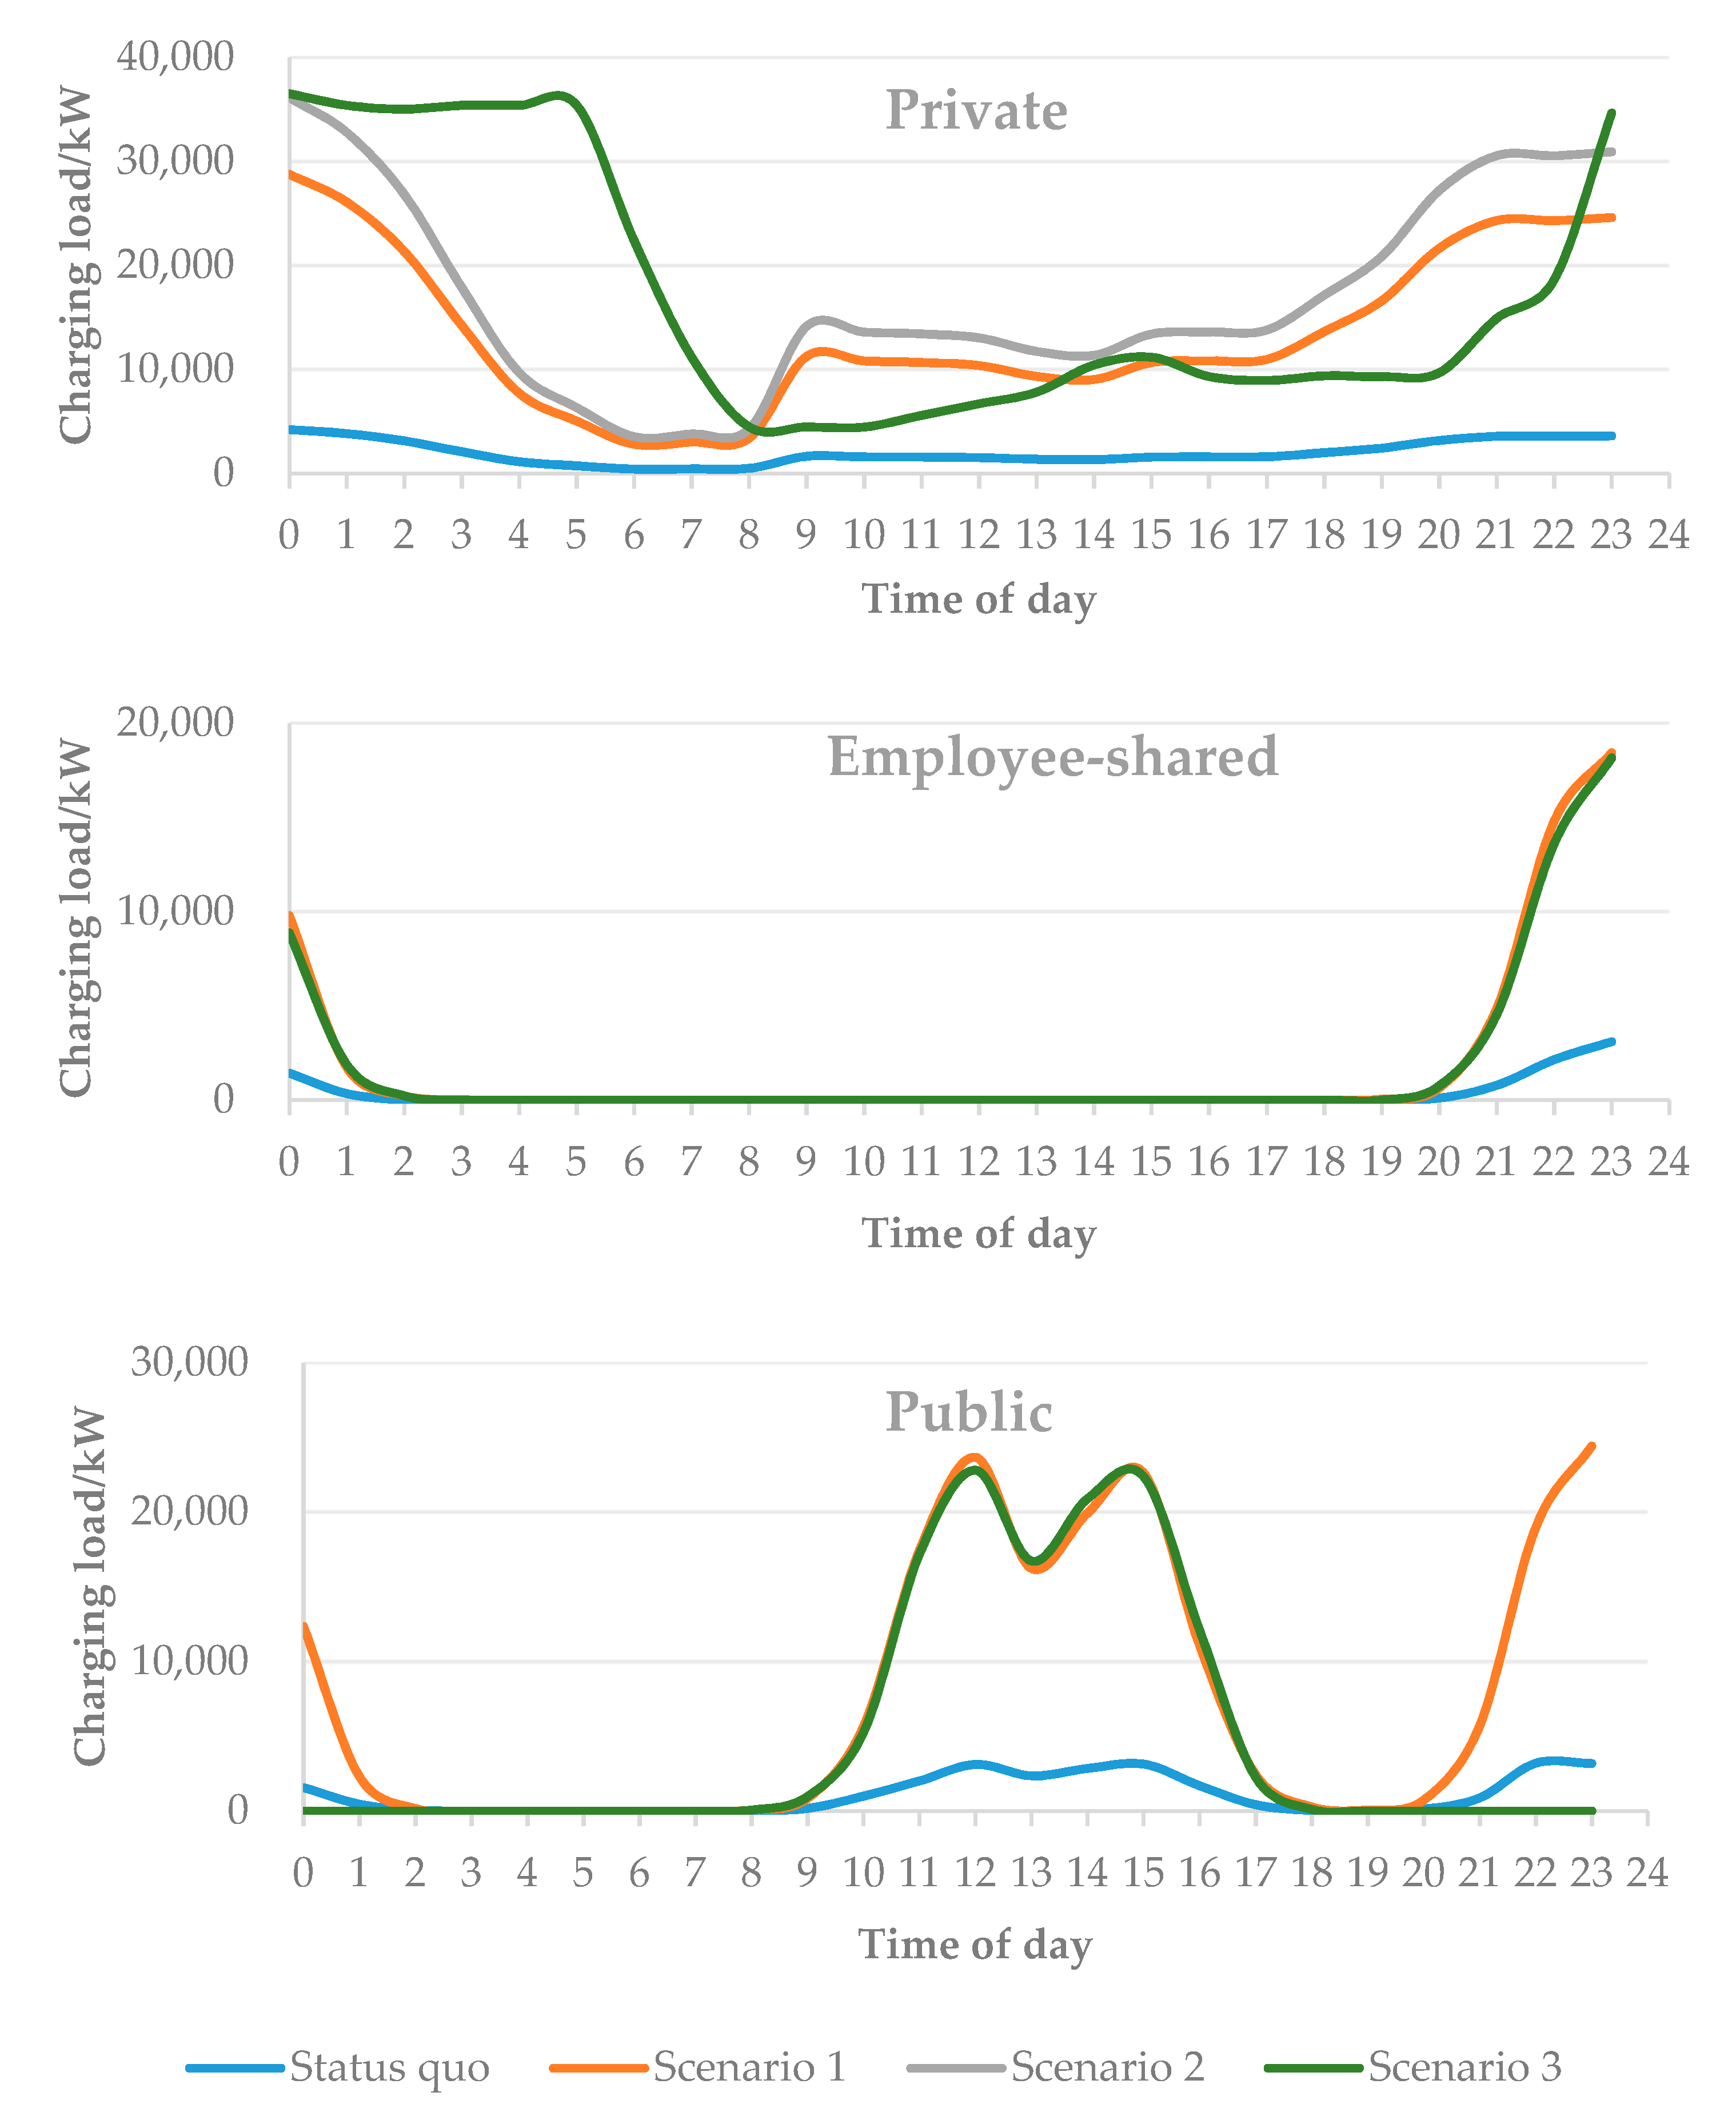
Figure 7 shows the change of charging load of each type in different scenarios. The load of private piles in each period increases significantly when the penetration rate increases. In Scenarios 1 and 2, the users are charged randomly, so the charging rules are the same. The charging load of private piles is distributed throughout the day, with the peak appearing at 21:00 and the low appearing at 6:00. In Scenario 2, the number of private charging piles is greater than that in Scenario 1, so the charging load at each time is slightly larger. After the implementation of smart charging, the charging load in the evening is significantly reduced, while the charging load from 22:00 to 06:00 is significantly increased. The peak load is postponed from 21:00 to midnight and early morning, which effectively promotes power use in the valley, and reduces the peak of Hefei’s total load. Therefore, smart charging will mitigate the impacts of EV charging on the grid.
Compared with the status quo, the employee-shared piles show the characteristics of conventional charging in the case of increased EV penetration. The temporal distribution of charging load remain stable when other conditions change, but the charging load peak during 21:00–01:00 will increase in all scenarios.
The charging curves of public piles in status quo and Scenario 1 show a clear gap in that the peaks are intensified in the daytime and at night. The disappearance of the peak load at night in Scenarios 2 and 3 indicates that the charging load of public piles has been shifted. When the adoption of private charging piles increases, EV charging at public piles will be transferred to charging at home. Moreover, smart charging will promote the transfer. However, the peak during 11:00–16:00 is not changed or transferred as the charging service is for EVs on the road and is an urgent need.
In general, without changing the other conditions, the increase in the EV amount will only increase the original load but will not change the charging habits of the driver (from the status quo to Scenario 1). When the number of private charging piles increases, the charging load of public piles will be transferred to private ones (from Scenario 1 to Scenario 2). After users are willing to participate in smart charging, the charging load peak in the evening will move to midnight and early morning to fill the electric valley at night in Hefei (from Scenario 2 to Scenario 3).

3.3. Parameter Comparison of Different Scenarios

Table 2 compares some key parameters of simulation results of status quo and three scenarios. Charging piles in Scenario 1 provided an accumulated charging load (A.L. in Table 2) of 567 MW at 24 time points in a day. Compared with the status quo, the load of each type increased greatly, but the proportion remained stable. In Scenario 1, EVs’ charging load is superimposed with the original load as the penetration rate increases, which will threaten the stability of the grid. The starting time and duration of charging will not change if the charging habits of the users do not change. The increase in the number of EVs will directly lead to a further increase in the peak load of the local grid.
Charging piles in Scenario 2 provide an accumulated charging load of 586 MW at 24 time points in a day, which is close to that in Scenario 1. However, the contribution of private piles increases from 59% to 71% (P in Table 2). The structural change of charging piles indicates that there is a significant peak-load shifting. Comparing Scenarios 1 and 2, we see that increasing the adoption rate of private charging piles has no significant effect on the total load but will shift a great part of the public charging load to a private charging load. According to the simulation, 12% of the charging load will be shifted from public piles to private ones if the ratio of EVs and private piles increases to 5:4. The private charging load is characterized by a wide distribution and gentle slope, while the public charging load is characterized by large peaks and rapid changes. Therefore, it is beneficial for peak-load shifting if the EV users change their demand from public piles to private ones. However, the peak-load shifting from 08:00–22:00 to 22:00‒08:00 is not significant.
Comparing Scenarios 2 and 3 reveals that increasing smart charging application will transfer 18% of the charging load from 08:00–22:00 to 22:00–08:00. The transfer means that most (59%) of the charging load can benefit from the low power price in the period of valley load.
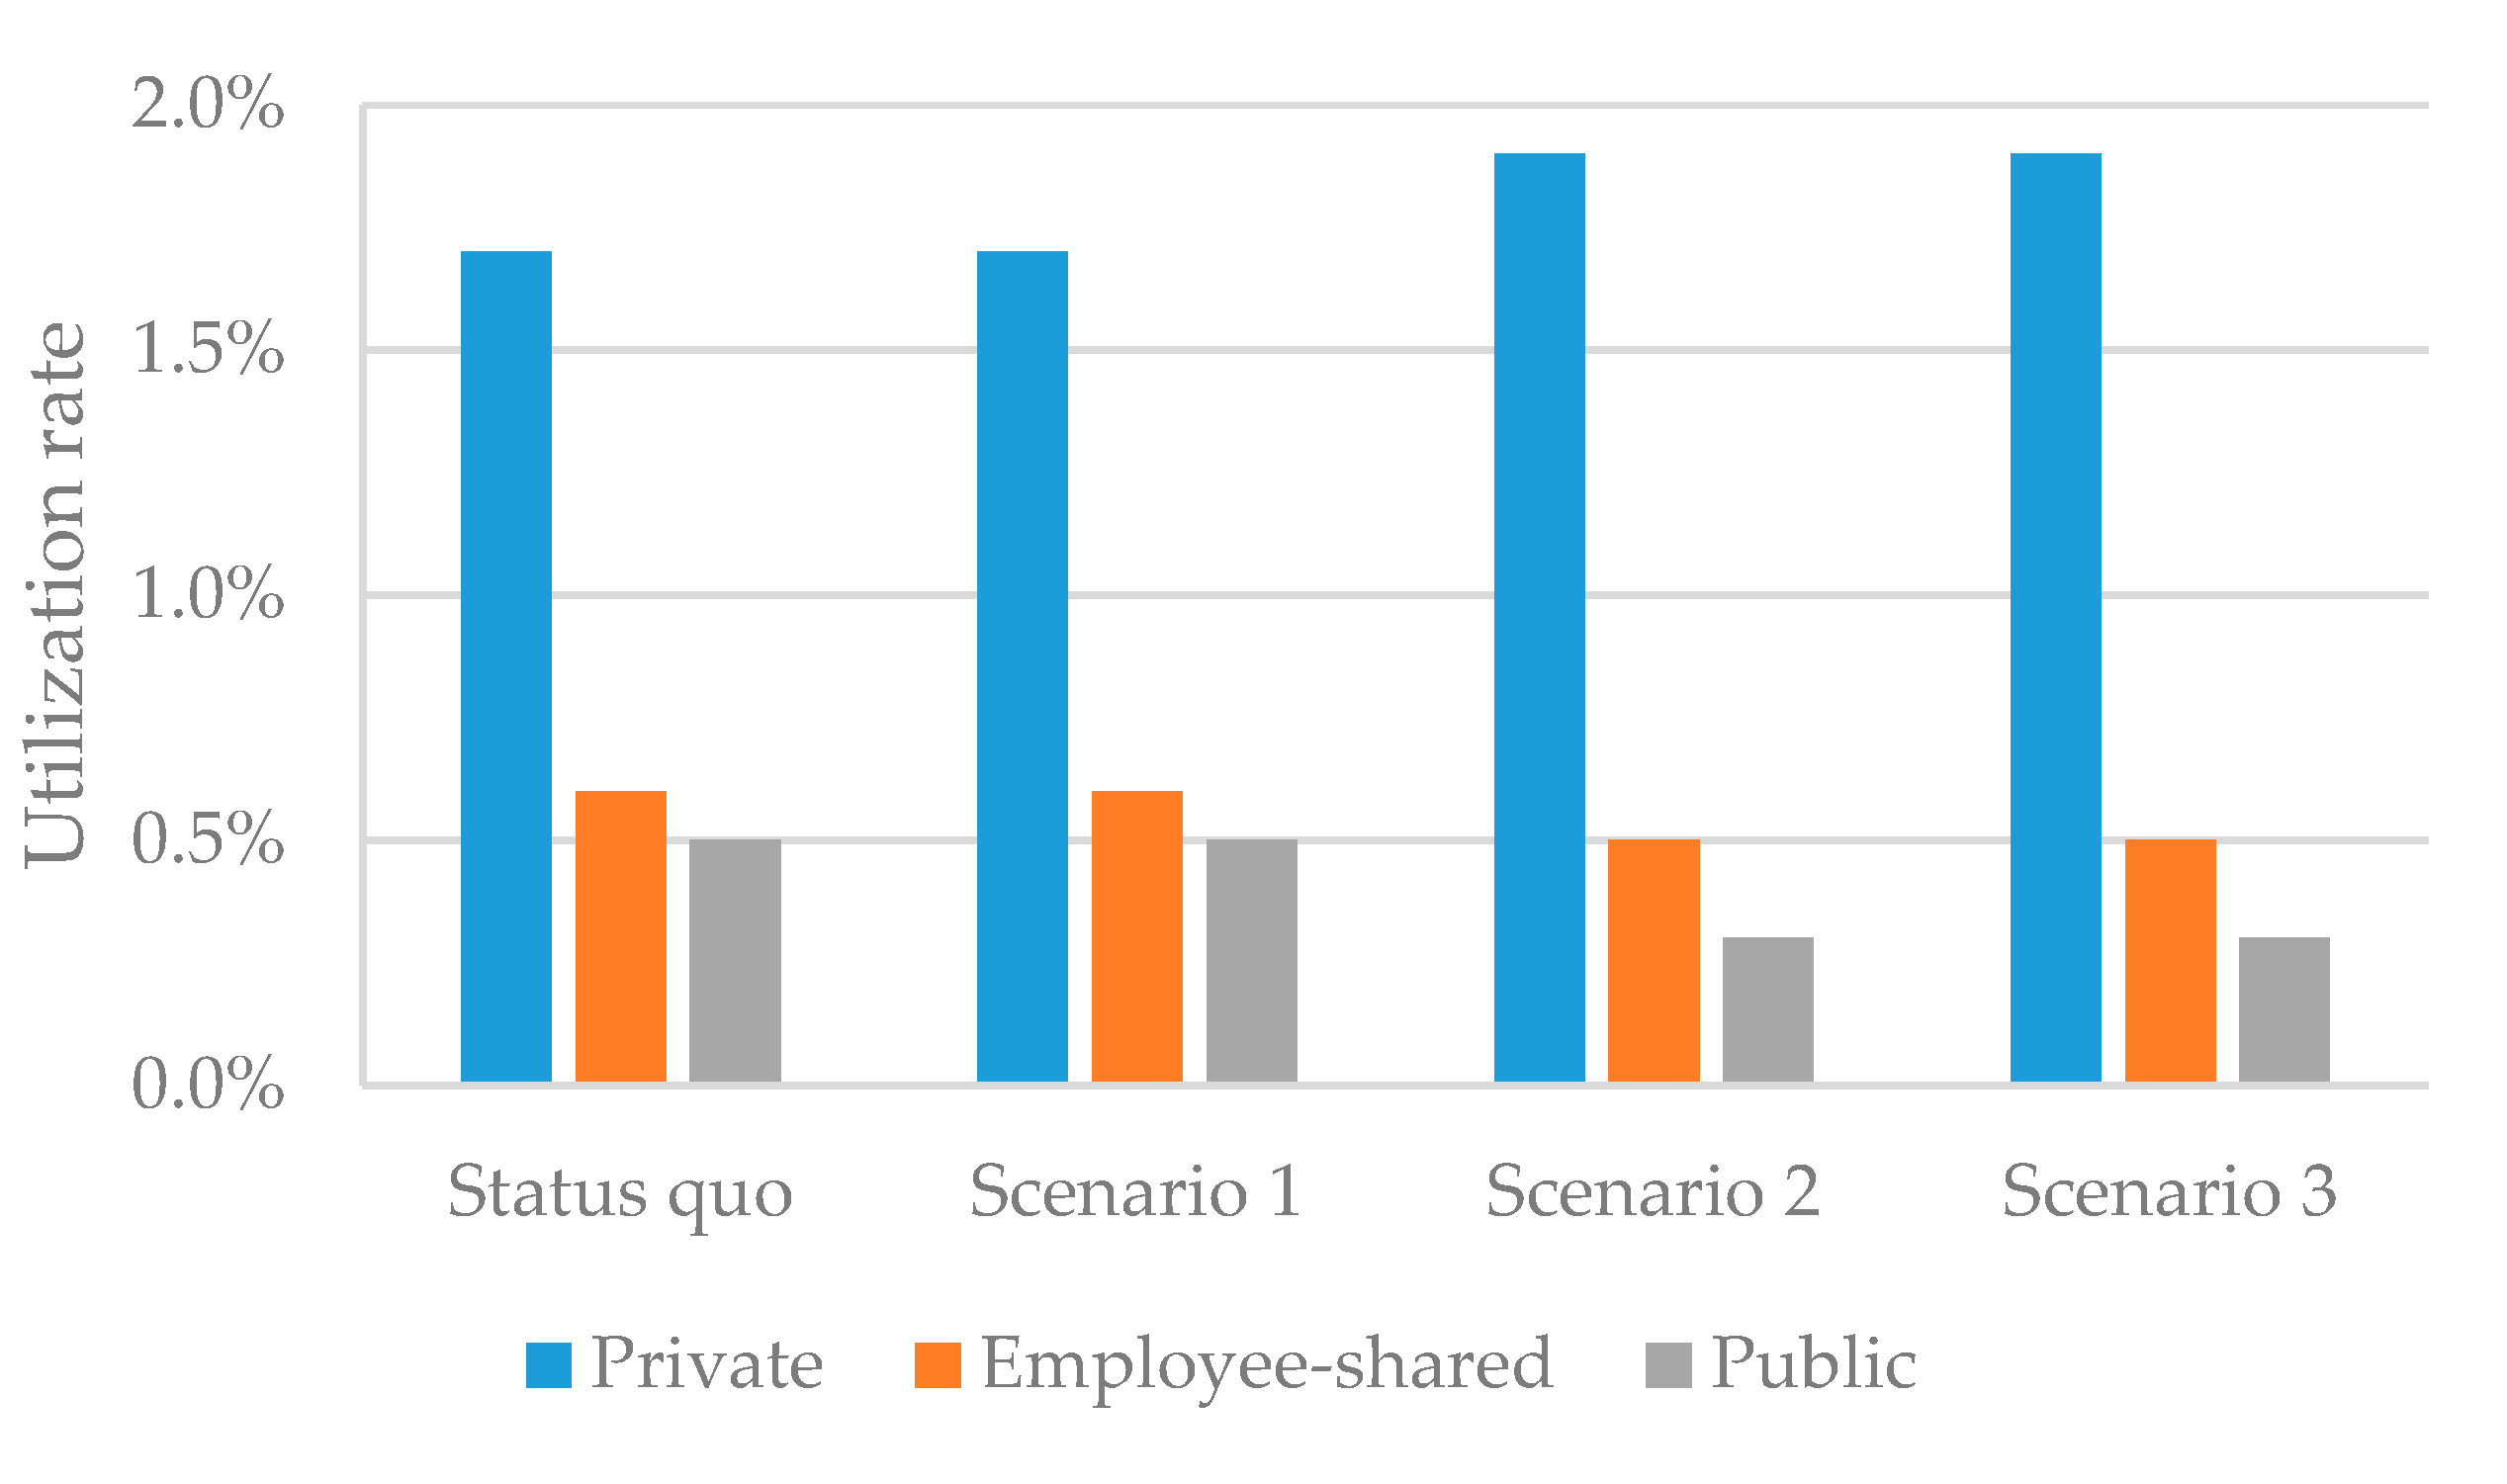
The utilization rates of charging piles in different scenarios are calculated with the assumption that the number of piles will increase with the increasing number of EVs. The results are shown in Figure 8. In all cases, the utilization rate of public charging piles is lower than that of employee-shared ones, and the utilization rate of private piles is the highest in the three types. This may be because the users of employee-shared and private piles are relatively fixed. Compared with the status quo, the utilization rate of charging piles in Scenario 1 does not change significantly. In Scenarios 2 and 3, the utilization rate of public charging piles will decrease from 0.5% to 0.3% due to peak-load shifting. At the same time, the utilization rate of private charging piles will increase from 1.7% to 1.9%.

3.4. Sensitivity Analysis

Based on the simulation analysis, the structural variation of charging piles and smart charging participation will affect the drivers’ charging behaviors and starting times, consequently changing the charging load. In this section, we explore the sensitivity of the results to variations in some key factors.
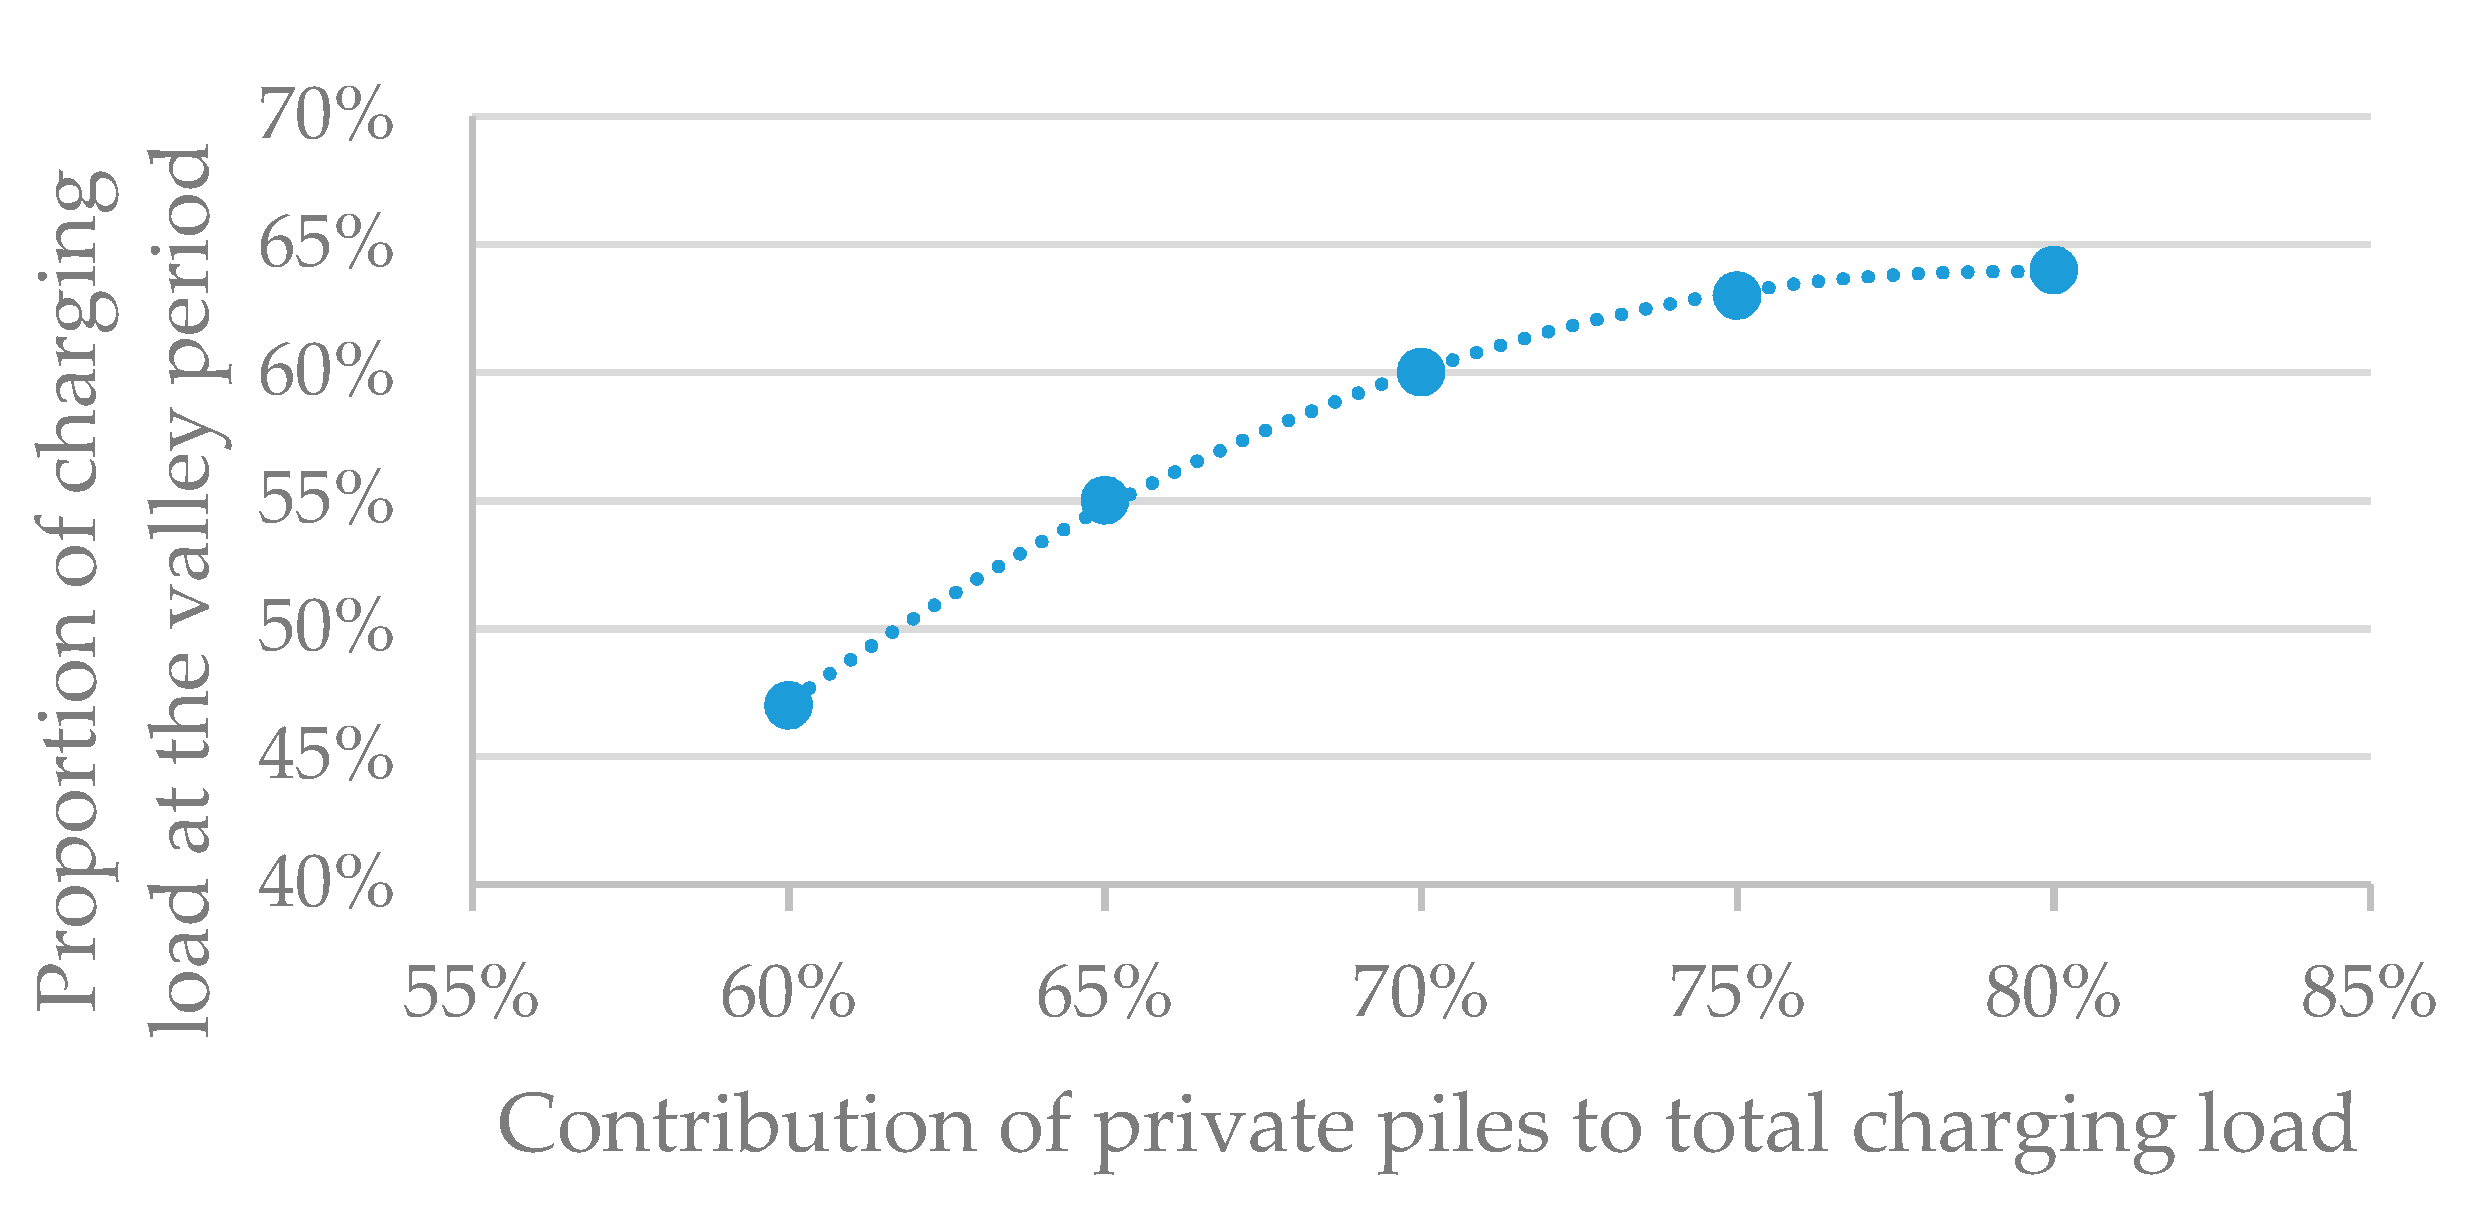
The influence of increasing private charging piles on charging load is explored in Scenario 3 with smart charging. The model is simulated with the contribution of private charging piles to total charging load from 60% to 80% at 5% intervals. The accumulated charging load is unchanged but the proportion of charging load at the valley period (22:00–08:00) will increase, as shown in Figure 9. This variation indicates that load shift can be promoted by increasing the number of private charging piles.
With the improvement of the charging system, smart charging is bound to become the major charging technology. We further explore the impact of smart charging participation rate on charging load, with the participation rate changing from 0 to 100% at 10% intervals. As shown in Figure 10, increasing the smart charging participation rate will increase the proportion of the charging load at the valley period (22:00‒08:00), with a linear relationship. The results also indicate that the charging load by day cannot be compressed to 0, as some drivers will use charging piles for charging during daytime journeys.
As can be seen in Figure 9 and Figure 10, increasing the proportion of charging load from private charging piles and the smart charging participation rate can promote charging load shifting to valley periods, but the effects and limitations of the two are different. The contribution of increasing private charging piles is significant in the first stage but limited after a certain threshold, which means that some rigid charging demands in the daytime and evening cannot be transferred. For the same reason, increasing participation in smart charging has a limitation for charging load shift, which may be correlated with the input parameters in the model. In general, the results indicate that both of the factors contribute to charging load shifting, but their limitations cannot be overlooked. On the other hand, public and employee-shared piles are also necessary in the future.
EVs’ continued voyage course (CVC) may be a factor with great growth potential in the future, which will increase with the development of battery technology. CVC will possibly affect drivers’ concerns about endurance, as well as their charging behaviors. Specifically, the charging frequency will drop with the increase in CVC, with a nonlinear relationship. However, we find that the impacts of CVC variation on gross charging load profile are very limited when we change the CVC from 200 to 800 km, as the travel habits of drivers are relatively fixed on weekdays. Under the influence of increasing private piles and smart charging technology, the total charging load of the city has not changed significantly. In addition, increasing CVC will not change the status quo of the low utilization rate of public charging piles.

4. Discussion

4.1. Contributions

This study makes novel contributions in the following aspects. First, the status quo and future scenarios are analyzed based on actual monitoring data from Hefei. The EV penetration rate and the decision function of EV users are included in the model to forecast charging load of EVs. Second, the structural evolution of charging piles is selected and proved to be an important factor in the EV charging load. Among three types of charging piles, this study mainly studies the influence of increasing private charging piles on charging load. Third, the influence of smart charging adoption on charging load is analyzed in a future scenario. Through the comparison of simulation results, this paper verifies the feasibility of peak-load shifting by private pile promotion and smart charging.
Previous studies have assumed that EVs will only be charged at staged destinations when SOC is not satisfied with the next trip or when the users feel range anxiety [43,44]. Although this assumption is consistent with multisegment or long-distance travel on holidays, it does not apply to the travel on workdays in China due to users’ stable travel behaviors. Through the data processing, we found that the average charging frequency of most EVs in Hefei is less than 1 per day, indicating that the EV battery can at least meet the daily travel demand of users. Therefore, users’ travel habits are relatively fixed on weekdays in China, and the private charging piles might have a greater influence than public ones on charging load profiles. With the assumption of constant charging behaviors of EVs’ users, we focus on forecasting the charging profiles under scenarios with a large number of private charging piles, which is different from previous studies.

4.2. Limitations

This study mainly studies the charging load profile on workdays, but neglects those during weekends and holidays, which is the primary limitation. On weekdays, users’ travel behavior is relatively fixed, so the charging behavior also tends to be fixed, and the daily charging amount is also stable. On weekends or holidays, users’ charging behavior will change and have a certain impact on the results. In the future, further studies can be conducted to explore the temporal-spatial distribution of charging demand on weekends and holidays and compare them with workdays. In addition, we define individual charging preferences from the perspective of the overall charging behavior of users, without considering the impacts of price and convenience on individuals. These individual-level factors may be included in future research.

4.3. Suggestions

As stated in the Introduction, the optimization of the distribution network in combination with charging load adjustment will make a great contribution to cost savings and efficiency as a whole. The study lays the foundation for the optimal configuration of EV charging infrastructure. According to the simulated results, it is suggested that private and public charging piles around residence zones should be encouraged, as they hold great potential to provide a smart charging service. Public and employee-shared charging piles’ site selection should be optimized according to the traffic flows and actual demand, to improve the average utilization rate. Besides, the growth potential of private piles should be considered when assess and predict the demand for public charging piles.
Moreover, as one of the significant tools peak-load shifting, smart or intelligent charging technology is still in its infancy with a very limited number of users. In order to promote the adoption of smart charging technology, a series of supporting policies are necessary, such as promoting reform of the electricity price mechanism, building an electricity market trading system, and providing fiscal subsidies for adoptions.

5. Conclusions

Understanding the temporal-spatial features of EV charging loads in a region or city is crucial to optimizing the configuration of charging infrastructure and satisfying users. This study proposes an analysis of the impacts of increasing private charging piles and smart charging adoption on EVs’ charging load profile, in which scenario analysis and Monte Carlo simulation are employed. Some conclusions can be drawn.
(1) The charging load profiles of different types of charging piles show different temporal characteristics. That of private piles is widely distributed with a gentle slope and a long peak in the evening, while that of public piles has two peaks, during working hours and before midnight. Therefore, the structural adjustment of charging piles and charging demand will affect the gross charging load profile.
(2) In future, the increasing number of EVs will increase the load on the local grid. Promoting the adoption of private charging piles will hardly affect the accumulated charging power but will transfer the charging load from public piles to private ones. Due to the different load profiles of the two charging piles, the charging peak will be weakened by day but enhanced at night.
(3) The simulated results indicate that promoting the adoption of private piles and smart charging technology will achieve a peak-load shifting effect. However, these changes will possibly reduce the utilization rate of public charging piles. Urban governments should consider the growth potential of private piles and promote smart charging in charging infrastructure planning.

Author Contributions

Conceptualization, F.L.; methodology, J.C., D.M.; software, J.C.; validation, J.C. and F.L.; formal analysis, F.L.; investigation, F.L.; resources, D.M.; data curation, J.C., D.M.; writing—original draft preparation, J.C.; writing—review and editing, F.L.; visualization, J.C.; supervision, F.L.; project administration, F.L. and R.Y.; funding acquisition, F.L. and R.Y.; All authors have read and agreed to the published version of the manuscript.

Funding

This research was funded by National Natural Science Foundation of China (71704045).

Conflicts of Interest

The authors declare no conflict of interest.

References

  1. IEA. Tracking Transport; IEA: Paris, France, 2019. [Google Scholar]
  2. Rupp, M.; Handschuh, N.; Rieke, C.; Kuperjans, I. Contribution of country-specific electricity mix and charging time to environmental impact of battery electric vehicles: A case study of electric buses in Germany. Appl. Energy 2019, 237, 618–634. [Google Scholar] [CrossRef]
  3. Du, J.; Ouyang, M.; Chen, J. Prospects for Chinese electric vehicle technologies in 2016–2020: Ambition and rationality. Energy 2017, 120, 584–596. [Google Scholar] [CrossRef]
  4. Zhou, B.; Littler, T.; Meegahapola, L.; Zhang, H. Power system steady-state analysis with large-scale electric vehicle integration. Energy 2016, 115, 289–302. [Google Scholar] [CrossRef] [Green Version]
  5. Jiang, L. The Number of Private Cars Exceeded 200 Million for the First Time. People’s Public Security Newspaper. Available online: https://www.mps.gov.cn/n2254314/n6409334/c6852472/content.html (accessed on 8 January 2020). (In Chinese)
  6. EVCIPA. Operation of Electric Vehicle Charging Infrastructures in December 2019; EVCIPA: Beijing, China, 2020. [Google Scholar]
  7. Rücker, F.; Merten, M.; Gong, J.; Villafáfila-Robles, R.; Schoeneberger, I.; Sauer, D.U. Evaluation of the Effects of Smart Charging Strategies and Frequency Restoration Reserves Market Participation of an Electric Vehicle. Energies 2020, 13, 3112. [Google Scholar] [CrossRef]
  8. Božič, D.; Pantoš, M. Impact of electric-drive vehicles on power system reliability. Energy 2015, 83, 511–520. [Google Scholar] [CrossRef]
  9. Zhang, L.; Hu, X.; Wang, Z.; Sun, F.; Deng, J.; Dorrell, D.G. Mult-iobjective Optimal Sizing of Hybrid Energy Storage System for Electric Vehicles. IEEE Trans. Veh. Technol. 2018, 67, 1027–1035. [Google Scholar] [CrossRef]
  10. Anand, M.P.; Golshannavaz, S.; Ongsakul, W.; Rajapakse, A. Incorporating short-term topological variations in optimal energy management of MGs considering ancillary services by electric vehicles. Energy 2016, 112, 241–253. [Google Scholar] [CrossRef]
  11. Huda, M.; Koji, T.; Aziz, M. Techno Economic Analysis of Vehicle to Grid (V2G) Integration as Distributed Energy Resources in Indonesia Power System. Energies 2020, 13, 1162. [Google Scholar] [CrossRef] [Green Version]
  12. Meng, X.; Zhang, W.; Bao, Y.; Yan, Y.; Yuan, R.; Chen, Z.; Li, J. Sequential construction planning of electric taxi charging stations considering the development of charging demand. J. Clean. Prod. 2020, 259, 120794. [Google Scholar] [CrossRef]
  13. Lin, H.; Fu, K.; Wang, Y.; Sun, Q.; Li, H.; Hu, Y.; Sun, B.; Wennersten, R. Characteristics of electric vehicle charging demand at multiple types of location-Application of an agent-based trip chain model. Energy 2019, 188, 116122. [Google Scholar] [CrossRef]
  14. Ren, X.; Zhang, H.; Hu, R.; Qiu, Y. Location of electric vehicle charging stations: A perspective using the grey decision-making model. Energy 2019, 173, 548–553. [Google Scholar] [CrossRef]
  15. Lin, H.; Fu, K.; Liu, Y.; Sun, Q.; Wennersten, R. Modeling charging demand of electric vehicles in multi-locations using agent-based method. Energy Procedia 2018, 152, 599–605. [Google Scholar] [CrossRef]
  16. Chakraborty, D.; Bunch, D.S.; Lee, J.H.; Tal, G. Demand drivers for charging infrastructure-charging behavior of plug-in electric vehicle commuters. Transp. Res. Part D Transp. Environ. 2019, 76, 255–272. [Google Scholar] [CrossRef]
  17. Zhang, L.; Zhao, Z.; Xin, H.; Chai, J.; Wang, G. Charge pricing model for electric vehicle charging infrastructure public-private partnership projects in China: A system dynamics analysis. J. Clean. Prod. 2018, 199, 321–333. [Google Scholar] [CrossRef]
  18. Chen, Z.; Xiong, R.; Wang, K.; Jiao, B. Optimal energy management strategy of a plug-in hybrid electric vehicle based on a particle swarm optimization algorithm. Energies 2015, 8, 3661–3678. [Google Scholar] [CrossRef] [Green Version]
  19. Aziz, M.; Oda, T.; Mitani, T.; Watanabe, Y.; Kashiwagi, T. Utilization of electric vehicles and their used batteries for peak-load shifting. Energies 2015, 8, 3720–3738. [Google Scholar] [CrossRef] [Green Version]
  20. Luo, Y.; Feng, G.; Wan, S.; Zhang, S.; Li, V.; Kong, W. Charging scheduling strategy for different electric vehicles with optimization for convenience of drivers, performance of transport system and distribution network. Energy 2020, 194, 116807. [Google Scholar] [CrossRef]
  21. Rodemann, T.; Eckhardt, T.; Unger, R.; Schwan, T. Using Agent-Based customer modeling for the evaluation of EV charging systems. Energies 2019, 12, 2858. [Google Scholar] [CrossRef] [Green Version]
  22. Doluweera, G.; Hahn, F.; Bergerson, J.; Pruckner, M. A scenario-based study on the impacts of electric vehicles on energy consumption and sustainability in Alberta. Appl. Energy 2020, 268, 114961. [Google Scholar] [CrossRef]
  23. Das, H.S.; Rahman, M.M.; Li, S.; Tan, C.W. Electric vehicles standards, charging infrastructure, and impact on grid integration: A technological review. Renew. Sustain. Energy Rev. 2020, 120, 109618. [Google Scholar] [CrossRef]
  24. Oda, T.; Aziz, M.; Mitani, T.; Watanabe, Y.; Kashiwagi, T. Mitigation of congestion related to quick charging of electric vehicles based on waiting time and cost–benefit analyses: A japanese case study. Sustain. Cities Soc. 2018, 36, 99–106. [Google Scholar] [CrossRef]
  25. Ayyadi, S.; Bilil, H.; Maaroufi, M. Optimal charging of electric vehicles in residential area. Sustain. Energy Grids Netw. 2019, 19, 100240. [Google Scholar] [CrossRef]
  26. Qian, F.; Gao, W.; Yang, Y.; Yu, D. Economic optimization and potential analysis of fuel cell vehicle-to-grid (FCV2G) system with large-scale buildings. Energy Convers. Manag. 2020, 205, 112463. [Google Scholar] [CrossRef]
  27. Kontou, E.; Liu, C.; Xie, F.; Wu, X.; Lin, Z. Understanding the linkage between electric vehicle charging network coverage and charging opportunity using GPS travel data. Transp. Res. Part C Emerg. Technol. 2019, 98, 1–13. [Google Scholar] [CrossRef]
  28. Wang, D.; Gao, J.; Li, P.; Wang, B.; Zhang, C.; Saxena, S. Modeling of plug-in electric vehicle travel patterns and charging load based on trip chain generation. J. Power Sources 2017, 359, 468–479. [Google Scholar] [CrossRef]
  29. Wang, Z.; Zhang, J.; Liu, P.; Qu, C.; Li, X. Driving cycle construction for electric vehicles based on markov chain and monte carlo method: A case study in Beijing. Energy Procedia 2018, 158, 2494–2499. [Google Scholar] [CrossRef]
  30. Shepero, M.; Munkhammar, J. Spatial Markov chain model for electric vehicle charging in cities using geographical information system (GIS) data. Appl. Energy 2018, 231, 1089–1099. [Google Scholar] [CrossRef]
  31. Olivella-Rosell, P.; Villafafila-Robles, R.; Sumper, A.; Bergas-Jané, J. Probabilistic Agent-Based model of electric vehicle charging demand to analyse the impact on distribution networks. Energies 2015, 8, 4160–4187. [Google Scholar] [CrossRef]
  32. Arias, M.B.; Bae, S. Electric vehicle charging demand forecasting model based on big data technologies. Appl. Energy 2016, 183, 327–339. [Google Scholar] [CrossRef]
  33. Khuntia, S.R.; Rueda, J.L.; van der Meijden, M. Forecasting the load of electrical power systems in mid- and long-term horizons: A review. IET Gener. Transm. Distrib. 2016, 10, 3971–3994. [Google Scholar] [CrossRef] [Green Version]
  34. Zhang, X. Short-term load forecasting for electric bus charging stations based on fuzzy clustering and least squares support vector machine optimized by wolf pack algorithm. Energies 2018, 11, 1449. [Google Scholar] [CrossRef] [Green Version]
  35. Liang, Y.; Niu, D.; Hong, W.-C. Short term load forecasting based on feature extraction and improved general regression neural network model. Energy 2019, 166, 653–663. [Google Scholar] [CrossRef]
  36. Moon, H.; Park, S.Y.; Jeong, C.; Lee, J. Forecasting electricity demand of electric vehicles by analyzing consumers’ charging patterns. Transp. Res. Part D: Transp. Environ. 2018, 62, 64–79. [Google Scholar] [CrossRef]
  37. Heymann, F.; Pereira, C.; Soares, F.; Miranda, V. Spatial load forecasting of electric vehicle charging using gis and diffusion theory. In Proceedings of the 2017 IEEE PES Innovative Smart Grid Technologies Conference Europe, Torino, Italy, 26–29 September 2017. [Google Scholar]
  38. Duan, M.; Darvishan, A.; Mohammaditab, R.; Wakil, K.; Abedinia, O. A novel hybrid prediction model for aggregated loads of buildings by considering the electric vehicles. Sustain. Cities Soc. 2018, 41, 205–219. [Google Scholar] [CrossRef]
  39. Li, X.; Zhang, Q.; Peng, Z.; Wang, A.; Wang, W. A data-driven two-level clustering model for driving pattern analysis of electric vehicles and a case study. J. Clean. Prod. 2019, 206, 827–837. [Google Scholar] [CrossRef]
  40. IEA. Global EV Outlook 2019; IEA: Paris, France, 2019. [Google Scholar]
  41. Joao, S.; Nuno, B.; Ghazvini, M.A.F.; Zita, V.; Oliveira, P.B.D.M.; Bae, S. Scenario generation for electric vehicles’ uncertain behavior in a smart city environment. Energy 2016, 111, 664–675. [Google Scholar]
  42. BITD. Beijing Transportation Development Annual Report 2018; Beijing Institute of Transportation Development: Beijing, China, 2018. [Google Scholar]
  43. Wang, Y.; Infield, D. Markov Chain Monte Carlo simulation of electric vehicle use for network integration studies. Int. J. Electr. Power Energy Syst. 2018, 99, 85–94. [Google Scholar] [CrossRef]
  44. Zhang, J.; Yan, J.; Liu, Y.; Zhang, H.; Lv, G. Daily electric vehicle charging load profiles considering demographics of vehicle users. Appl. Energy 2020, 274, 115063. [Google Scholar] [CrossRef]
Figure 1. Research scheme.
Energies 13 04387 g001
Figure 2. Flowchart of charging load profile generation.
Energies 13 04387 g002
Figure 3. Growth curve of the amount of electric vehicles (EVs) in Hefei (±5% error).
Energies 13 04387 g003
Figure 4. Distribution of driving frequency of EVs on weekdays. Note: The error margin is standard deviation of observed value.
Energies 13 04387 g004
Figure 5. Charging load curves of different types of charging piles.
Energies 13 04387 g005
Figure 6. Electricity load chart of Hefei throughout the day. Note: The error margin is the standard deviation of the samples.
Energies 13 04387 g006
Figure 7. Temporal distribution of charging loads of each pile in different scenarios.
Energies 13 04387 g007
Figure 8. Utilization rate of charging piles in different scenarios.
Energies 13 04387 g008
Figure 9. Sensitivity of charging load at the valley period to increasing private charging piles use.
Energies 13 04387 g009
Figure 10. Sensitivity of charging load at the valley period to promoting smart charging.
Energies 13 04387 g010
Table 1. Parameters of different scenarios.
Input ParametersStatus QuoScenario 1Scenario 2Scenario 3
EV penetration3.5%10%10%10%
EVs/private charging piles5:35:35:45:4
Private charging piles with smart charging function0%0%0%100%
Table 2. Key parameters of different scenarios.
ClassificationStatus QuoScenario 1Scenario 2Scenario 3
A.L.PA.L.PA.L.PA.L.P
Private49 MW59%332 MW59%417 MW71%416 MW71%
Employee-shared8 MW10%51 MW9%48 MW8%48 MW8%
Public26 MW31%185 MW32%121 MW21%121 MW21%
08:00–22:0050 MW61%342 MW60%344 MW59%243 MW41%
22:00–08:0033 MW39%225 MW40%241 MW41%343 MW59%

