Article

A Maximum Power Point Tracking Method Based on a Modified Grasshopper Algorithm Combined with Incremental Conductance

by
Bustani Hadi Wijaya
1,
Ramadhani Kurniawan Subroto
1,
Kuo Lung Lian
1,* and
Nanang Hariyanto
2
1
Department of Electrical Engineering, National Taiwan University of Science and Technology, No. 43, Sec. 4, Keelung Rd, Taipei 106, Taiwan
2
School of Electrical Engineering and Informatics, Institut Teknologi Bandung, Bandung 40116, Indonesia
*
Author to whom correspondence should be addressed.
Energies 2020, 13(17), 4329; https://doi.org/10.3390/en13174329
Submission received: 24 July 2020 / Revised: 16 August 2020 / Accepted: 18 August 2020 / Published: 20 August 2020
(This article belongs to the Special Issue PV Tracking Systems)

Abstract

:
The partial shading of photovoltaic (PV) modules due to clouds or blocking objects, such as buildings or tree leaves, is a common problem for photovoltaic systems. To address this, maximum power point tracking (MPPT) is implemented to find the global maximum power point (GMPP). In this paper, a new hybrid MPPT is proposed that combines a modified grasshopper optimization algorithm (GOA) with incremental conductance (IC). In the first stage, the proposed modified GOA is implemented to find a suitable tracking area where the GMPP is located. Then the system moves to the second stage by implementing IC to get the correct GMPP. IC is a fast-performing and reliable algorithm. By combining GOA and IC, the proposed method can find the GMPP accurately with a short tracking time. Various experimental results show that the proposed method yields the highest tracking efficiency and lowest tracking time compared to some of the state-of-the-art MPPT algorithms, such as particle swarm and modified firefly optimizations.

1. Introduction

To help reduce the adverse effects of fossil fuels, renewable energy has grown rapidly worldwide. One kind of renewable energy is solar energy providing abundant resources and emission-free. The solar energy can be categorized into concentrated solar power (CSP) and photovoltaics (PVs). CSP employs solar thermal power to generate electricity. Technically, CSP converts solar irradiation to heat power during the daytime, retains the heat into thermal energy storage, and generates the required electricity [1]. On the other hand, PVs directly alter the solar irradiation to electricity without any heat conversion. This benefit attracts the residential users to install PV, instead of CSP, as PV offers more economical technology. Consequently, PV has grown proportionately as the cost of producing and installing has declined [2]. In 2019, PV installations reached 646.8 GW of electricity generation.
Nevertheless, a common problem for PV systems is partial shading on the PV modules due to clouds or blocking objects, such as buildings or tree leaves. Under partial shading conditions (PSCs), the shaded modules operate in reverse bias and act as a burden, limiting the performance of the unshaded module and causing hotspot problems. Although bypass diodes are used to minimize this effect, their implementation causes the current–voltage and power–voltage (P-V) curves to change from uniform to non-uniform, leading to multiple peaks [3]. To increase the efficiency, a PV system is required to track the global maximum power point (GMPP).
The weakness of conventional maximum power point tracking (MPPT) algorithms (e.g., perturb and observe (P&O) [4], incremental conductance (IC) [5], and golden section search (GSS) [6]) is that they are easily trapped in local maxima, as they generally use a deterministic approach to track the maximum point. Those aforementioned methods will lead to power loss and low efficiency. To overcome this issue, efforts have been made to develop strategic approaches to minimize the negative effects of partial shading, namely hardware and advanced control algorithms.
A hardware approach modifies the system architecture to deal with PSCs. Examples of this strategy are the power electronic equalizer (to ensure that all substrings operate at the same voltage level during PSCs) [7], the multilevel DC-link inverter system (allows each module to be controlled separately) [8], distributed MPPT architecture (each module has its own controls) [9], and adaptive or dynamic reconfiguration of the PV module (an approach based on shading patterns) [10]. However, these approaches are generally complex and expensive.
The second strategy relies on advanced controls to alleviate the problems of PSCs. In order to track the global maximum power point (GMPP), most advanced control algorithms are based on artificial intelligence (AI). AI is generally associated with computer algorithms that exhibit some form of intelligence, which include neural networks, fuzzy logic, expert systems, and swarm intelligence, among others. Although their performance is good, the accuracy of neural networks [11] is highly dependent on the volume of training data and requires large and complex computational efforts to ensure the accuracy and reliability of the MPPT. Moreover, because fuzzy logic [12] and expert system controllers [13] are largely dependent on the designer’s experience and prior knowledge of the PV characteristics under various PSCs, it is difficult to generalize the system design.
To solve MPPT under PSCs, swarm intelligence methods with simple computational efforts have been developed. Researchers began developing swarm intelligence methods or meta-heuristic algorithms for MPPT to solve the partial shading problem without knowing the shapes of the PV characteristic curves.
Chen et al. [14] were among the first to demonstrate that swarm based MPPT is able to improve the tracking performance. Miyatake et al. [15] have shown that particle swarm optimization (PSO)-based MPPT can outperform conventional methods such as hill-climbing and Fibonacci search method under PSCs. Titri et al. [16] proposed an MPPT method based on the ant colony optimization algorithm, which saves on the computation time and performs excellent tracking capability. Ahmed et al. [17] have implemented a cuckoo search-based MPPT and have shown to have improved tracking performance and created higher efficiency, as compared to P&O and PSO methods. Sundareswaran et al. [18] implemented the firefly algorithm (FA) for MPPT under PSC and showed that it has better tracking performance than PSO and P&O. Teshome et al. [19] have modified the FA for better tracking speed. Tey et al. [20] proposed a bat algorithm (BA)-based MPPT for rapid convergence towards the GMPP. Liao et al. [21] have recently published a paper on an improved BA for faster tracking and better efficiency. Mohanty et al. [22] implemented grey wolf optimization (GWO) for MPPT to overcome the limitations such as lower tracking efficiency, steady-state oscillations, and transients, as encountered in P&O techniques. Sundareswaran, et al. [23] have implemented the artificial bee colony (ABC) to obtain global maxima under PSCs. Bhukya et al. [24] have used the grasshopper optimization algorithm (GOA) to optimize the scaling factors of fuzzy logic control for better MPPT. Moreover, a GOA-based MPPT method has also been implemented in [25] to deal with various PSCs. GOA is a recently developed meta-heuristic algorithm, known for its robust feature in handling various optimization problems [26]. Nevertheless, since the meta-heuristic approaches employ random variable to escape from trapping in a local optimum, the final convergent point will be different every time the algorithm is executed, even though the same initial values are used. To avoid such a problem, it is better to first use a metaheuristic approach to locate the area where the GMPP is located, and then use a deterministic method to pinpoint the exact GMPP. This can ensure the repeatability of the MPPT algorithm.
In this paper, a new hybrid MPPT is proposed by combining a modified GOA with IC. In the first stage, the proposed modified GOA is implemented to find a suitable tracking area where the GMPP is located. Then the system moves to the second stage by implementing IC to get the correct GMPP. IC is a reliable, fast-performing algorithm. By combining GOA and IC, the proposed method can find GMPP accurately with a short tracking time.
The remainder of this paper is organized as follows: Section 2 briefly reviews GOA and IC. Section 3 describes the proposed MPPT algorithm. Section 4 experimentally compares the performance of the proposed algorithm with some of the state-of-the-art MPPT algorithms (i.e., PSO [15] and the modified firefly algorithm (MFA) [19]) to show its superiority. Section 5 provides conclusions.

2. Review of Grasshopper Optimization Algorithm and Incremental Conductance

2.1. Review of Grasshopper Optimization Algorithm

Mimicking the behavior of the grasshopper, GOA has two phases in determining food sources, namely nymphs (young grasshoppers) and adults, as illustrated in Figure 1. The nymph or larval phase moves slowly with small steps, which can be regarded as the exploitation stage. The adult phase (adulthood) has responsive movements and large steps, which can be regarded as the exploration stage.
GOA can be mathematically modeled as Equation (1) [26]:
X i = S i + G i + A i ,
where X i is i-th grasshopper’s position, S i is social interaction of the i-th grasshopper, G i is the i-th grasshopper’s gravity force, and A i shows the influence of the wind on the i-th grasshopper. The social interactions between grasshoppers can be modeled by Equation (2) [26]:
S i = j = 1 ; j i N s ( d i j ) d ^ i j ,
where d i j is the distance between the i-th and the j-th grasshopper, and d i j = | x j x i | ; d ^ i j is a grasshopper vector unit, and d ^ i j = x j x i d i j ; s is a function that shows the strength of the social force which is calculated by Equation (3) [26]:
s ( r ) = f e r l e r ,
where f is the coefficient of attraction intensity, and l is the length coefficient of interest. f and l factors represent the attraction and repulsion force functions on the individual grasshopper to reach the “comfortable zone”, which means the grasshoppers have converged. G i can be expressed by Equation (4) [26]:
G i = g e ^ g ,
where g is the gravitational constant ( g = 10 m s 2 ) and e ^ g is a unit vector towards Earth’s core. The negative sign indicates the force of the grasshopper as opposed to Earth’s gravitational force. The influence of the wind on the i-th grasshopper can be defined by Equation (5) [26]:
A i = u e ^ w ,
where u is a hovering constant and e ^ w is a unit vector that shows the direction of the wind. Note that movements of the young grasshoppers are highly dependent on the direction of the wind because they do not have wings. Combining Equations (2), (4), and (5) yields [26]:
X i = j = 1 ; j i N s ( | x j x i | ) x j x i d i j g e ^ g + u e ^ w ,
Since Equation (6) is complicated for MPPT implementation, it can be simplified by assuming the wind direction is always towards the target and the gravity force is ignored, as given in Equation (7) [26]:
X i d = c ( j = 1 ; j i N c u b d l b d 2 s ( | x j d x i d | ) x j x i d i j ) + T d ,
where u b d is the upper limit in the D-th dimension, l b d is the lower limit, and T d is the target solution, which is the best value so far and updated with iteration. T d carries the same meaning as the global best in PSO. Note that there are two identical c ’s in Equation (7), which physically have two meanings. The first c constant resembles the inertial weight ( w ) in PSO, while the second c constant reduces the attraction, comfort, and repulsive zones between particles. c is defined in Equation (8):
c = c max l c max c min L ,
where c max is the maximum value, c min is the minimum value, l is the current iteration, and L is the maximum iteration. Hence, the value of c decreases with increasing iteration.
To improve GOA’s accuracy in finding GMPP, Akash Saxena et al. [27] added some randomness in GOA. The authors referred to their method as enhanced chaotic GOA (ECGOA). This random parameter x l is added to c , and, according to [27], the value of x l is within different ranges for the following four cases:
Case   1 :   if   0 x l < 0.4
c ( l ) = ( c max + N m max x l 0.4 ) ( 1 l L ) + l L ( c min + N m min x l 0.4 ) ,
Case   2 :   if   0.4 x l < 0.5
c ( l ) = ( c max + N m max ( x l 0.4 0.1 ) ) ( 1 l L ) + l L ( c min + N m min ( x l 0.4 0.1 ) ) ,
Case   3 :   if   0.5 x l < 0.6
c ( l ) = ( c max + N m max ( 0.6 x l 0.1 ) ) ( 1 l L ) + l L ( c min + N m min ( 0.6 x l 0.1 ) ) ,
Case   4 :   if   0.6 x l < 1
c ( l ) = ( c max + N m max ( 1 x l 0.4 ) ) ( 1 l L ) + l L ( c min + N m min ( 1 x l 0.4 ) ) ,
where L is the maximum iteration; N m min and N m max are constant values, which are chosen to be 0.1 and 2, respectively.
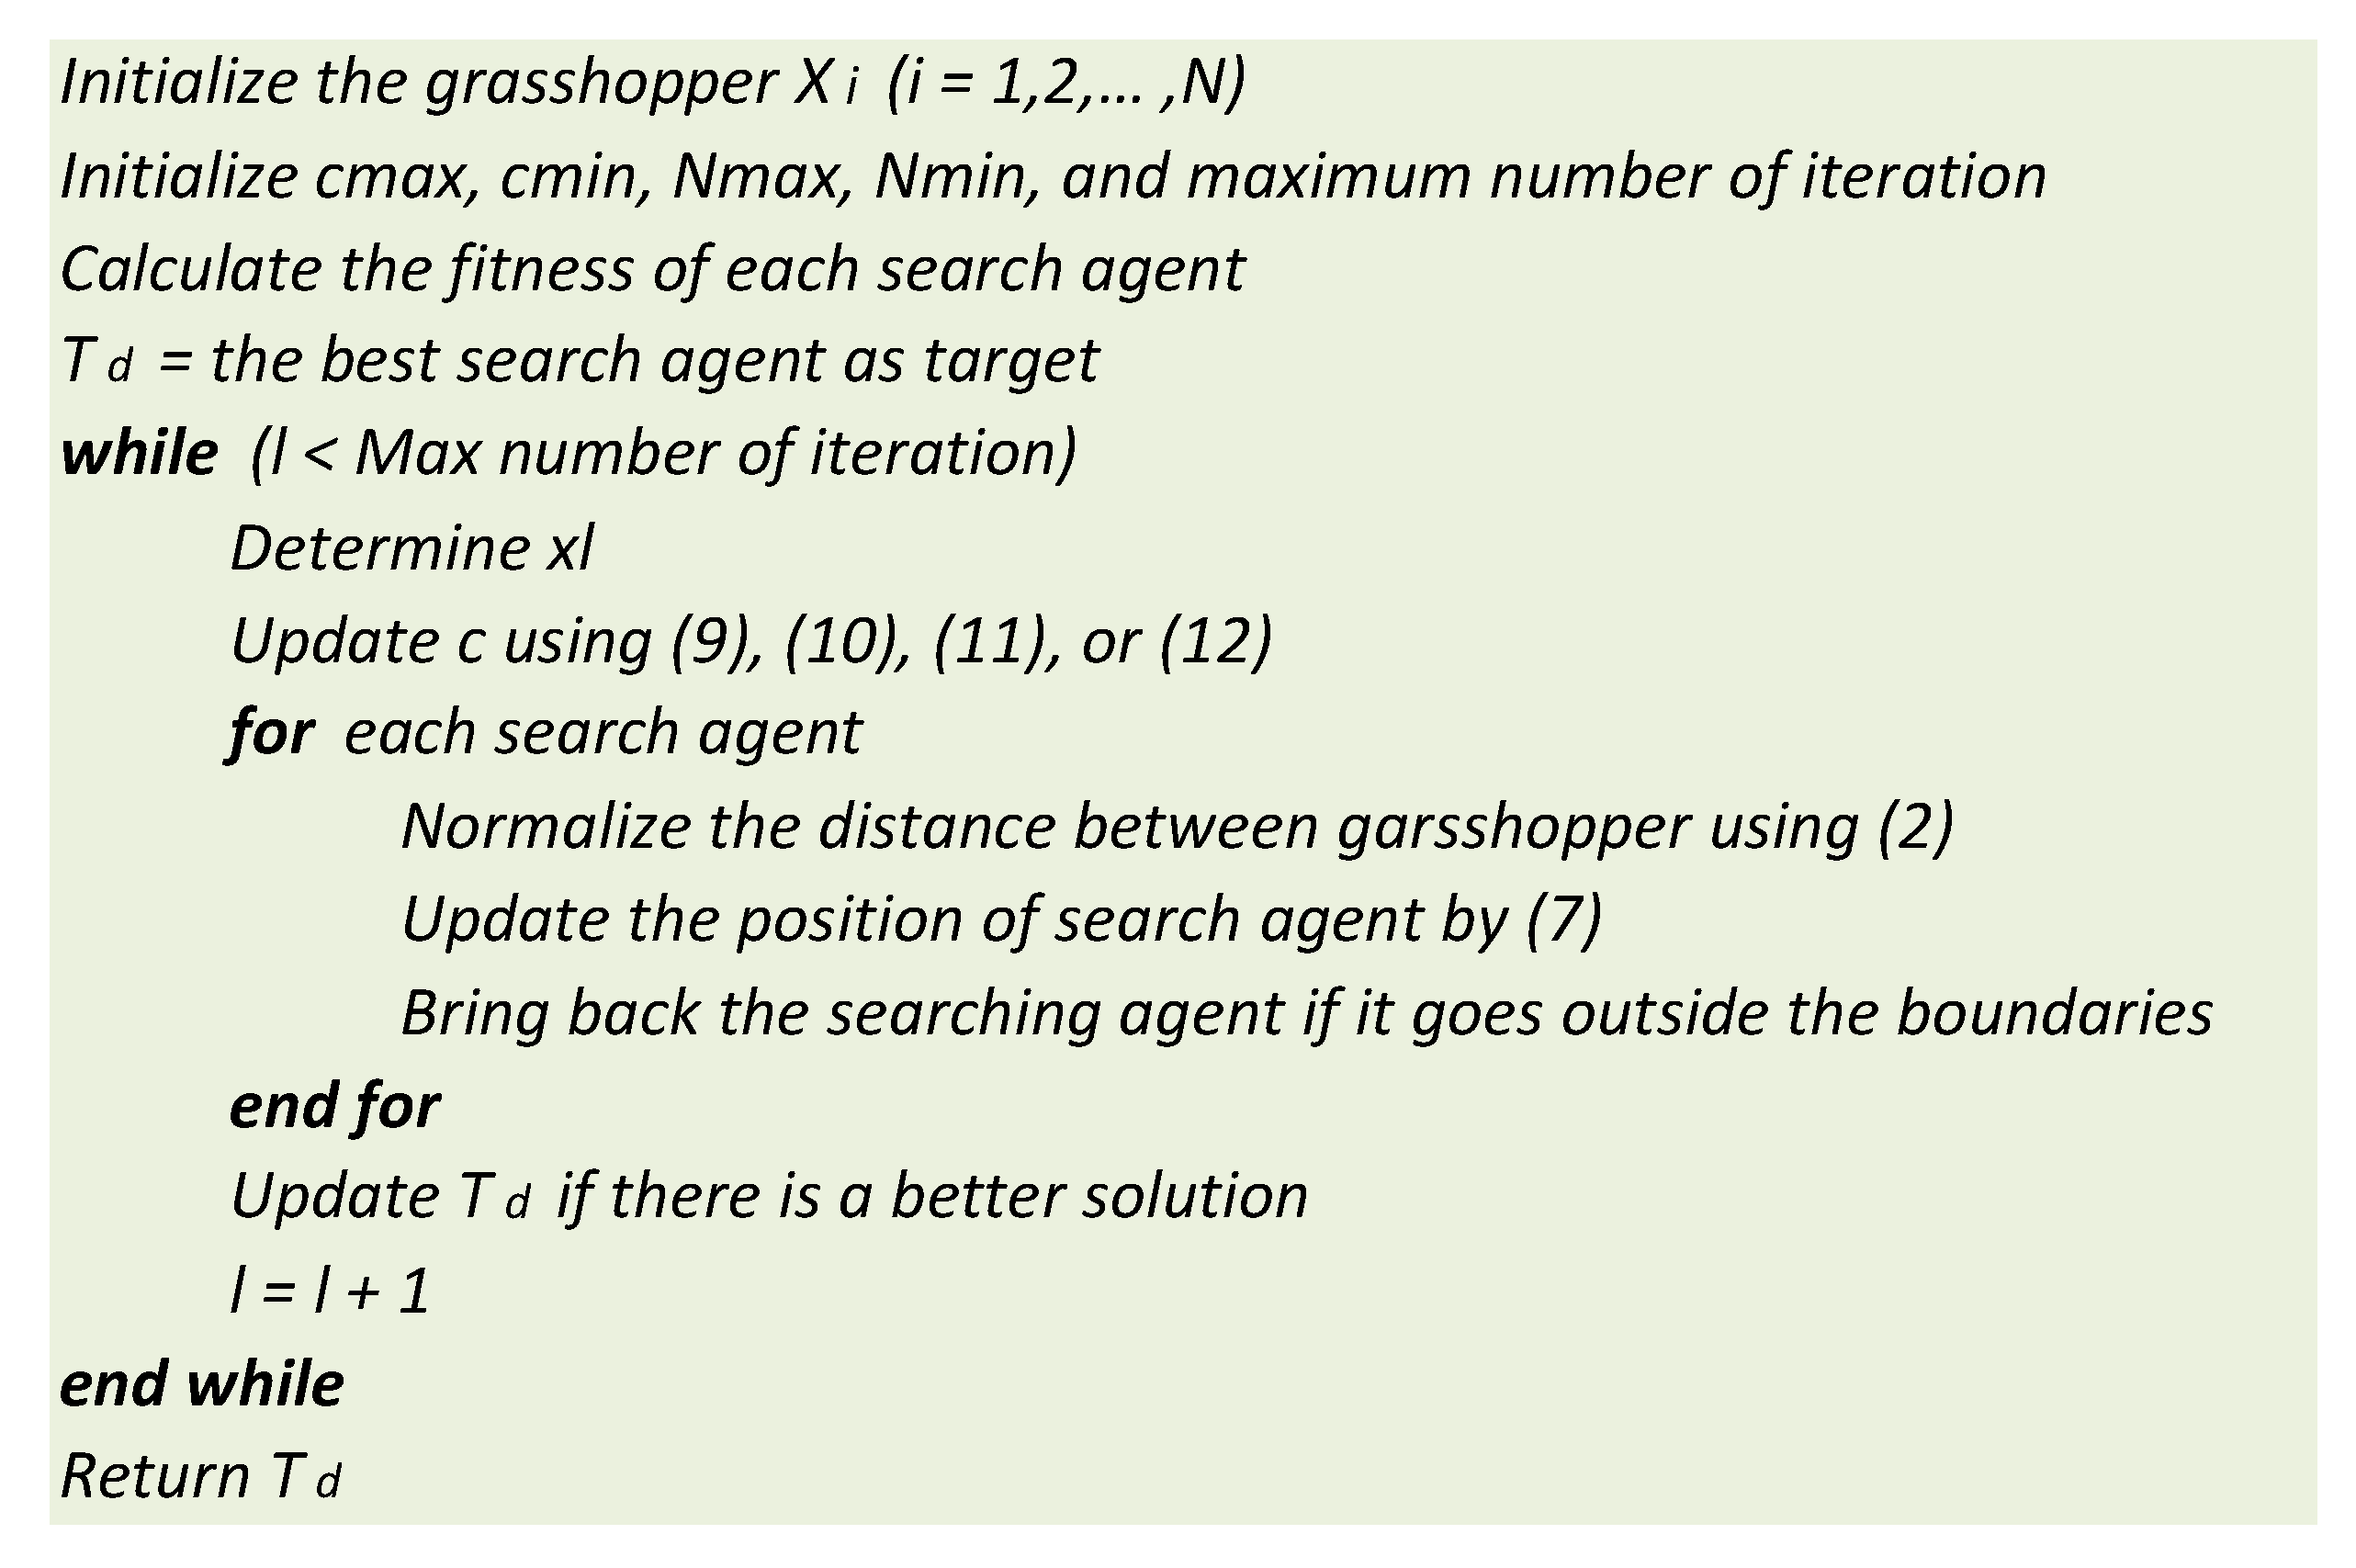
Figure 2 shows the pseudo-code of ECGOA. ECGOA commences by creating random solutions. The particles then update their positions according to Equation (8). The best target value T ^ d is updated on each iteration. In addition, c is updated iteratively by utilizing the chaotic sequence value x l with a random value and is calculated by Equations (9)–(12) depending on the obtained value of x l . The distance between grasshopper agents is normalized to get the value of social interaction S i according to Equation (3). This position is updated iteratively until the final criteria are met. The best position and fitness of the target is finally used as the best estimate of the global maxima.
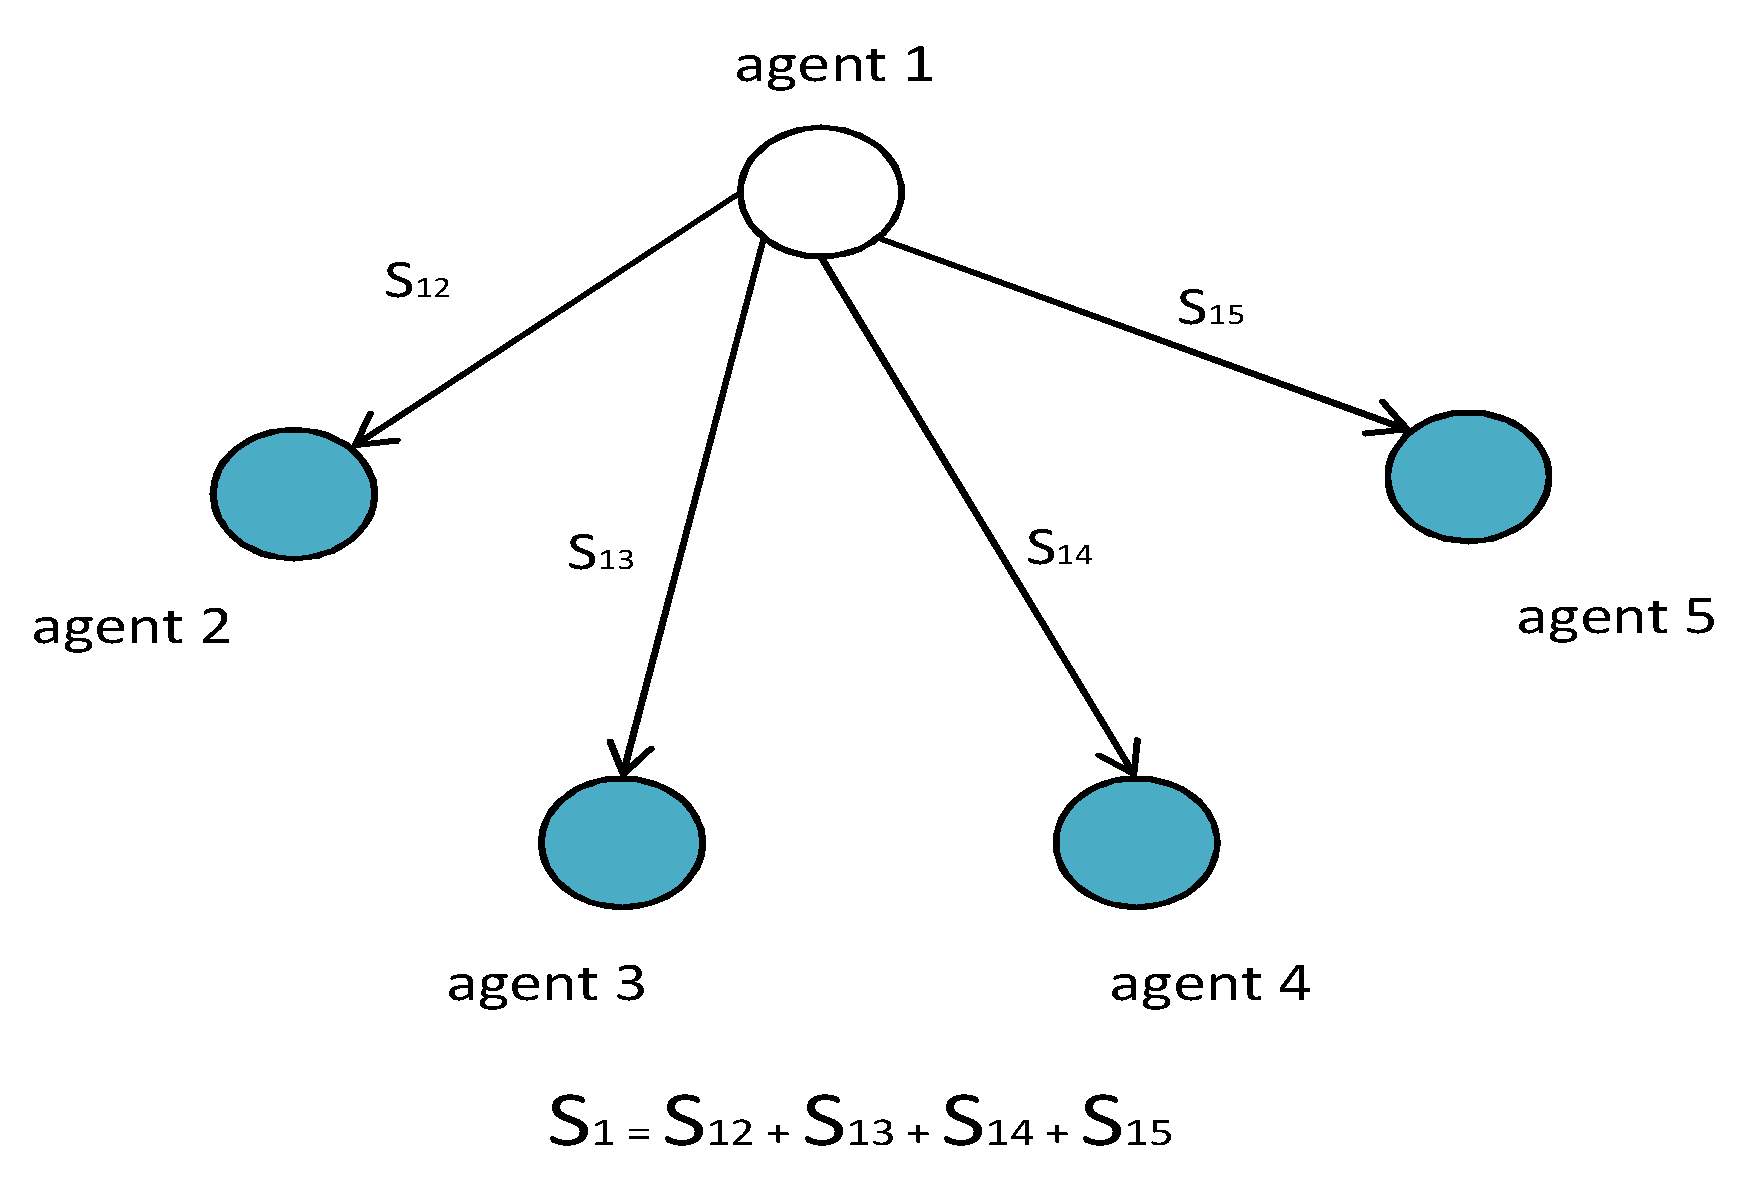
The main problem with ECGOA is that calculating the grasshopper’s social interactions ( S i ) is highly dependent on the distance between the position of other grasshoppers. The S i calculation is based on the fact that each grasshopper must calculate its distance between other grasshoppers according to Equation (2), as illustrated in Figure 3. Determination of S i involves calculating the distance between one grasshopper and all other grasshoppers, leading to long tracking times.

2.2. Review of Incremental Conductance (IC)

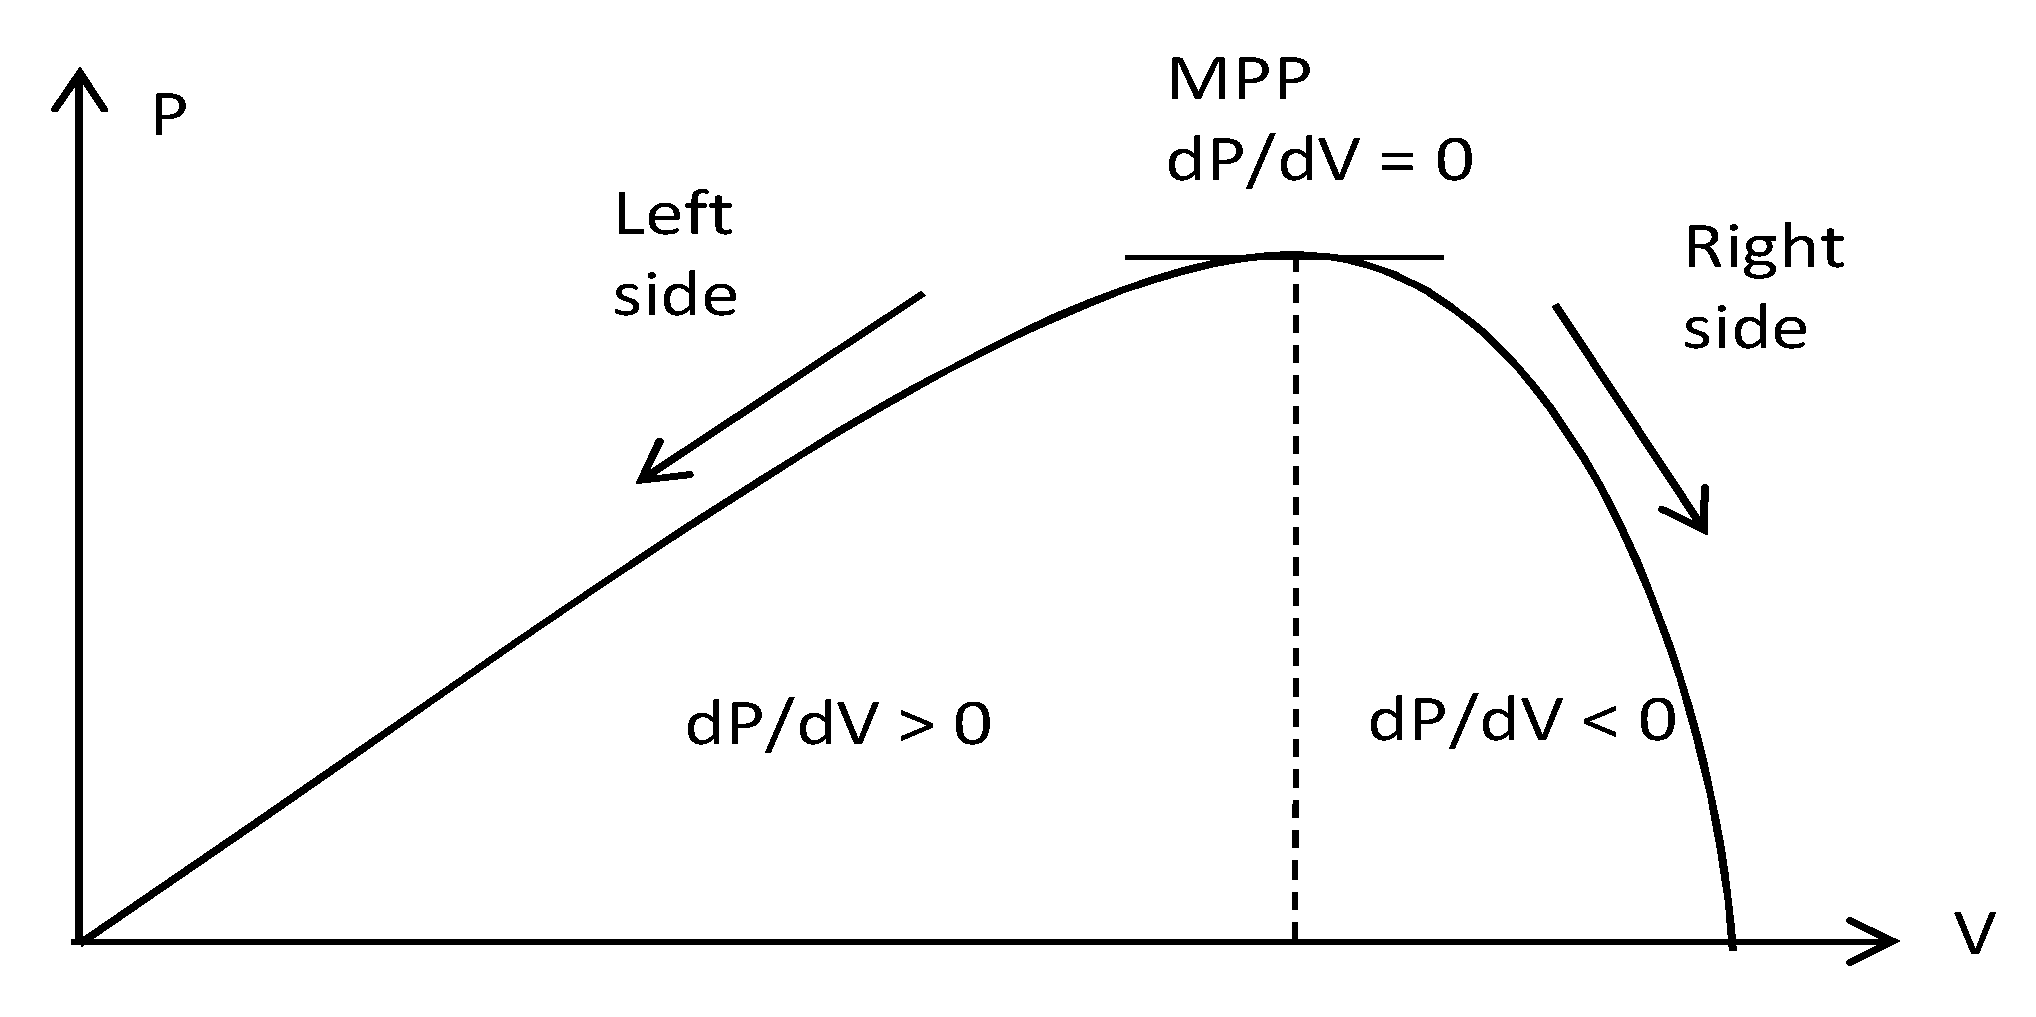
The IC algorithm operates based on the fact that the maximum power point occurs when the ratio of change of power and voltage is equal to zero, as represented by Equation (13) [5]:
d P d V = 0 ,
Substituting P = V I into Equation (13) yields [5]:
d P d V = d ( V I ) d V = d V d V I + V d I d V = 0 ,
Thus, the MPP is reached when the ratio of change in conductance (incremental conductance) is equal to the negative of the instantaneous conductance as described by the following equation [5]:
d I d V = I V ,
As shown in Figure 4, the operating points at the left and right sides are d P d V > 0 and d P d V < 0 , respectively. The operating points of the left and right side of MPP can be described by [5]:
d I d V > I V   at   left   side   of   MPP
d I d V < I V   at   right   side   of   MPP
As a deterministic algorithm, IC has the advantage of fast-tracking performance, but it tends to be trapped in local maxima under PSCs.

3. Proposed Method

3.1. ECGOA with Arithmetic Mean

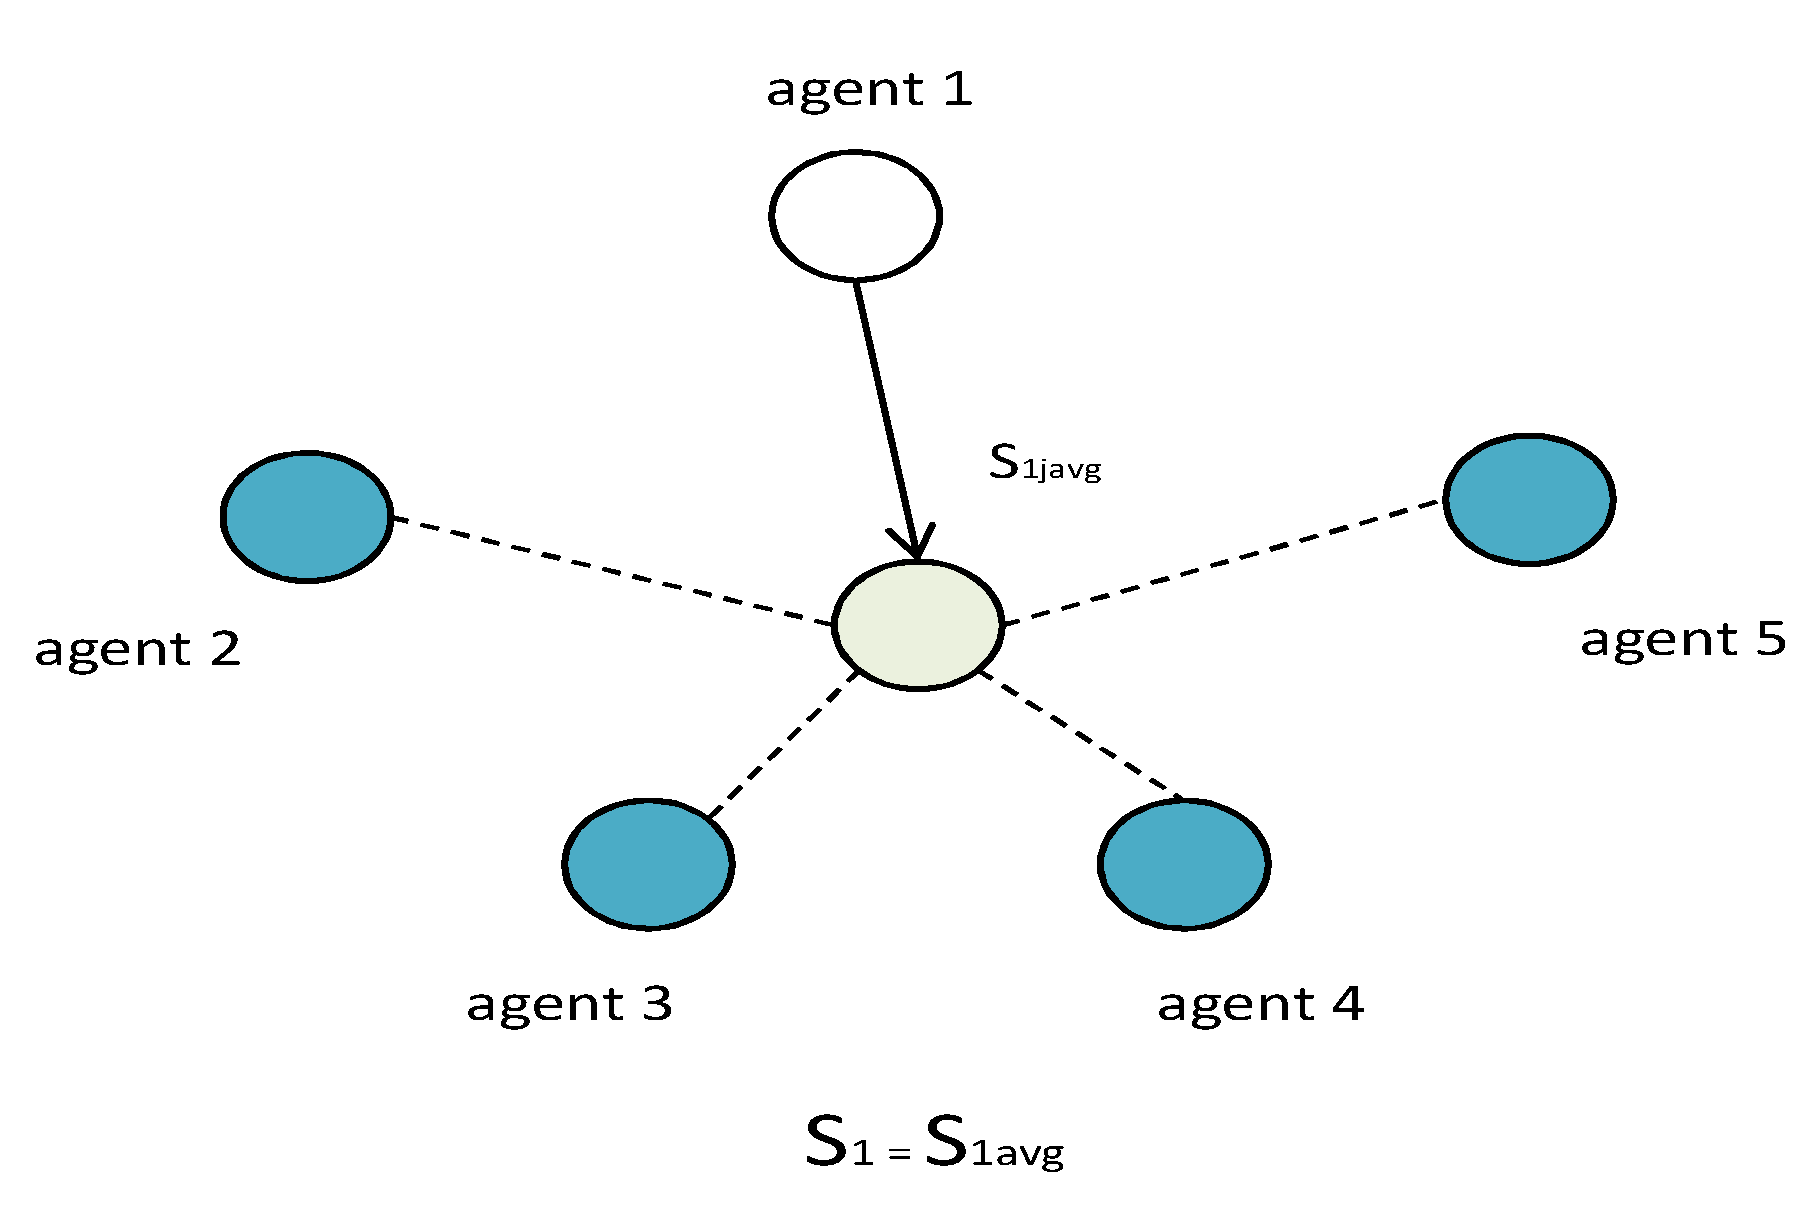
The problem of calculating S i is that each grasshopper must calculate the distance with other individual grasshoppers according to Equation (2). Consequently, we propose to calculate the distance between the position of a grasshopper and the arithmetic mean of the positions of all grasshoppers, as illustrated in Figure 5. Hence, Equation (3) is modified into Equation (18):
S i = s ( d i j a v g ) d ^ i j a v g ,
where d i j a v g is the distance between the i-th grasshopper and the average coordinates of the grasshopper, and d i j a v g = | x j a v g x i | ; d ^ i j a v g is a grasshopper vector unit, and d ^ i j a v g = x j a v g x i d i j a v g . x j a v g is represented by the following equation:
x j a v g = 1 N j = 1 ; j i N x j ,
Finally, Equation (8) is modified into:
x i d = c ( c u b d l b d 2 s ( | x j a v g d x i d | ) x j a v g x i d i j a v g ) + T d ,

3.2. Combination of the ECGOA with Arithmetic Mean and IC

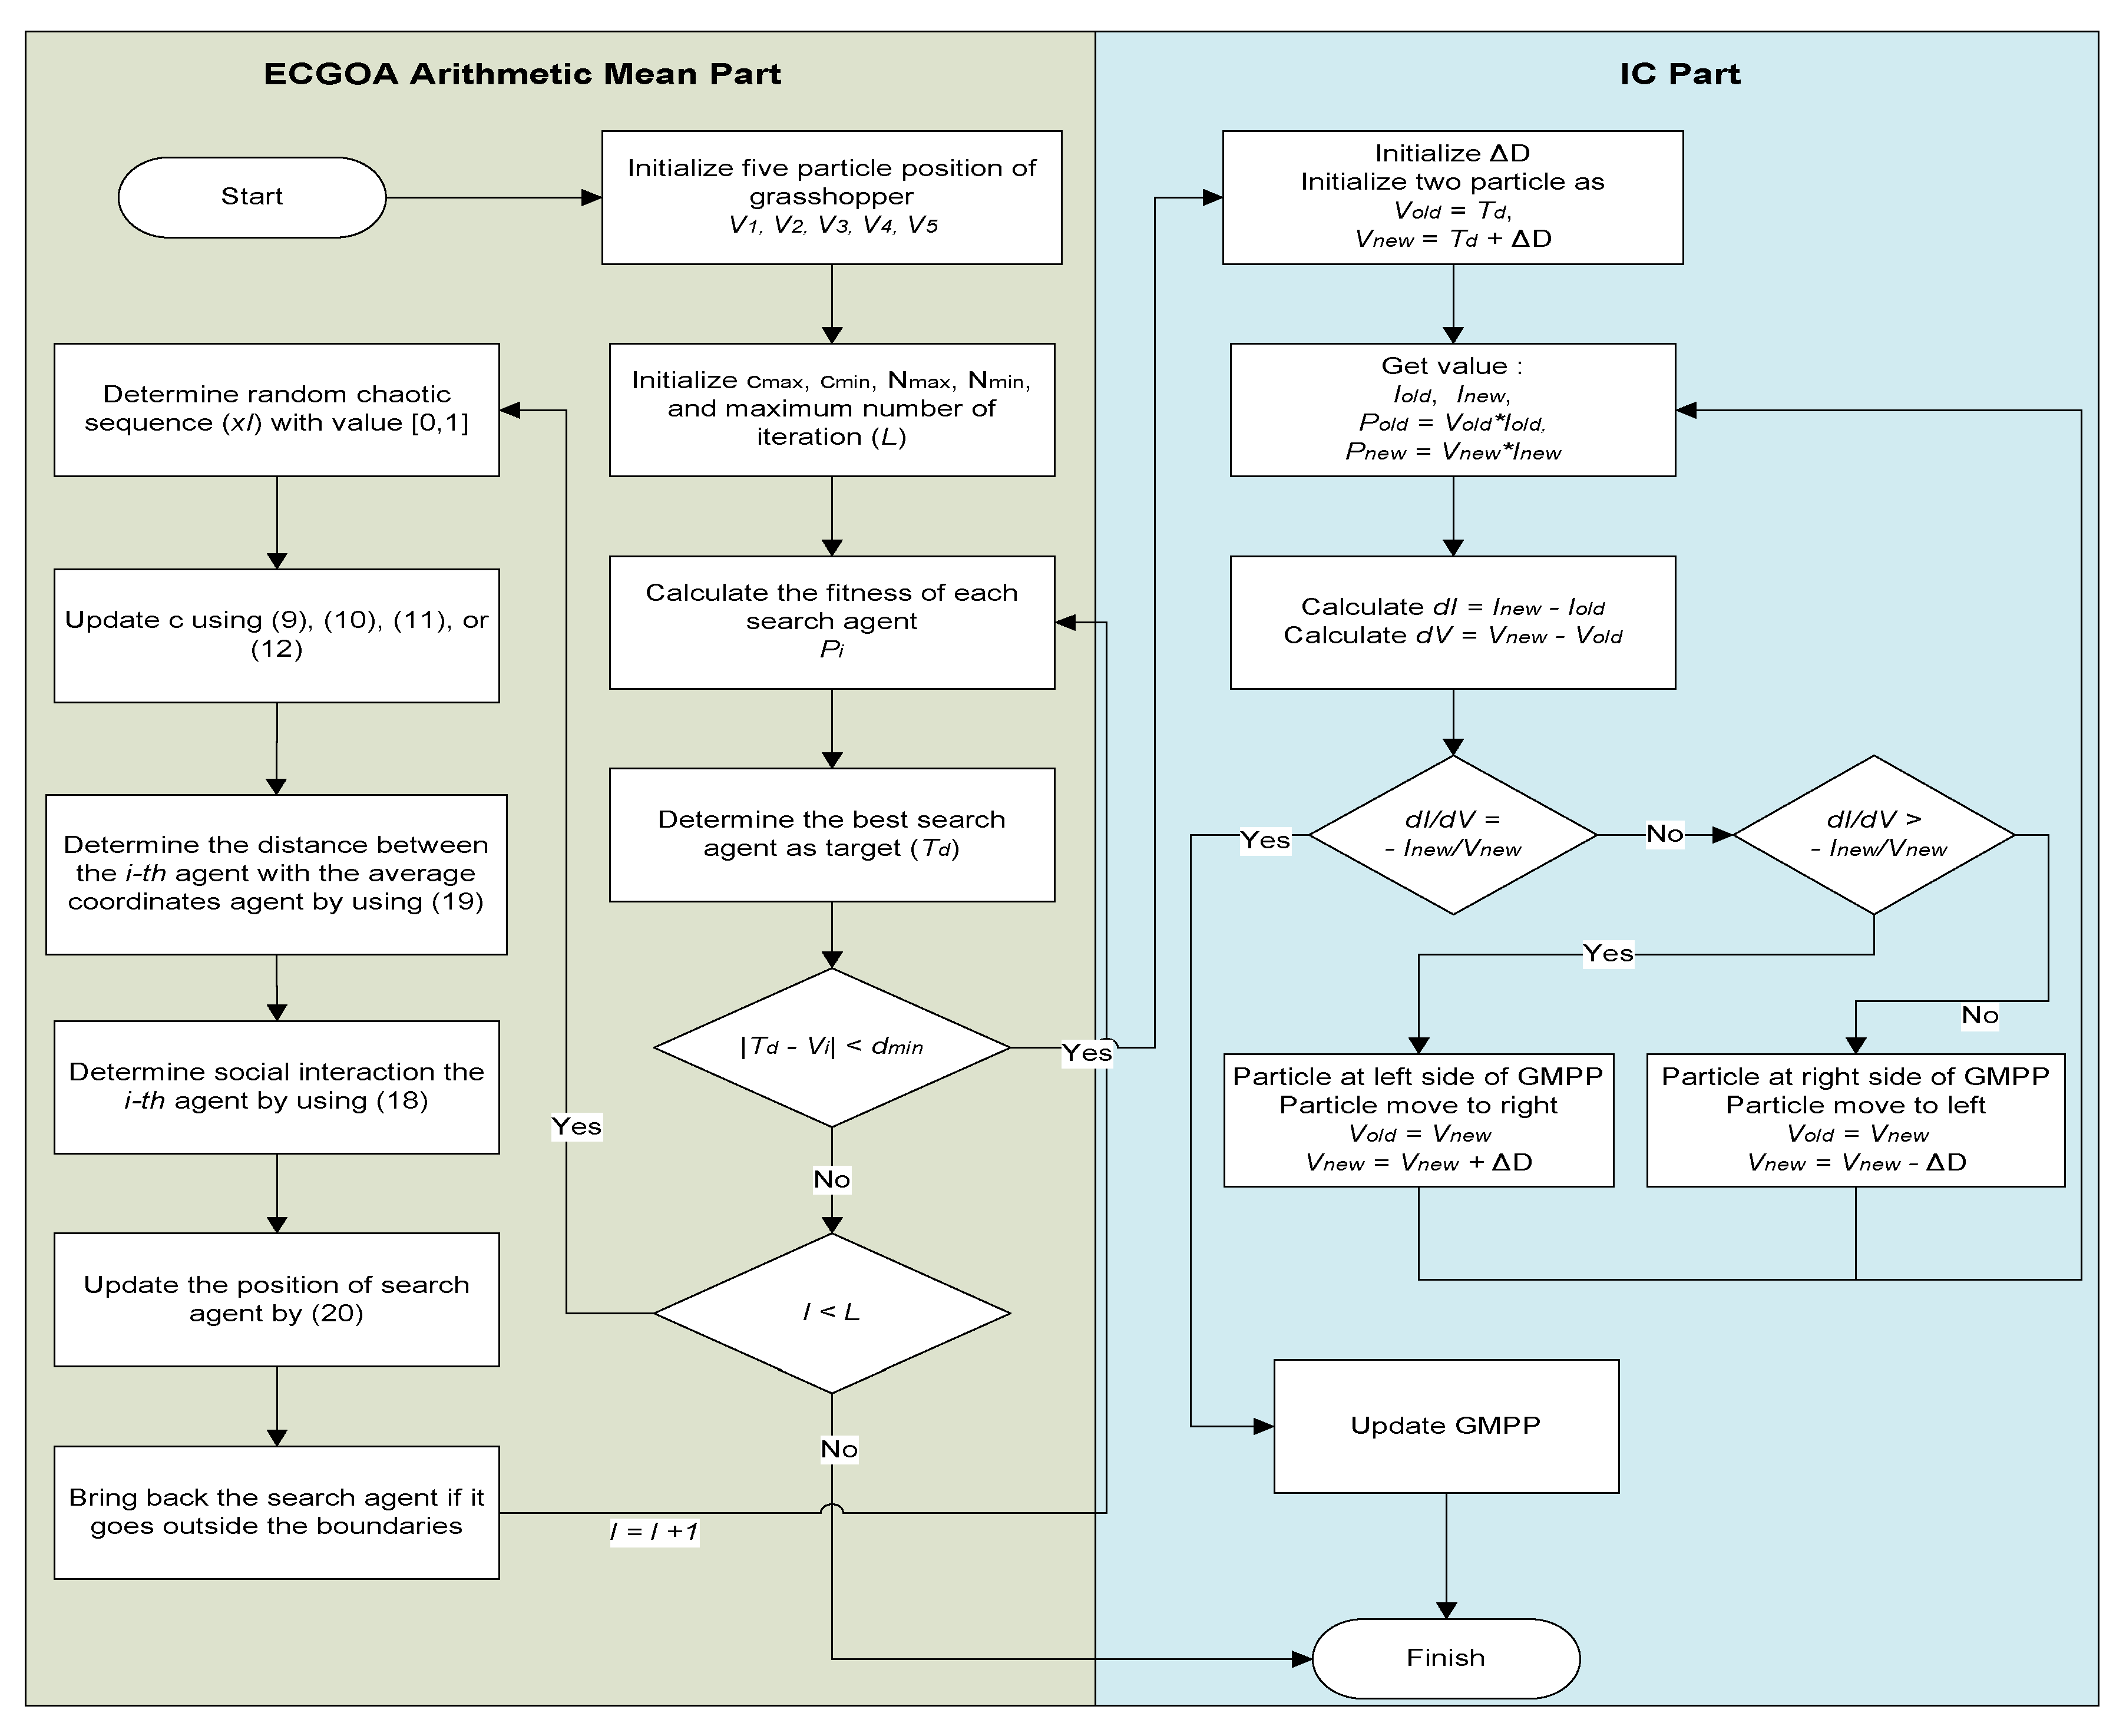
The proposed algorithm combines the proposed modified GOA (i.e., ECGOA with arithmetic mean) and IC to reap the advanced benefits of each algorithm. At the start, ECGOA with arithmetic mean is used to find the correct region of the GMPP position. Then, the algorithm switches to the IC algorithm after the correct region is obtained. The transition from ECGOA with arithmetic mean to the IC algorithm occurs when the position of each searching agent ( V i ) has a distance to the target T d lower than the minimum distance ( d min ) . The flowchart of the proposed method is presented in Figure 6.

3.3. Tracking Example of the Proposed Method

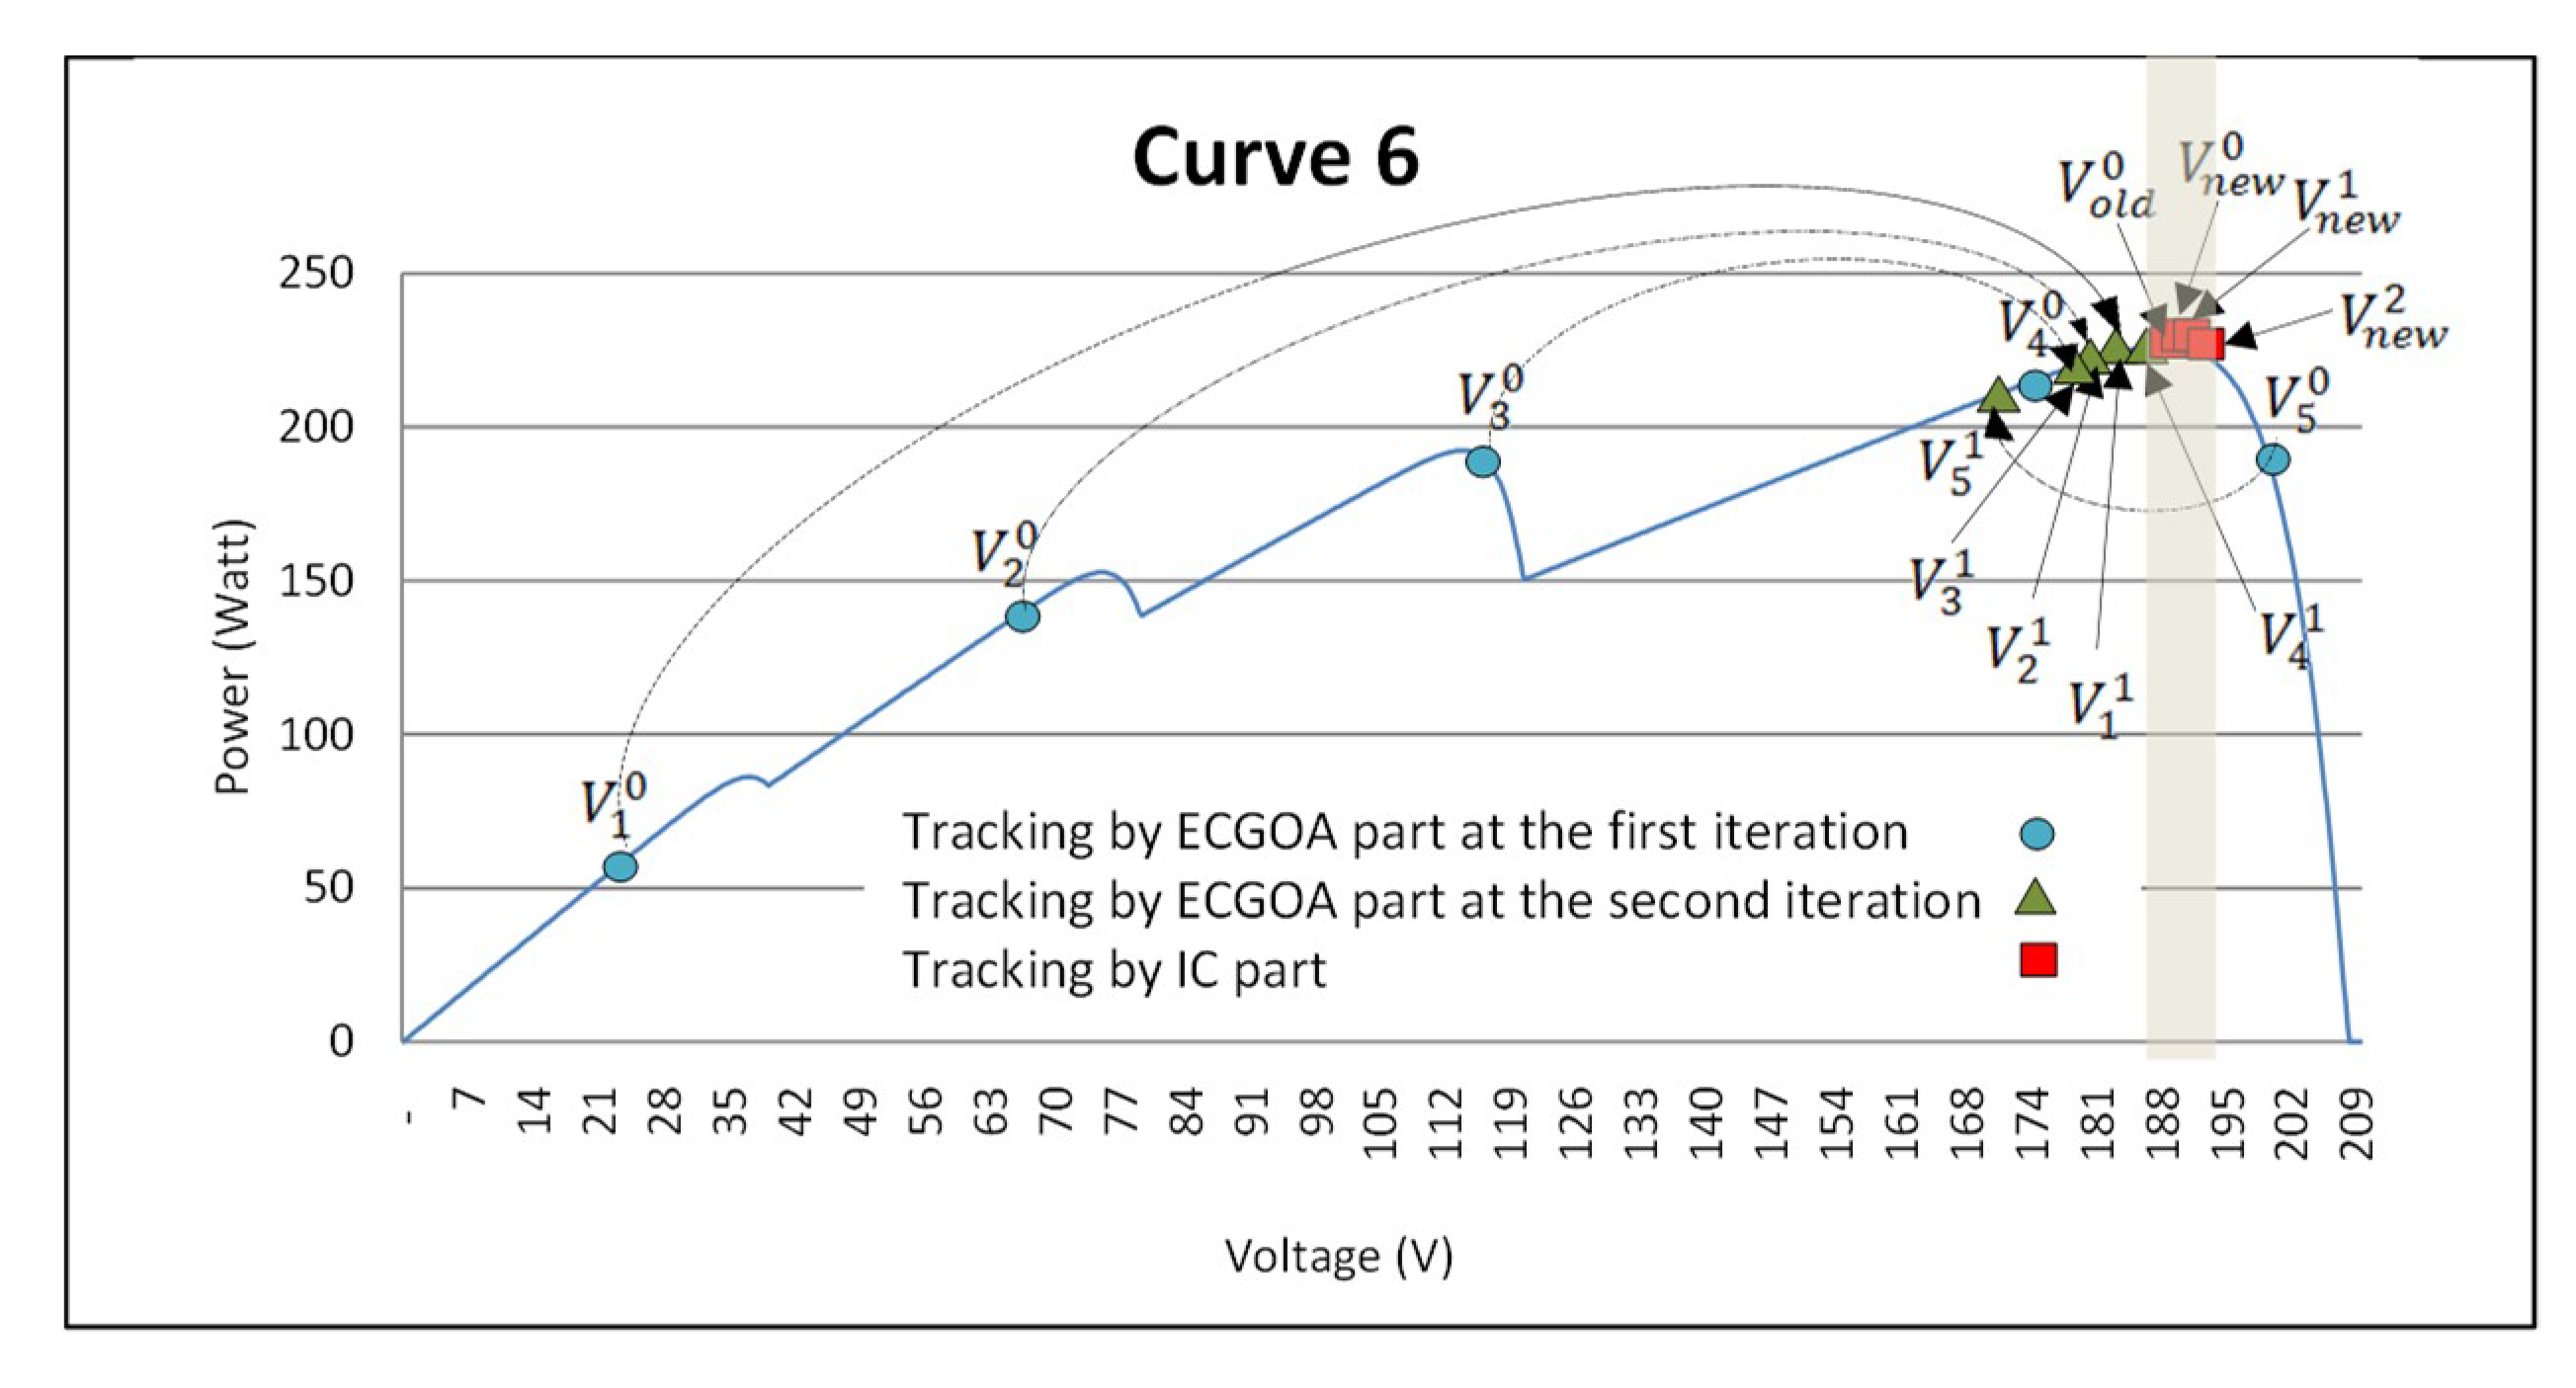
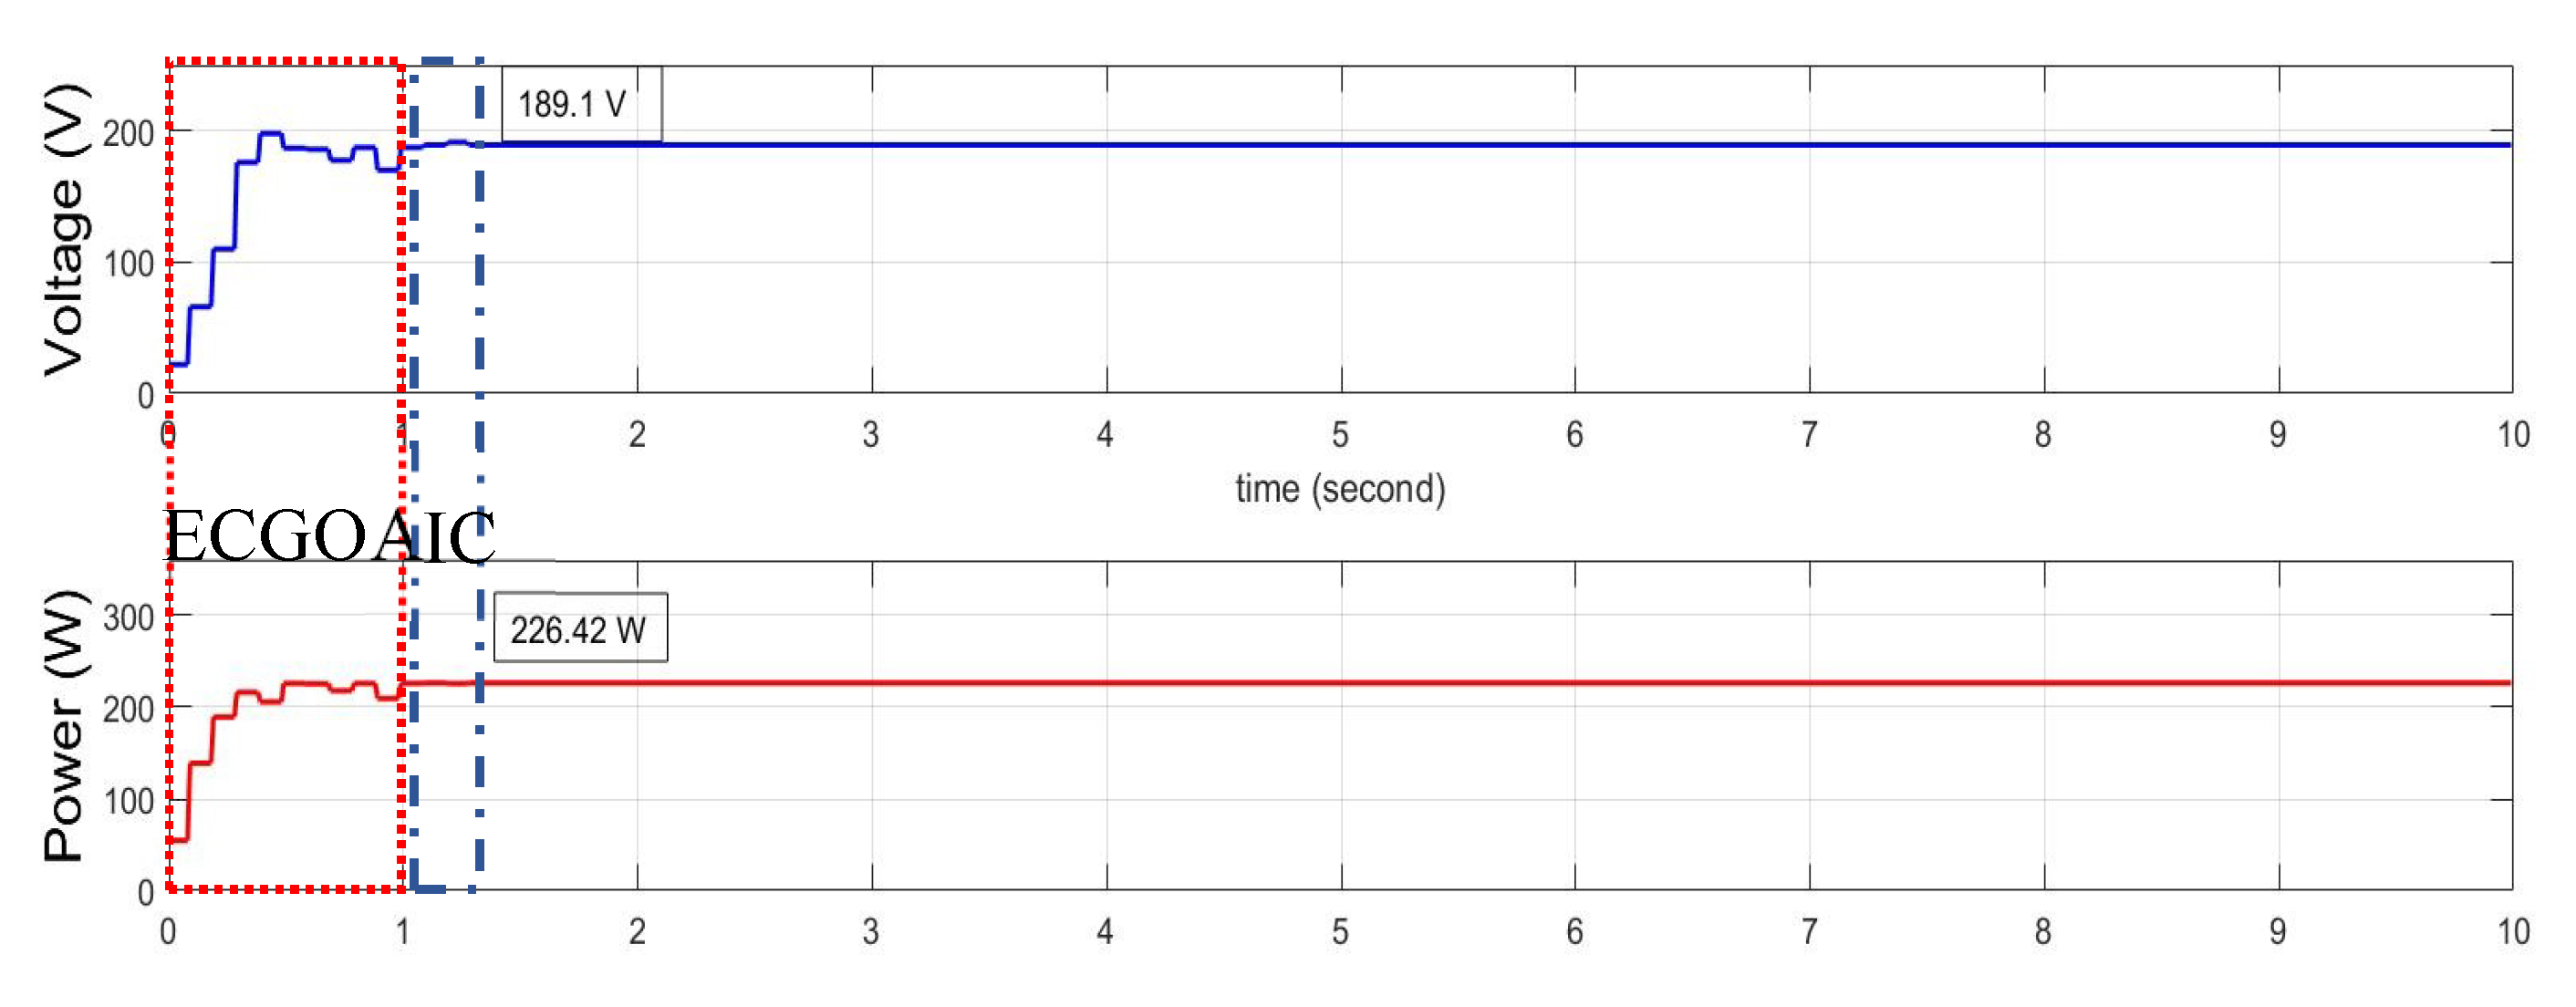
Figure 7 and Figure 8 show a tracking process example from the proposed method which shows the transition between the ECGOA with arithmetic mean and IC. The proposed method is used to track a multiple-peak P-V curve with V G M P P = 189.3 V and G M P P = 226.42 W . Figure 7 depicts how all the particles approach the GMPP. In the initial state, all particles are spread away from each other with an initial value v i 0 . Using the ECGOA with arithmetic mean, the particles start to approach the GMPP. The detailed parameters values for each iteration cycle are summarized in Table 1. At the end of the second iteration, some particles are close enough to GMPP, and all the switching requirements are fulfilled ( T d V i < d min ) . The system then is switched to IC with an initial tracking area marked as the grey region in Figure 7. After the transition, the tracking is continued using the IC and the values of the parameters are listed in Table 2. The tracking area will be shrunk iteratively until the GMPP is found. By using the transition strategy introduced in this work, the meta-heuristic and deterministic MPPT algorithms can be combined successfully.

4. Simulation Result

4.1. Static Case Studies

The experimental setup was carried out to evaluate the effectiveness of the proposed method, PSO, and MFA. The block diagram of the experimental setup is depicted in Figure 9. The main components consist of a PV array emulator, a DC-DC converter, the MPPT controller, a load, and a DC source.
Figure 10 shows the experimental setup. The PV array is implemented by a programmable PV Emulator ETS 600/8, manufactured by AMETEK, which can mimic the output of the PV installation under PSCs. The controller is implemented in a 32-bit digital signal processor (DSP-TMS320F28035). The DC-DC converter topology is an interleaved boost converter, aiming to reduce ripple currents. Its output is connected to a resistive load which is regulated by a programmable DC Voltage Source (Chroma 620120P-600-8).
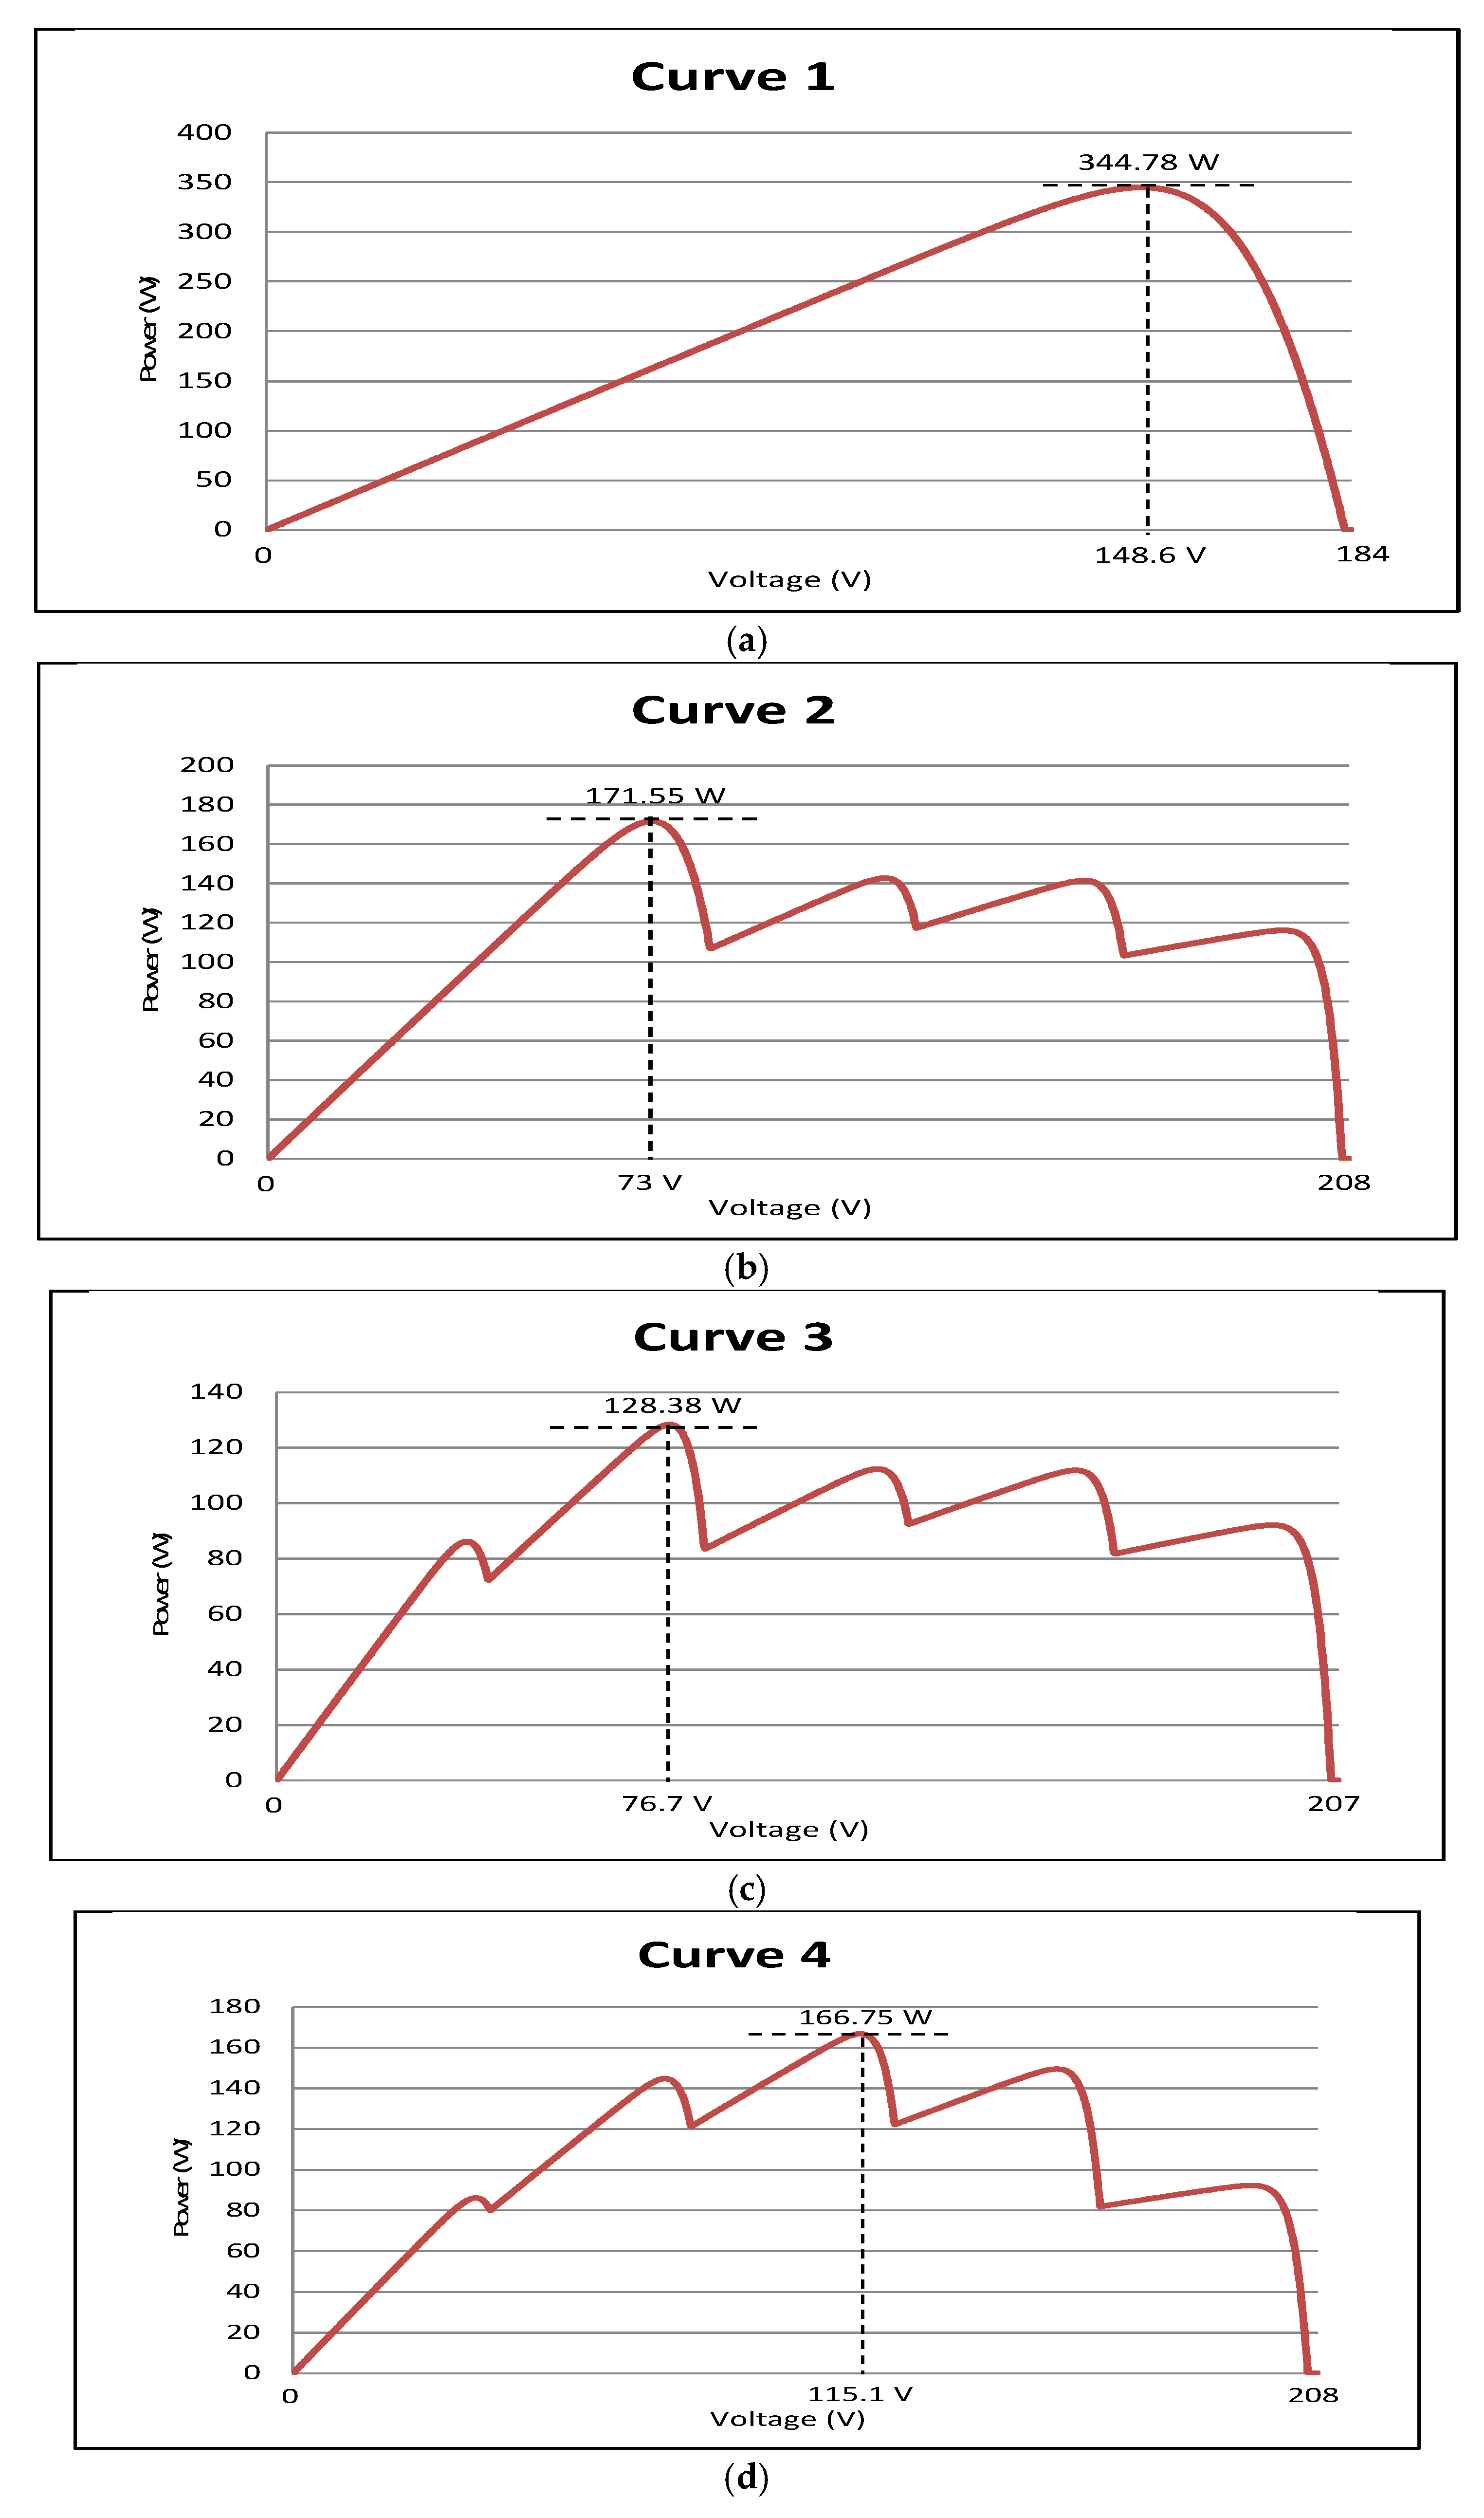
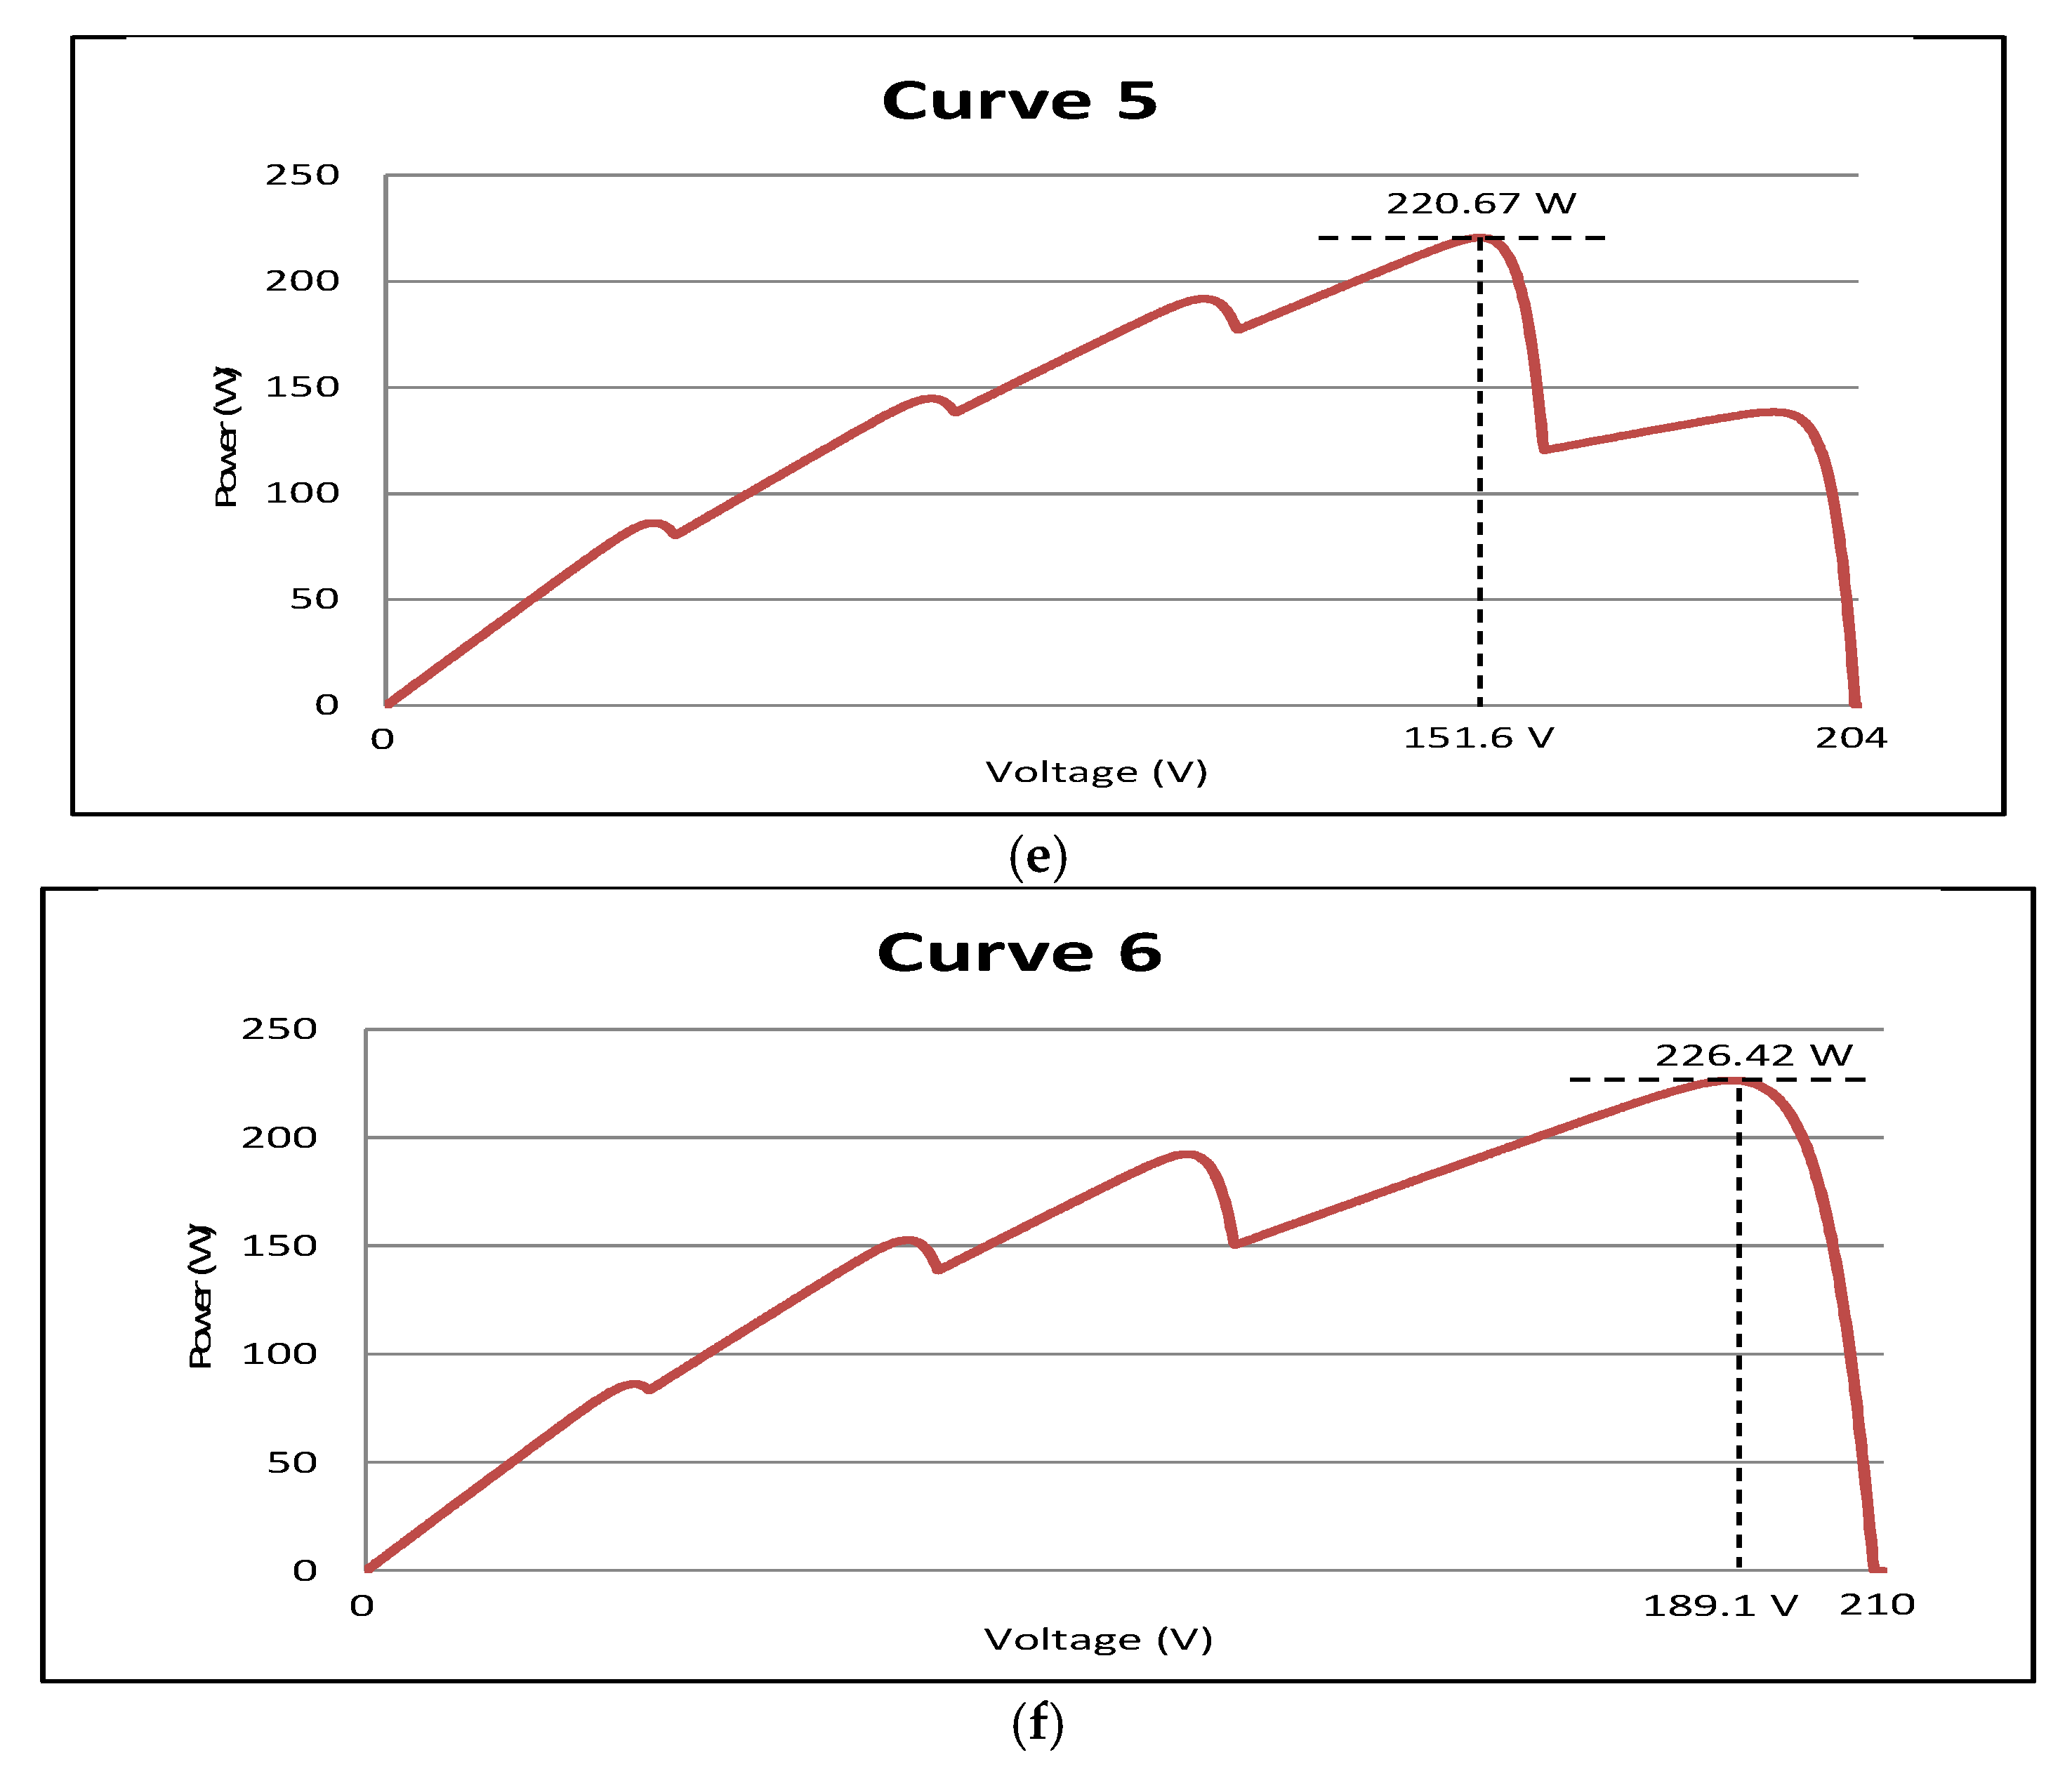
Six different P-V curves with different GMPP, shown in Figure 11a–f, were tested to validate the performance of the proposed method. These P-V curves were obtained from the one-diode model (ODM) [28] with the modeling characteristic curve arranged in series. The effect of partial shading was caused by different irradiance values in each cell, resulting in P-V curves with multiple peaks.
To find the GMPPs on all curves, we compared the proposed method with the PSO algorithm and MFA. All these algorithms were evaluated in terms of tracking times and tracking efficiencies. Tracking time evaluation reveals the speed of the algorithm in finding GMPP. The tracking efficiency evaluation indicates the effectiveness of the algorithm for obtaining GMPP compared to an ideal GMPP.
The number of particles or agents assigned for each algorithm was five. The number of particles or agents has to be carefully selected in order to satisfy the accuracy and computational time. All their initial positions were assigned as 10%, 30%, 50%, 70%, and 90% of the open-circuit voltage.
The parameters for PSO were taken from [29], which have been validated for the best performance for a five-particle system, while the MFA parameters were extracted from [19]. Table 3 lists the values of the parameter used in all methods.
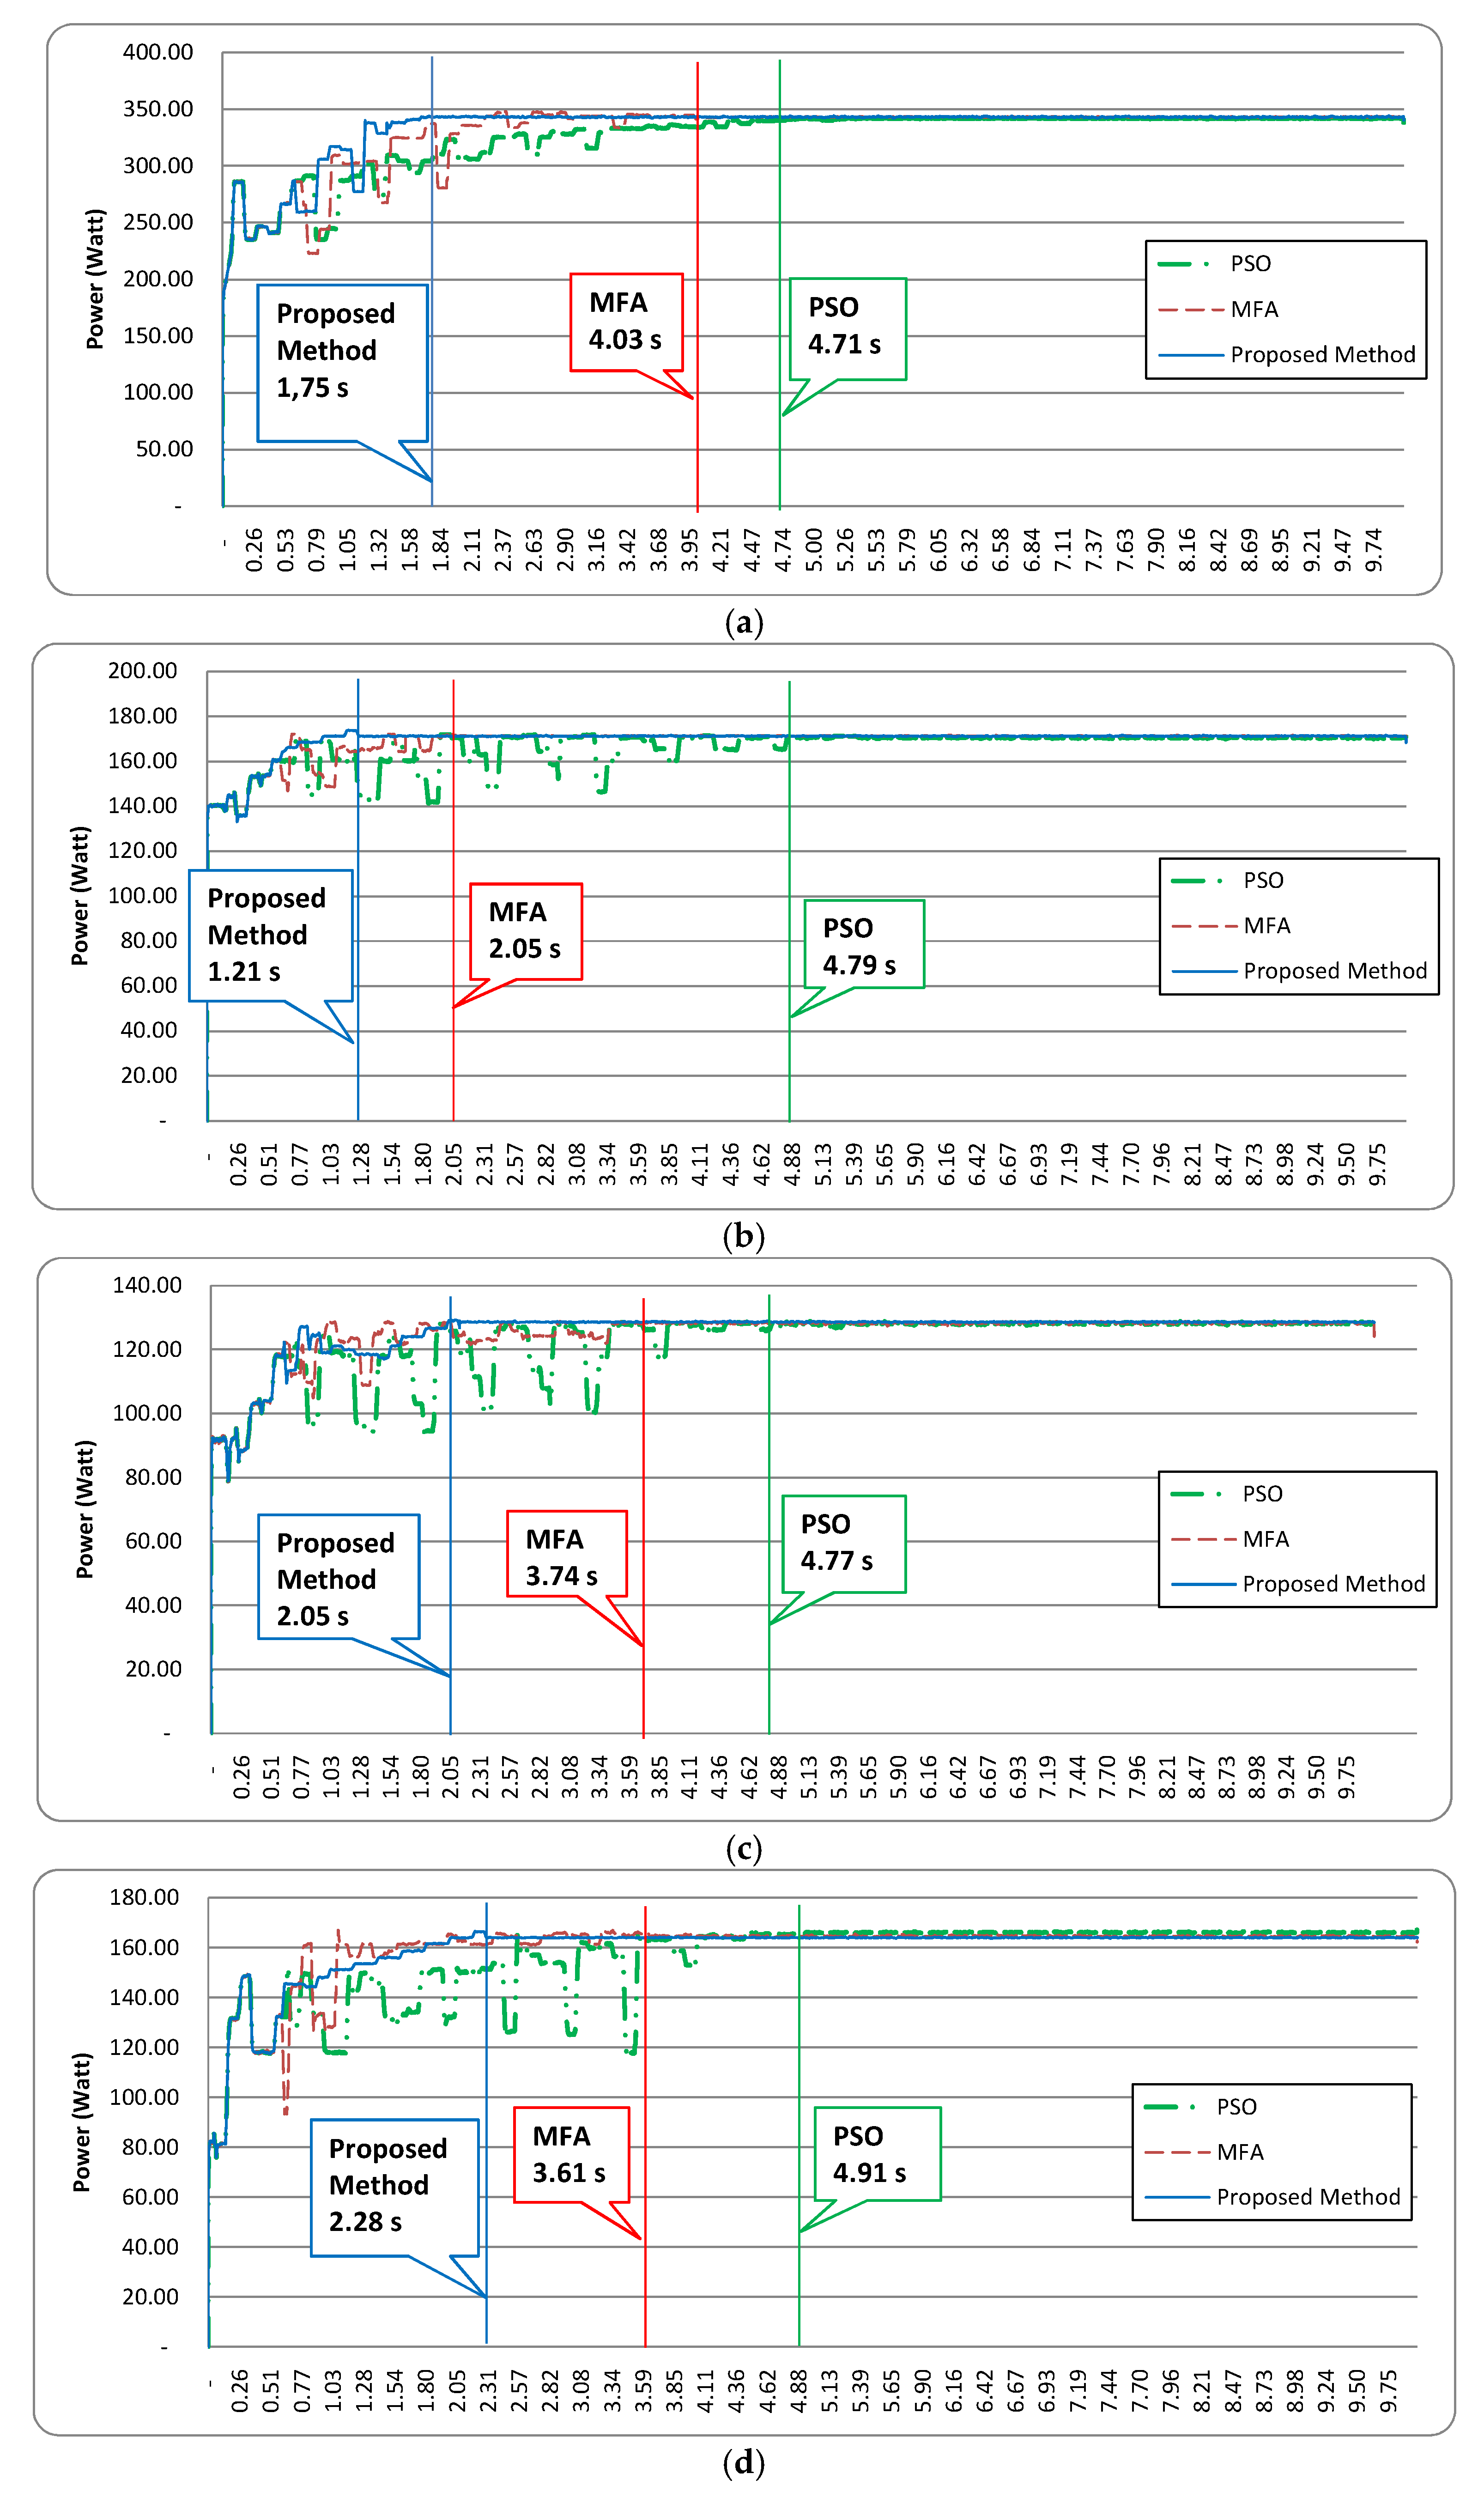
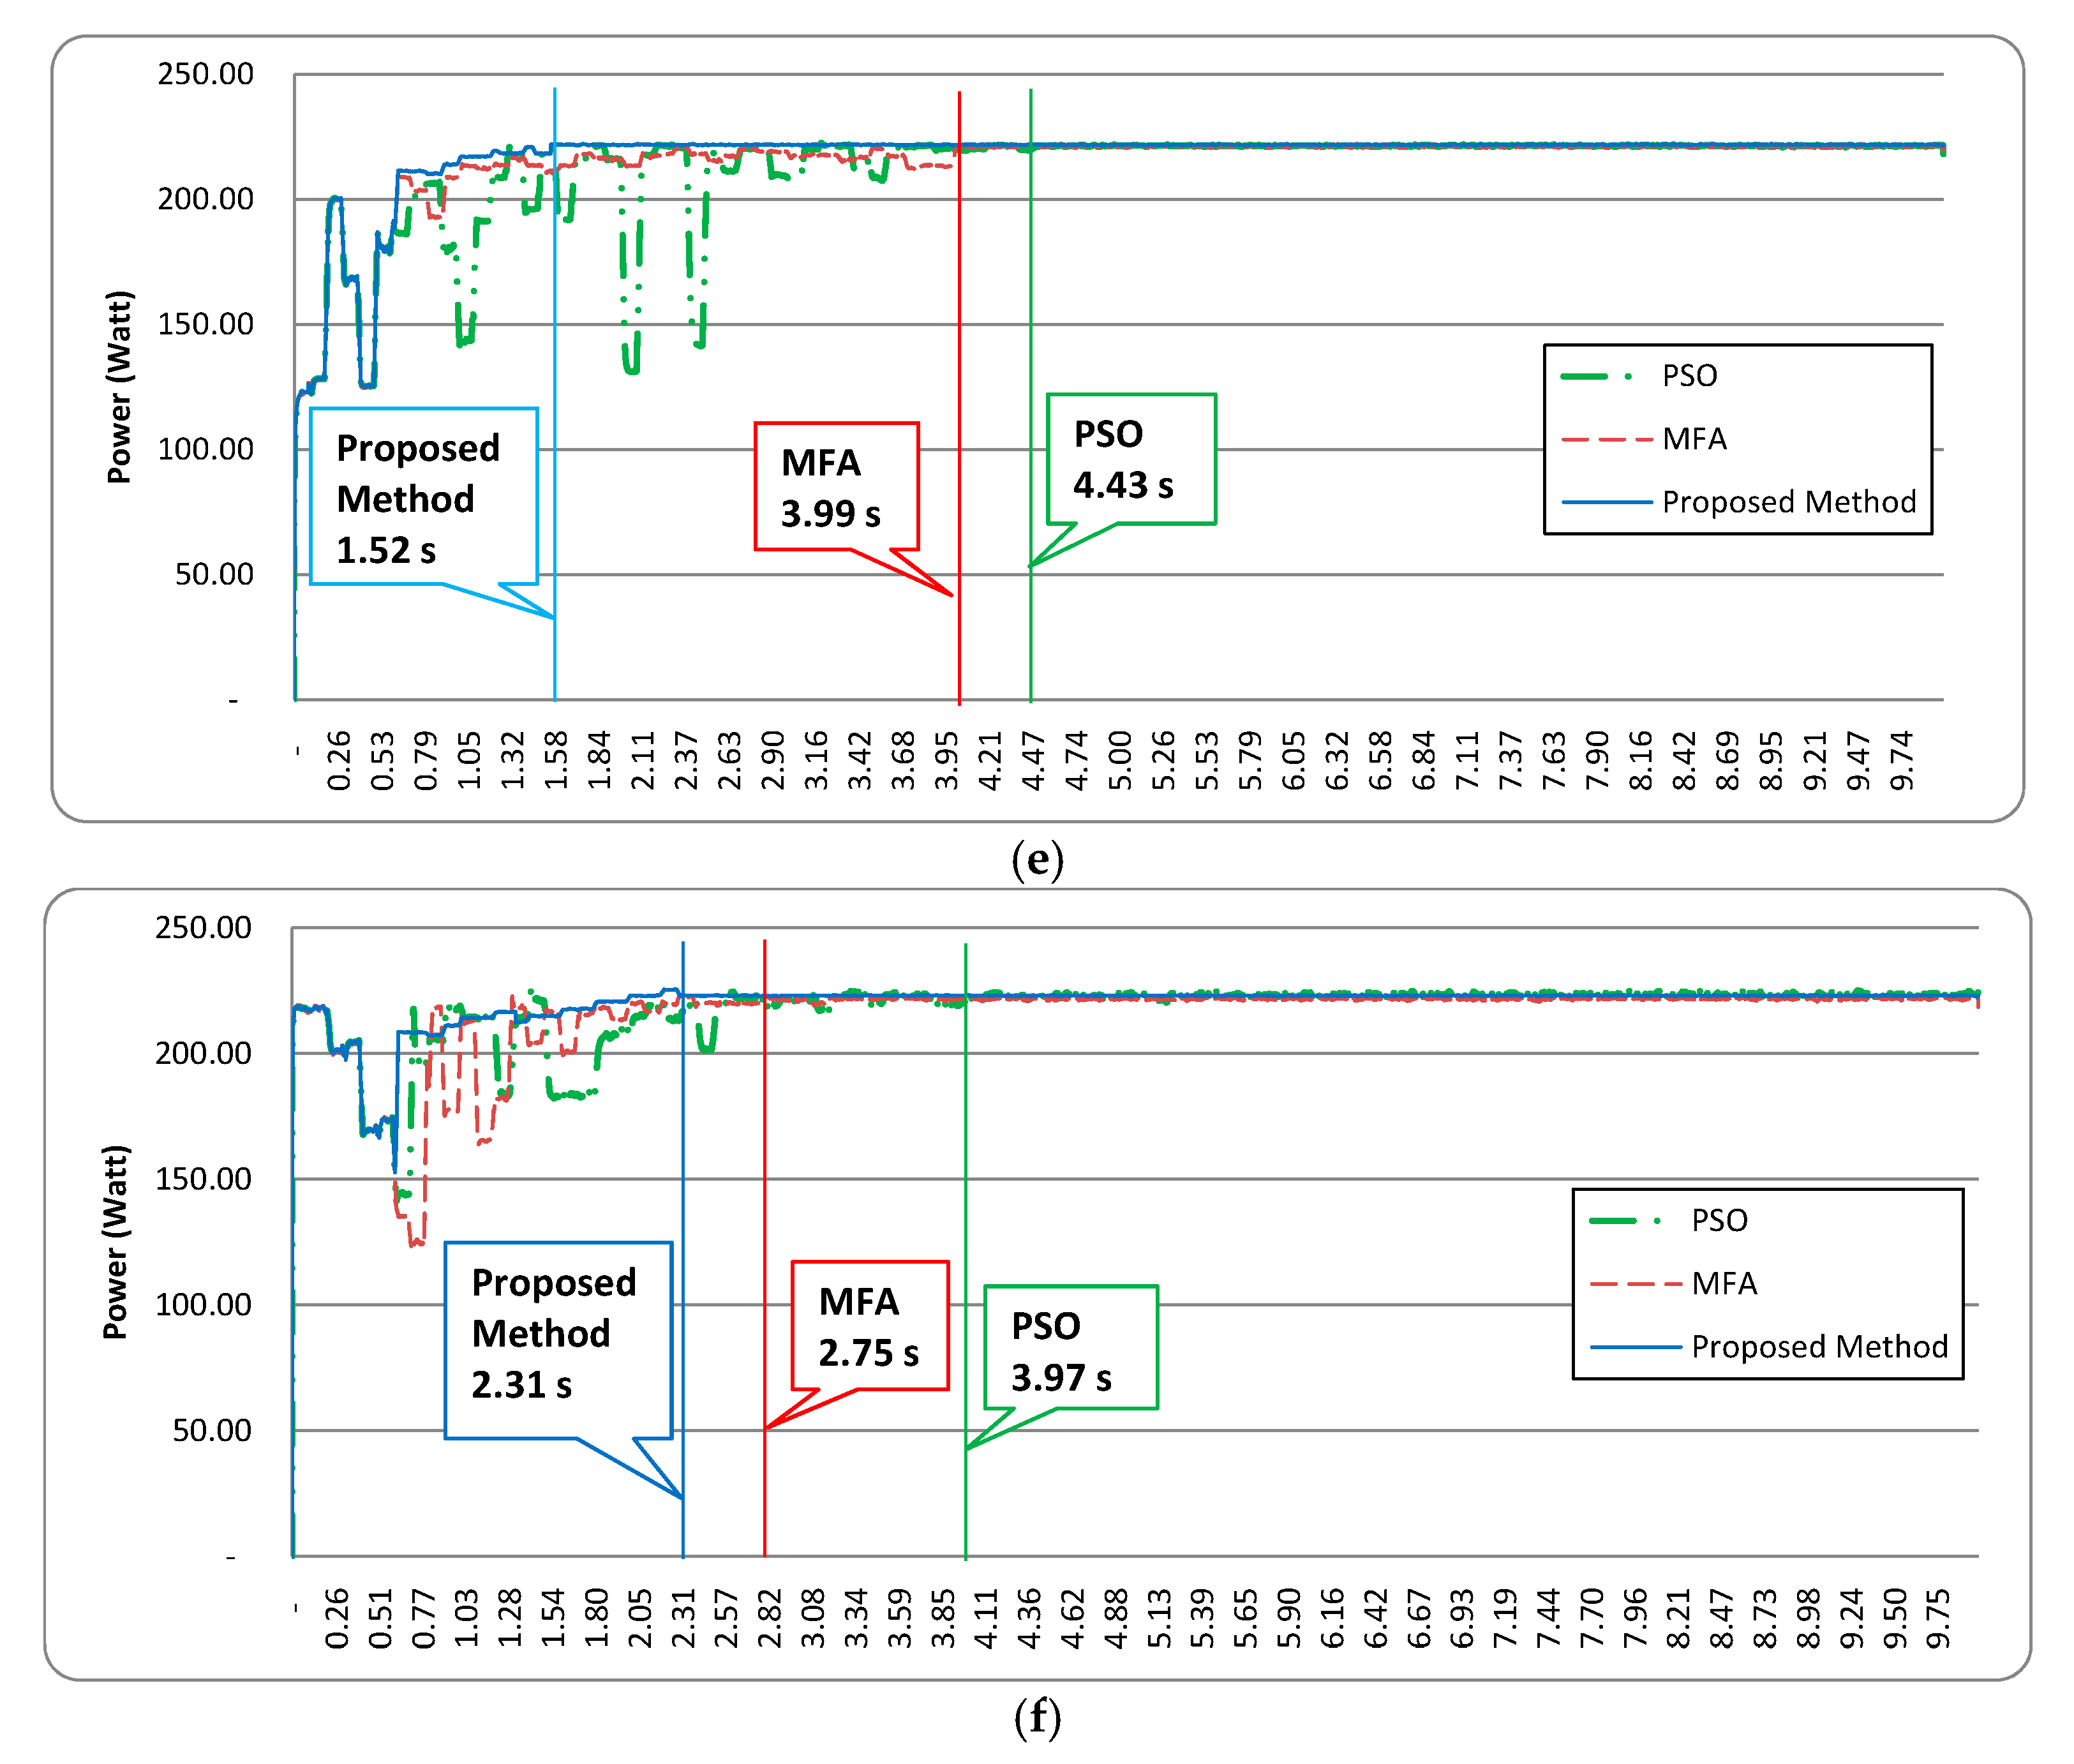
Figure 12a–f show the power tracking trajectories of the all methods. The tracking times are also indicated in the figure. It can be seen that the proposed method takes the shortest time to attain the GMPP. This is followed by MFA and PSO. Moreover, both the proposed method and MFA exhibit small power fluctuations whereas PSO yields the worst power variations during the tracking process.
Finally, since all three algorithms are meta-heuristic methods, they are run multiple times to obtain the statistical results. Table 4 and Table 5 show the average tracking efficiencies and times with standard deviations for all static cases. From these tables, it is clear that all methods yield tracking efficiencies above 99%. Nevertheless, the averaged tracking efficiencies for all cases of the proposed method are the highest. Moreover, the standard deviations are also the smallest.
In terms of tracking time, there are significant differences between these three methods, which are listed as follows:
  • In curve 1, the proposed method is 3.96% faster than MFA and 16.02% faster than PSO
  • In curve 2, the proposed method is 45.55% faster than MFA and 61.36% faster than PSO
  • In curve 3, the proposed method is 47.28% faster than MFA and 63.58% faster than PSO
  • In curve 4, the proposed method is 17.59% faster than MFA and 50.31% faster than PSO
  • In curve 5, the proposed method is 20.30% faster than MFA and 32.91% faster than PSO
  • In curve 6, the proposed method is 44.67% faster than MFA and 59.71% faster than PSO
Consequently, the proposed method can significantly improve the convergence time for attaining the GMPP.

4.2. Dynamic Case Studies

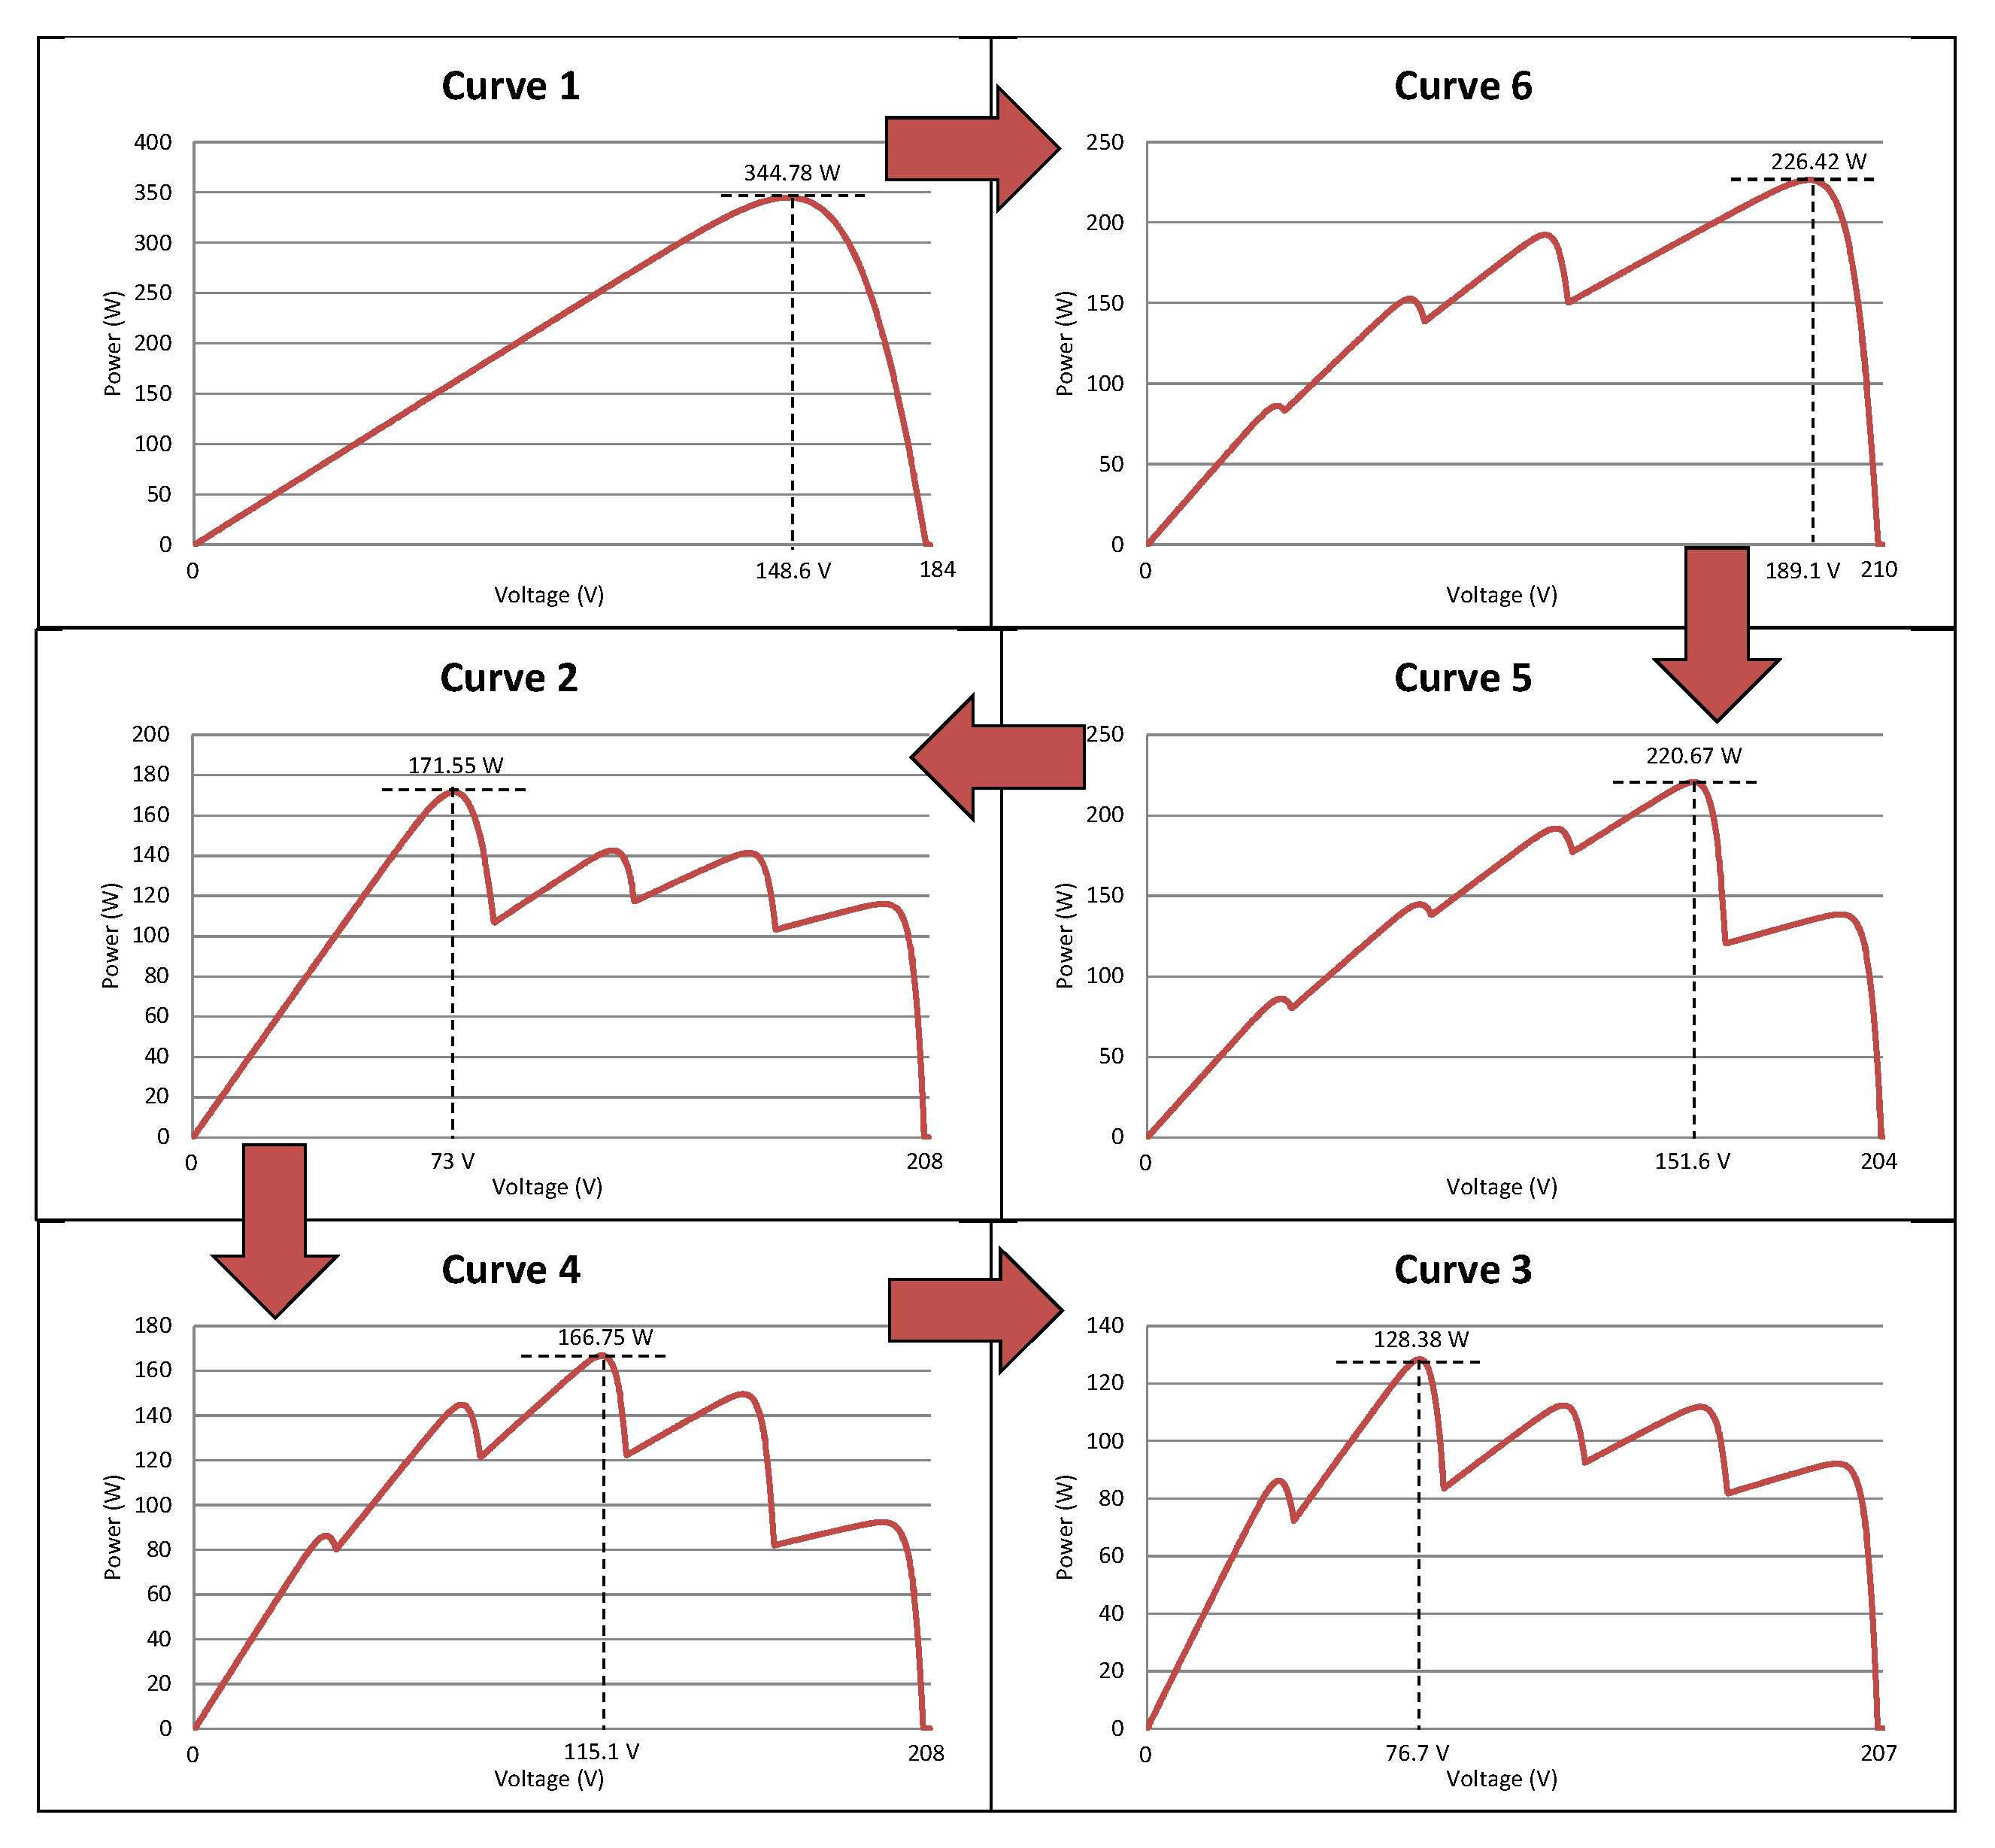
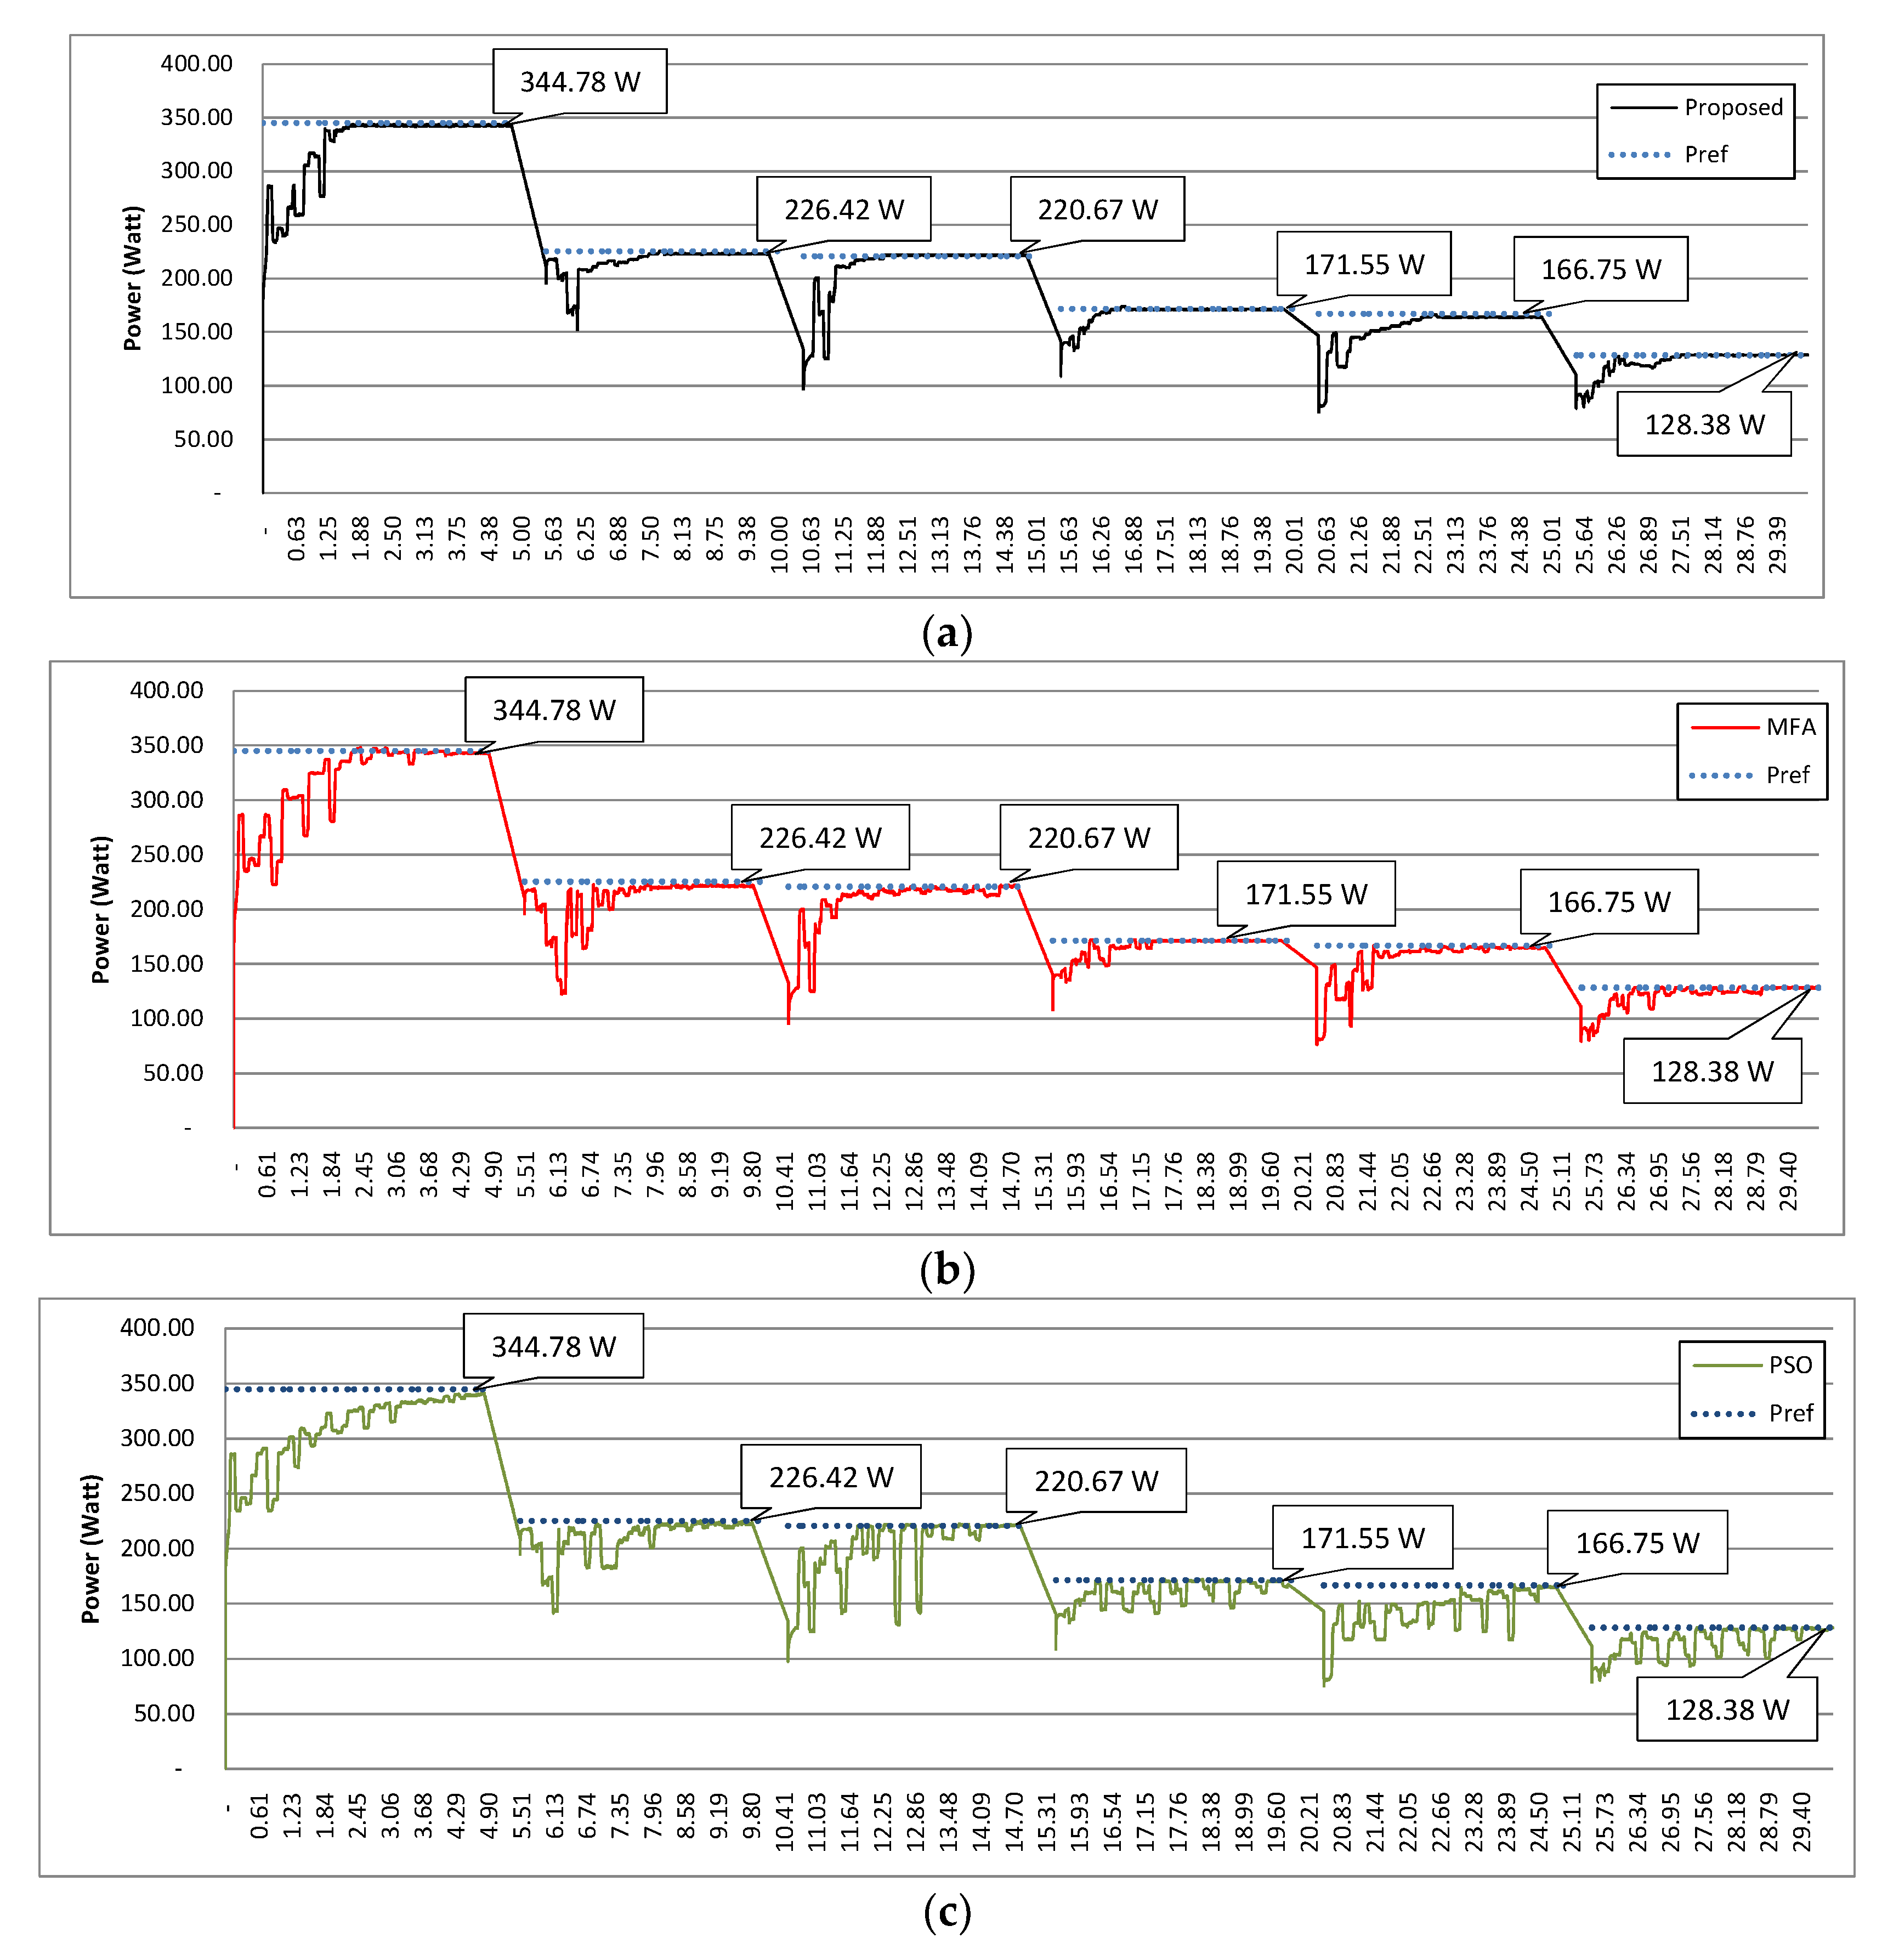
In this case, the continuous dynamic tracking capability was tested for the proposed method. The range of power level was made varied, starting from 344.78 W (uniform PV curve, i.e., Curve 1) to 128.38 W (curve 3). The shaded pattern changing sequence is shown in Figure 13, where the change in the shaded pattern shows the change in system irradiance level every 5 s. This scenario illustrates the dynamic performance when the level of ( P p v ) changes from high to low. To achieve this scenario, the following constraint was used to detect whether the GMPP has changed:
| P G M P P P G M P P , l a s t | P G M P P , l a s t Δ P ( % ) ,
where P G M P P , l a s t is the GMPP power at the previous operating point. Δ P is set at 5%. If such a condition is met, the MPPT algorithm will re-initiate the searching agent to find a new GMPP.
Figure 14a–c shows the power trajectories for the proposed method, MFA, and PSO when tracking the shaded patterns in Figure 13. One may observe that, similar to the static cases, the proposed method takes the least time to settle to the steady-state when tracking different power levels. Moreover, the proposed method yields the least power fluctuations during transients. The dynamic tracking efficiency, η d , is defined in Equation (22):
η d = i V p v , i I p v , i Δ T i j G M P P t h , j Δ T j × 100 % ,
where Δ T i is the period when V p v , i and I p v , i are sampled using the MPPT algorithm. Δ T j is the period when G M P P t h , j is ideally obtained. Consequently, the sooner the algorithm reaches the GMPP for each shaded case and the smaller the power variations, the higher the value of η d . Table 6 lists the values of η d for Figure 14. It can be clearly seen that the proposed method has the highest efficiency among all methods.

5. Conclusions

This paper proposes a hybrid algorithm that combines the proposed modified GOA and the well-known IC method for maximum power point tracking for a photovoltaic system. Experimental results show that this algorithm has the fastest tracking time and highest efficiency compared to some of the state-of-the-art MPPT algorithms, such as MFA and PSO.

Author Contributions

The research was carried out successfully with contribution from all authors. The main research idea, case scenario studies, and the design of experimental setup were contributed by K.L.L. B.H.W. contributed to the implementation of simulation and experiment, and the analysis of these data. R.K.S. partially contributed to the implementation of the experiment and simulation. B.H.W., R.K.S., and K.L.L. have mainly contributed to the preparation of the manuscript. N.H. provides advice and feedback regarding this work. All authors have read and agreed to the published version of the manuscript.

Funding

This work was supported in part by the Ministry of Science and Technology (MOST), Taiwan, under Grant MOST 109-3116-F-006-019-CC1, and in part by the Taiwan Building Technology Center from the Featured Areas Research Center Program within the framework of the Higher Education Sprout Project by the Ministry of Education in Taiwan.

Acknowledgments

The author would like to sincerely thank the editor and anonymous reviewers for their valuable comments and suggestions, improving the quality of the article.

Conflicts of Interest

The authors declare no conflict of interest.

References

  1. Du, E.; Zhang, N.; Hodge, B.M.; Wang, Q.; Kang, C.; Kroposki, B.; Xia, Q. The Role of Concentrating Solar Power toward High Renewable Energy Penetrated Power Systems. IEEE Trans. Power Syst. 2018, 33, 6630–6641. [Google Scholar] [CrossRef]
  2. Kannan, N.; Vakeesan, D. Solar energy for future world: A review. Renew. Sustain. Energy Rev. 2016, 62, 1092–1105. [Google Scholar] [CrossRef]
  3. Romero-Cadaval, E.; Spagnuolo, G.; Franquelo, L.G.; Ramos-Paja, C.A.; Suntio, T.; Xiao, W.M. Grid-Connected Photovoltaic Generation Plants: Components and Operation. IEEE Ind. Electron. Mag. 2013, 7, 6–20. [Google Scholar] [CrossRef] [Green Version]
  4. Jiang, R.; Han, Y.; Zhang, S. Wide-range, high-precision and low-complexity MPPT circuit based on perturb and observe algorithm. Electron. Lett. 2017, 53, 1141–1142. [Google Scholar] [CrossRef]
  5. Hsieh, G.; Hsieh, H.; Tsai, C.; Wang, C. Photovoltaic Power-Increment-Aided Incremental-Conductance MPPT With Two-Phased Tracking. IEEE Trans. Power Electron. 2013, 28, 2895–2911. [Google Scholar] [CrossRef]
  6. Shao, R.; Wei, R.; Chang, L. A Multi-stage MPPT Algorithm for PV Systems Based on Golden Section Search Method. In Proceedings of the 2014 IEEE Applied Power Electronics Conference and Exposition—APEC, Fort Worth, TX, USA, 16–20 March 2014; pp. 676–683. [Google Scholar]
  7. Lavado Villa, L.F.; Ho, T.; Crébier, J.; Raison, B. A Power Electronics Equalizer Application for Partially Shaded Photovoltaic Modules. IEEE Trans. Ind. Electron. 2013, 60, 1179–1190. [Google Scholar] [CrossRef]
  8. Abdalla, I.; Corda, J.; Zhang, L. Multilevel DC-Link Inverter and Control Algorithm to Overcome the PV Partial Shading. IEEE Trans. Power Electron. 2013, 28, 14–18. [Google Scholar] [CrossRef]
  9. Femia, N.; Lisi, G.; Petrone, G.; Spagnuolo, G.; Vitelli, M. Distributed maximum power point tracking of photovoltaic arrays: Novel approach and system analysis. IEEE Trans. Ind. Electron. 2008, 55, 2610–2621. [Google Scholar] [CrossRef] [Green Version]
  10. Liu, Y.; Pang, Z.; Cheng, Z. Research on an adaptive solar photovoltaic array using shading degree model-based reconfiguration algorithm. In Proceedings of the 2010 Chinese Control and Decision Conference, Xuzhou, China, 26–28 May 2010; pp. 2356–2360. [Google Scholar]
  11. Ramana, V.V.; Jena, D. Maximum power point tracking of PV array under non-uniform irradiance using artificial neural network. In Proceedings of the 2015 IEEE International Conference on Signal Processing, Informatics, Communication and Energy Systems (SPICES), Calicut, India, 19–21 February 2015; pp. 1–5. [Google Scholar]
  12. Biabani, M.A.K.A.; Ahmed, F. Maximum power point tracking of photovoltaic panels using perturbation and observation method and fuzzy logic control based method. In Proceedings of the 2016 International Conference on Electrical, Electronics, and Optimization Techniques (ICEEOT), Tamil Nadu, India, 3–5 March 2016; pp. 1614–1620. [Google Scholar]
  13. Korodi, A. Building a Knowledge base to obtain the maximum power point for a PV panel. In Proceedings of the 2012 IEEE International Conference on Control Applications, Zhangjiajie, China, 25–27 March 2012; pp. 1098–1103. [Google Scholar]
  14. Chen, L.-R.; Tsai, C.-H.; Lin, Y.-L.; Lai, Y.-S. A biological swarm chasing algorithm for tracking the PV maximum power point. IEEE Trans. Energy Convers. 2010, 25, 484–493. [Google Scholar] [CrossRef]
  15. Miyatake, M.; Veerachary, M.; Toriumi, F.; Fujii, N.; Ko, H. Maximum power point tracking of multiple photovoltaic arrays: A PSO approach. IEEE Trans. Aerosp. Electron. Syst. 2011, 47, 367–380. [Google Scholar] [CrossRef]
  16. Titri, S.; Larbes, C.; Toumi, K.Y.; Benatchba, K. A new MPPT controller based on the Ant colony optimization algorithm for Photovoltaic systems under partial shading conditions. Appl. Soft Comput. 2017, 58, 465–479. [Google Scholar] [CrossRef]
  17. Ahmed, J.; Salam, Z. A Maximum Power Point Tracking (MPPT) for PV system using Cuckoo Search with partial shading capability. Appl. Energy 2014, 119, 118–130. [Google Scholar] [CrossRef]
  18. Sundareswaran, K.; Peddapati, S.; Palani, S. MPPT of PV systems under partial shaded conditions through a colony of flashing fireflies. IEEE Trans. Energy Convers. 2014, 29, 463–472. [Google Scholar]
  19. Teshome, D.F.; Lee, C.H.; Lin, Y.W.; Lian, K.L. A Modified Firefly Algorithm for Photovoltaic Maximum Power Point Tracking Control Under Partial Shading. IEEE J. Emerg. Sel. Top. Power Electron. 2017, 5, 661–671. [Google Scholar] [CrossRef]
  20. Tey, K.S.; Mekhilef, S.; Seyedmahmoudian, M. Implementation of Bat Algorithm as Maximum Power Point Tracking Technique for Photovoltaic System under Partial Shading Conditions. In Proceedings of the IEEE Energy Conversion Congress and Exposition (ECCE), Portland, OR, USA, 23–27 September 2018; pp. 2531–2535. [Google Scholar]
  21. Liao, C.Y.; Subroto, R.K.; Millah, I.S.; Lian, K.L.; Huang, W.T. An improved bat algorithm for more efficient and faster maximum power point tracking for a photovoltaic system under partial shading conditions. IEEE Access 2020, 8, 96378–96390. [Google Scholar] [CrossRef]
  22. Mohanty, S.; Subudhi, B.; Ray, P.K. A New MPPT design using grey wolf optimization technique for photovoltaic system under partial shading conditions. IEEE Trans. Sustain. Energy 2016, 7, 181–188. [Google Scholar] [CrossRef]
  23. Sundareswaran, K.; Sankar, P.; Nayak, P.S.R.; Simon, S.P.; Palani, S. Enhanced energy output from a PV system under partial shaded conditions through artificial bee colony. IEEE Trans. Sustain. Energy 2015, 6, 198–209. [Google Scholar] [CrossRef]
  24. Bhukya, L.; Nandiraju, S. A novel photovoltaic maximum power point tracking technique based on grasshopper optimized fuzzy logic approach. Int. J. Hydrog. Energy 2020, 45, 9416–9427. [Google Scholar] [CrossRef]
  25. Mansoor, M.; Mirza, A.F.; Ling, Q.; Javed, M.Y. Novel grass hopper optimization based MPPT of PV systems for complex partial shading conditions. Sol. Energy 2020, 198, 499–518. [Google Scholar] [CrossRef]
  26. Saremi, S.; Mirjalili, S.; Lewis, A. Grasshopper optimization algorithm: Theory and application. Adv. Eng. Softw. 2017, 105, 30–47. [Google Scholar] [CrossRef]
  27. Saxena, A.; Shekhawat, S.; Kumar, R. Application and Development of Enhanced Chaotic Grasshopper Optimization Algorithms. Model. Simul. Eng. 2018, 2018, 1–14. [Google Scholar] [CrossRef] [Green Version]
  28. Seyedmahmoudiana, M.; Horan, B.; Soon, T.K.; Rahmani, R.; Oo, A.M.T.; Mekhilef, S.; Stojcevskie, A. State of the art artificial intelligence-based MPPT techniques for mitigating partial shading effects on PV systems—A review. Renew. Sustain. Energy Rev. 2016, 64, 435–455. [Google Scholar] [CrossRef]
  29. Nugraha, D.A.; Lian, K.L.; Suwarno. A Novel MPPT Method Based on Cuckoo Search Algorithm and Golden Section Search Algorithm for Partially Shaded PV System. Can. J. Electr. Comput. Eng. 2019, 42, 173–182. [Google Scholar] [CrossRef]
Figure 1. The life cycle of grasshoppers.
Energies 13 04329 g001
Figure 2. Pseudo-code of ECGOA.
Energies 13 04329 g002
Figure 3. Calculation of S i in ECGOA.
Energies 13 04329 g003
Figure 4. Operation principles of the IC method on the P-V curve.
Energies 13 04329 g004
Figure 5. Calculation of S i in ECGOA arithmetic mean.
Energies 13 04329 g005
Figure 6. The flowchart of the proposed method.
Energies 13 04329 g006
Figure 7. Tracking process example of the proposed method.
Energies 13 04329 g007
Figure 8. Tracking scheme example of the proposed method.
Energies 13 04329 g008
Figure 9. Block diagram of the experimental setup.
Energies 13 04329 g009
Figure 10. The experimental setup equipment.
Energies 13 04329 g010
Figure 11. P-V curve characteristics: (a) Curve 1 with a single peak. (b) Curve 2 with left side peak. (c) Curve 3 with left-middle side peak. (d) Curve 4 with the middle peak. (e) Curve 5 with right-middle side peak. (f) Curve 6 with right side peak.
Energies 13 04329 g011aEnergies 13 04329 g011b
Figure 12. Power tracking evolution of all methods for: (a) Curve 1, (b) Curve 2, (c) Curve 3, (d) Curve 4, (e) Curve 5, (f) Curve 6.
Energies 13 04329 g012aEnergies 13 04329 g012b
Figure 13. Shaded pattern changing sequence.
Energies 13 04329 g013
Figure 14. Dynamic power tracking evolution of (a) proposed method, (b) MFA, and (c) PSO.
Energies 13 04329 g014
Table 1. Tracking steps using ECGOA arithmetic mean.
ParticlesIteration CycleNote
0-th1st
Grasshopper No 1 V 1 0 = 22.0 V
P ( V 1 0 ) = 54.65 W
V 1 1 = 186.9 V
P ( V 1 1 ) = 225.9 W
* All transition requirements are satisfied after the first iteration cycle: | T d V i | < d min = 5 V
* Best solution from ECGOA
V 4 1 = 187.3 V ; P ( V 4 1 ) = 226.1 W
* The transition from ECGOA to IC is done by taking the value of V 4 1 as V o l d 1 on IC
Grasshopper No 2 V 2 0 = 66.0 V
P ( V 2 0 ) = 138.9 W
V 2 1 = 185.9 V
P ( V 2 1 ) = 225.4 W
Grasshopper No 3 V 3 0 = 110.0 V
P ( V 3 0 ) = 189.4 W
V 3 1 = 182.6 V
P ( V 3 1 ) = 218 W
Grasshopper No 4 V 4 0 = 176.0 V
P ( V 4 0 ) = 216.3 W
* Best Target ( T d )
V 4 1 = 187.3 V
P ( V 4 1 ) = 226.1 W
* Best Target ( T d )
Grasshopper No 5 V 5 0 = 198.0 V
P ( V 5 0 ) = 205.8 W
V 5 1 = 182.4 V
P ( V 5 1 ) = 209.6 W
Table 2. Tracking steps details using IC.
ParameterIC Iterative Step
1st2nd3rd4th
V o l d 187.3 V187.3 V189.3 V191.3 V
P ( V o l d ) 226.1 W226.1 W226.4 W225.6 W
V n e w -189.3 V191.3 V189.3 V
P ( V n e w ) -226.4 W225.6 W226.4 V
V g b e s t 187.3 V189.3 V189.3 V189.3 V
P ( V g b e s t ) 226.1 V226.4 V226.4 V226.4 V
Table 3. Algorithm parameters.
NoMethodParameters
1.PSO ω = 0.3 ; c 1 = 1.5 ; c 2 = 1.5
2.MFA β 0 = 1.0 ; ϒ = 0.96 ; m = 2 ; α = 0.03
3.Proposed Method c max = 1 ; c min = 4 × 10 4 ; N max = 2 ; N min = 0.1 ; L = 1000 ; d min = 0.02
Table 4. Tracking efficiencies by experiment.
NoAlgorithmCurve 1Curve 2Curve 3Curve 4Curve 5Curve 6
1.Proposed Method99.94 ± 0.0299.97 ± 0.0599.95 ± 0.0399.95 ± 0.0899.69 ± 0.4199.69 ± 0.07
2.MFA99.92 ± 0.0699.91 ± 0.1599.94 ± 0.0199.89 ± 0.2899.65 ± 0.1799.93 ± 0.09
3.PSO99.84 ± 0.1899.76 ± 0.0499.57 ± 0.2899.31 ± 0.0199.35 ± 0.3799.75 ± 0.07
Table 5. Tracking times by experiment.
NoAlgorithmCurve 1Curve 2Curve 3Curve 4Curve 5Curve 6
1.Proposed Method3.88 ± 0.131.53 ± 0.091.65 ± 0.112.39 ± 0.112.63 ± 0.081.66 ± 0.06
2.MFA4.04 ± 0.402.81 ± 0.303.13 ± 0.952.90 ± 0.573.30 ± 0.793.00 ± 0.29
3.PSO4.62 ± 0.313.96 ± 0.834.53 ± 1.094.81 ± 1.373.92 ± 0.404.12 ± 0.38
Table 6. Tracking efficiency of dynamic case.
No.MethodCurve 1–6–5–2–4–3
1.Proposed Method93.70%
2.MFA92.29%
3.PSO89.52%