Article

Volt-Var Curve Reactive Power Control Requirements and Risks for Feeders with Distributed Roof-Top Photovoltaic Systems

Sandia National Laboratories, P.O. Box 5800 MS 1033, Albuquerque, NM 87185, USA
*
Author to whom correspondence should be addressed.
Energies 2020, 13(17), 4303; https://doi.org/10.3390/en13174303
Submission received: 10 July 2020 / Revised: 13 August 2020 / Accepted: 14 August 2020 / Published: 19 August 2020
(This article belongs to the Special Issue Smart Photovoltaic Energy Systems for a Sustainable Future)

Abstract

:
The benefits and risks associated with Volt-Var Curve (VVC) control for management of voltages in electric feeders with distributed, roof-top photovoltaic (PV) can be defined using a stochastic hosting capacity analysis methodology. Although past work showed that a PV inverter’s reactive power can improve grid voltages for large PV installations, this study adds to the past research by evaluating the control method’s impact (both good and bad) when deployed throughout the feeder within small, distributed PV systems. The stochastic hosting capacity simulation effort iterated through hundreds of load and PV generation scenarios and various control types. The simulations also tested the impact of VVCs with tampered settings to understand the potential risks associated with a cyber-attack on all of the PV inverters scattered throughout a feeder. The simulation effort found that the VVC can have an insignificant role in managing the voltage when deployed in distributed roof-top PV inverters. This type of integration strategy will result in little to no harm when subjected to a successful cyber-attack that alters the VVC settings.

1. Introduction

Suitable integration of photovoltaic (PV) generators within an electric feeder requires a detailed hosting capacity analysis that reviews the benefits and risks associated with voltage management. Typical feeders can handle significant swings in load distributed throughout the system. In general, the PV generation sources on the feeder cause the voltages to increase; controlling the voltage, to avoid ANSI C84.1 limits [1], typically involves conventional Load Tap Changers (LTC) and switching capacitor banks (SCB). PV inverters also provide grid services that inject or absorb reactive power based on a Volt-Var curve (VVC) to lower or raise the voltage. The VVC defines the reactive power autonomously based on the reference voltage at the point of common coupling (PCC) [2]. This type of control can improve line voltages, but may not be enough to mitigate voltage violations alone. Furthermore, adding a control mechanism with internet based communications may introduce unnecessary risks. To understand the need and the potential drawbacks of VVC control, this paper performs a stochastic hosting capacity analysis that iterates through hundreds of distributed PV integration scenarios with and without LTCs and SCB enabled and at different VVC settings.
IEEE Standard 1547 requires that PV inverters include VVC control capabilities to counter the increase in voltage caused by circuit imbalance [3,4]. The control functions result in a closer to nominal grid voltage that reduces drastic fluctuations caused by significant drops in PV power output [5]. To understand VVC control impacts, past hosting capacity simulations included VVC and Volt–Watt Curve capabilities [6]. Other investigations revealed how VVC control can increase a feeder’s PV hosting capacity [7]. However, proper integration of this emerging and autonomous control mechanism requires a detailed understanding of its role when operating in conjunction with, or instead of, other regulation systems or devices.
In most cases, feeders include the necessary components and infrastructure to avoid voltage issues caused by an increase in distributed PV generation. For instance, LTC adjusts the voltage by altering the turns ratio in transformer(s); SCBs inject reactive power to increase the voltage; VVC controls define the amount of reactive power injected or absorbed by PV inverter. In some cases, feeders may require a coordinated approach that considers both the conventional regulation and VVC capabilities [8,9,10]. This paper presents a methodology for exploring the need for VVC controls. It also reviews the additional risk associated with VVC controls when subjected to a successful breach of PV inverters during a cyber-attack event.
PV inverters, required by IEEE 1547 to have communications capabilities, are susceptible to cyber-attacks that could result in unwanted changes to the reactive power control settings [11]. Experiments examined vulnerabilities of PV inverters connected to the internet by implementing various security tests (i.e., packet replay, Man-in-the-Middle, Denial-of-Service, and others) [12]. Exploitation of the PV inverter could result in deviations from the expected reactive power output as outlined in [13]. An initial exploration study highlighted potential consequences associated with maliciously altered VVCs on the distribution and transmission system [14]. However, a more thorough review of a feeder’s response to an attack at different operating conditions and the role of other grid devices, such as LTCs, has yet to be explored. This work investigates the potential need for PV inverter VVC controls and investigates the potential impacts associated with a cyber-attack through hosting capacity simulations.
To assess the control need and cyber-attack risks, the present work performed detailed stochastic hosting capacity simulations. The simulations emulated potential distributed integration scenarios to evaluate the voltage changes caused by distributed PV systems sized to offset local energy consumption. In contrast, conventionally hosting capacity analysis identifies the point at which the integration of PV at a certain location causes performance issues [15]. The single-point simulations determine the effect of increasing system size on line loading and feeder voltage violations [16]. Ultimately, it determines when new customer interconnections will need to pay for upgrades to the distribution system [17]. The process, described by Reno et al. [18], loops through different PV sizes until a violation occurs and then moves to a new bus and repeats the process. Past work used the iterative process to evaluate the impact of reactive power control to maintain grid voltages [19]. The present work took a different approach, and did not include a single-point analysis and instead used the stochastic hosting capacity methodology to test multiple integration strategies and identified the overall need for voltage management using the interconnected PV inverter’s VVC control devices.
Early hosting capacity research developed and tested a distributed, stochastic PV integration methodology to assess the impacts on electric feeders. The investigations simulated an assortment of viable PV interconnection scenarios to study the voltage response [20,21] and its impact on faults [22] at different penetration levels. This research, conducted by Electric Power Research Institute (EPRI), led to the creation of a streamlined approach for determining optimal PV locations [23,24]. In an effort to help utilities, the EPRI created a hosting capacity tool that used hybrid approaches to assess PV integration options [25]. The hybrid methodology assessed the feeders ability to host both centralized and distributed PV systems using single-point and stochastic distributed analysis techniques [26].
Although valuable, published hosting capacity methodologies and results lack a thorough review of the potential voltage management needs associated with feeders that support different levels of small-scale roof-top systems. This paper steps beyond current research that typically sized small-scale systems based on the transformer size, by estimating the roof-top PV capacity based on the building load provided by the OpenDSS model (Section 2.2). Often, hosting capacity analysis considers the impact of PV at a single load condition (e.g., maximum load or 30% of maximum load), this paper reviews the changes in voltage at different load and PV generation amounts to provide a more complete assessment of the systems capabilities. The paper also describes the voltage response to different control scenarios, which include LTC, SCB, and VVCs embedded in PV inverters. Finally, the paper considers a cybersecurity event where the VVC control parameters are maliciously altered, which has not been considered in past hosting capacity work for distributed small scale systems.
The paper considers two feeders, modeled in OpenDSS, that include the primary and secondary lines. Simulations, that included the various control strategies, provided voltage outputs at different load and PV generation amounts. To access the impact of the controls, the paper evaluates each system in the following manner:
  • Define feeder’s voltage response at different load and PV generation amounts to review each control approaches impact.
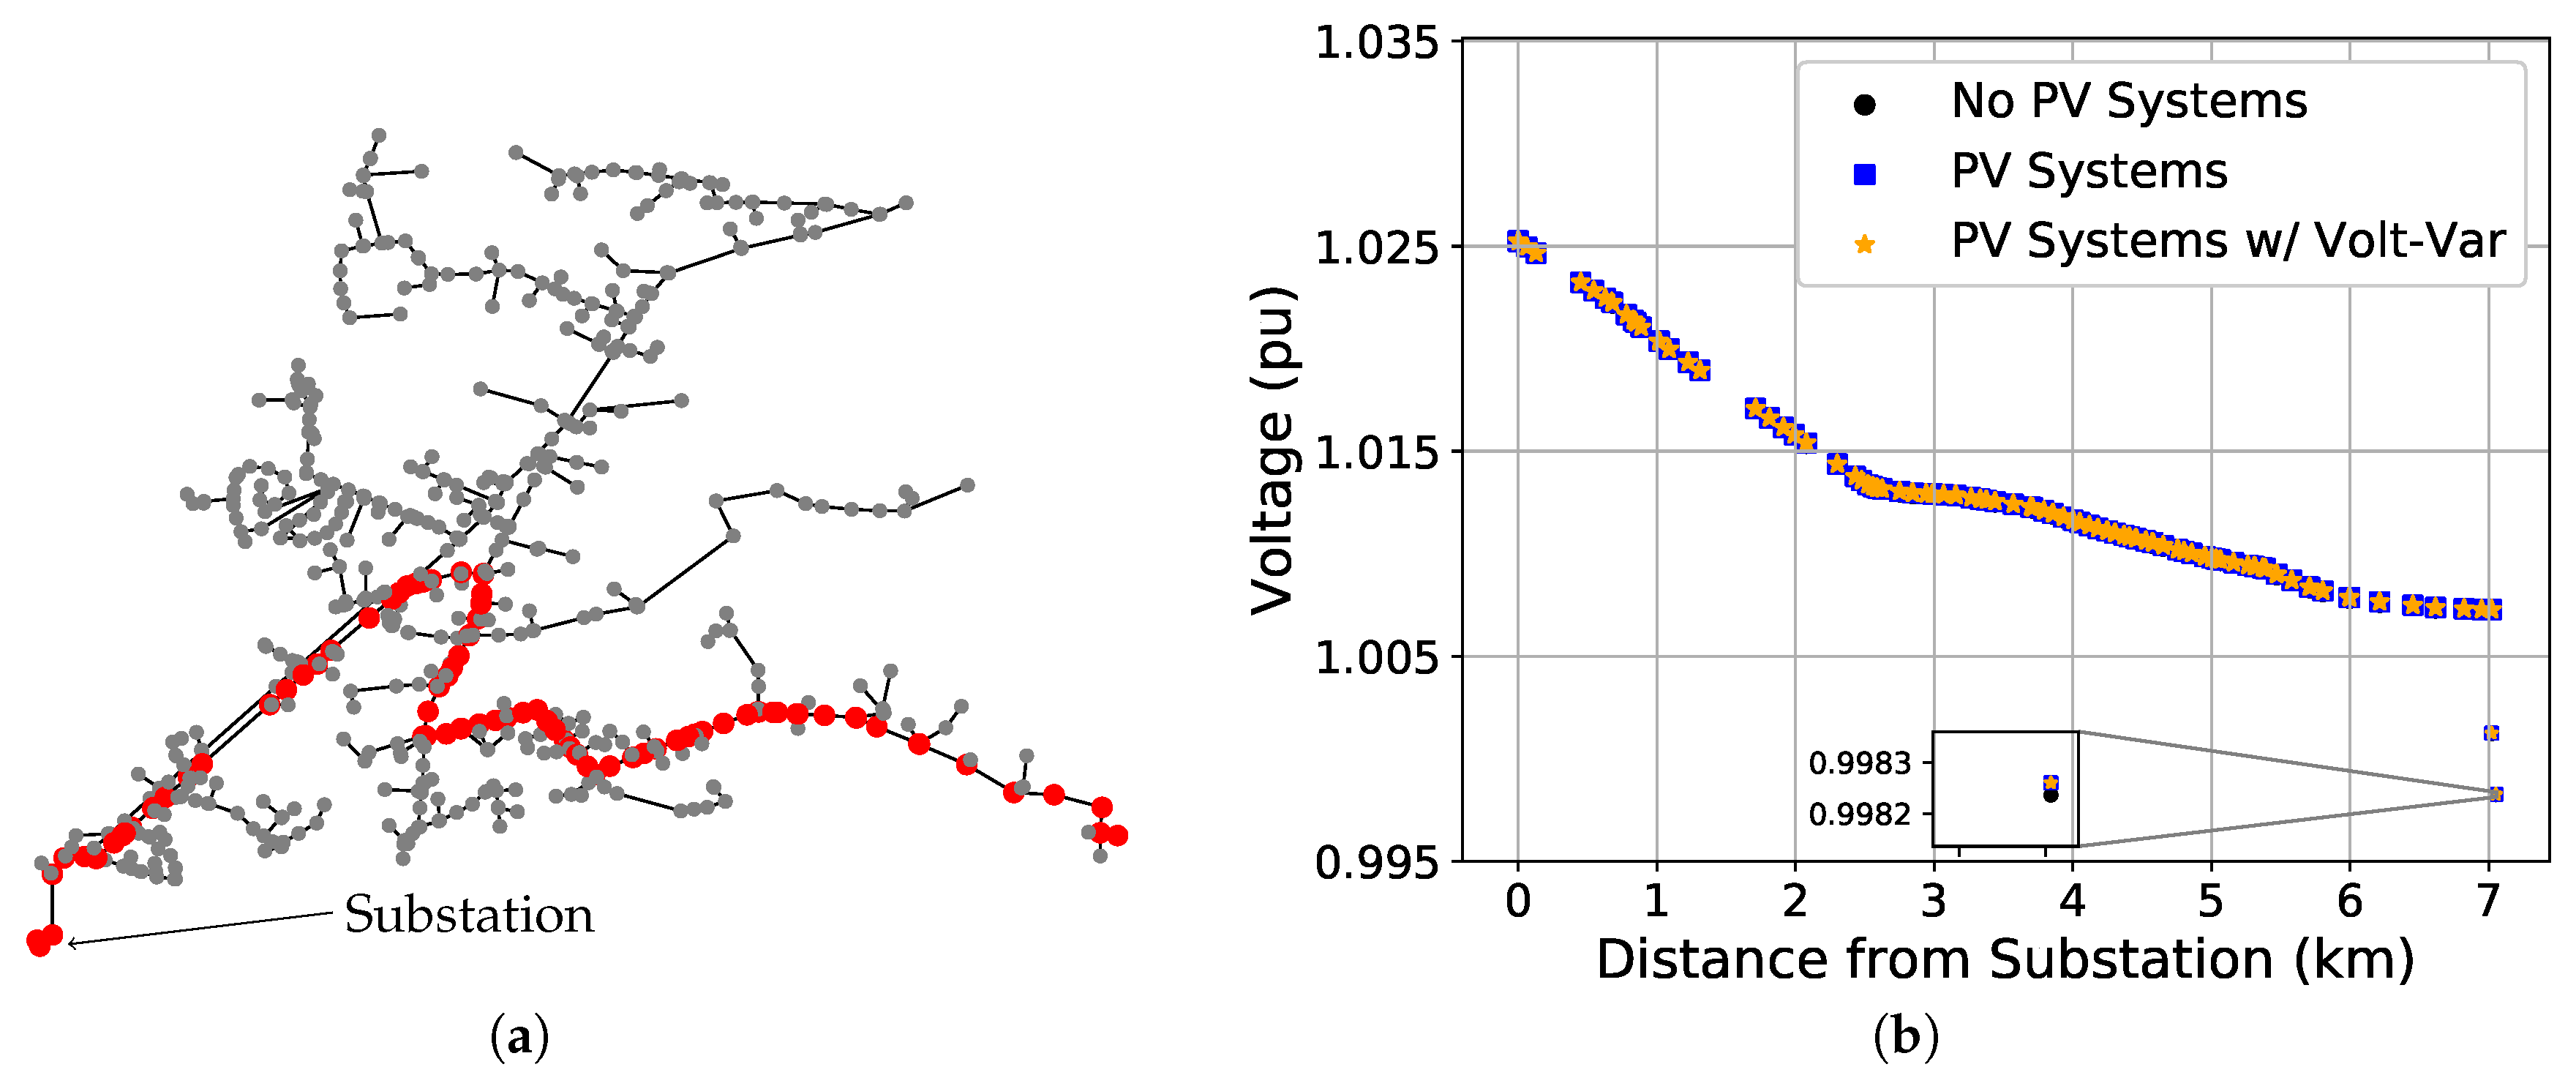
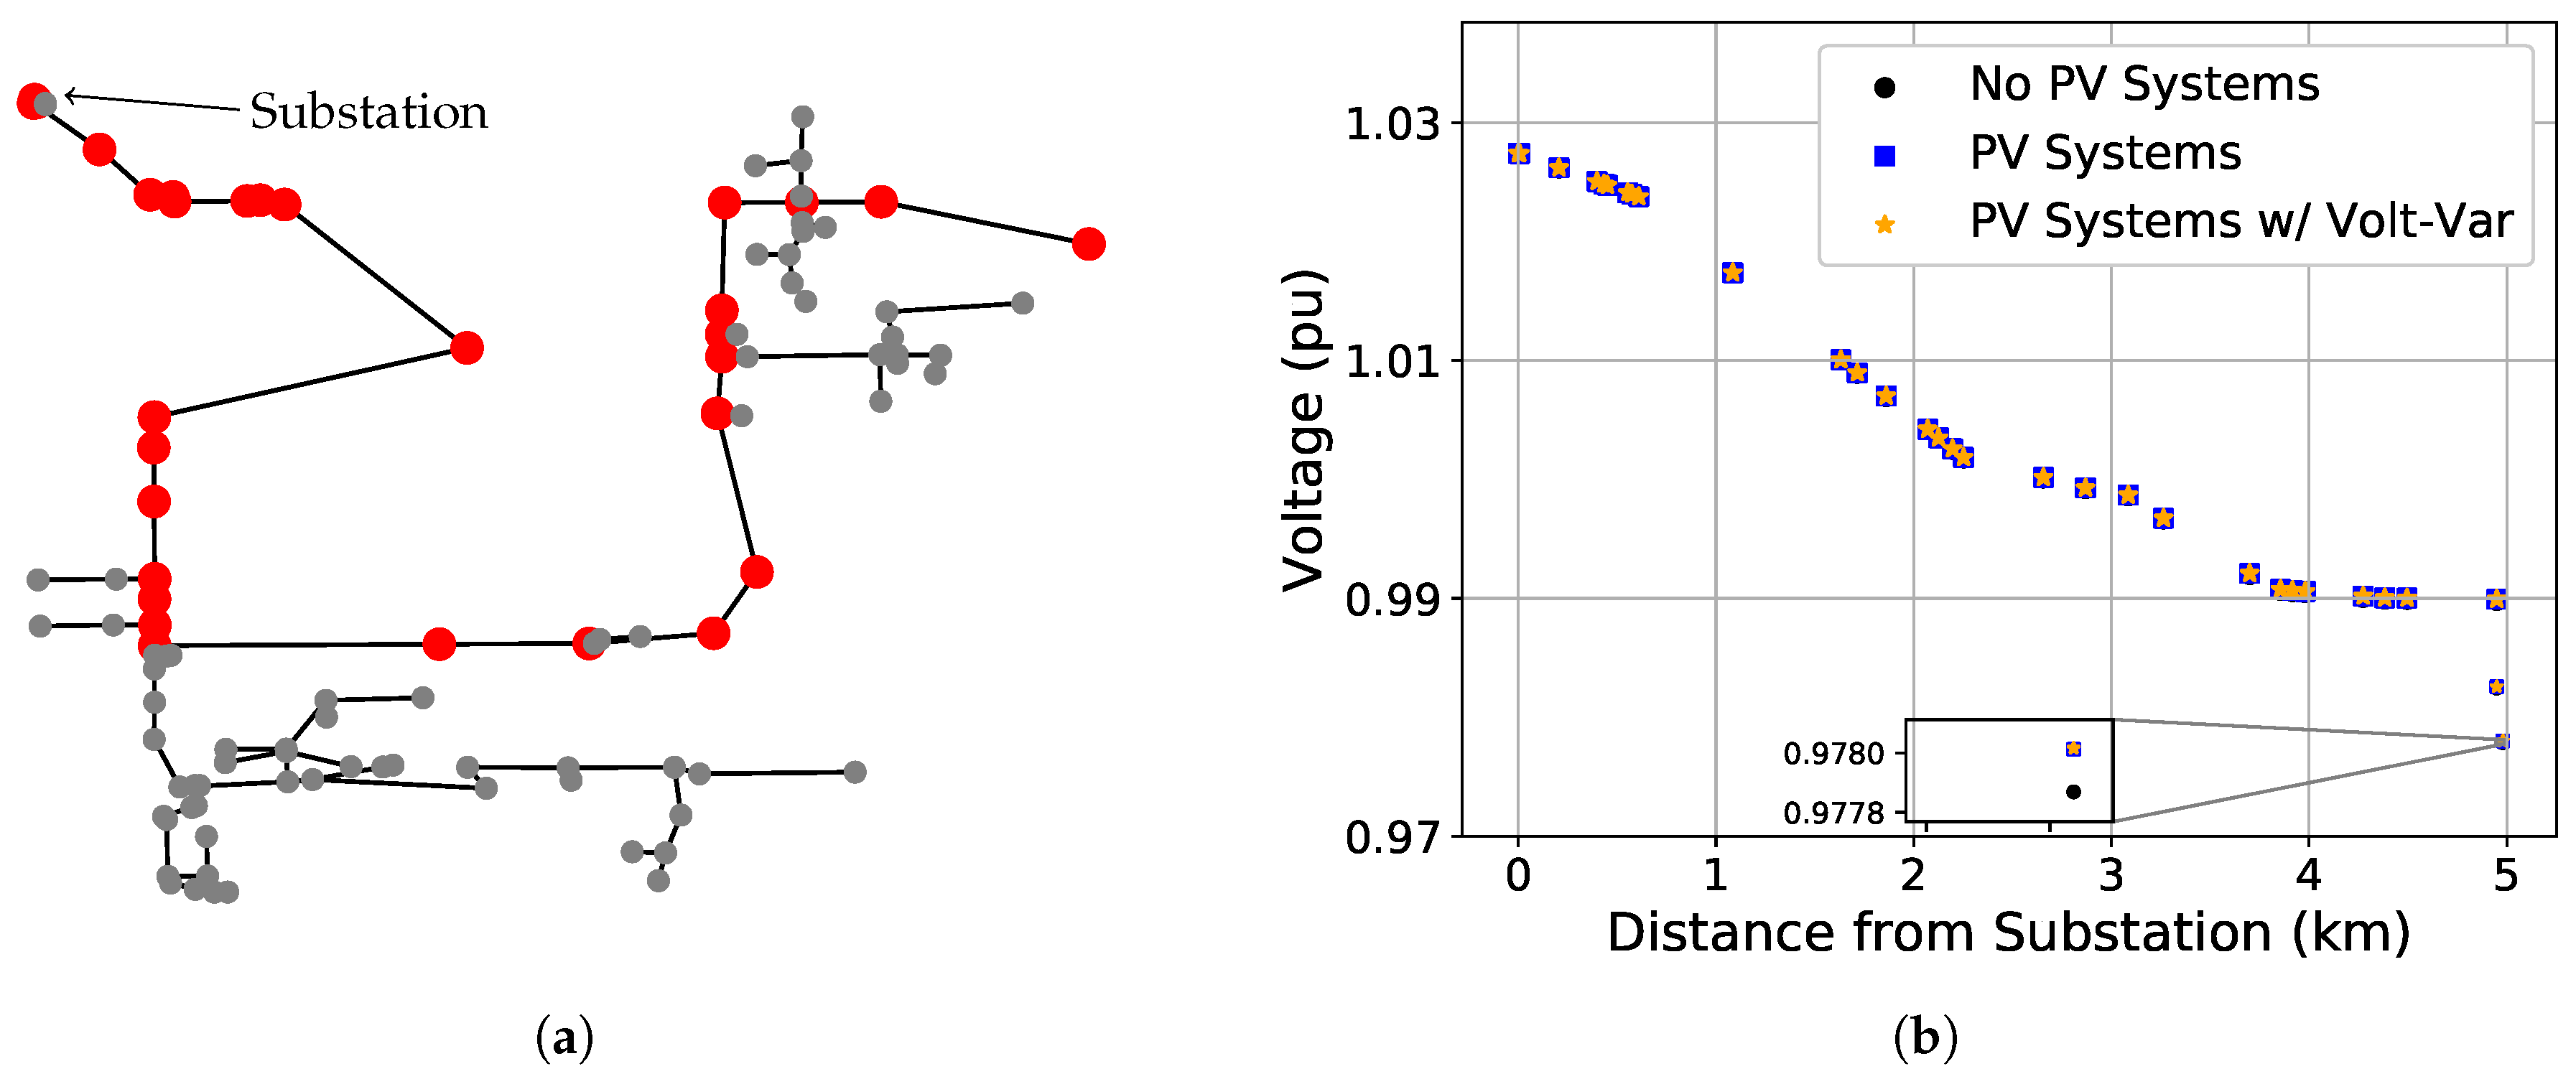
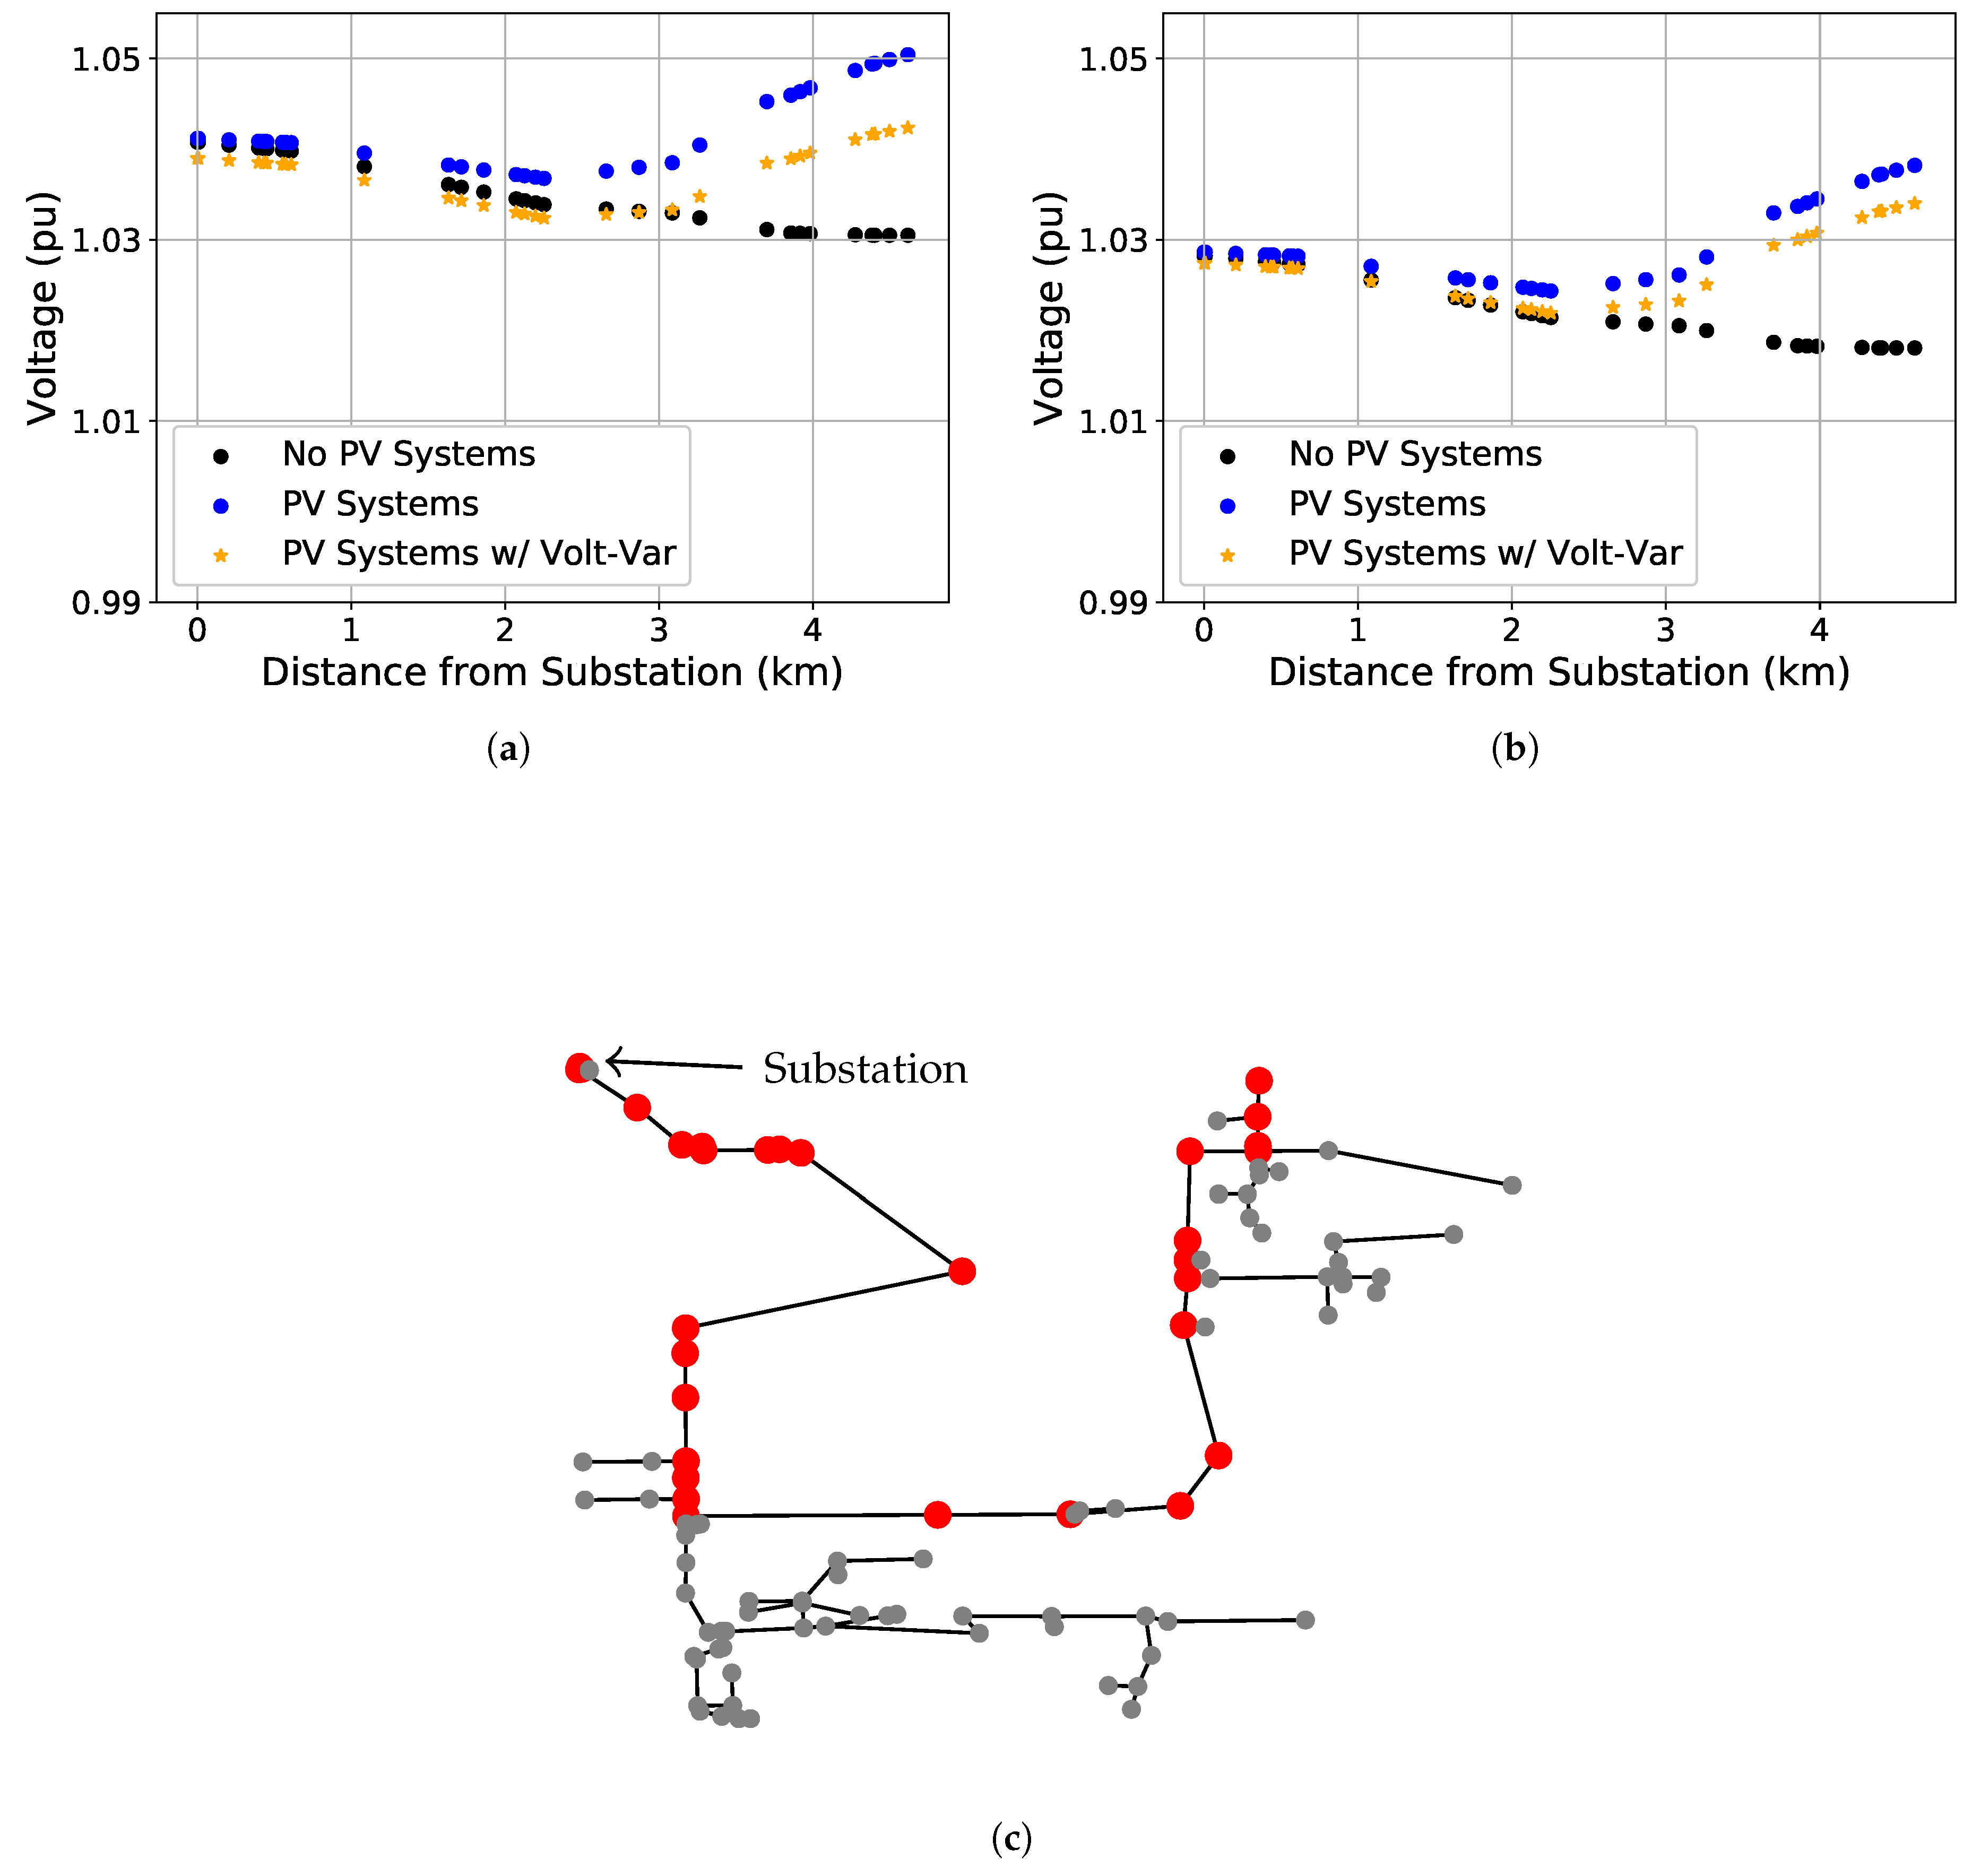
  • Assess sample voltage profiles from the substation to a PV system, which highlights the difference in voltage on the primary and secondary lines under different operating conditions (i.e., no PV systems, with PV systems, and PV systems with the VVC turned on).
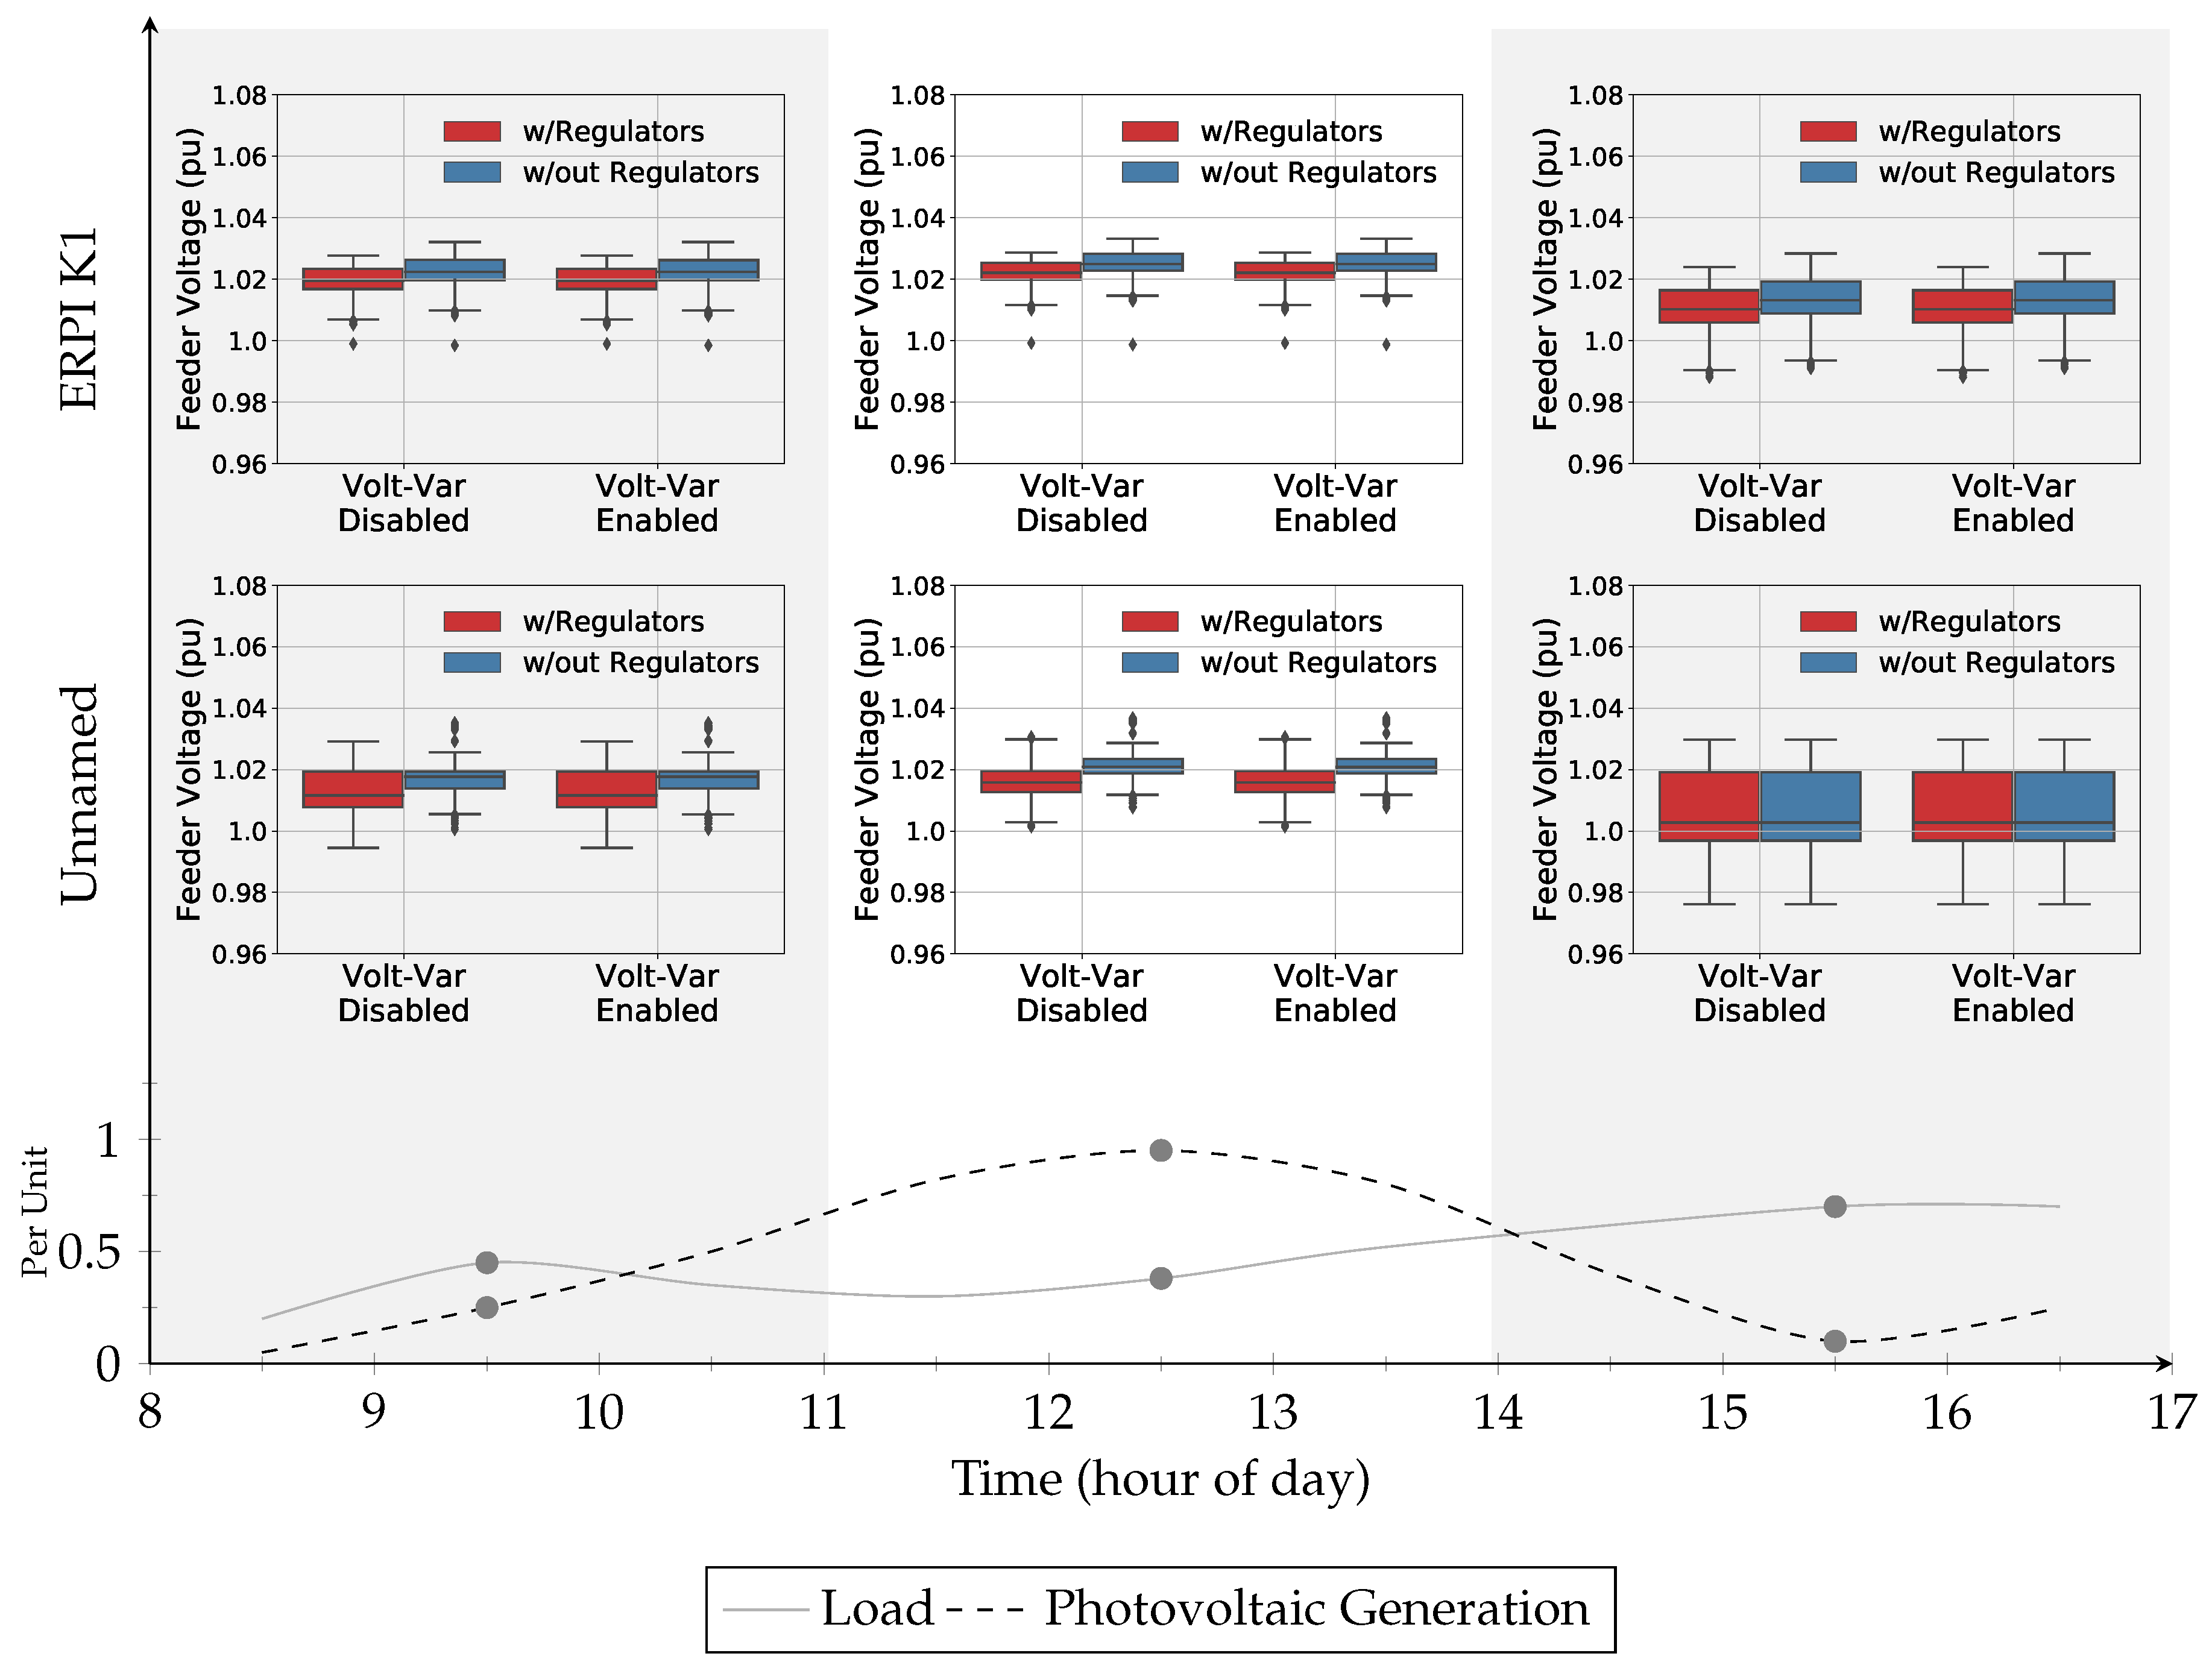
  • Perform a statistical evaluation, using boxplots, of the feeder voltages when subjected to potential daily operations using different voltage management methods.
  • Compare the distributed, roof-top PV integration strategy with a different strategy (i.e., large scale systems installed at a single point) to review the potential differences.

2. Methodology

Determination of a feeder’s control needs and the potential risks associated with VVC controls involved a three step process depicted in Figure 1. The first step, labeled as the initial setup, established specific voltage control methods (Section 2.1) and PV integration strategies (Section 2.2). The simulation stage used the control methods and PV integration scenarios to run a stochastic hosting capacity analysis. The analysis subjected OpenDSS feeder models, described in Section 2.3.1, to various levels of load and PV generation (Section 2.3.2) throughout 100 different iterations. The end result estimated the impact of the voltage control types (Section 3.1) and approximated the consequences of malicious modifications to the VVC settings (Section 3.2).

2.1. Voltage Controls

Maintaining proper voltage on the feeder’s lines may require intervention to avoid ANSI violations. Often, utilities use LTCs and SCB to regulate the voltage. PV inverters offer an alternative method for controlling voltage by injecting or absorbing reactive power depending on the reference voltage. This experiment implemented the three control types and reviewed the impact of each on the feeder’s performance when subjected to various levels of distributed, small-scale PV. The effort focused on the PV inverter’s VVC ability to regulate voltage by-itself and in conjunction with the LTC and SCB voltage regulation mechanisms.

2.1.1. Voltage Control Strategies

The simulation effort implemented four control strategies to highlight the impact of each at different operating conditions. The strategies included:
  • No Control—Simulations with the LTCs, SCBs, and PV inverter VVC functions disabled.
  • Regulators Only—Simulations that had none of the PV inverters VVCs providing reactive power support, but the LTCs and SCB could operate and potentially alter the feeder’s voltage.
  • PV Inverter VVC Only—Simulations where each of the PV inverters absorbed or injected reactive power and none of the LTCs or SCB provided support.
  • Regulators plus PV Inverter VVC—Simulations that enabled all of the control functions (LTCs, SCBs, and PV inverter VVCs).
The results from each approach described the overall systems response to a large range of distributed, small-scale PV system integration types and load amounts. A review of the different control impacts highlighted the need for small-scale PV inverter’s to have their VVC functions enabled. The simulations also tested modified VVC settings to define the potential risk associated with a cyber-attack. The initial hypothesis expected the feeders and their existing control functions to support the integration of large amounts of distributed PV. To confirm this prediction, normal and maliciously modified VVCs were deployed within each PV inverter and ran alongside other control strategies or by itself.

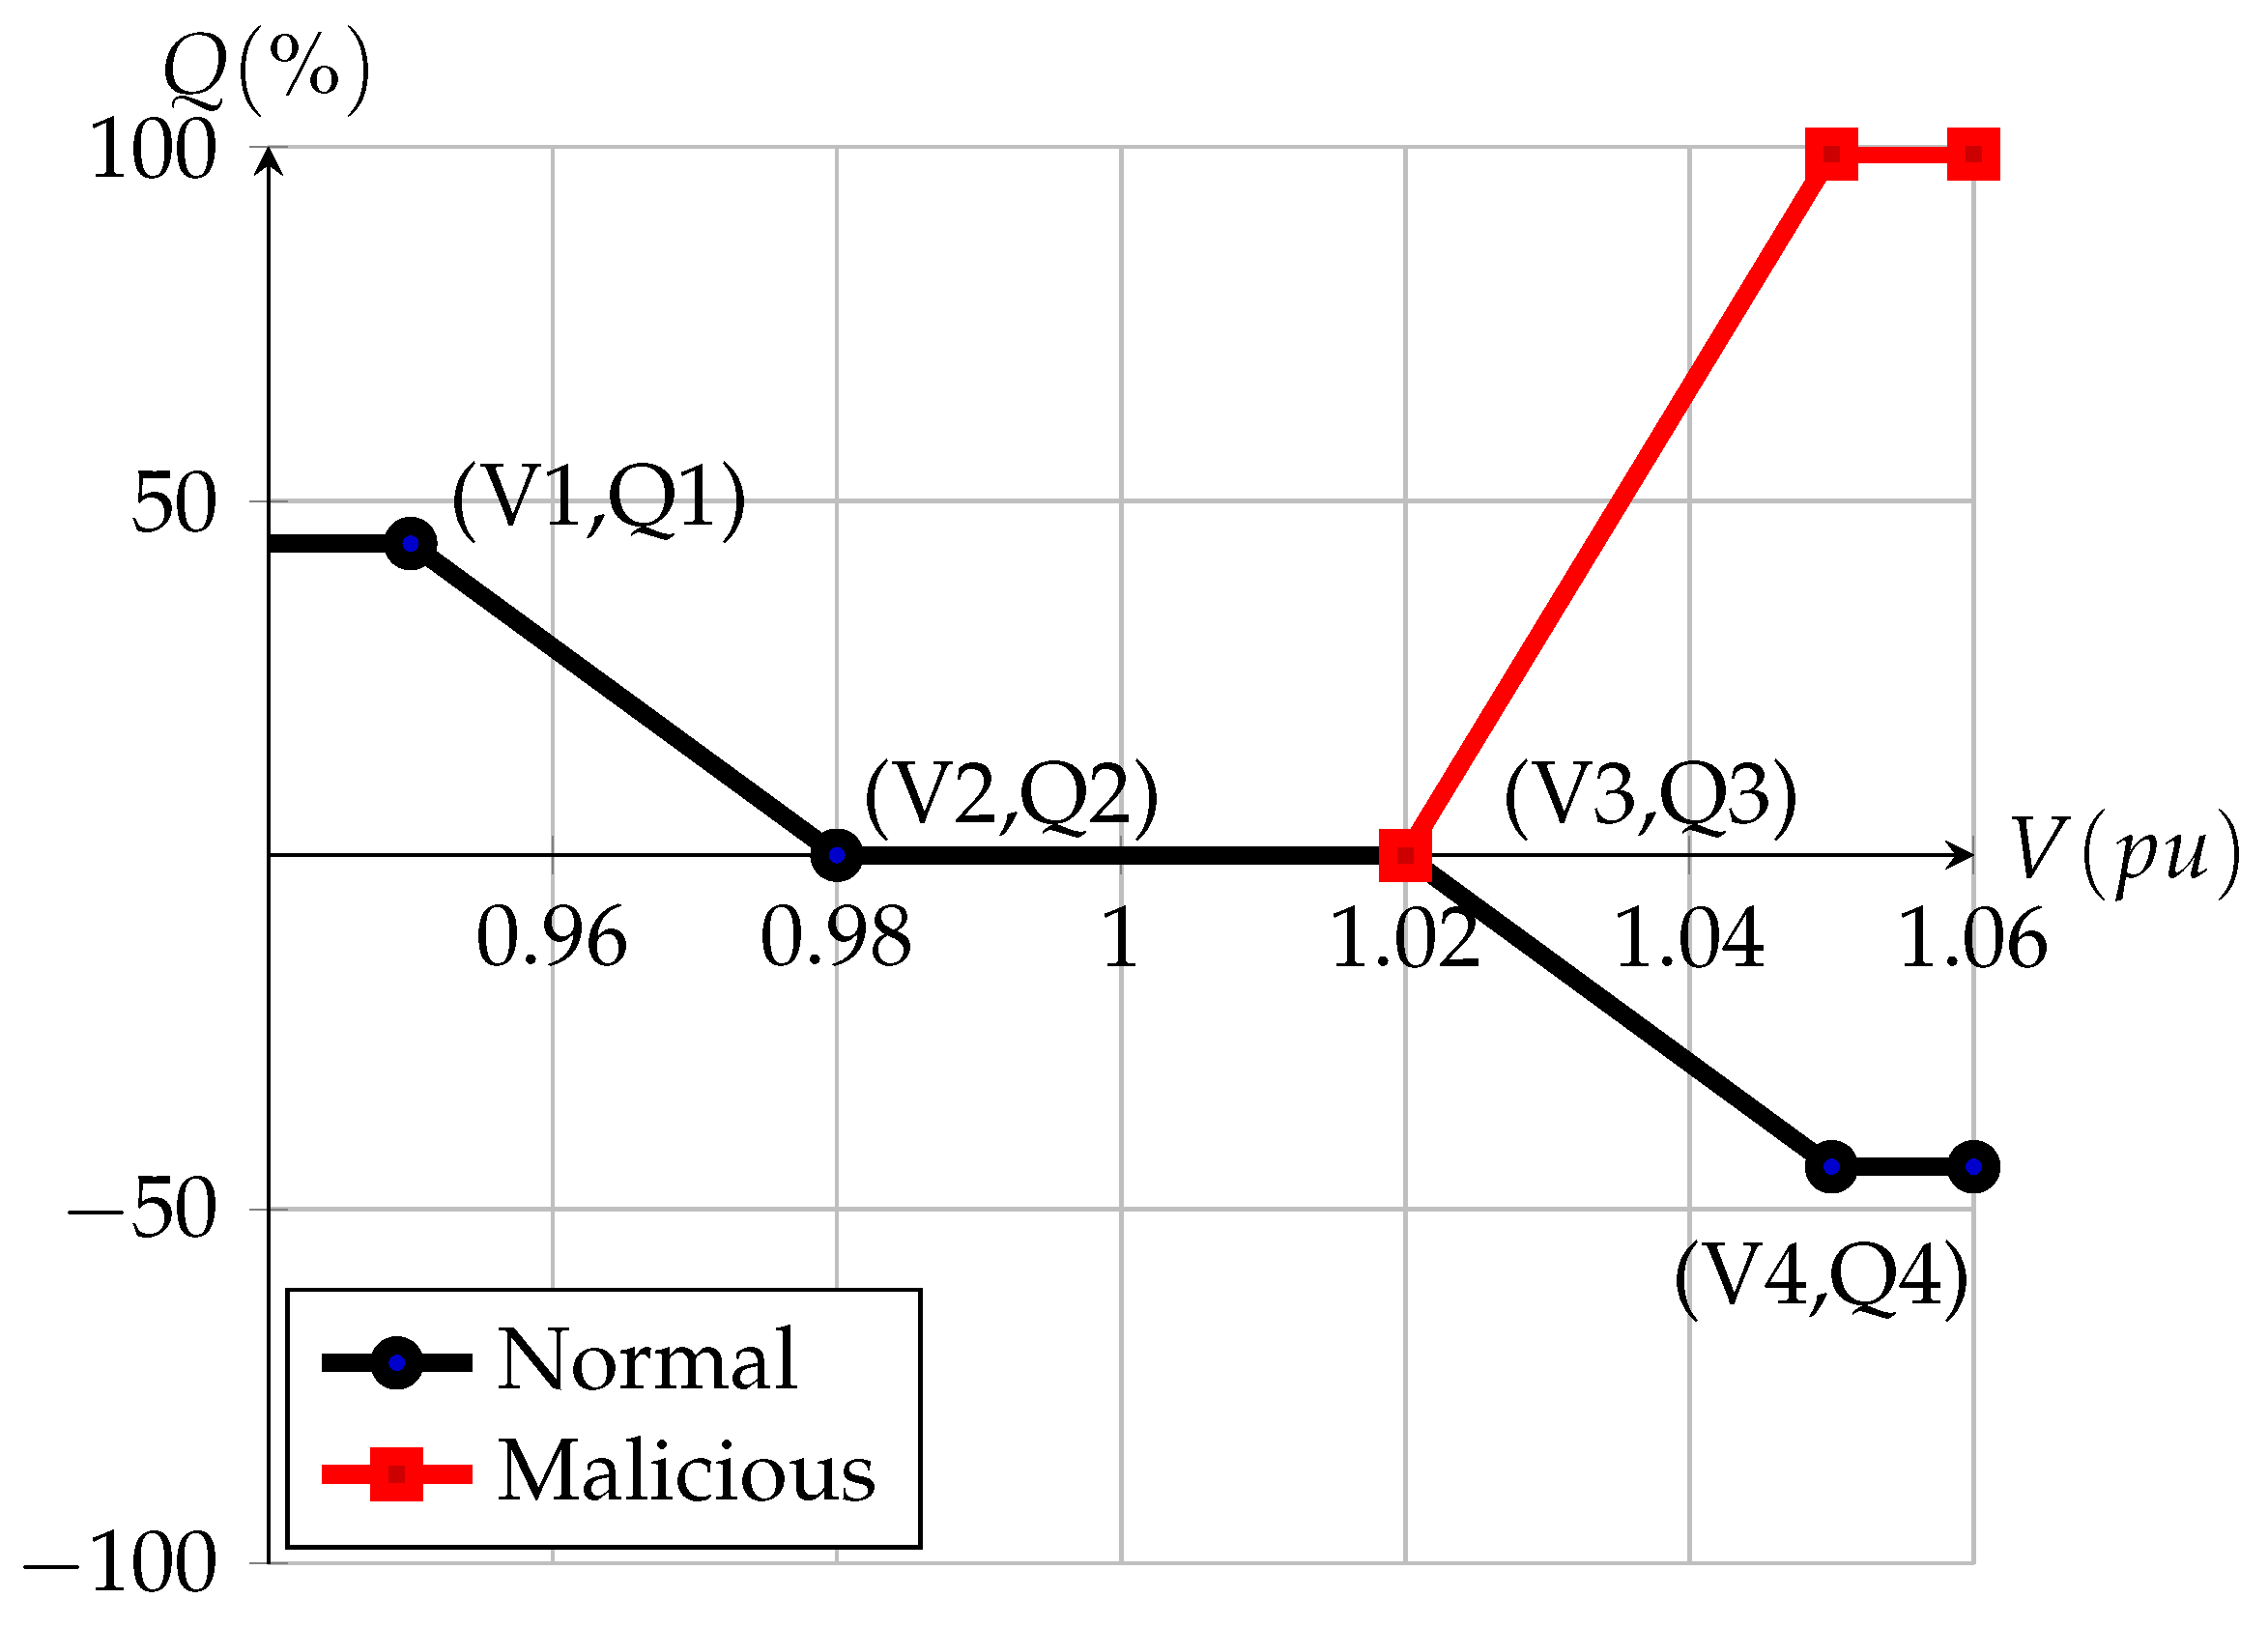
2.1.2. Volt-Var Curve Control Parameter Settings

The simulations that used VVC control included two different curve settings, depicted in Figure 2. The curves represented both normal and malicious settings. The normal settings matched with typical operations, where the PV inverter intended to absorb reactive power when the nearby voltage was above 1.02 pu. The modified settings represented situations where the PV inverters were improperly programmed to injected reactive power at high voltage. This altered setting could be disallowed in future software implementations as described by Johnson et al. [14], but as of today the capability exists.
Each of the control scenarios (i.e., normal or malicious), shown in Figure 2, include a pre-set configuration that had reactive power (Q) priority and defined the Q from a corresponding voltage (V). All of the curves had the same settings for voltages below 1.02 pu. The dead band, where the reactive power equalled zero, extended between 0.98 and 1.02 pu. Below 0.98 pu, it extended up to a reactive power percentage of 44%. The normal VVC had negative reactive power percentages above 1.02 pu; the VVC reached a low of −44% at 1.05 pu. The malicious VVC had a positive reactive power that reached a high of 99% at 1.05 pu.

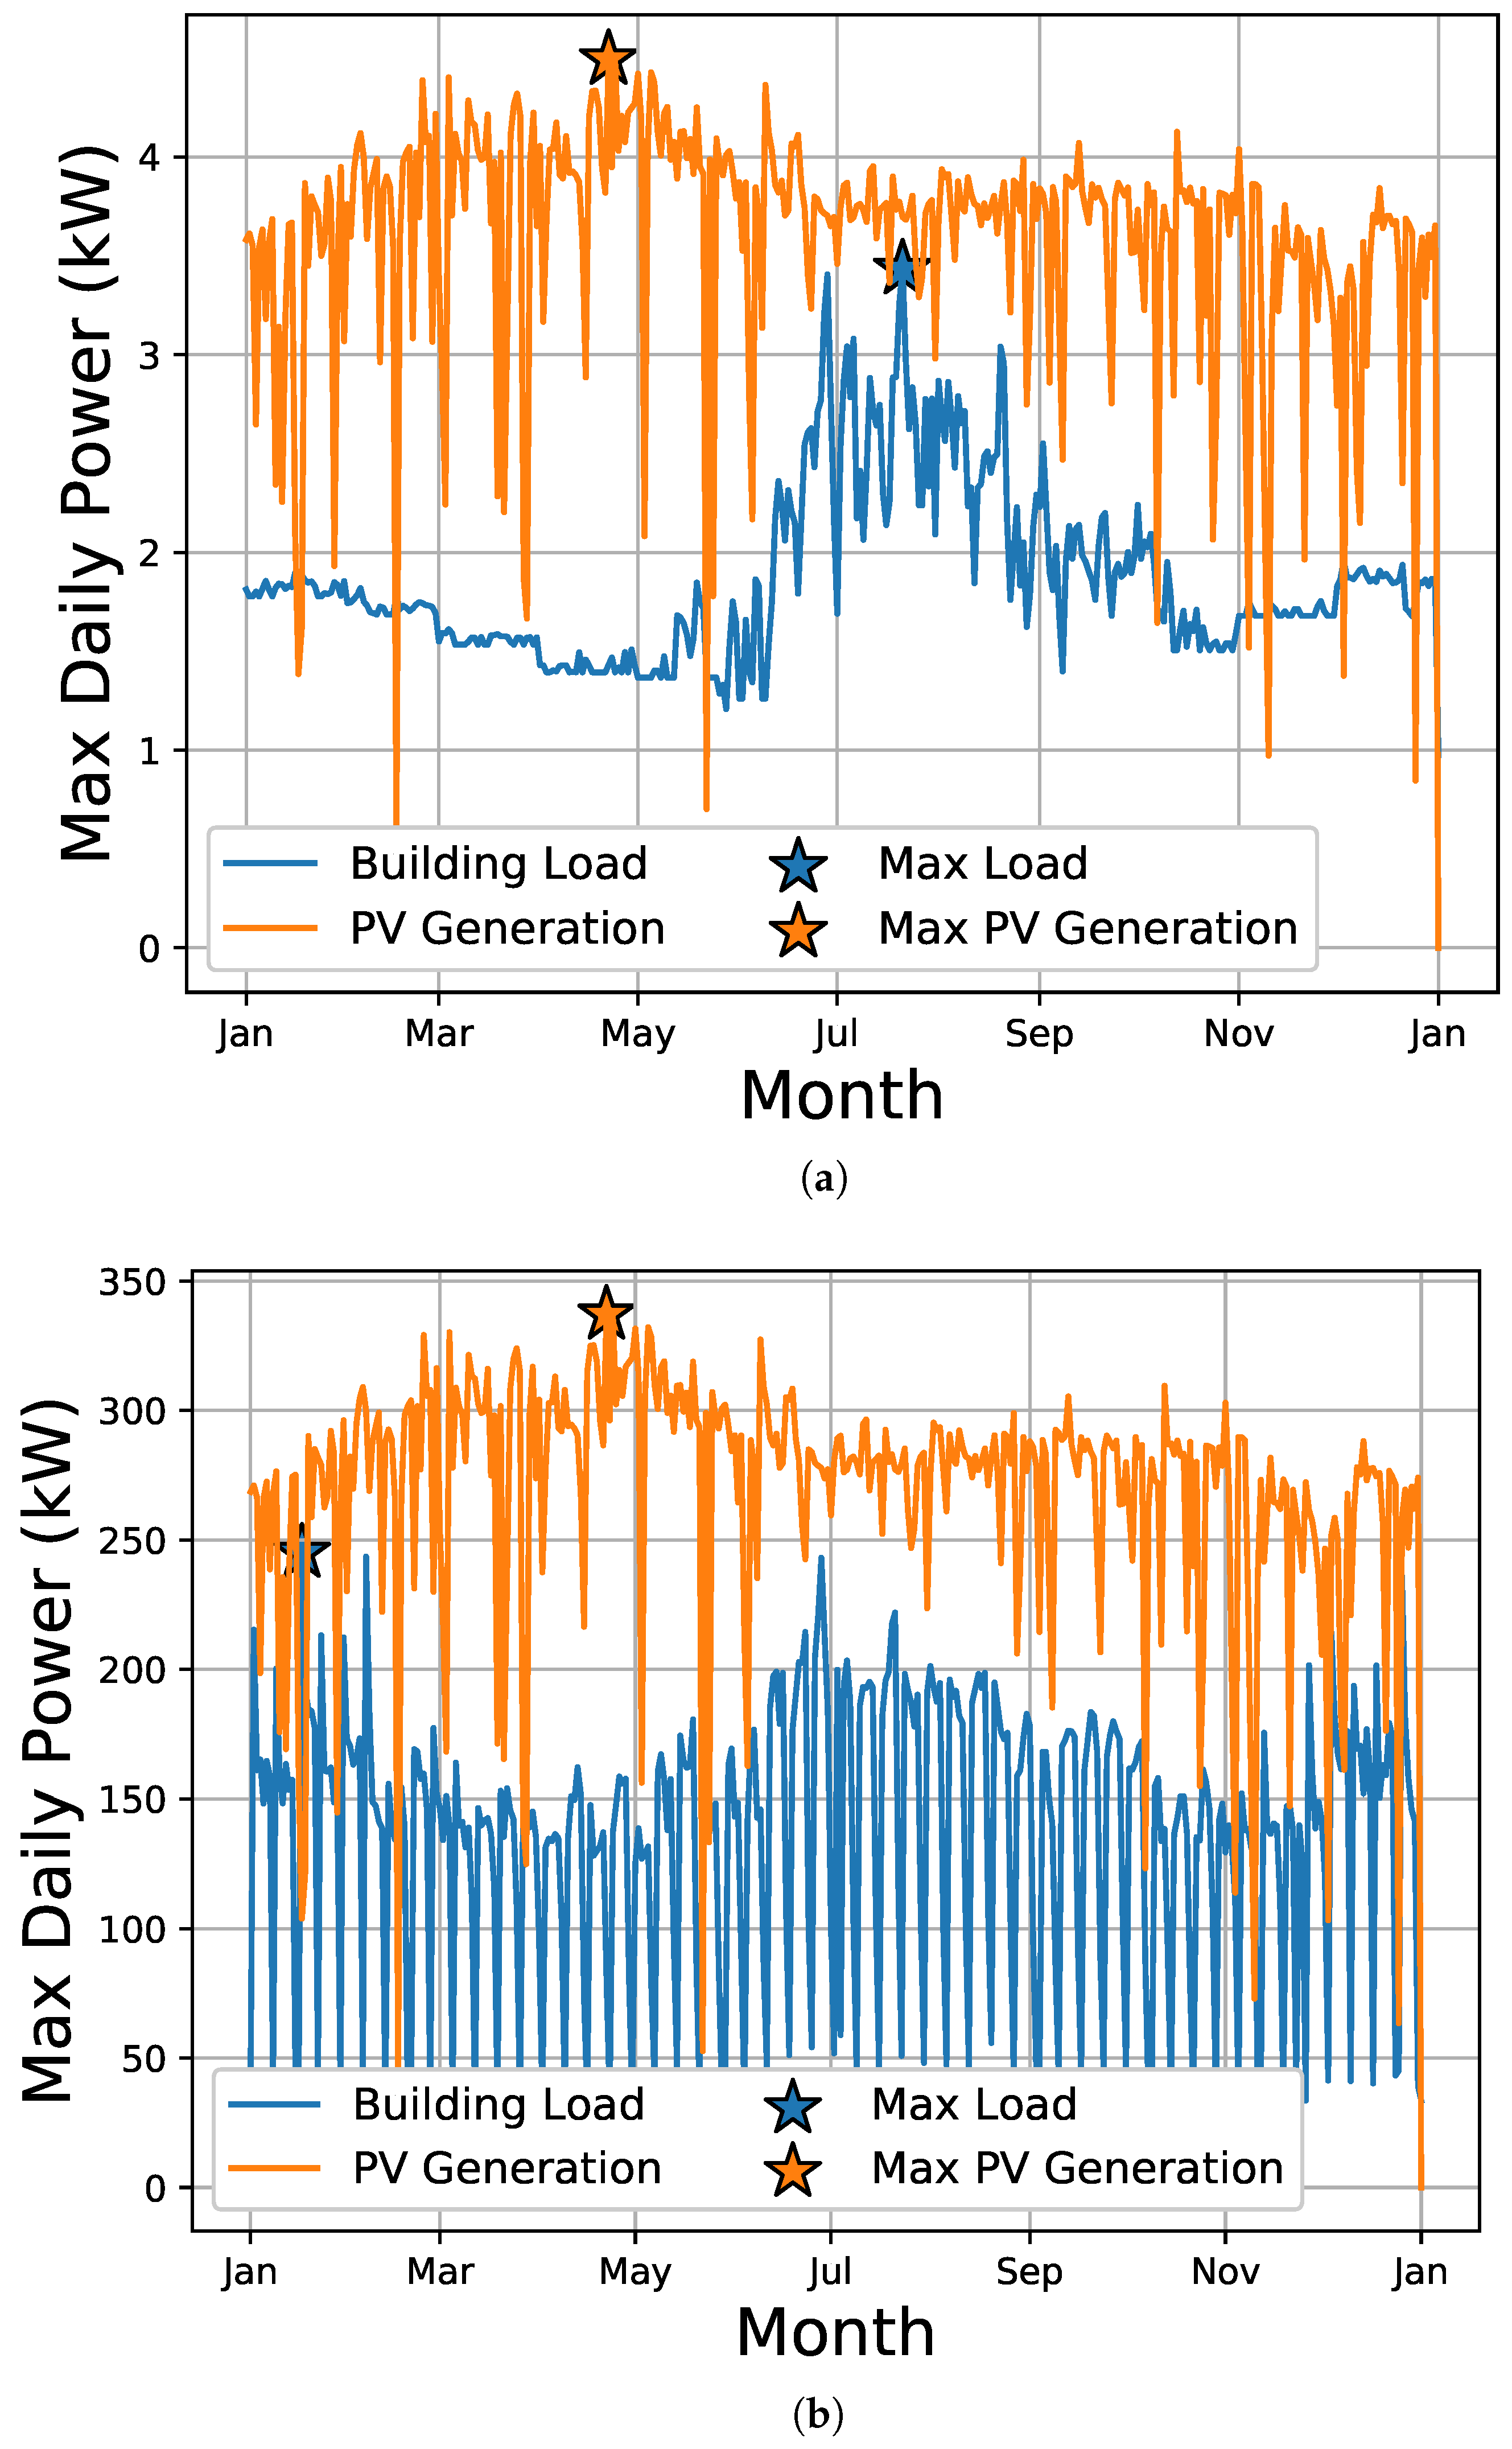
2.2. PV Integration Strategy

The hosting capacity analysis evaluated the impact of distributed PV systems, often installed on building roof-tops, on a feeder’s voltage. Implementation of the distributed integration strategy in the simulation environment involved the random placement of the PV systems at different penetration levels. The PV systems were each connected to the same phase as the load. In cases where the load had a three phase connection, the PV system was divided across the three phases. In addition, the size of each PV plant depended on the nearby load’s annual energy consumption.
The size of distributed PV systems installed on building roof-tops or parking lots often depend on the annual energy consumption of the building. Therefore, the current work sized the simulated PV systems based on each loads projected energy use. However, the OpenDSS models only provided the maximum load of the building. To estimate the potential energy consumption, this work considered residential and commercial building model outputs and an associated PV system designed to offset the loads energy use. A peak power ratio, estimated by comparing the building and PV models, was multiplied by each OpenDSS model load value to determine each PV systems’ capacity.
The determination of a PV power peak ratio involved the comparison of the typical annual power outputs for residential and commercial buildings with a corresponding PV system. Building loads profiles, provided by the Department of Energy Office of Energy (DOE) Efficiency and Renewable Energy (EERE) [27], shown in Figure 3 represented residential and commercial buildings located in Albuquerque, New Mexico. The PV generation estimates came from the PVWatts [28] model available in Python’s PVLIB package [29]. The rated capacity of the PV system was modulated until the annual energy equalled that of the corresponding building model using the TMY3 Albuquerque data. Then, the peak load and maximum PV generation over the entire year for each case were discovered as depicted with the orange and blue stars in Figure 3a,b. The ratio between the maximum load and PV generation for the residential and commercial cases each equaled about 1.35. Therefore, 1.35 was used to determine the PV output for each system in the model by multiplying it times the maximum load provided by the OpenDSS model load file.

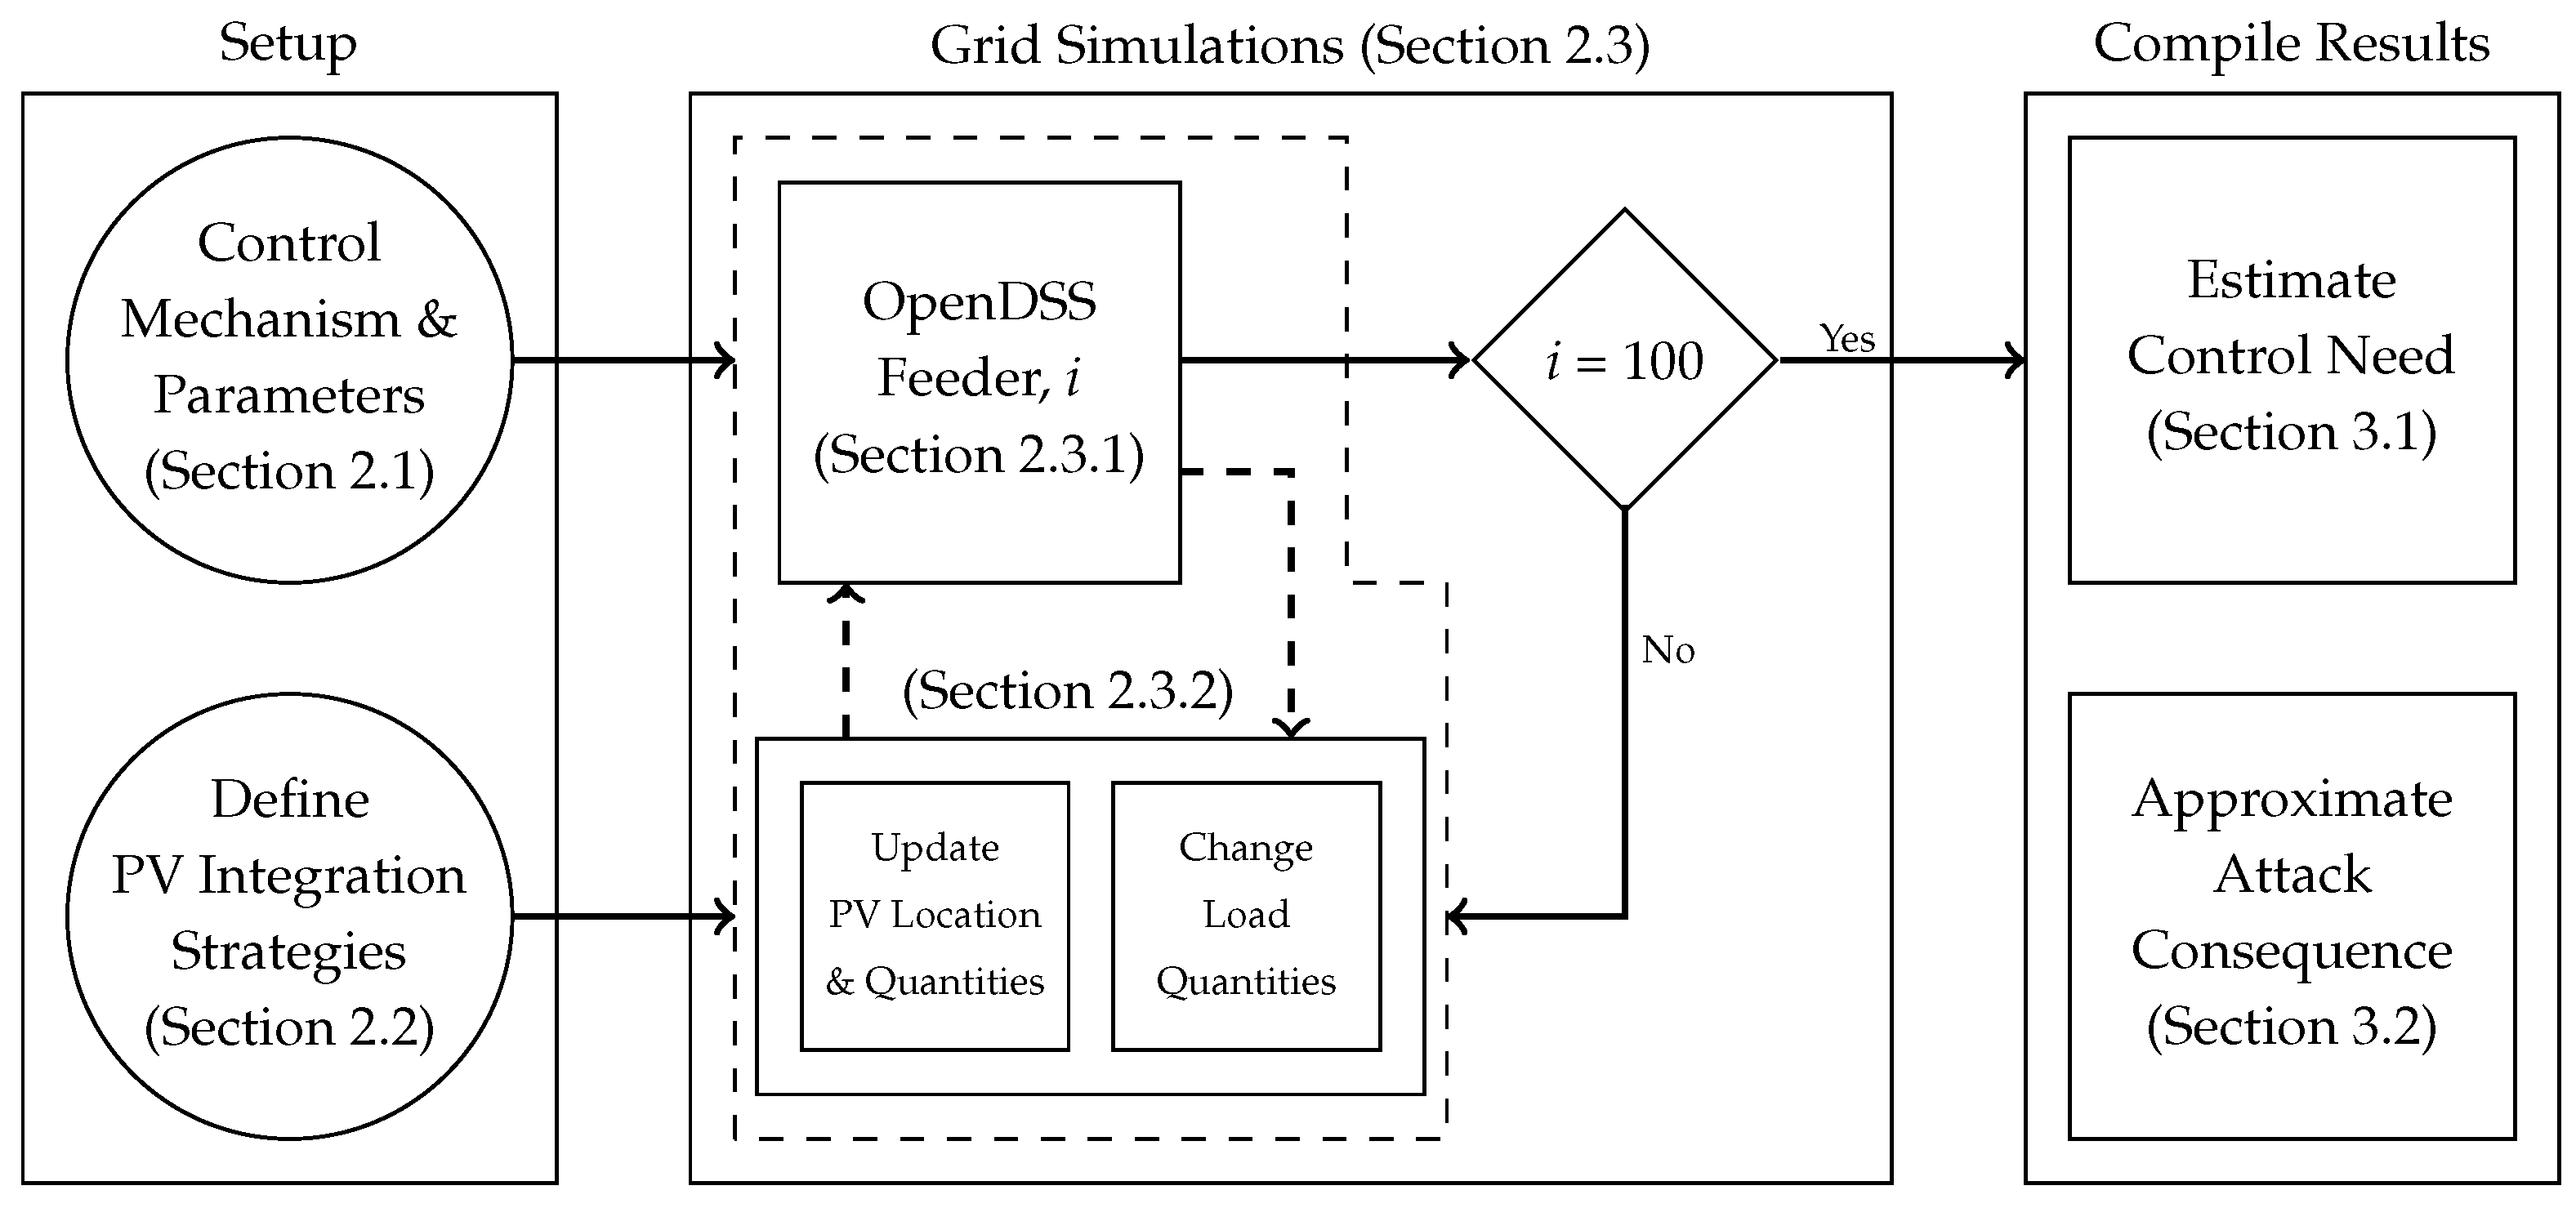
2.3. Grid Simulations
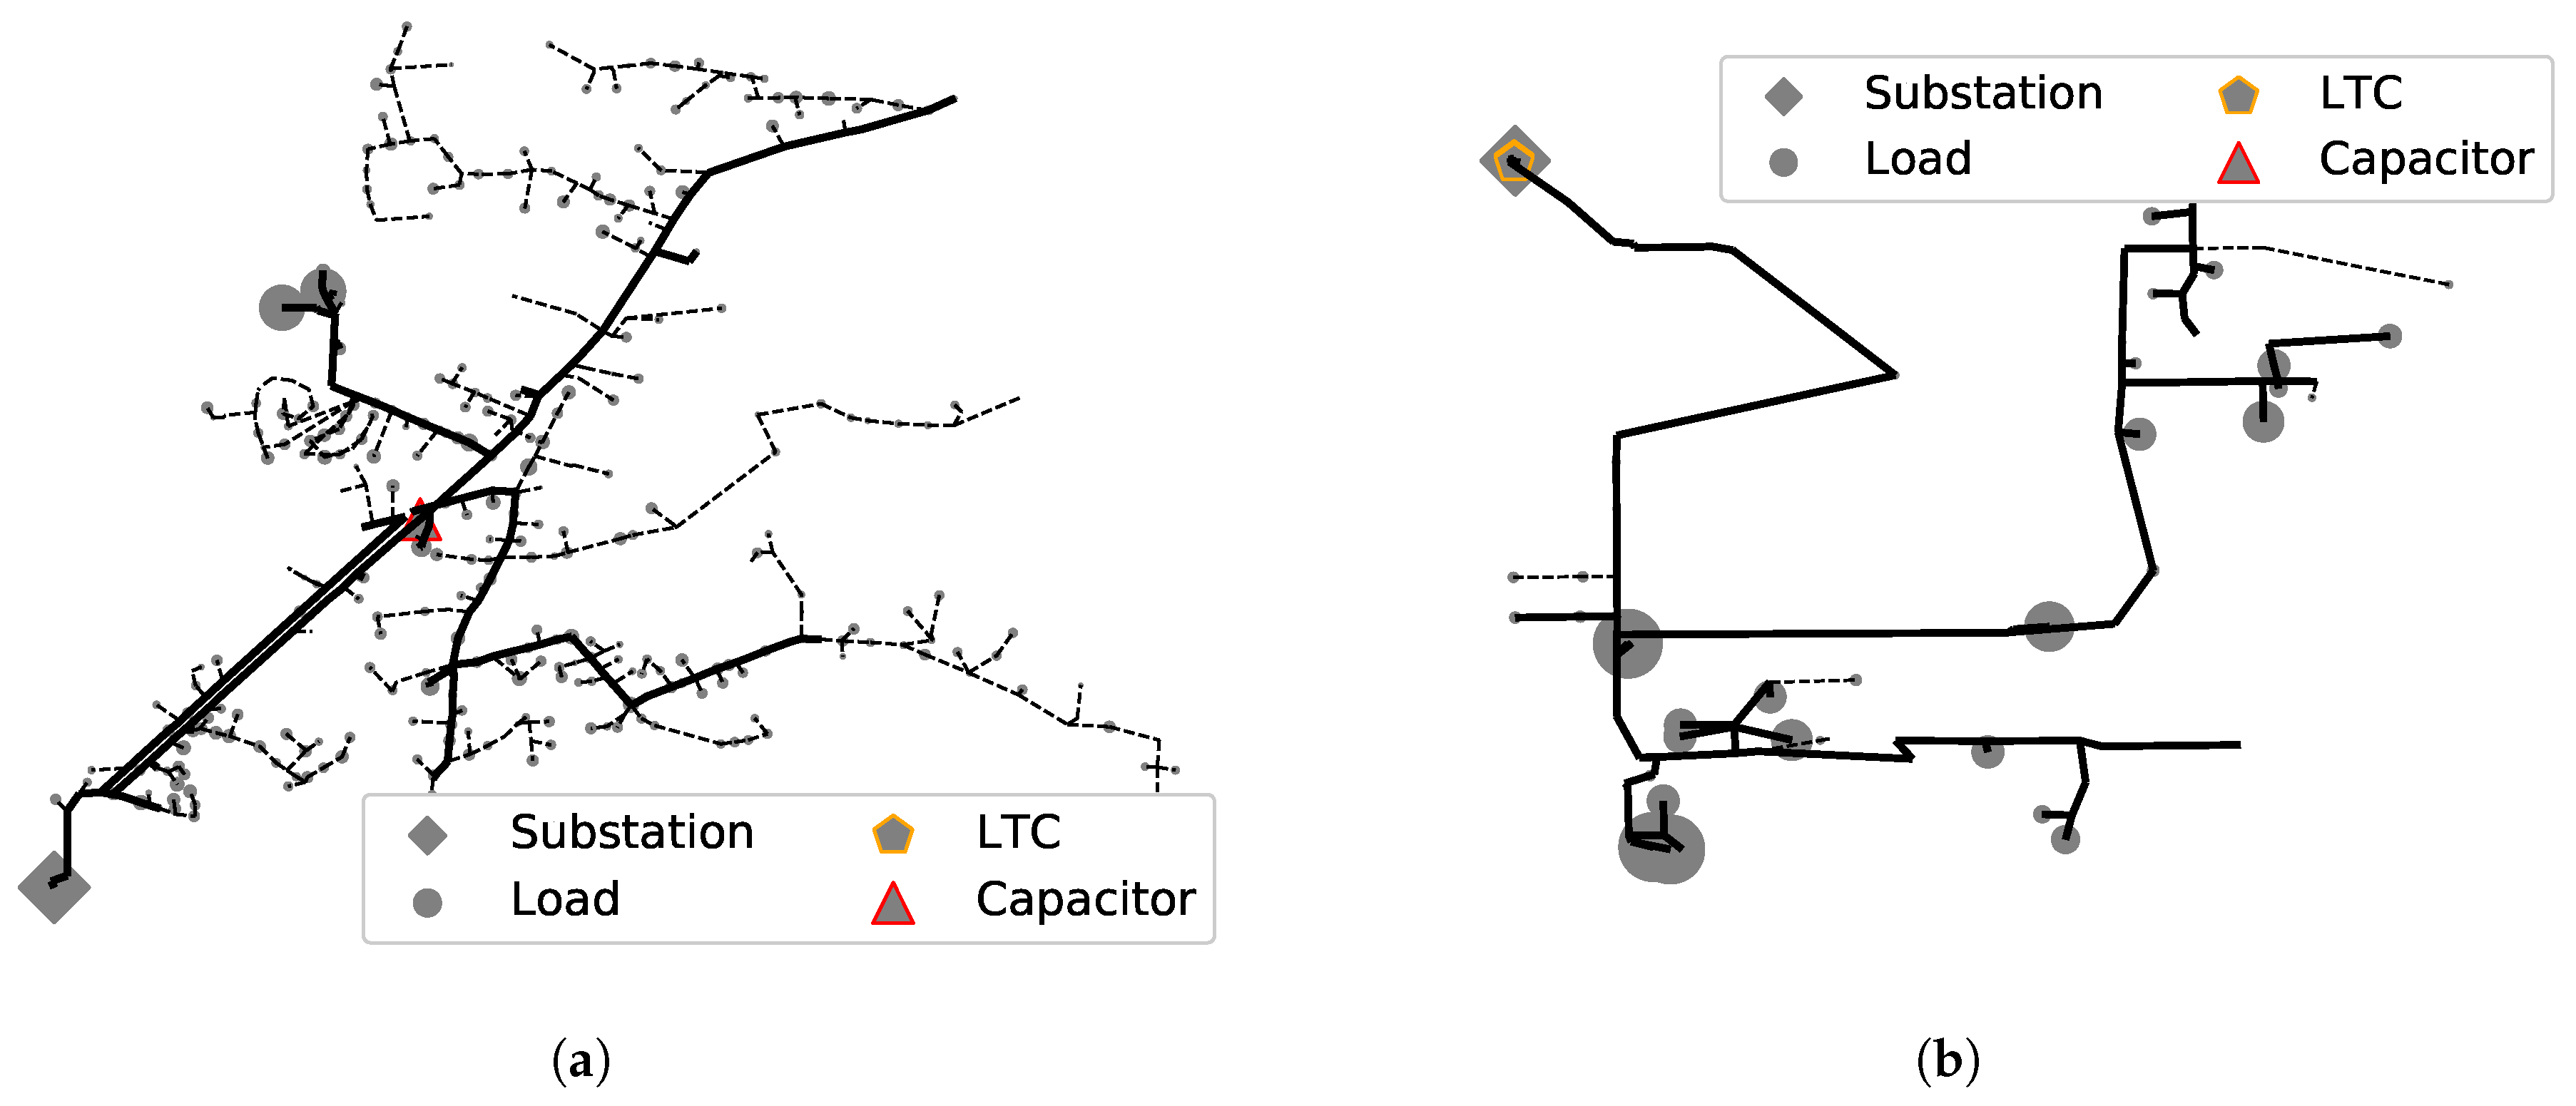
The grid simulations iterated through hundreds of input conditions and output the respective voltage response for each feeder. This paper reviewed the performance of two feeders subjected to a similar range of load and PV generation conditions. Each feeder had different characteristics that could potentially result in varied voltage outputs. The feeders used in this work, included the EPRI K1 feeder, and a representation of an actual system labeled as the Unnamed feeder in this paper.

2.3.1. Feeder Model

The two feeder models, described in Table 1, had different system sizes and configurations, which were anticipated to produce varied voltage response results. Each of the feeder models included both the primary and secondary systems. The K1 feeder, provided by EPRI, had a rated voltage of 12 kV (Figure 4a). It had a total length of about 7 kilometers (km) that connected 321 loads to the substation. The primary system’s voltage was 7.2 kV and dropped to 0.24 kV on the secondary lines. The maximum load for the entire circuit reached 4.8 MW. The system included two devices meant to regulate voltage; it had one LTC regulator and a single 300 kVar SCB. The second feeder had a smaller number of loads, but a higher overall power demand compared to the K1 feeder.
The Unnamed feeder, shown in Figure 4b, represented an actual system. The system supported 39 loads (maximum demand of about 7.9 MW) located at a maximum distance of 4.6 km from the substation. The substation, indicated by the diamond shape in Figure 4b, had a rated voltage of 12 kV and included two LTC regulators. The primary system supplied power at 7.6 kV, which dropped to 0.24 kV and 0.277 kV on the secondary system. Quiroz et al. used the same OpenDSS feeder model to test VVC control strategies that countered the impact of two large PV systems [30]. The model was also used in a cyber-attack consequence tests [14], which described the impact of a potential attack on the VVC at a given integration scenario.

2.3.2. Stochastic Hosting Capacity

The hosting capacity analysis iterated through hundreds of different load and PV generation conditions, and control strategies to understand each feeder’s voltage response. The iterations varied the model inputs by altering the amount of load; each simulation included a different number of PV systems connected to the feeder; the different simulations arbitrarily selected the location for each PV system. The simulations varied the loads between 30% and 120% of the maximum, OpenDSS defined value. The number of PV systems ranged between 10% and 50% of the number of loads in the feeder. The location of each PV system was selected by randomly choosing a subset of the load names at each simulation iteration. To understand the outputs, the voltages were plotted with respect to the relative difference between the load and PV generation power values.
The stochastic hosting capacity results produced the average minimum and maximum, and the mean voltage values for a range of PV generation and load demand scenarios. To appropriately review the voltage results for the different scenarios, the evaluation compared the voltage outputs with the relative difference between the load ( P L o a d ) and the PV generation ( P P V ) as described in Equation (1):
Relative Difference = P L o a d P P V P L o a d
The relative difference accounted for the deviation in load and PV generation at different scales and provided a single reference point to compare with the feeder’s voltage response. The following example highlights this need. The K1 feeder simulation produced a maximum voltage of 1.028 pu when the load equaled 3.808 MW and the PV generation reached 1.907 MW at a relative difference of −0.99. At a similar absolute difference, where the load and PV generation totaled 6.425 MW and 4.483 MW, respectively, the maximum voltage dropped to 1.026 pu and the relative difference equaled −0.43.

3. Results

Unlike past hosting capacity work, the present work describes each feeders voltage management needs when subjected to the integration of small-scale systems at different load and PV generation operating conditions. Detailed stochastic hosting capacity iterations provided a complete review of the systems’ voltage response under normal conditions and during cyber-attack events. This work also provided examples of how the small-scale PV systems changed the voltage by examining primary and secondary voltage profiles.

3.1. Photovoltaic Integration Impact and Control Need

Identification of the control requirements for feeders with distributed PV on building roof-tops included a stochastic hosting capacity assessment (Section 3.1.1). The analysis also reviewed, in Section 3.1.2, the primary and secondary system voltage profiles to highlight the small changes in voltage due to the addition of PV and the reactive power absorption defined by the VVC of the PV inverter. In addition, each of the the feeder’s performance over a potential day was assessed in Section 3.1.3 to provide a sense of actual operations under different operating conditions at a set integration strategy.

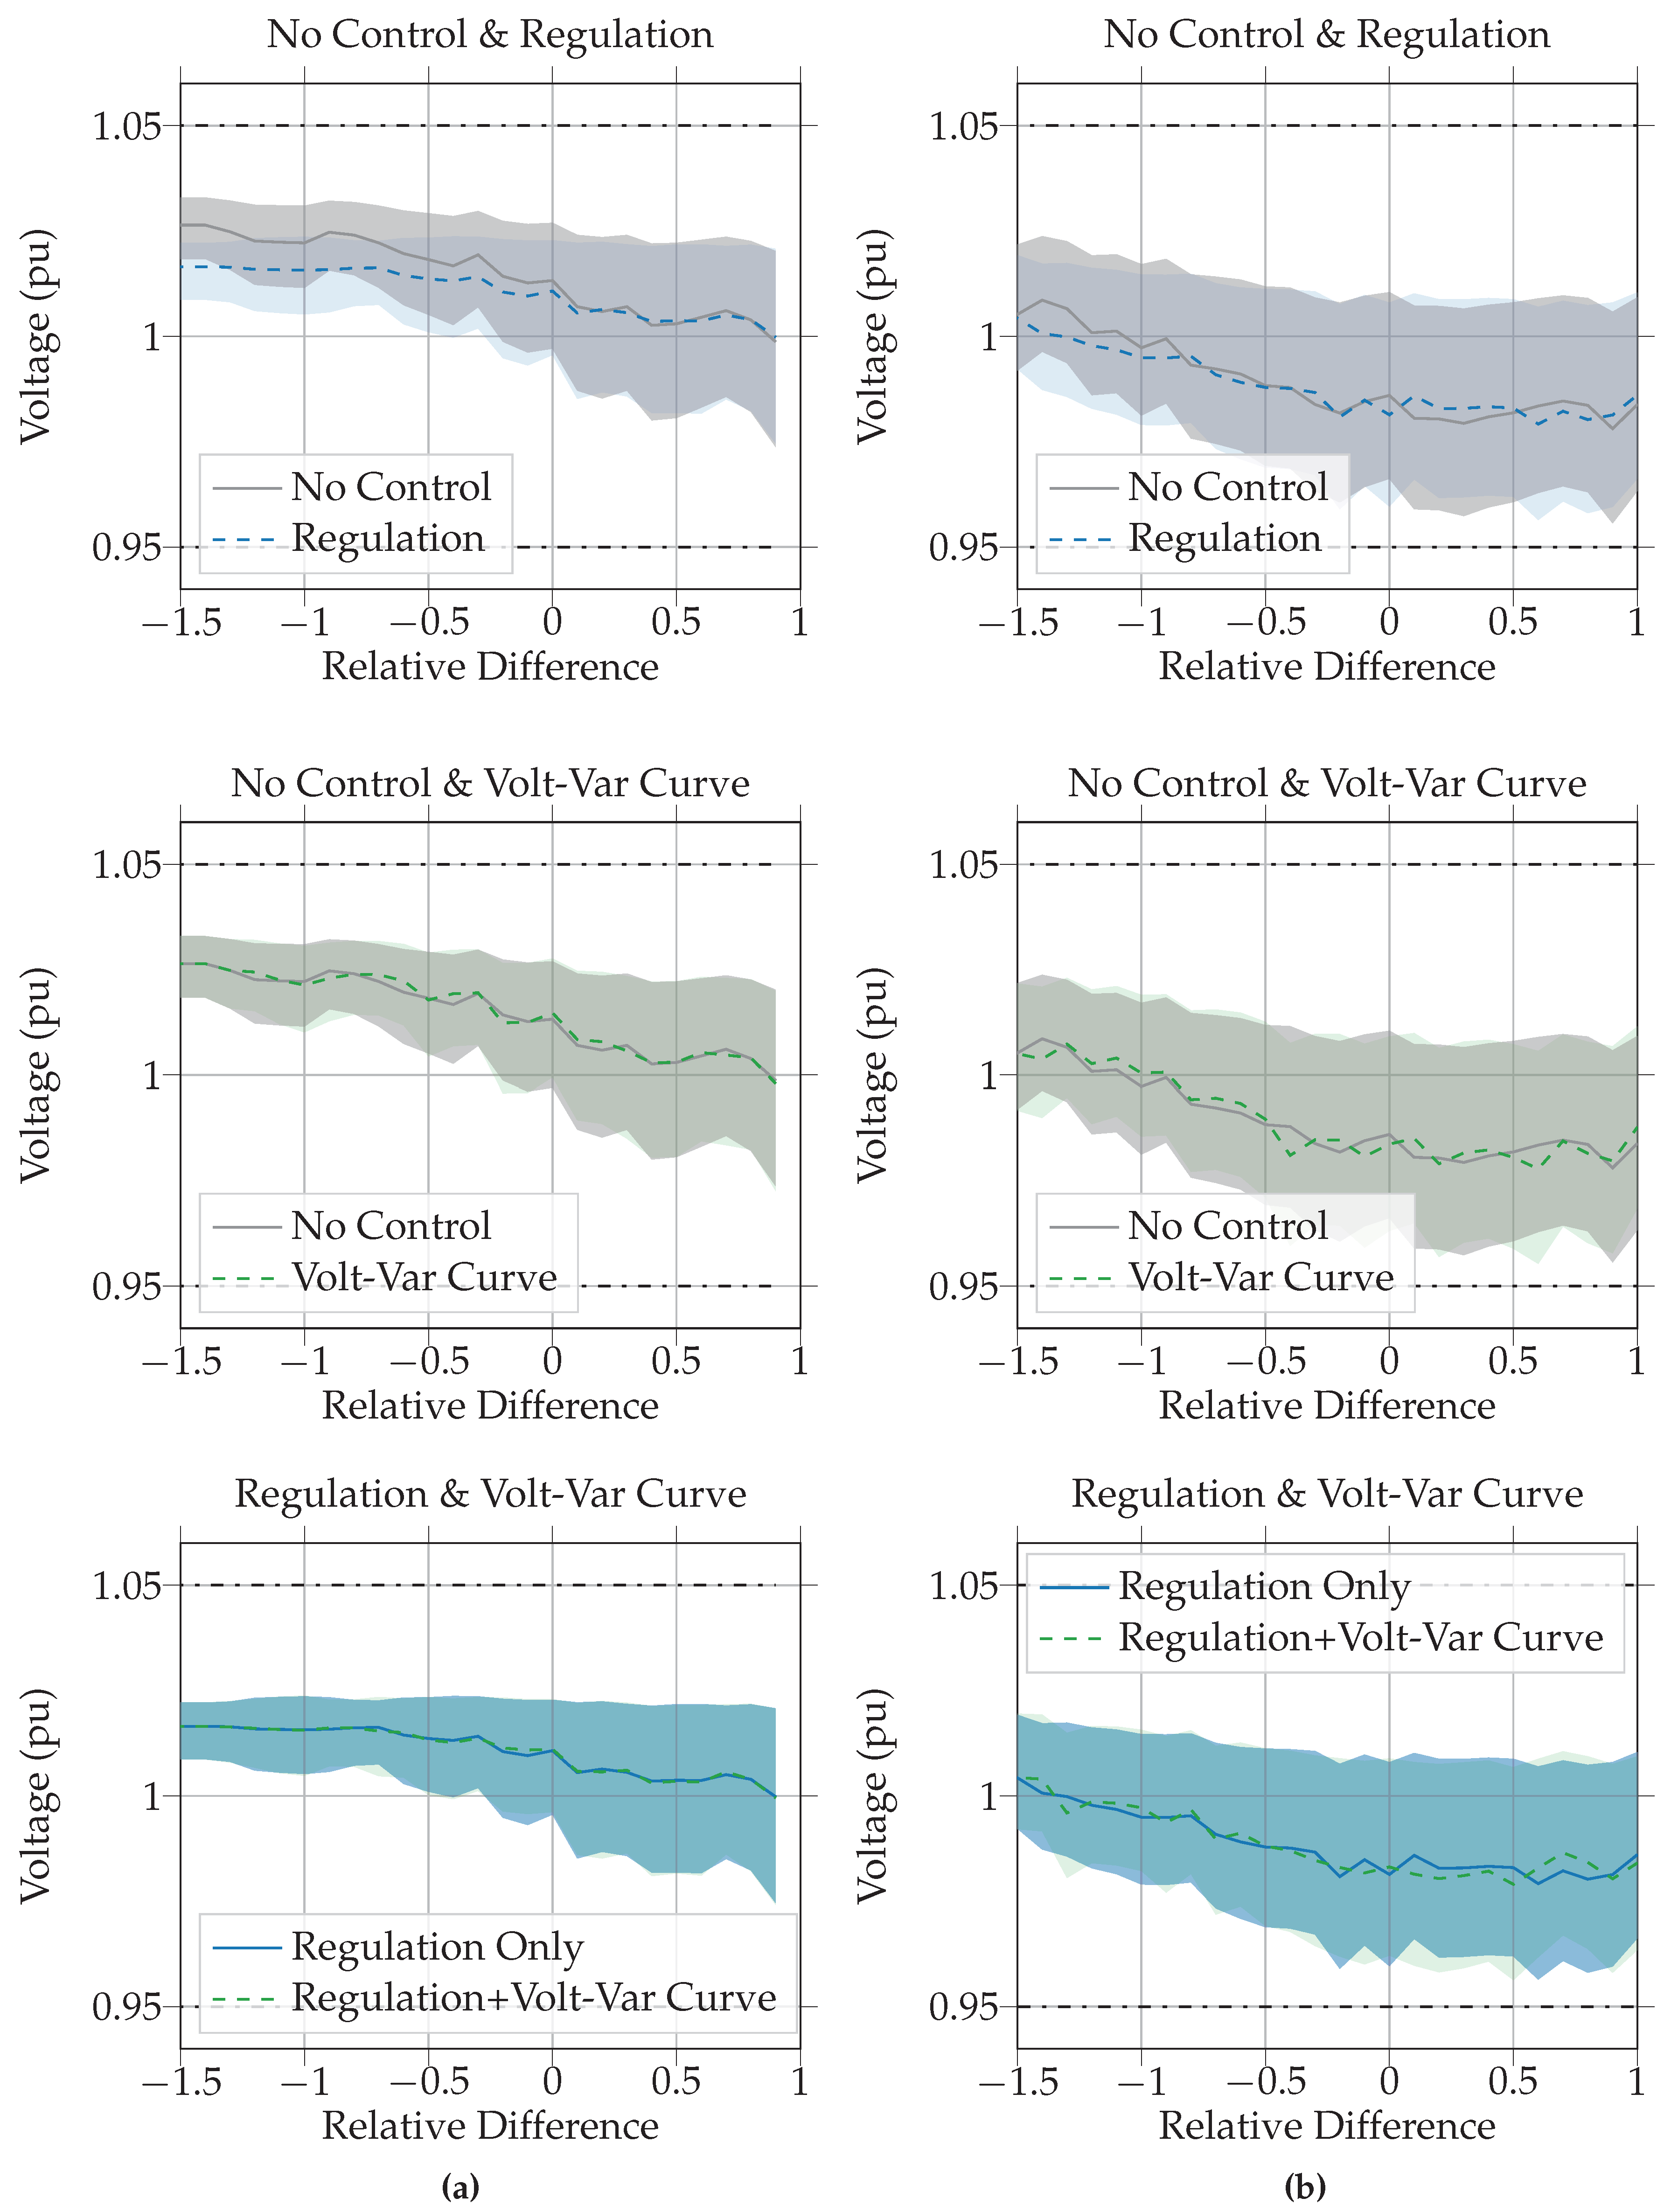
3.1.1. Stochastic Hosting Capacity

The stochastic hosting capacity analysis that iterated through hundreds of random PV integration scenarios at different load cases found that the distributed PV scenario had limited impact on the feeder’s voltage performance. Figure 5 provides an overview of the simulation results by plotting the range (minimum and maximum) and the average of line voltages versus the relative difference for all of the control scenarios. The two columns, in Figure 5, correspond with each of the feeders, and the rows compare simulations that used conventional regulation, VVC control only, and VVC control with conventional regulation with the no control baseline.
The two feeders did not show a significant change in the uncontrolled voltage as the relative difference between the overall load and PV generation decreased. The uncontrolled profiles, shown at the top of Figure 5, had a slope close to 0 when the relative difference was between 0 and 1. Below 0, the profiles followed a slightly upward trend. However, at no point did the uncontrolled voltage exceed the ANSI defined thresholds of 1.05 pu and 0.95 pu. Although unnecessary for avoiding voltage violations, the conventional regulation devices did provide a slight reduction in the maximum voltage.
The conventional regulators caused the voltage to decrease slightly from the baseline case in each of the feeders, as shown at the top of Figure 5. The EPRI K1 feeder used the regulation devices to reduce the voltages on the feeder when the relative difference dropped below 0.25. The Unnamed feeder did not require regulation until the relative difference decreased below −0.75. The results show that the feeders did not require the PV inverters’ VVC control mechanisms to maintain an acceptable voltage.
The iterative simulations that included the VVC control capability did not modify the line voltages (both primary and secondary) by a noticeable amount on average. This is evident in the middle plots of Figure 5. The two feeders voltage profiles for the no control baseline and the simulations with VVC enabled resemble each other very well. The bottom plots in Figure 5 show the voltage response of each feeder when regulation and regulation with VVC were implemented. The plots almost resemble each other exactly. This indicated that the regulation devices provide sufficient support and the VVC did not play a role in managing the feeders voltage. To explore the PV inverters’ VVC impact further, the next section describes example voltage profiles that highlight the extent of the voltage change caused by adding PV generation; the profiles also describe the extent that the VVC defined reactive power from the PV inverters impacts the local voltage.

3.1.2. Voltage Profile Example

To explore the impact that the roof-top PV systems have on each feeder further, the assessment reviewed example voltage profiles when the relative difference was around 0. Voltage profiles that describe the voltage at each bus with respect to the distance from the substation provided a means to compare three cases: (1) no PV systems, (2) PV system with no VVC control, and (3) PV systems with VVC control. To highlight the change in performance for the three cases, a profile of a single path for each of the feeders were analyzed and shown in Figure 6 and Figure 7. The subplots Figure 6a and Figure 7a describe the particular paths for the respective profiles in red. The voltage profiles, shown in subplots Figure 6b and Figure 7b, describe the voltage on the primary and secondary lines. The plots provide a zoomed in window to show the slight difference between the three cases on the secondary lines.
The K1 feeder example profile showed the voltage drop from the substation to a PV system that was about 7 km away from the substation with conventional regulators turned off. In this scenario, where the relative difference was equal to 0.082 the total demand equaled 3815 kW and the overall PV generation reached 3504 kW. The maximum and minimum voltages on the feeder remained the same, at 1.027 pu and 0.984 pu, respectively, for the no PV, PV, and PV with VVC cases. In this case, PV inverters throughout the feeder only absorbed about 1.45 kVar.
The primary system profile for the path in the K1 feeder shown in Figure 6a indicated a gradual drop in voltage for each of the three cases (No PV, PV, and PV with VVC) that plotted almost directly on top of one another (Figure 6b). The secondary system buses, at the end of the line, had a significant drop in voltage. This drop in voltage was expected because of the transformer in-between the primary and secondary systems. The difference between the three cases was very small as shown in extra zoomed in portion of Figure 6b. The simulation with PV did result in a slight increase in voltage. The increase, shown here, did not extend past the dead-band threshold (1.02 pu) of the VVC, which did not cause the PV inverter to absorb reactive power. Therefore, the PV system with VVC capabilities had the same voltage profile as the one that did not include VVC control.
The Unnamed feeder also showed a drop in voltage from the substation to a particular PV system at the edge of the circuit that was about 5 km away from the substation. The voltage profile (Figure 7b) describes the systems response without conventional regulation along the path shown in Figure 7a when the feeder demanded 6387 kW and PV systems generated 6327 kW. Under these conditions the relative difference equaled 0.009 and the maximum and minimum voltages on the feeder for the three cases (No PV, PV, and PV with VVC) were 1.027 pu and 0.966 pu respectively. The feeder minimum voltage dropped below the VVC threshold of 0.98 pu and therefore many of the PV inverters injected reactive power. The PV inverter at the end of the path shown in Figure 7a had a voltage below 0.98 pu without PV and increased only slightly after a PV system was added as shown in Figure 7b. The primary system voltages under the three cases had very similar results. The voltages on the secondary system experienced an increase that brought it closer to the nominal voltage when the PV system was added. The PV system with the VVC control attempted to raise the voltage further, but the low amount of reactive power on the secondary lines resulted in an insignificant change.

3.1.3. Statistical Assessment for Realistic Operations

The snapshot simulations corroborated the stochastic hosting capacity results and found that the integration of PV in a distributed manner did not cause voltage to increase beyond what the conventional regulators could mitigate. The simulation effort subjected the feeders to three similar demand and PV generation conditions as defined by the graph at the bottom of Figure 8. Throughout the day, the simulations held the locations of the PV inverters constant (at 60% of the feeder loads) and altered the amount of solar irradiance. The graph portrays the load and PV in per unit (pu) values, which translates to different power quantities in each feeder. Box plots describe the voltage response for each feeder with various types of control enabled at 9:30 a.m., 12:30 p.m., and 3:30 p.m.
The EPRI K1 and Unnamed feeder simulations produced similar results and did not exhibit voltage issues. For instance at 12:30 p.m., when the PV generation (3.2 MW and 5.7 MW for the EPRI K1 and Unnamed, respectively) exceeded the total load (2.1 MW and 3.0 MW for the EPRI K1 and Unnamed, respectively), both the EPRI K1 and Unnamed feeder did not exceed 1.05 pu in the no regulation case. Any changes in the voltage response due to VVC control could not be observed visually in the box plots for either of the feeders. At 3:30 p.m., the PV generation fell to a very low value while the load increased to its maximum and caused the Unnamed feeder to not need voltage regulators. These results highlight the limited impact that VVC control has on the feeders operations with small PV systems dispersed throughout.

3.2. Cyber-Attack Consequences

Assessment of the cyber-attack risk for VVC control settings found that modifications to the curve’s characteristics did not create a significant shift in voltage. The stochastic hosting capacity results for each of the feeders, shown in Figure 9, indicated that an unnecessary injection of reactive power was minimal and did not alter the system’s voltage. At a relative difference greater than 0, the VVC control did not attempt to inject any reactive power. The EPRI K1 feeder experienced some reactive power injection on the secondary lines from the PV inverters at low relative difference, but was not enough to cause any change in the maximum feeder voltage.

4. Discussion

The simulations found that PV intent on countering the local building’s energy does not have a significant influence on the overall systems voltage. As a result, VVC control embedded inside PV inverters had an insignificant role in voltage management. Also, a wide spread attack on each PV inverters’ VVC settings interconnected to either of the two feeders will most likely not cause a significant problem, especially when regulators are enabled. However, the experiment did not consider the VVC overall impact on the system’s conventional control functions.
The methodology used in this paper focused on the voltage response at different load and PV generation conditions and did not consider VVC control’s long-term impact on LTC’s performance. Enabling VVC controls in PV inverters could potentially ease the voltage management burden on the LTCs by reducing the number of tap changes and thus extend the life of the device. The methodology used in this work could be expanded to include a review of LTC operations. For example, the OpenDSS simulation outputs could include the number of tap changes performed under each operating condition and control type—or, to investigate other PV integration types, the methodology could be expanded to consider the impact of large-scale PV systems.
Large PV systems, installed at one or more locations on the feeder’s primary lines, will have a more significant impact in comparison to smaller systems distributed throughout the secondary lines. For instance, as Quiroz et al. showed in [30], two 750 kW systems connected to the Unnamed feeder can cause the voltage to respond significantly and the VVC reactive power control can help manage the voltage.
For example, Figure 10c shows the path from the substation to the two PV systems installed at the same locations as the experiment documented by Quiroz et al. [30]. Using the same PV system sizes and reducing the loads to 20% of their maximum value, this paper describes the impact of PV with and without conventional regulation. The initial simulation found that along the defined path (Figure 10c) the voltage profile followed a downward trajectory when no PV was added to the system that reached a low of about 1.028 pu and 1.041 pu for the simulations without and with regulation respectively (Figure 10a,b). When operating with the PV systems at full capacity (1500 kW) the voltage along the path initially decreased until about 2.75 km and then increased to a maximum of 1.051 pu in the no regulation case (Figure 10a) and 1.039 pu with regulation enabled (Figure 10b). The VVC provided some voltage support that reduced the maximum voltage in the no regulation case to 1.043 pu by absorbing 264 kVar and 1.034 pu without regulators by absorbing 455 kVar.
The stochastic hosting capacity analysis, depicted in Figure 1, can be used to assess the integration of large-scale PV systems at different locations on a feeder. The assessment of large-scale systems could include a similar setup with the same type of control mechanism and parameters. However, the PV integration strategy definition would be different and instead include pre-determined locations and PV sizes that do not correspond with nearby loads. The grid simulation stage would be very similar and would include iterations where the PV locations and quantities change, while the load amounts also fluctuate. In the end, similar results could be produced and processed to estimate the control need and approximate the attack consequences.

5. Conclusions

The analysis presented here quantified the impact of small-scale PV generators dispersed throughout two feeders. The experiment included two key findings:
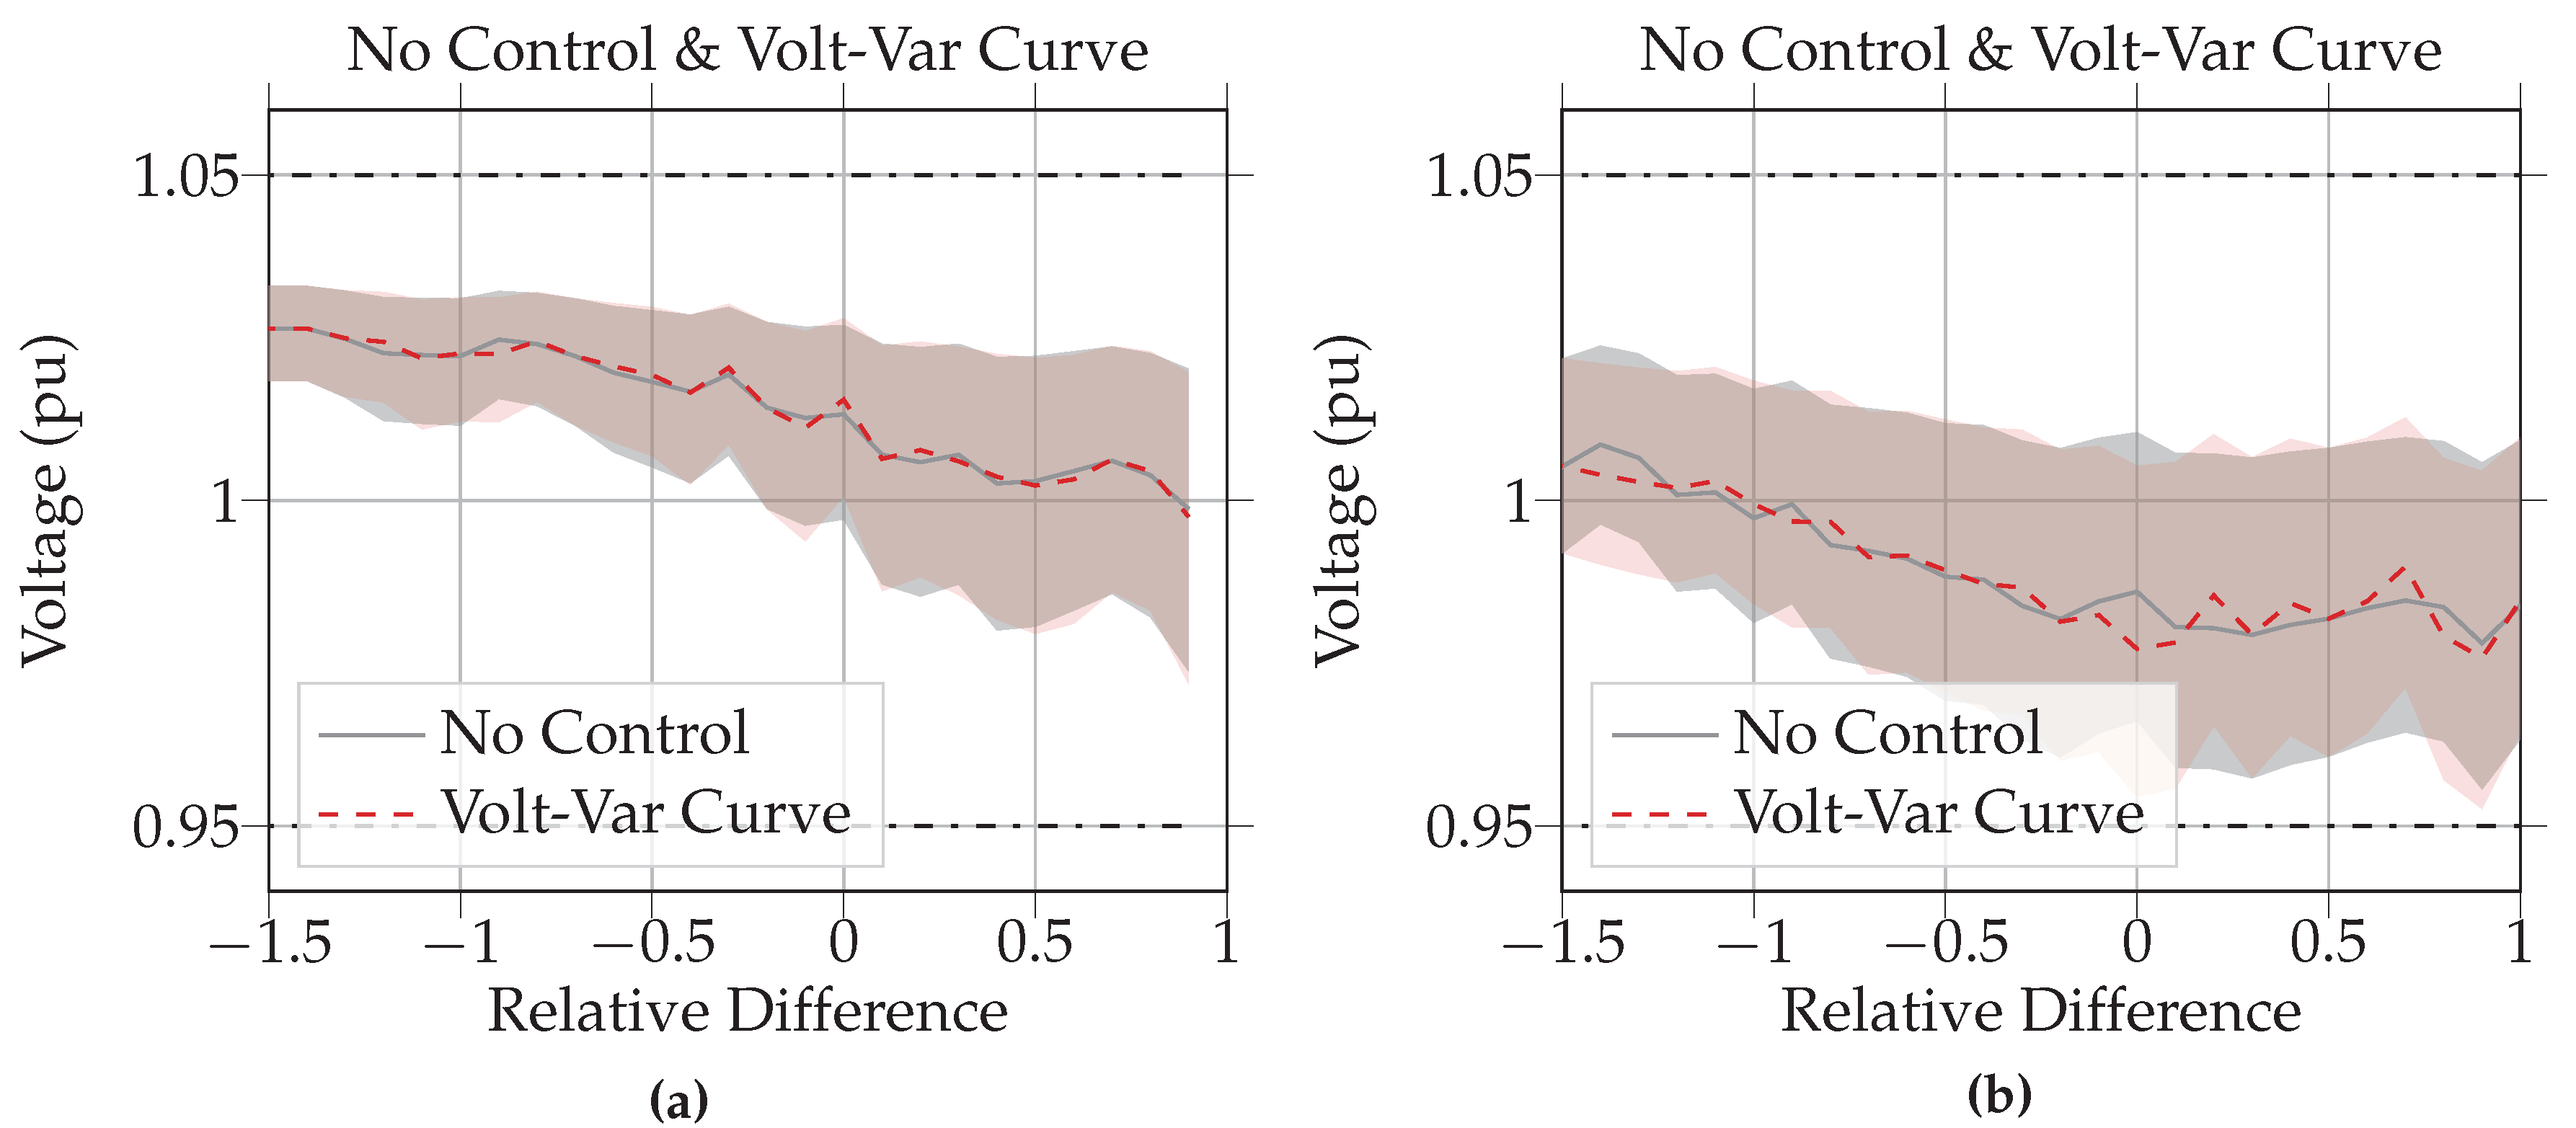
  • The maximum voltage on the two feeders rose only slightly as the relative difference decreased.
  • VVC control did not play a role in managing the voltage for the two feeders.
These results confirmed our hypothesis that the small-scale systems installed on the secondary system of the feeders would have little to no impact on the overall voltage. This was quantified using the stochastic hosting capacity analysis. A similar approach can be used in future work to explore the integration of single or multiple large PV plants sized independently of the nearby building loads.

Author Contributions

Writing–review and editing, A.S., R.D.-Z., S.H.-M.; project administration, S.H.-M.; conceptualization, C.B.J.; methodology, C.B.J.; formal analysis, M.L., M.J.R., C.B.J.; visualization, C.B.J. All authors have read and agreed to the published version of the manuscript.

Funding

This material is based upon work supported by the U.S. Department of Energy’s Office of Energy Efficiency and Renewable Energy (EERE) under Solar Energy Technologies Office (SETO) Agreement Number DE-NA0003525.

Acknowledgments

Sandia National Laboratories is a multimission laboratory managed and operated by National and Engineering Solutions of Sandia, LLC., a wholly owned subsidiary of Honeywell International, Inc., for the U.S. Department of Energy’s National Nuclear Security Administration under contract DE-NA0003525.

Conflicts of Interest

The paper describes objective technical results and analysis. Any subjective views or opinions that might be expressed in the paper do not necessarily represent the views of the U.S. Department of Energy or the United States Government.

References

  1. Available online: https://webstore.ansi.org/standards/nema/ansic842016 (accessed on 18 August 2020).
  2. Padullaparti, H.V.; Nguyen, Q.; Santoso, S. Advances in volt-var control approaches in utility distribution systems. In Proceedings of the 2016 IEEE Power and Energy Society General Meeting (PESGM), Boston, MA, USA, 17–21 July 2016; pp. 1–5. [Google Scholar] [CrossRef]
  3. Basso, T.; Chakraborty, S.; Hoke, A.; Coddington, M. IEEE 1547 Standards advancing grid modernization. In Proceedings of the 2015 IEEE 42nd Photovoltaic Specialist Conference (PVSC), New Orleans, LA, USA, 14–19 June 2015; pp. 1–5. [Google Scholar] [CrossRef]
  4. 1547-2018-IEEE Standard for Interconnection and Interoperability of Distributed Energy Resources with Associated Electric Power Systems Interfaces; IEEE: Piscataway, NJ, USA, 2018.
  5. Smith, J.W.; Sunderman, W.; Dugan, R.; Seal, B. Smart inverter volt/var control functions for high penetration of PV on distribution systems. In Proceedings of the 2011 IEEE/PES Power Systems Conference and Exposition, Phoenix, AZ, USA, 20–23 March 2011; pp. 1–6. [Google Scholar] [CrossRef]
  6. Tang, N.C.; Chang, G.W. A stochastic approach for determining PV hosting capacity of a distribution feeder considering voltage quality constraints. In Proceedings of the 2018 18th International Conference on Harmonics and Quality of Power (ICHQP), Ljubljana, Slovenia, 13–16 May 2018; pp. 1–5. [Google Scholar] [CrossRef]
  7. Rossi, M.; Viganò, G.; Moneta, D.; Clerici, D. Stochastic evaluation of distribution network hosting capacity: Evaluation of the benefits introduced by smart grid technology. In Proceedings of the 2017 AEIT International Annual Conference, Cagliari, Italy, 20–22 September 2017; pp. 1–6. [Google Scholar] [CrossRef]
  8. Vukojevic, A.; Frey, P.; Smith, M.; Picarelli, J. Integrated volt/var control using single-phase capacitor bank switching. In Proceedings of the 2013 IEEE PES Innovative Smart Grid Technologies Conference (ISGT), Washington, DC, USA, 24–27 February 2013; pp. 1–7. [Google Scholar] [CrossRef]
  9. Juamperez, M.; Yang, G.; Kjær, S.B. Voltage regulation in LV grids by coordinated volt-var control strategies. J. Mod. Power Syst. Clean Energy 2014, 2, 319–328. [Google Scholar] [CrossRef] [Green Version]
  10. O’Connell, A.; Keane, A. Volt–var curves for photovoltaic inverters in distribution systems. IET Gener. Transm. Distrib. 2017, 11, 730–739. [Google Scholar] [CrossRef]
  11. Johnson, J. PV Cybersecurity Final Report; Technical Report SAND2019-0494R; Sandia National Laboratories: Albuquerque, NM, USA, 2019.
  12. Carter, C.; Onunkwo, I.; Cordeiro, P.; Johnson, J. Cyber Security Assessment of Distributed Energy Resources. In Proceedings of the 2017 IEEE 44th Photovoltaic Specialist Conference (PVSC), Washington, DC, USA, 25–30 June 2017; pp. 2135–2140. [Google Scholar] [CrossRef]
  13. Chavez, A.; Lai, C.; Jacobs, N.; Hossain-McKenzie, S.; Jones, C.B.; Johnson, J.; Summers, A. Hybrid Intrusion Detection System Design for Distributed Energy Resource Systems. In Proceedings of the 2019 IEEE CyberPELS (CyberPELS), Knoxville, TN, USA, 29 April–1 May 2019; pp. 1–6. [Google Scholar] [CrossRef]
  14. Johnson, J.; Quiroz, J.; Concepcion, R.; Wilches-Bernal, F.; Reno, M.J. Power system effects and mitigation recommendations for DER cyberattacks. IET Cyber Phys. Syst. Theory Appl. 2019, 4, 240–249. [Google Scholar] [CrossRef]
  15. Dubey, A.; Santoso, S.; Maitra, A. Understanding photovoltaic hosting capacity of distribution circuits. In Proceedings of the 2015 IEEE Power Energy Society General Meeting, Denver, CO, USA, 26–30 July 2015; pp. 1–5. [Google Scholar] [CrossRef]
  16. Coogan, K.; Reno, M.J.; Grijalva, S.; Broderick, R.J. Locational dependence of PV hosting capacity correlated with feeder load. In Proceedings of the 2014 IEEE PES T D Conference and Exposition, Chicago, IL, USA, 14–17 April 2014; pp. 1–5. [Google Scholar] [CrossRef]
  17. Stanfield, S.; Stephanie, S. Optimizing the Grid: Regulator’s Guide to Hosting Capacity Analyses for Distributed Energy Resources; Technical Report; Interstate Renewable Energy Council: Latham, NY, USA, 2017. [Google Scholar]
  18. Reno, M.J.; Coogan, K.; Seuss, J.; Broderick, R.J. Novel Methods to Determine Feeder Locational PV Hosting Capacity and PV Impact Signatures; Technical Report SAND2017-4954; Sandia National Lab. (SNL-NM): Albuquerque, NM, USA, 2017. [Google Scholar] [CrossRef]
  19. Seuss, J.; Reno, M.J.; Broderick, R.J.; Grijalva, S. Improving distribution network PV hosting capacity via smart inverter reactive power support. In Proceedings of the 2015 IEEE Power Energy Society General Meeting, Denver, CO, USA, 26–30 July 2015; pp. 1–5. [Google Scholar] [CrossRef]
  20. Smith, J.W.; Dugan, R.; Rylander, M.; Key, T. Advanced distribution planning tools for high penetration PV deployment. In Proceedings of the 2012 IEEE Power and Energy Society General Meeting, San Diego, CA, USA, 22–26 July 2012; pp. 1–7. [Google Scholar] [CrossRef]
  21. Rylander, M.; Smith, J.; Lewis, D.; Steffel, S. Voltage impacts from distributed photovoltaics on two distribution feeders. In Proceedings of the 2013 IEEE Power Energy Society General Meeting, Vancouver, BC, Canada, 21–25 July 2013; pp. 1–5. [Google Scholar] [CrossRef]
  22. Smith, J. Stochastic Analysis to Determine Feeder Hosting Capacity for Distributed Solar PV; Technical Report 1026640; Electric Power Research Institute: Palo Alto, CA, USA, 2012. [Google Scholar]
  23. Rylander, M.; Smith, J.; Sunderman, W. Streamlined Method for Determining Distribution System Hosting Capacity. IEEE Trans. Ind. Appl. 2016, 52, 105–111. [Google Scholar] [CrossRef]
  24. Rylander, M.; Smith, J.; Sunderman, W.; Smith, D.; Glass, J. Application of new method for distribution-wide assessment of Distributed Energy Resources. In Proceedings of the 2016 IEEE/PES Transmission and Distribution Conference and Exposition (T D), Dallas, TX, USA, 3–5 May 2016; pp. 1–5. [Google Scholar] [CrossRef]
  25. Ismael, S.M.; Abdel Aleem, S.H.E.; Abdelaziz, A.Y.; Zobaa, A.F. State-of-the-art of hosting capacity in modern power systems with distributed generation. Renew. Energy 2019, 130, 1002–1020. [Google Scholar] [CrossRef]
  26. Rylander, M.; Smith, J.; Rogers, L. Impact Factors, Methods, and Considerations for Calculating and Applying Hosting Capacity; Technical Report 3002011009; Electric Power Research Institute: Palo Alto, CA, USA, 2018. [Google Scholar]
  27. Commercial and Residential Hourly Load Profiles for All TMY3 Locations in the United States-OpenEI DOE Open Data. Library Catalog: openei.org. Available online: https://openei.org/doe-opendata/dataset/commercial-and-residential-hourly-load-profiles-for-all-tmy3-locations-in-the-united-states (accessed on 30 April 2020).
  28. Dobos, A.P. PVWatts Version 5 Manual; Technical Report NREL/TP-6A20-62641; National Renewable Energy Lab. (NREL): Golden, CO, USA, 2014. [CrossRef] [Green Version]
  29. Holmgren, W.; Hansen, C.; Mikofski, M. pvlib python: A python package for modeling solar energy systems. J. Open Source Softw. 2018, 3, 884. [Google Scholar] [CrossRef] [Green Version]
  30. Quiroz, J.E.; Reno, M.J.; Lavrova, O.; Byrne, R.H. Communication requirements for hierarchical control of volt-VAr function for steady-state voltage. In Proceedings of the 2017 IEEE Power Energy Society Innovative Smart Grid Technologies Conference (ISGT), Washington, DC, USA, 23–26 April 2017; pp. 1–5. [Google Scholar] [CrossRef]
Figure 1. The experiment included three key stages: (1) setup the simulation inputs, (2) simulations, and (3) compilation of results. The setup stage involved the definition of voltage control and photovoltaic integration strategies. The simulation effort ran OpenDSS in an iterative process that updated photovoltaic and load quantities, and randomly changed the location of the distributed photovoltaic systems. Compilation of the model results determined the control needs and approximated the cyber-attack consequences.
Energies 13 04303 g001
Figure 2. All of the distributed PV inverters used the normal and malicious VVC to emulate good and bad behavior. The normal VVCs defined a negative reactive power when the voltage exceeded 1.02 pu, while the malicious curves dictated a positive reactive power.
Energies 13 04303 g002
Figure 3. The residential and commercial building’s photovoltaic (PV) systems each generated a maximum amount of power that was larger than the load. The PV systems were sized to offset the annual energy consumption and therefore did not match the load on a daily basis. For each building type, the maximum generated PV power exceeded the largest load demand by a factor of 135%. (a) Residential building’s estimated load reached a maximum in July (blue star) and the PV generation largest value occurred in April (orange star). (b) The commercial building’s maximum daily load occurred in Febuary (blue star) and the highest power generation of the PV happened in April (orange star).
Energies 13 04303 g003
Figure 4. The two feeders used in this work included the EPRI K1, and an Unnamed feeder. The EPRI K1 feeder provided power to 321 loads and included one LTC and one SCB. The Unnamed feeder connected 39 loads to the substation and had two LTCs. (a) EPRI K1 Feeder; (b) Unnamed Feeder.
Energies 13 04303 g004
Figure 5. The voltage response of the EPRI K1 (a) and the Unnamed feeder (b) showed that the distributed, roof-top systems had very little impact on the systems overall voltage. Furthermore, the observed voltage increases were mitigated using the conventional regulation devices. The Volt-Var Curve reactive power control in each of the PV inverters did not provide any voltage support.
Energies 13 04303 g005
Figure 6. The voltage profile from the substation to a single phase PV system at the edge of the K1 feeder. The PV generation on the secondary system caused a very small increase in voltage and an even smaller change in voltage when the VVC was enabled. (a) feeder map and path for voltage profile; (b) the voltage profile for primary and secondary lines with and without PV and with Volt-Var Curve control.
Energies 13 04303 g006
Figure 7. The Unnamed feeder’s voltage profile showed a significant drop from the substation to the PV system at the edge of the grid. The additional PV system caused a slight increase in voltage to occur that was only mitigated slightly by VVC controls. (a) feeder map and path for voltage profile; (b) the voltage profile for primary and secondary lines with and without PV and with Volt-Var Curve control.
Energies 13 04303 g007
Figure 8. Box plots show each feeders’ overall voltage response to the corresponding load and distributed photovoltaic (PV) generation given in a per unit (pu) value. The EPRI K1 and Unnamed feeders’ voltage remained relatively constant throughout the day and resided closer to nominal with the help of conventional regulators.
Energies 13 04303 g008
Figure 9. Implementation of the malicious Volt-Var Curves (VVC) that stipulate the injection of reactive power at high voltage, did not result in any voltage issues. (a) EPRI K1 Feeder; (b) Unnamed Feeder.
Energies 13 04303 g009
Figure 10. Two large systems located at the end of the path described in (c) caused the voltage to increase. Enabling the Volt-Var curve capabilities in each of the PV systems and using the conventional regulators provided voltage support that avoided a voltage violation. (a) Voltage Profile w/out Regulation; (b) Voltage Profile w/Regulation; (c) Voltage Profile Path.
Energies 13 04303 g010
Table 1. Feeder characteristics.
FeederVoltage Rating (kV)Length (km)Max. Load Demand (MW)Number of LoadsVoltage Regulation Device
EPRI K11274.8321Capcitor
Unnamed124.67.939Load Tap Changer, Capacitor

