1. Introduction
Global warming is a real problem. The emission of greenhouse gases into the atmosphere, mainly derived from industrial activity, has caused the Earth’s temperature to rise 1
C above the pre-industrial level [
1]. In this context, the design and control of future electric power systems play a fundamental role. As a matter of fact, several authors have discussed the feasibility and viability of reaching 100% renewable-electricity systems [
2,
3], as well as energy policies that minimize dependence on fossil fuels [
4]. It is well-known that Renewable Energy Sources (RES) are displacing conventional power plants from the generation mix [
5]. However, in contrast to conventional generation, RES are considered non-dispatchable sources of energy, as they depend on meteorological conditions to produce their output power. This means that RES power forecasting is volatile and, to a certain extent, unpredictable [
6]. Apart from the energy allocation problem, the displacement of synchronous generators by renewable ones involves the deterioration of some ancillary services such as frequency control. RES used to be interfaced with the utility grid via power electronics, which have no rotational parts and therefore do not contribute to the total inertia of the power system. Inertia is a fundamental parameter that directly affects the frequency nadir and the rate of change of frequency following a power unbalance between generation and demand, both key issues in the operation of electric power systems [
7]. Due to the above mentioned, grid codes are starting to demand ancillary services from the main RES—wind and solar photovoltaics [
8,
9].
It has been proved [
10] that wind turbines can emulate inertia by using the kinetic energy stored in their rotating mass. However, a different approach must be examined in solar photovoltaic (PV) plants, as they do not have any moving elements. In the last years, two different strategies have been mainly investigated in order to smooth PV output power fluctuations [
11,
12]: equipping PV plants with Battery Energy Storage Systems and introducing power curtailment. Although the latter approach implies energy waste, it is interesting due to its low initial investment and its simpler implementation. In photovoltaic applications, power curtailment methods basically consist of operating PV modules below their available Maximum Power Point (MPP). While working in a deloaded mode, it is crucial to estimate the operating
curve and/or the actual MPP, and several methods have been proposed in the literature to estimate them in real-time.
In Reference [
13], a recursive least squares curve fitting algorithm is applied to a large number of measurements to estimate, in real-time, the MPP and the current-voltage characteristic while operating suboptimally on the right hand side of the
curve. This method is assisted by ripple control, to ensure an appropriate window measurement. Although operation at higher voltage improves the dc-dc converter efficiency, stable operation is not guaranteed in case of sudden changes in the incoming irradiance. In Reference [
14], a combination of a Maximum Power Point Tracking (MPPT) algorithm and the Constant Power Generation mode was implemented, based on the following idea—a PV string, denoted as a master, is operated in the MPPT mode and, therefore, its production is considered the maximum available power. The rest of PV strings, called slaves, regulate their power production in order to meet the active power reserve requirements. The slave strings are controlled by a modified Perturb and Observe algorithm and their voltage is regulated at the left side of the MPP, so the operation is stable also in fast decreasing irradiance conditions. This method needs a communication system between the master and slave strings. Moreover, PV panels in the strings must be identical, which is not always achievable due to aging and partial shading conditions. In Reference [
15], an offline calculation of a 3-D lookup table is performed. Then, in real-time, the table takes the photovoltaic power command, and the actual temperature and irradiance measurements, to determine the PV voltage that produces the desired power. In this method, the PV system operates on the right part of the
curve, controlled by direct voltage control. Although the trilinear interpolation has very high accuracy, additional equipment is required to achieve a precise temperature and irradiance measurements, which would increment the cost of the system. In Reference [
16], a simple technique is developed to estimate the MPP in real-time. It is based on the measurement of only two voltage-current points in the Constant Current Region, where the
curve is almost linear. Then, the shortcircuit current can be easily calculated and finally, the MPP is obtained through an empirical expression. This method is fast and straightforward, but it suffers from instability in the presence of measurement noise. From the above reviewed, a research gap has been identified: there is no consensus in which is the most appropriate side for operating the photovoltaic system in the curtailed mode. As both sides have advantages and drawbacks, a new approach is presented in this work. The proposed strategy is able to operate the PV system indistinctly on the left or right part of the
curve, depending on the needs. While operating in the deloaded mode, the actual
characteristic and MPP are estimated through nonlinear least squares curve fitting.
Table 1 summarizes the main features of the existing and the proposed methods.
As can be seen in
Table 1, the developed strategy is the only one that can operate the PV array indistinctly on both parts of the
curve. Several authors have discussed the convenience of operating the PV system on the left or the right sides of the
curve. Both locations have advantages and drawbacks, as explained in the following. If the PV module operates on the right-hand side, the dc-dc converter works at a higher voltage level, which means higher converter efficiency. Furthermore, the right operation allows a wider power regulation, from 0% to 100% [
13]. However, the left-hand side is preferable in case of fluctuating irradiance conditions [
16].
Figure 1 details this situation. Let us suppose that the operating point of the PV module is point 1, and therefore the generated power is equal to
. In these conditions, if the system operator imposes a power reserve level of 50%, there are two possible operating points with
—point 2 and point 3. While operating at point 2, if there is a sudden decrease in irradiance, the operation point falls to 4, which is a stable point. However, when there is a sudden drop of irradiance, and if point 3 is chosen to operate at
, the operating point falls to 5, with no power production. Thus, in some circumstances, it is preferable to operate on the right part of the
curve, and in some others, on the left. The method presented in this paper allows left and right side operation.
Section 2 describes the PV model used.
Section 3 analyzes the curve fitting problem.
Section 4 details the design of the voltage control system.
Section 5 presents simulation results showing the method performance. Finally,
Section 6 draws conclusions from the work.
2. Modeling of Photovoltaic Cell, Module and Array
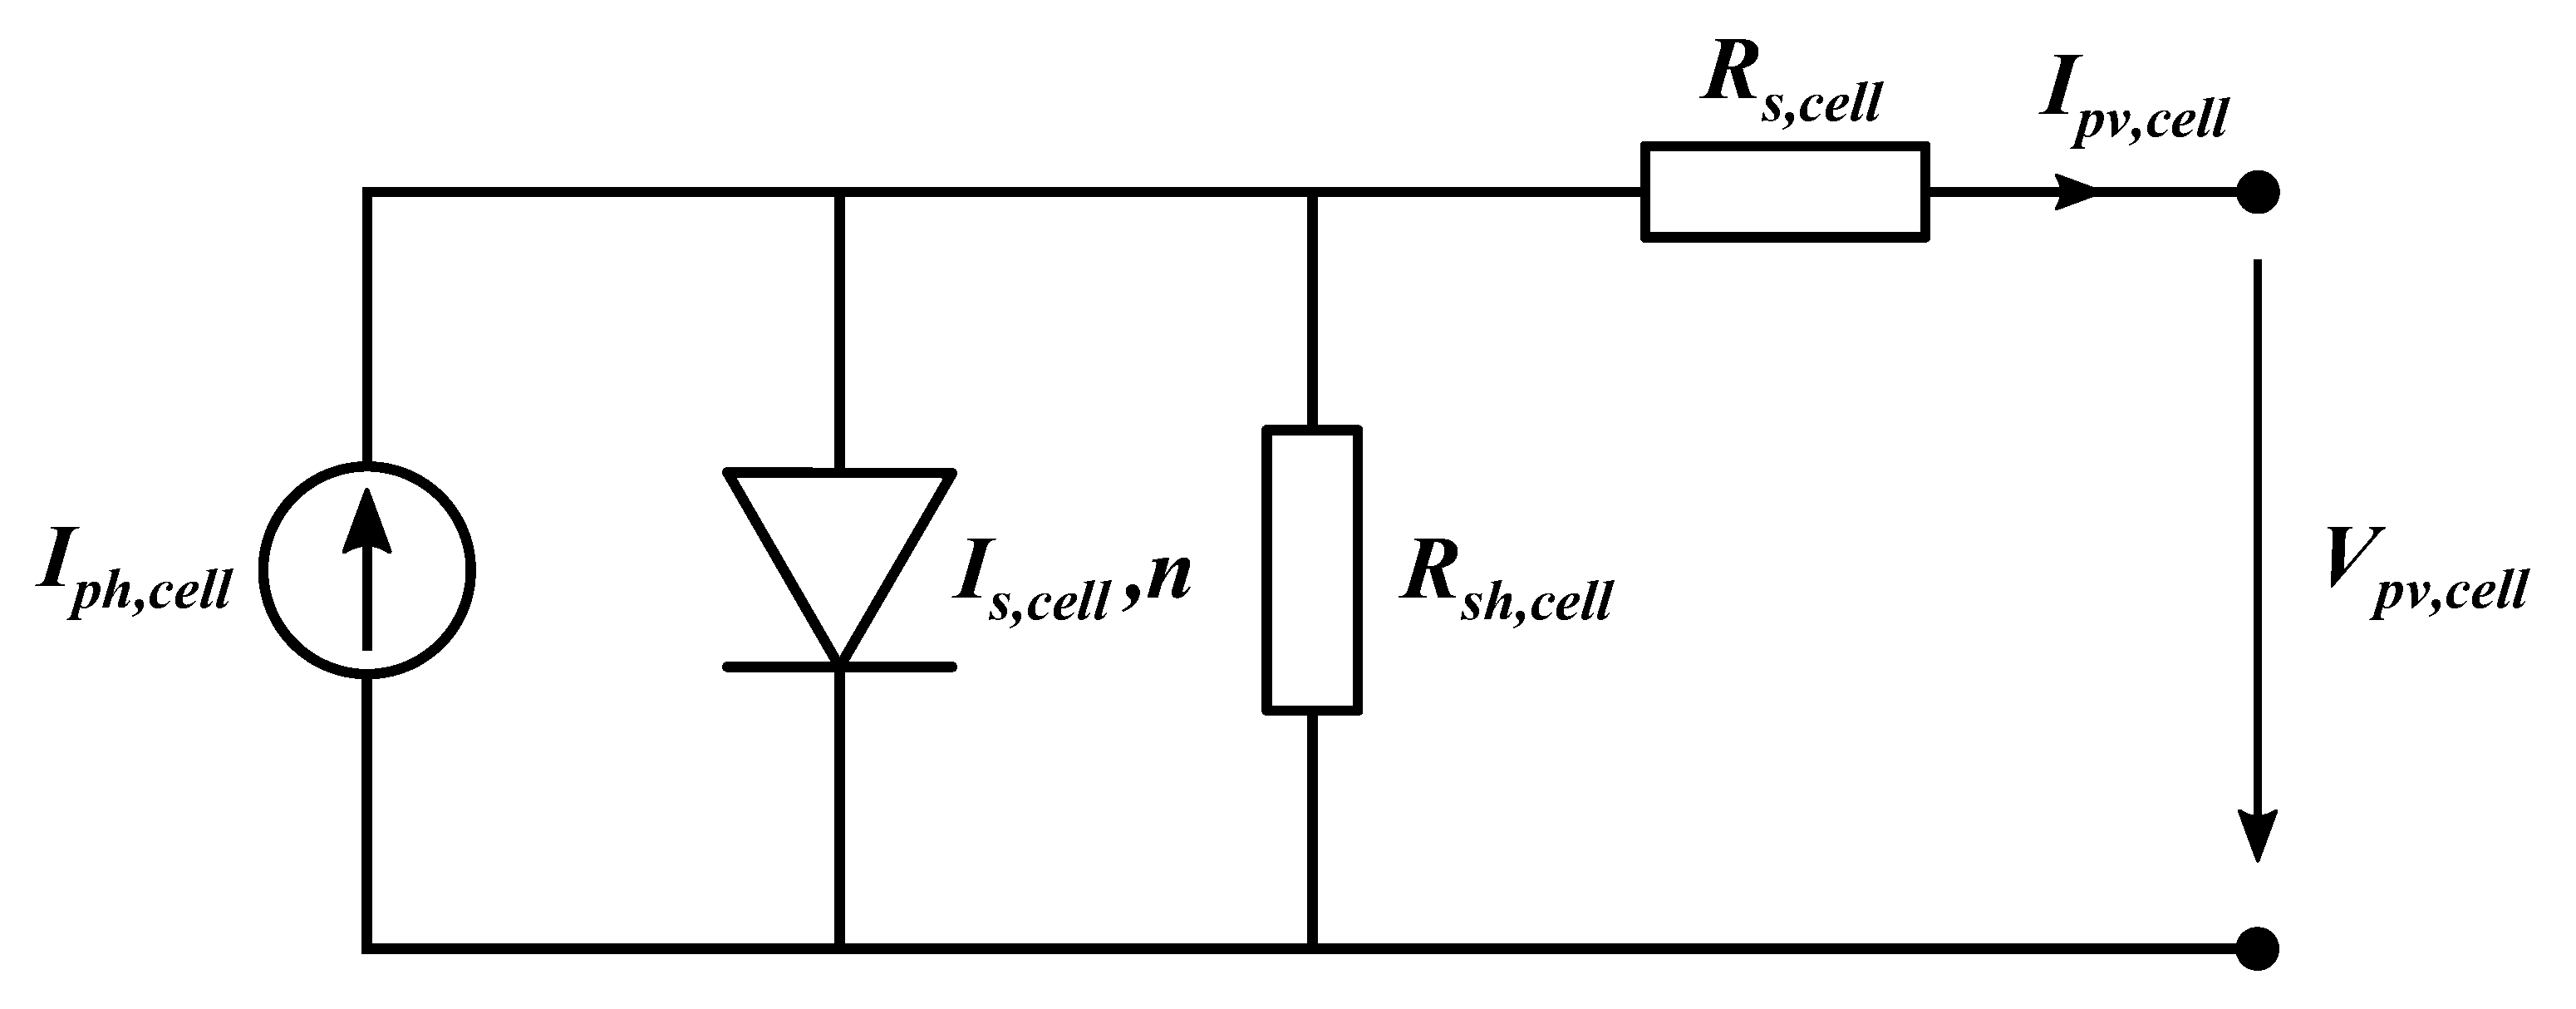
In this work, the Single-Diode Model (SDM) of the photovoltaic cell is adopted.
Figure 2 presents the equivalent circuit of the SDM where
is the photocurrent,
is the saturation current of the diode,
n is the diode ideality factor, and
and
are the series and shunt resistance, respectively [
17]. The electrical variables of interest are the PV cell terminal voltage (
) and current (
). Applying Kirchhoff’s first law, it is possible to relate both magnitudes through the implicit Equation (
1):
where
is the thermal voltage of the diode, calculated as (
2):
where
k is the Boltzmann constant,
q is the electron charge and
is the cell temperature expressed in Kelvin. To obtain the PV module model, it’d be necessary to take into account the number of series-connected cells (
) in the PV module. Both resistances and the thermal voltage are multiplied by this value:
The PV array parameters can be calculated by introducing the number of series-connected modules (
) and parallel-connected strings (
) to form the PV array:
From now on, the parameters
,
,
n,
and
will refer to parameters of the PV array model, without the need of using the subscript. The SDM model is defined for specific values of the incident irradiance and the temperature of the PV array. At Standard Test Conditions (
= 25
C and
W/m
), the SDM parameters are known as reference parameters and denoted as:
,
,
,
and
. De Soto et al. [
18] developed the translation equations of the reference parameters to different operating conditions as follows:
where
is the short-cirucit temperature coefficient,
where
is the energy bandgap of the p-n junction’s material,
Equation (
1) can be converted into an explicit equation using Lambert W function, as explained in Reference [
19]. Introducing the dependence of the SDM parameters with irradiance and temperature leads to the expression of the photovoltaic current determined by the environmental conditions and the photovoltaic voltage as follows:
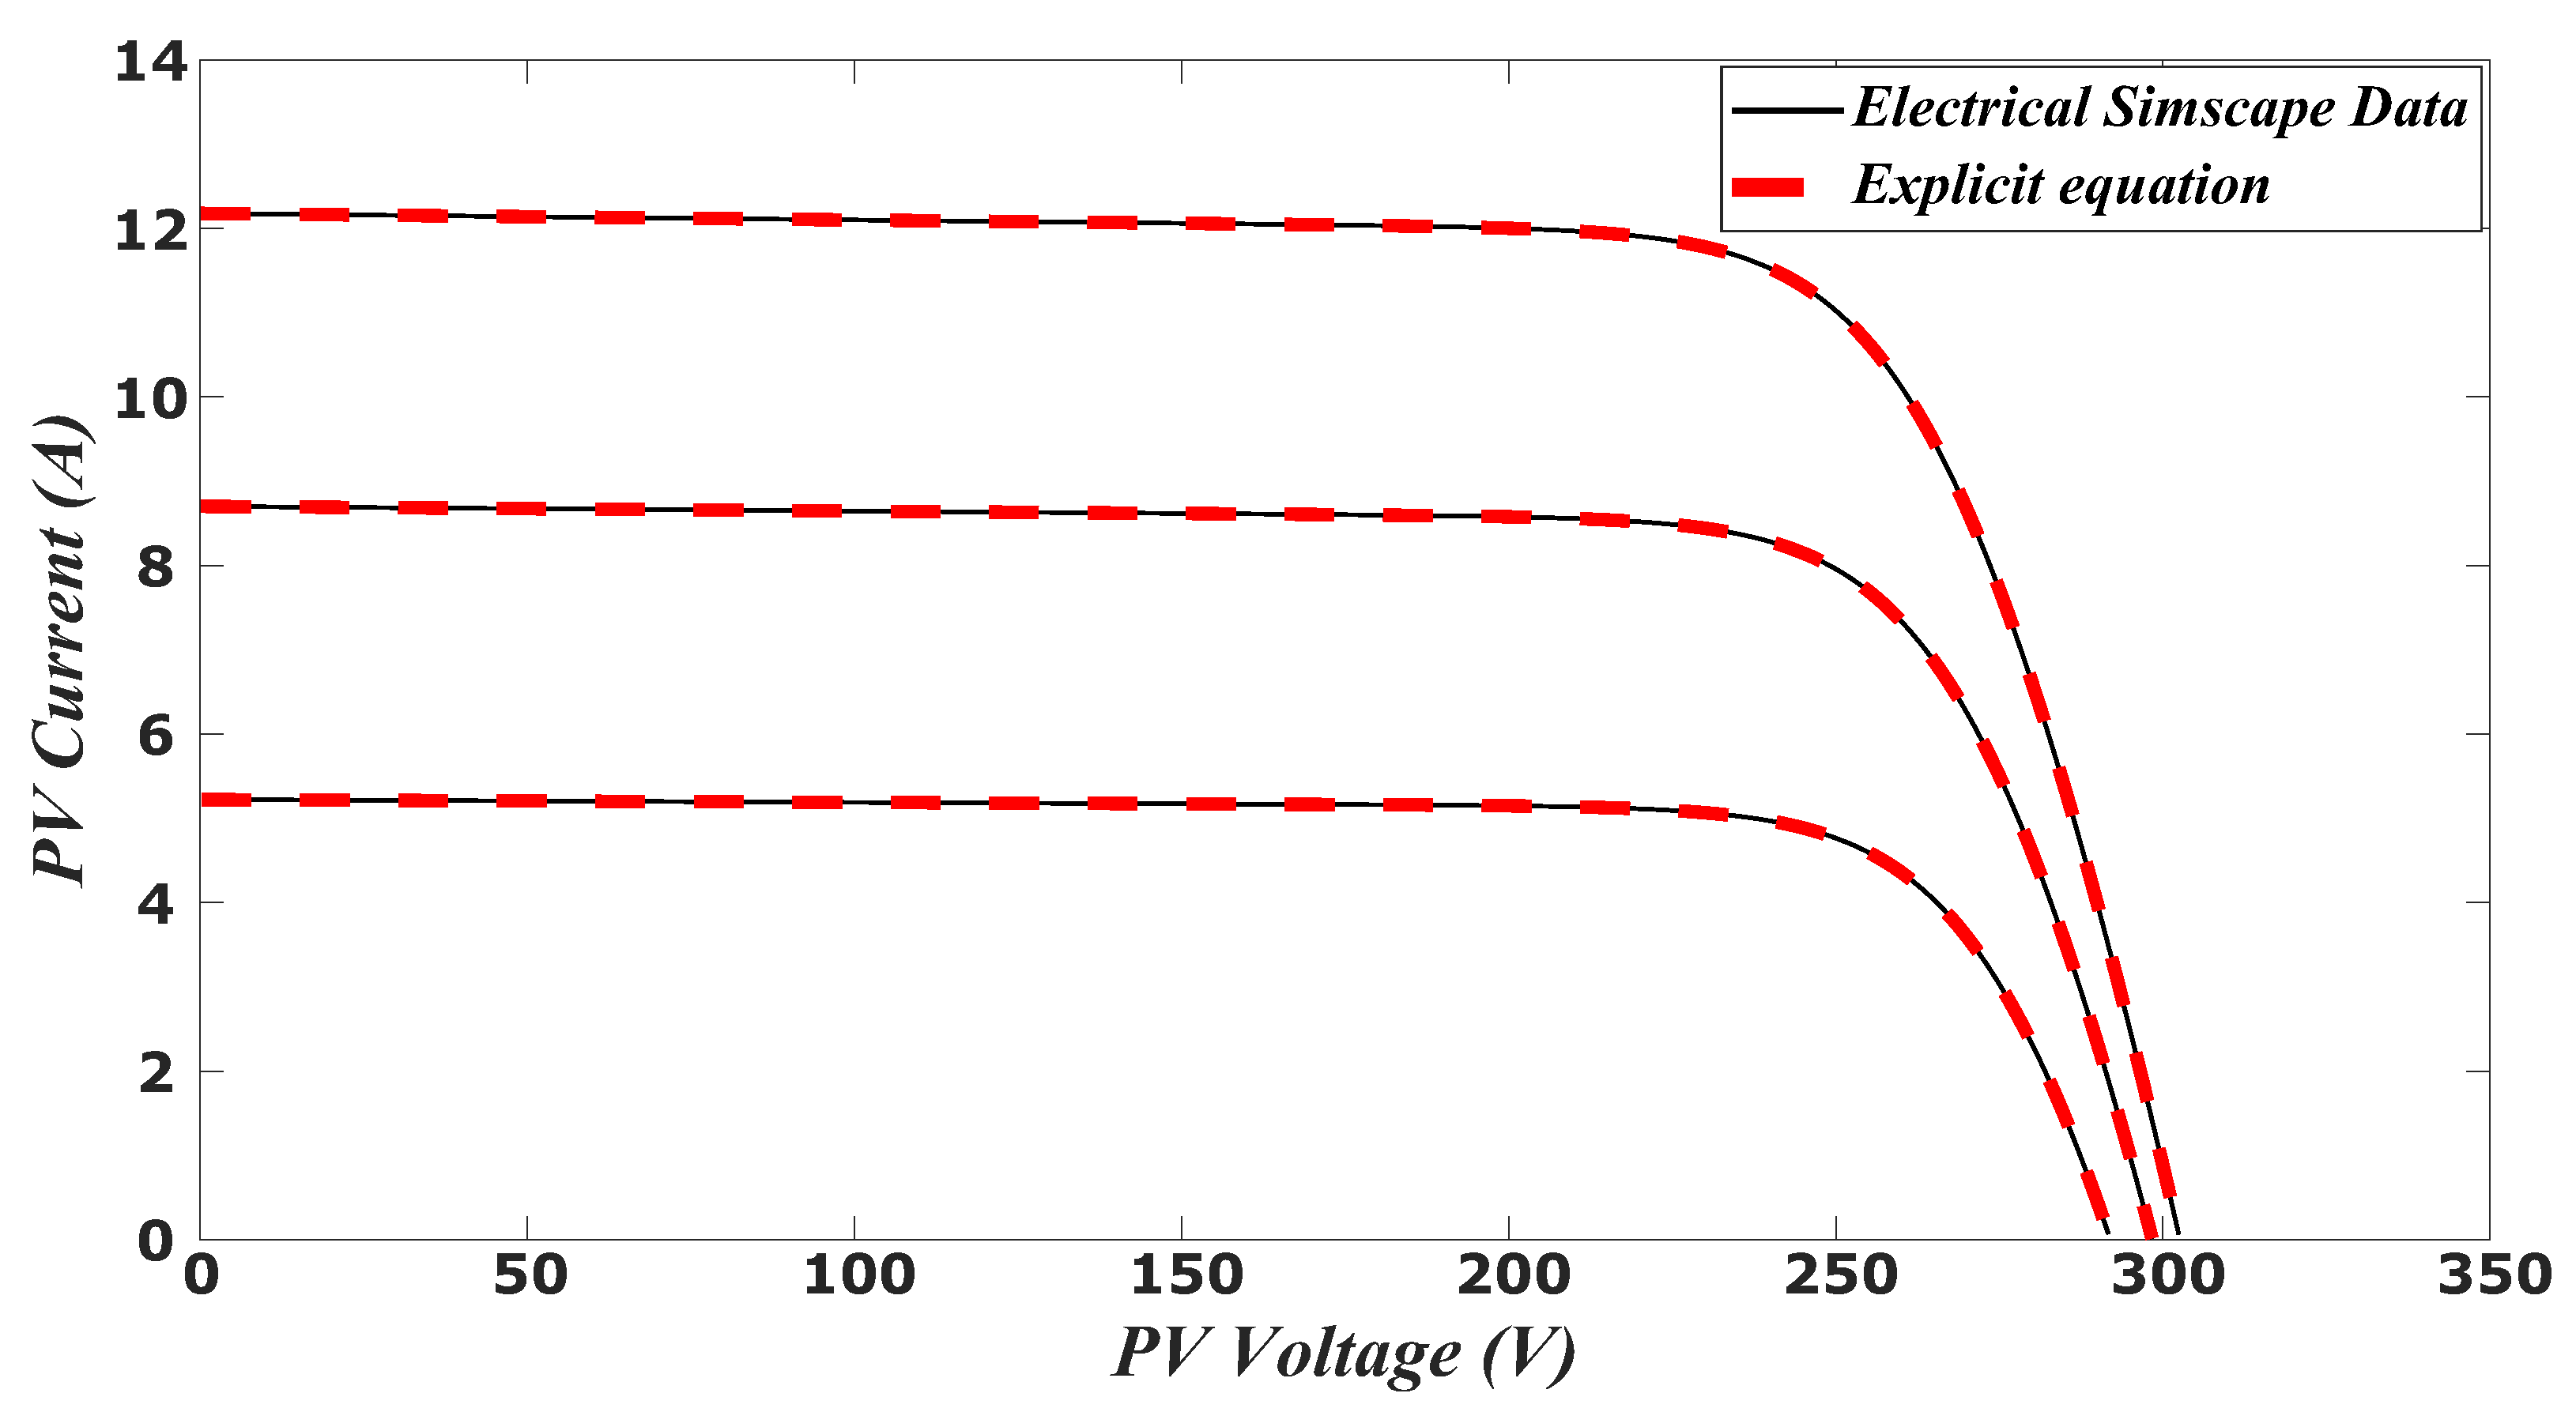
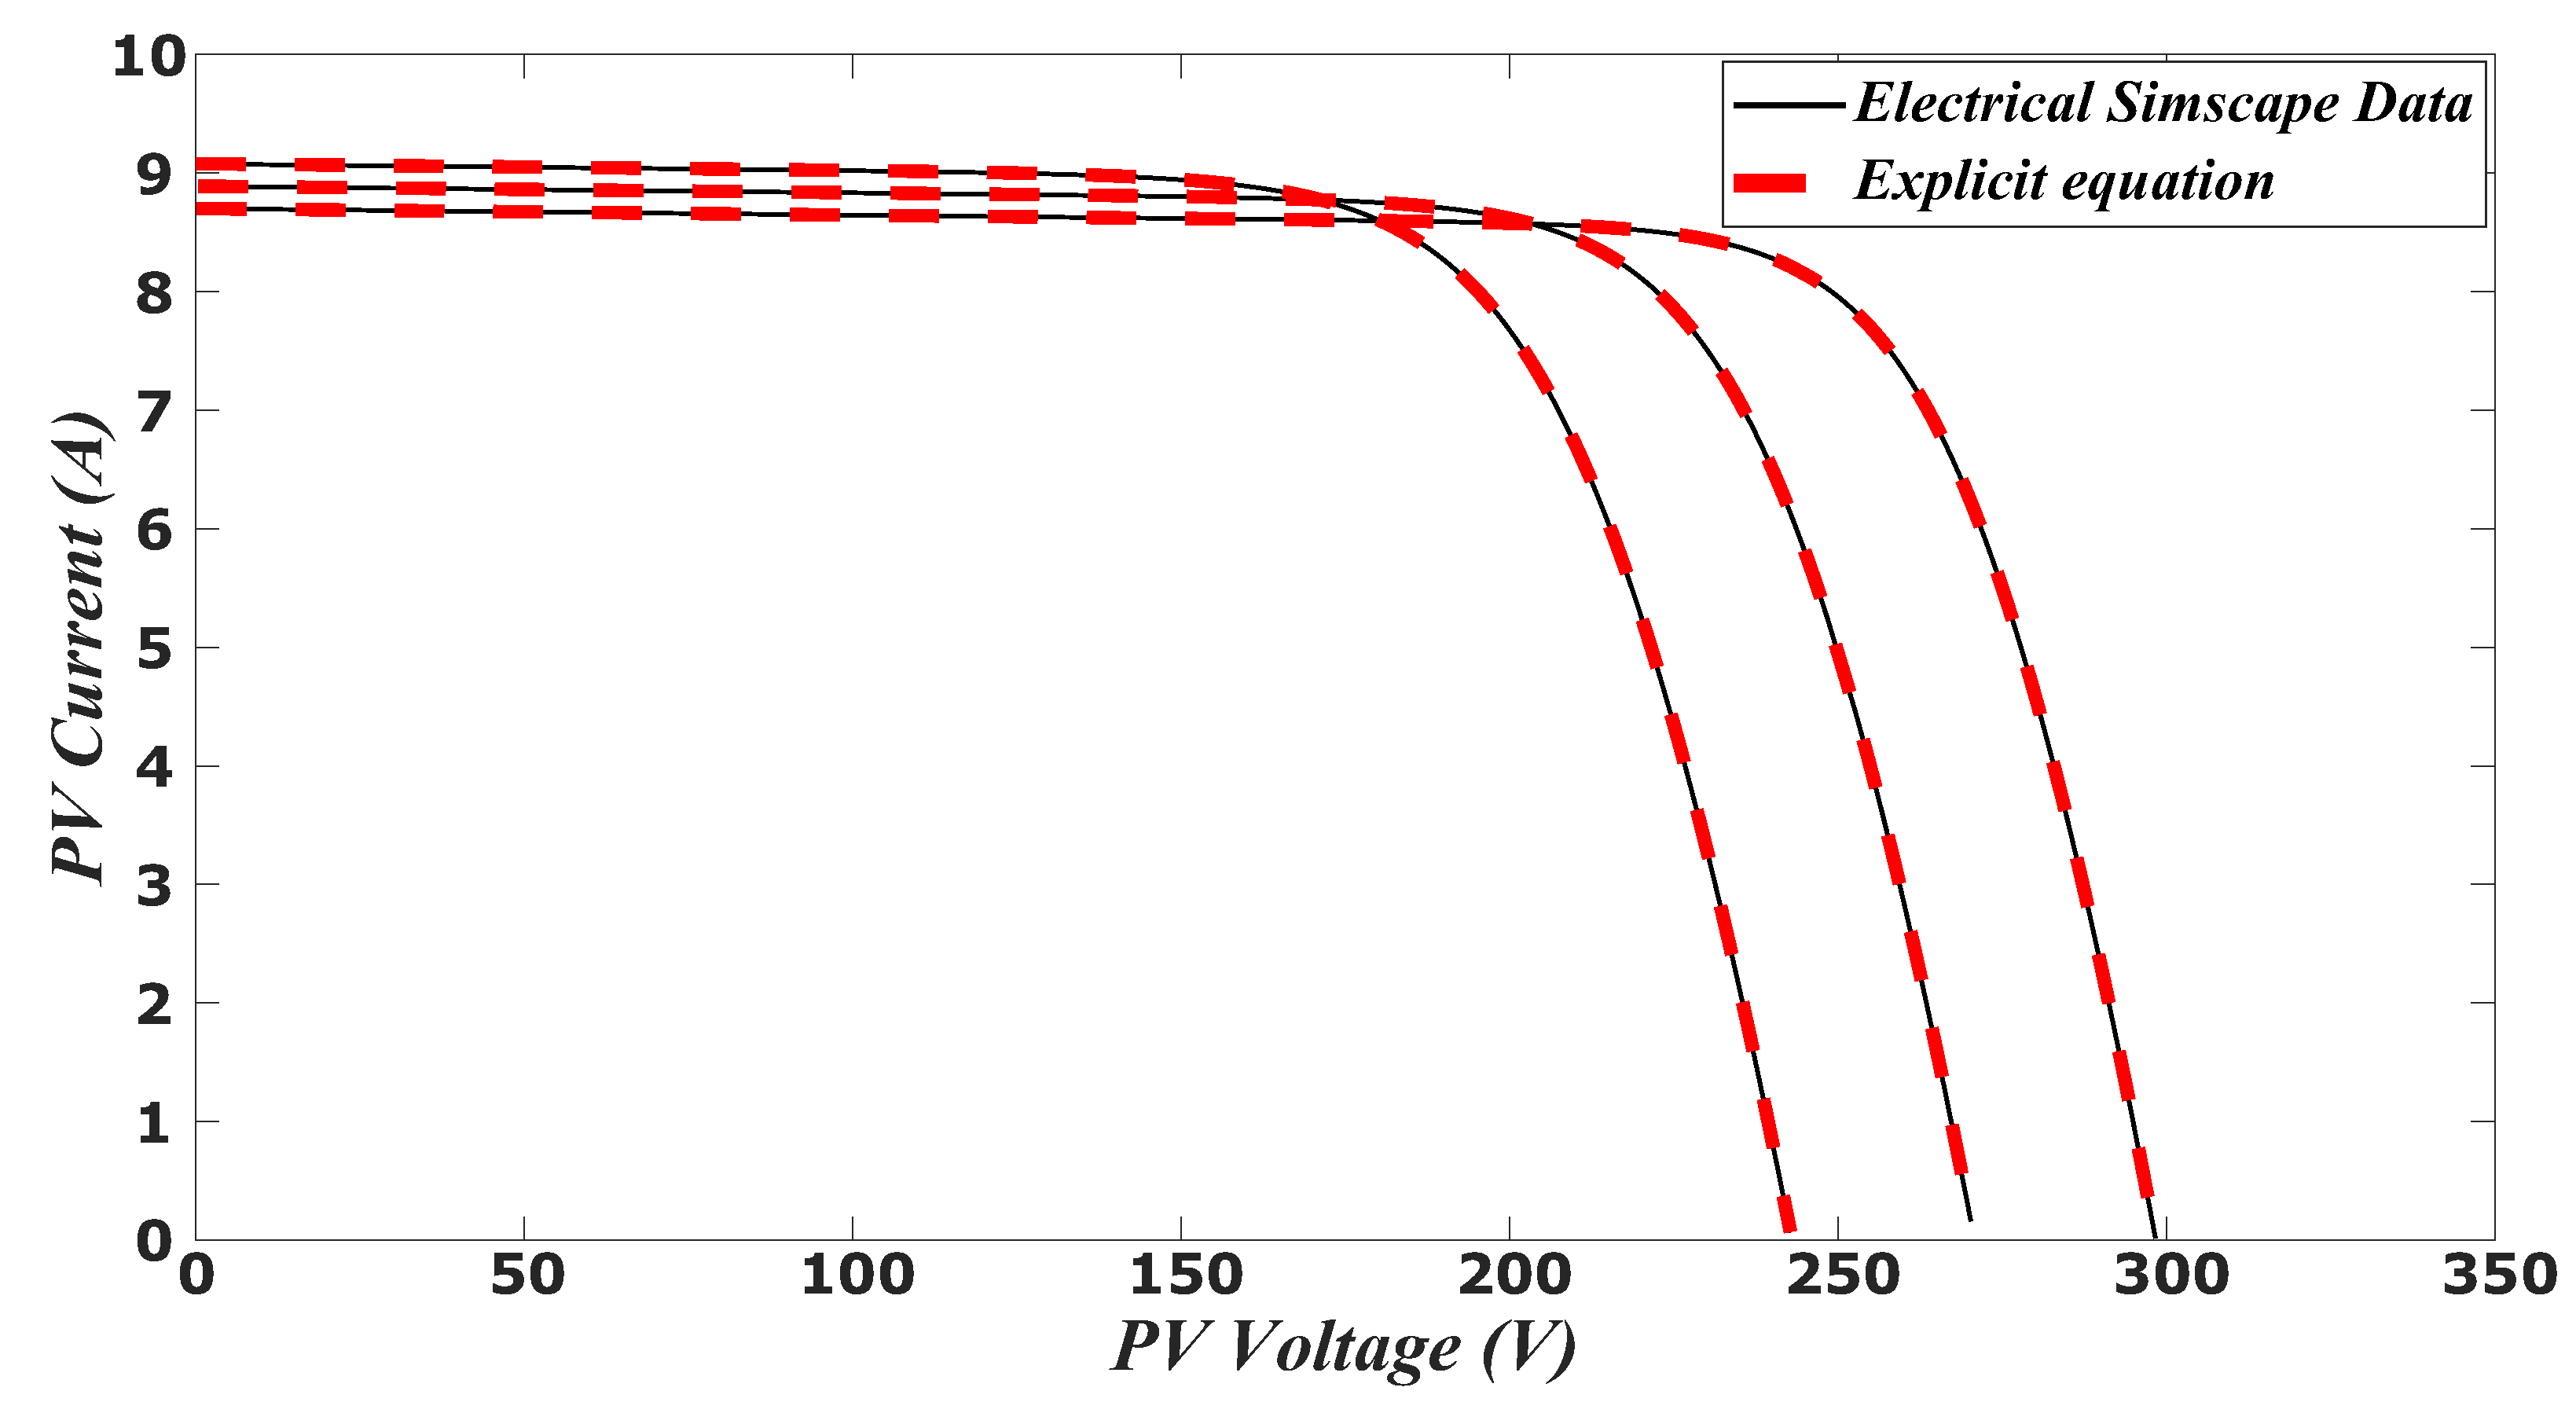
Figure 3 and
Figure 4 show the accuracy of the proposed model compared with the data available in the Matlab Electrical Simscape model [
20].
Figure 3 shows the
curves for three different irradiance levels (600 W/m
, 1000 W/m
and 1400 W/m
) with the same temperature (25
C) and
Figure 4 shows the
curves for three different temperatures (25
C, 50
C and 75
C) and the same irradiance (1000 W/m
). The array is formed by 8-series connected 1Soltech 1STH-250-WH solar panels. For the implementation of the Lambert W function in this work, the built-in
lambertw Matlab function has been used. It is worth noting that, for real-time implementation, approximations of the Lambert W function as References [
21,
22,
23,
24] are more suitable in order to reduce the computation time.
3. Non-linear Least Squares Curve Fitting
Traditionally, PV systems have been operated in order to extract the maximum available power employing MPPT algorithms. However, in some applications such as power smoothing or power reserve control, PV systems need to be operated in a deloaded mode. In these cases, it is important to estimate the PV system operating conditions, just to know the available power (MPP) or the entire
curve. One approach to solve this issue is to apply nonlinear least squares curve fitting [
25]. In this work, the curve fitting problem has been solved with the Levenberg-Marquardt method [
26,
27] by means of the Matlab embedded function
lsqnonlin, based on Reference [
28]. In nonlinear least squares problems, a set of
m measurements (
,
) is fitted to a nonlinear model by minimizing the vertical distance between the measurements and the model as:
where
and
is:
From (
20), it can be seen that the objective function depends on measurements, the incident irradiance and the cell temperature. Therefore, for a specified set of (
,
) measurements, it is possible to study the change in the objective function caused by variations in irradiance and temperature. A detailed analysis has been accomplished considering three different measurement datasets along the
curve, as depicted in
Figure 5.
Figure 6,
Figure 7 and
Figure 8 represent the value of the objective function as a function of irradiance and temperature for the three sets of measurements of
Figure 5. The ideal solution for the optimization problem would be a single global minimum. However, currently applied solutions are far from ideal.
As can be seen in
Figure 6, there are multiple local minima when the operation point lays on the left part of the
curve. In addition, these minima have similar values and are very differentiated in terms of temperature, which makes escaping from the local minimum of the initial solution complicated. A different outcome can be achieved when measurements are close to the MPP.
Figure 7 illustrates this case. In contrast to the previous set of measurements, when the PV array is operating in the MPP region, a global minimum can be found and the optimization problem can be solved satisfactorily. In this last scenario, when the PV system is operating on the right part of the
characteristic, the behavior of the objective function is depicted in
Figure 8. Again, there are multiple local minima with similar objective function values. Nevertheless, the temperature range and the objective function jumps between local minima have been noticeably reduced, which facilitates the search.
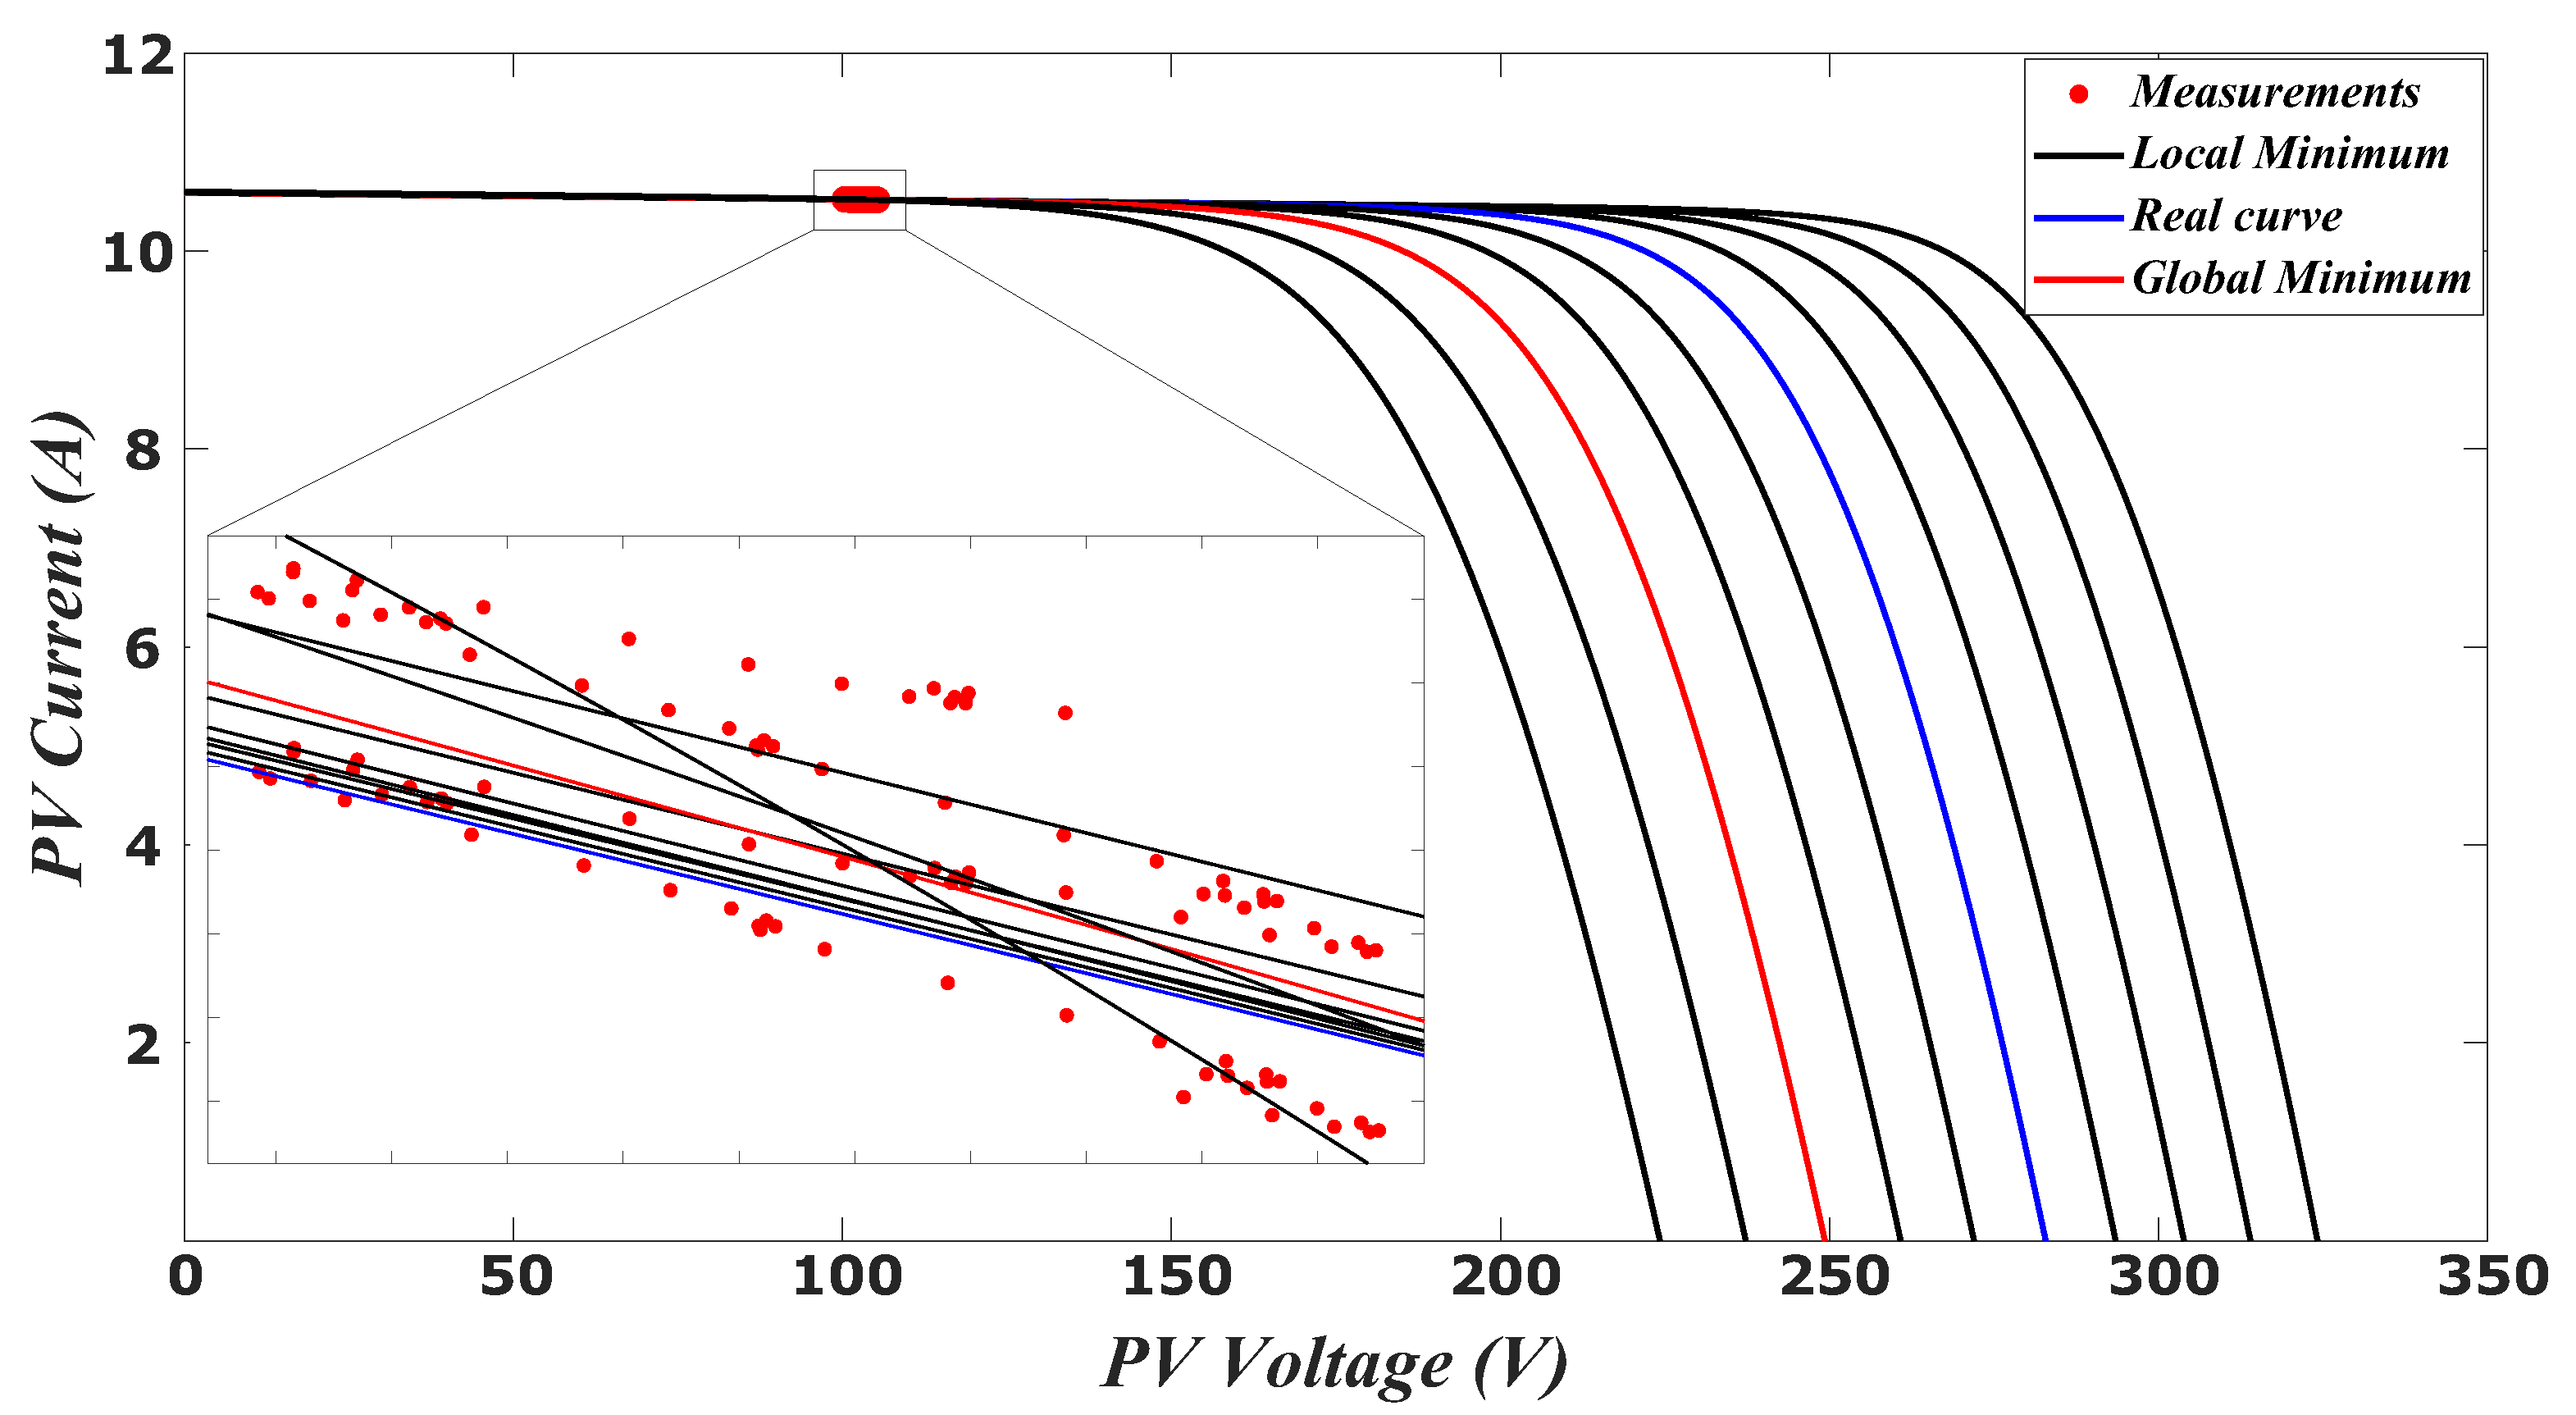
It is worth noting that, in the three cases analyzed, the measurements belong to a unique curve. But, in fluctuating weather conditions, irradiance, temperature, or both, vary between measurements. This case is illustrated in
Figure 9, where irradiance is increasing and cell temperature is decreasing from the first measurement (purple) to the last measurement in the window (yellow).
By computing the objective function for different combinations of irradiance and temperature, one can find that there are up to ten local minima, as shown in
Figure 10. This study reveals that it is not possible to estimate the cell temperature while operating on the left part of the
curve. Nonetheless, and as the cell temperature dynamics are slower than irradiance dynamics, operation on the left-hand side is feasible, at least for short periods.
4. Photovoltaic Voltage Control
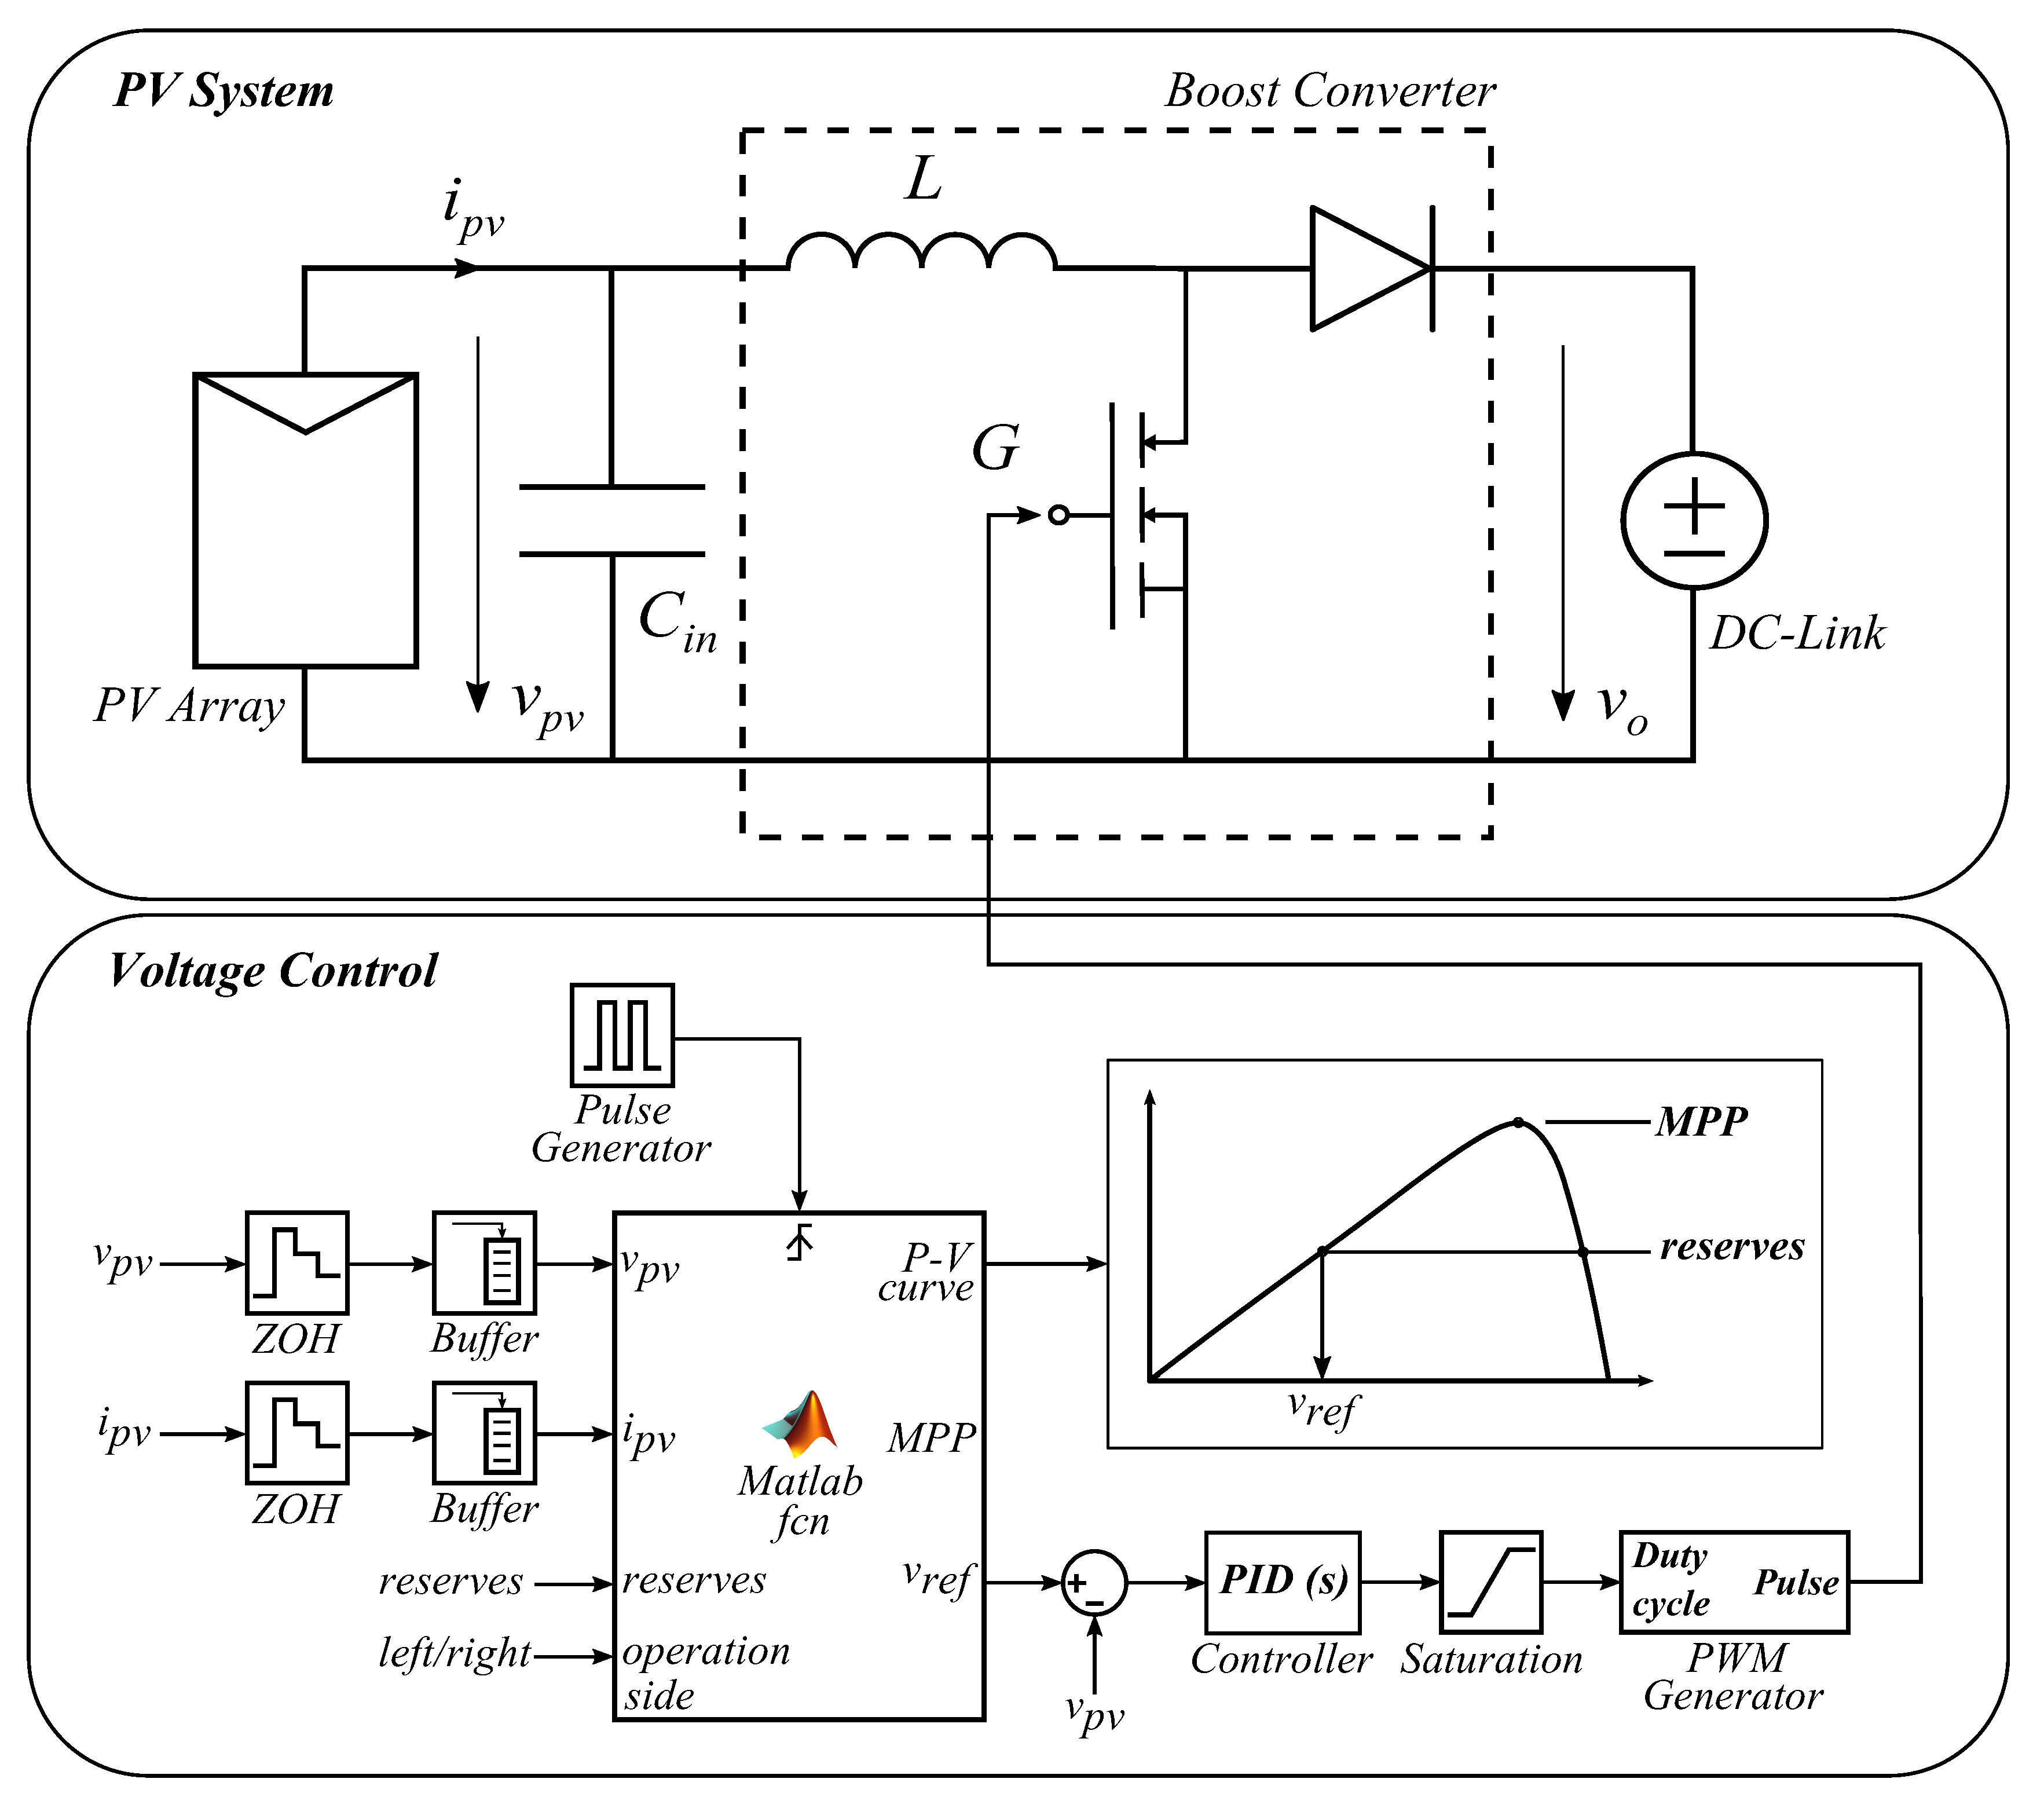
For the implementation of the proposed methodology, a detailed model of the photovoltaic and the voltage control system has been developed. As can be seen in
Figure 11, the PV system is composed of a PV array and a boost converter that increases the array output voltage to meet the voltage requirements of the DC-Link. For the purpose of this study, it has been assumed that the voltage at the DC-Link is constant and it has been modeled by a DC voltage source. The voltage at the PV array terminals and, therefore, the PV array operation side are controlled by the voltage control system, as explained below using a block diagram. The voltage control system receives voltage and current measurements from PV array terminals continuously. These measurements are discretized by means of two Zero Order Hold (ZOH) blocks, with a sample frequency of 10 kHz. Subsequently, measurements are stored in 100-sample buffer blocks, before feeding a triggered Matlab function. The function also receives the active power reserve command and the desired operation side as arguments. Every 10 ms, the Matlab function executes the
lsqnonlin function, and solves the nonlinear least squares curve fitting problem. As a result, the actual
curve is estimated and the MPP can be easily identified. Furthermore, the reference voltage is obtained taking into account the reserve command and the operation side. This reference voltage is then compared to the actual PV voltage, and the error is fed to a PID controller, which produces the duty cycle signal. The duty cycle, whose value is bounded within the interval [0,1], is the input for a Pulse Width Modulation (PWM) generator, which generates the control signal that opens and closes the switch of the boost converter. Thus, the control loop is closed and the active power reserve and the operation side can be controlled.
It is well known that both the PV array and the boost converter have nonlinear characteristics, which hinders the PID controller tunning. To overcome this issue, a small-signal model of the system is developed as in Reference [
29]:
where
and
are the state-space variables,
is the control variable and
L,
and
are parameters of the system shown in
Figure 11.
is the dynamic resistance of the PV array, defined as the quotient between a small increment in PV voltage (
) and a small increment in PV current (
):
From the state-space Equation (
22), it is possible to obtain the transfer function of the linearized model and express it in the canonical form of a second order transfer function:
where the damping factor
, the undamped natural frequency
and the static gain
of the plant can be expressed as a function of the model parameters as follows:
It can be seen from (
24)–(
26) that the plant model
and the damping factor
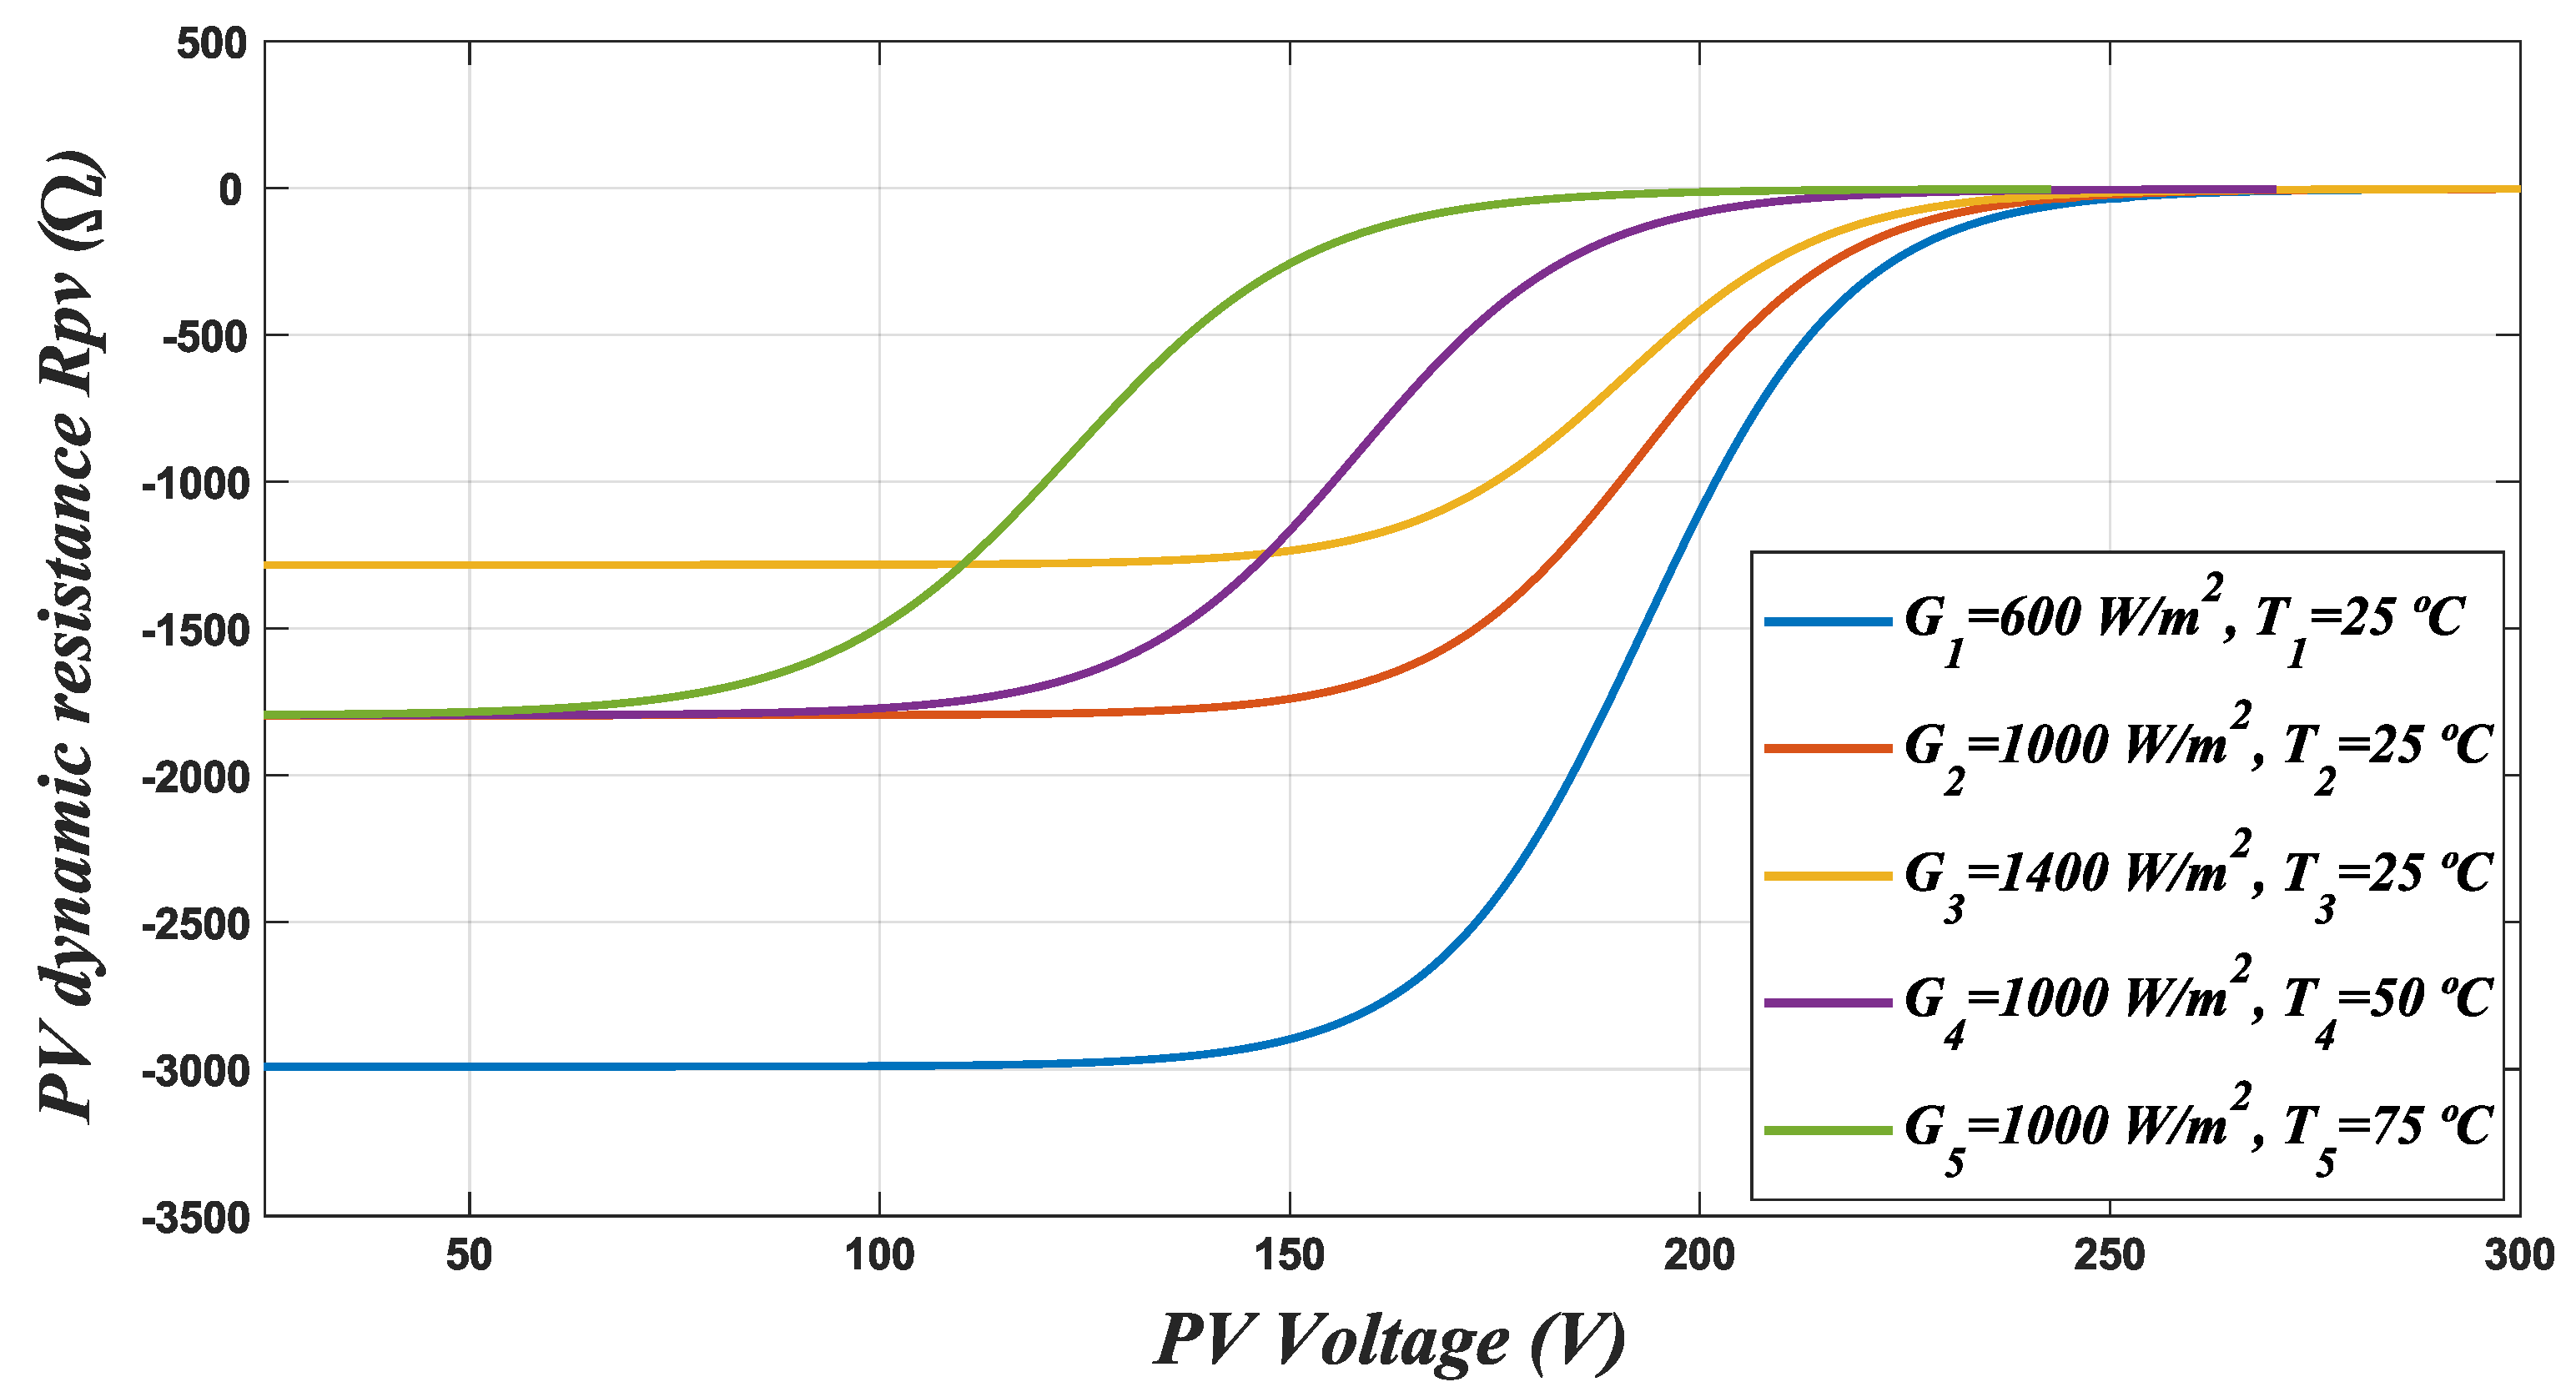
are affected by the dynamic resistance and, therefore, by the operating point of the PV system. To guarantee a robust control of the PV system, it is necessary to contemplate all the possible operating conditions. For illustration,
Figure 12 represents the evolution of the dynamic resistance along the
curve for five combinations of irradiance and temperature. As depicted,
can take values in a wide range from −3000 to near 0
. In order to design a robust regulator, affine parameterization is applied.
Affine Parameterization
Affine parameterization [
30] is a straightforward method to tune a compensator in terms of robustness and stability of the closed-loop system. The design process starts by defining the expected closed-loop characteristics of the system: the closed-loop damping factor
and the closed-loop natural frequency
.
Table 2 shows the percentage of overshoot for different closed-loop damping factor values.
Once the closed-loop damping factor is selected, the closed-loop natural frequency can be derived from the settling time expression (
29):
The compensator’s transfer function can be derived directly as follows:
After the calculation of
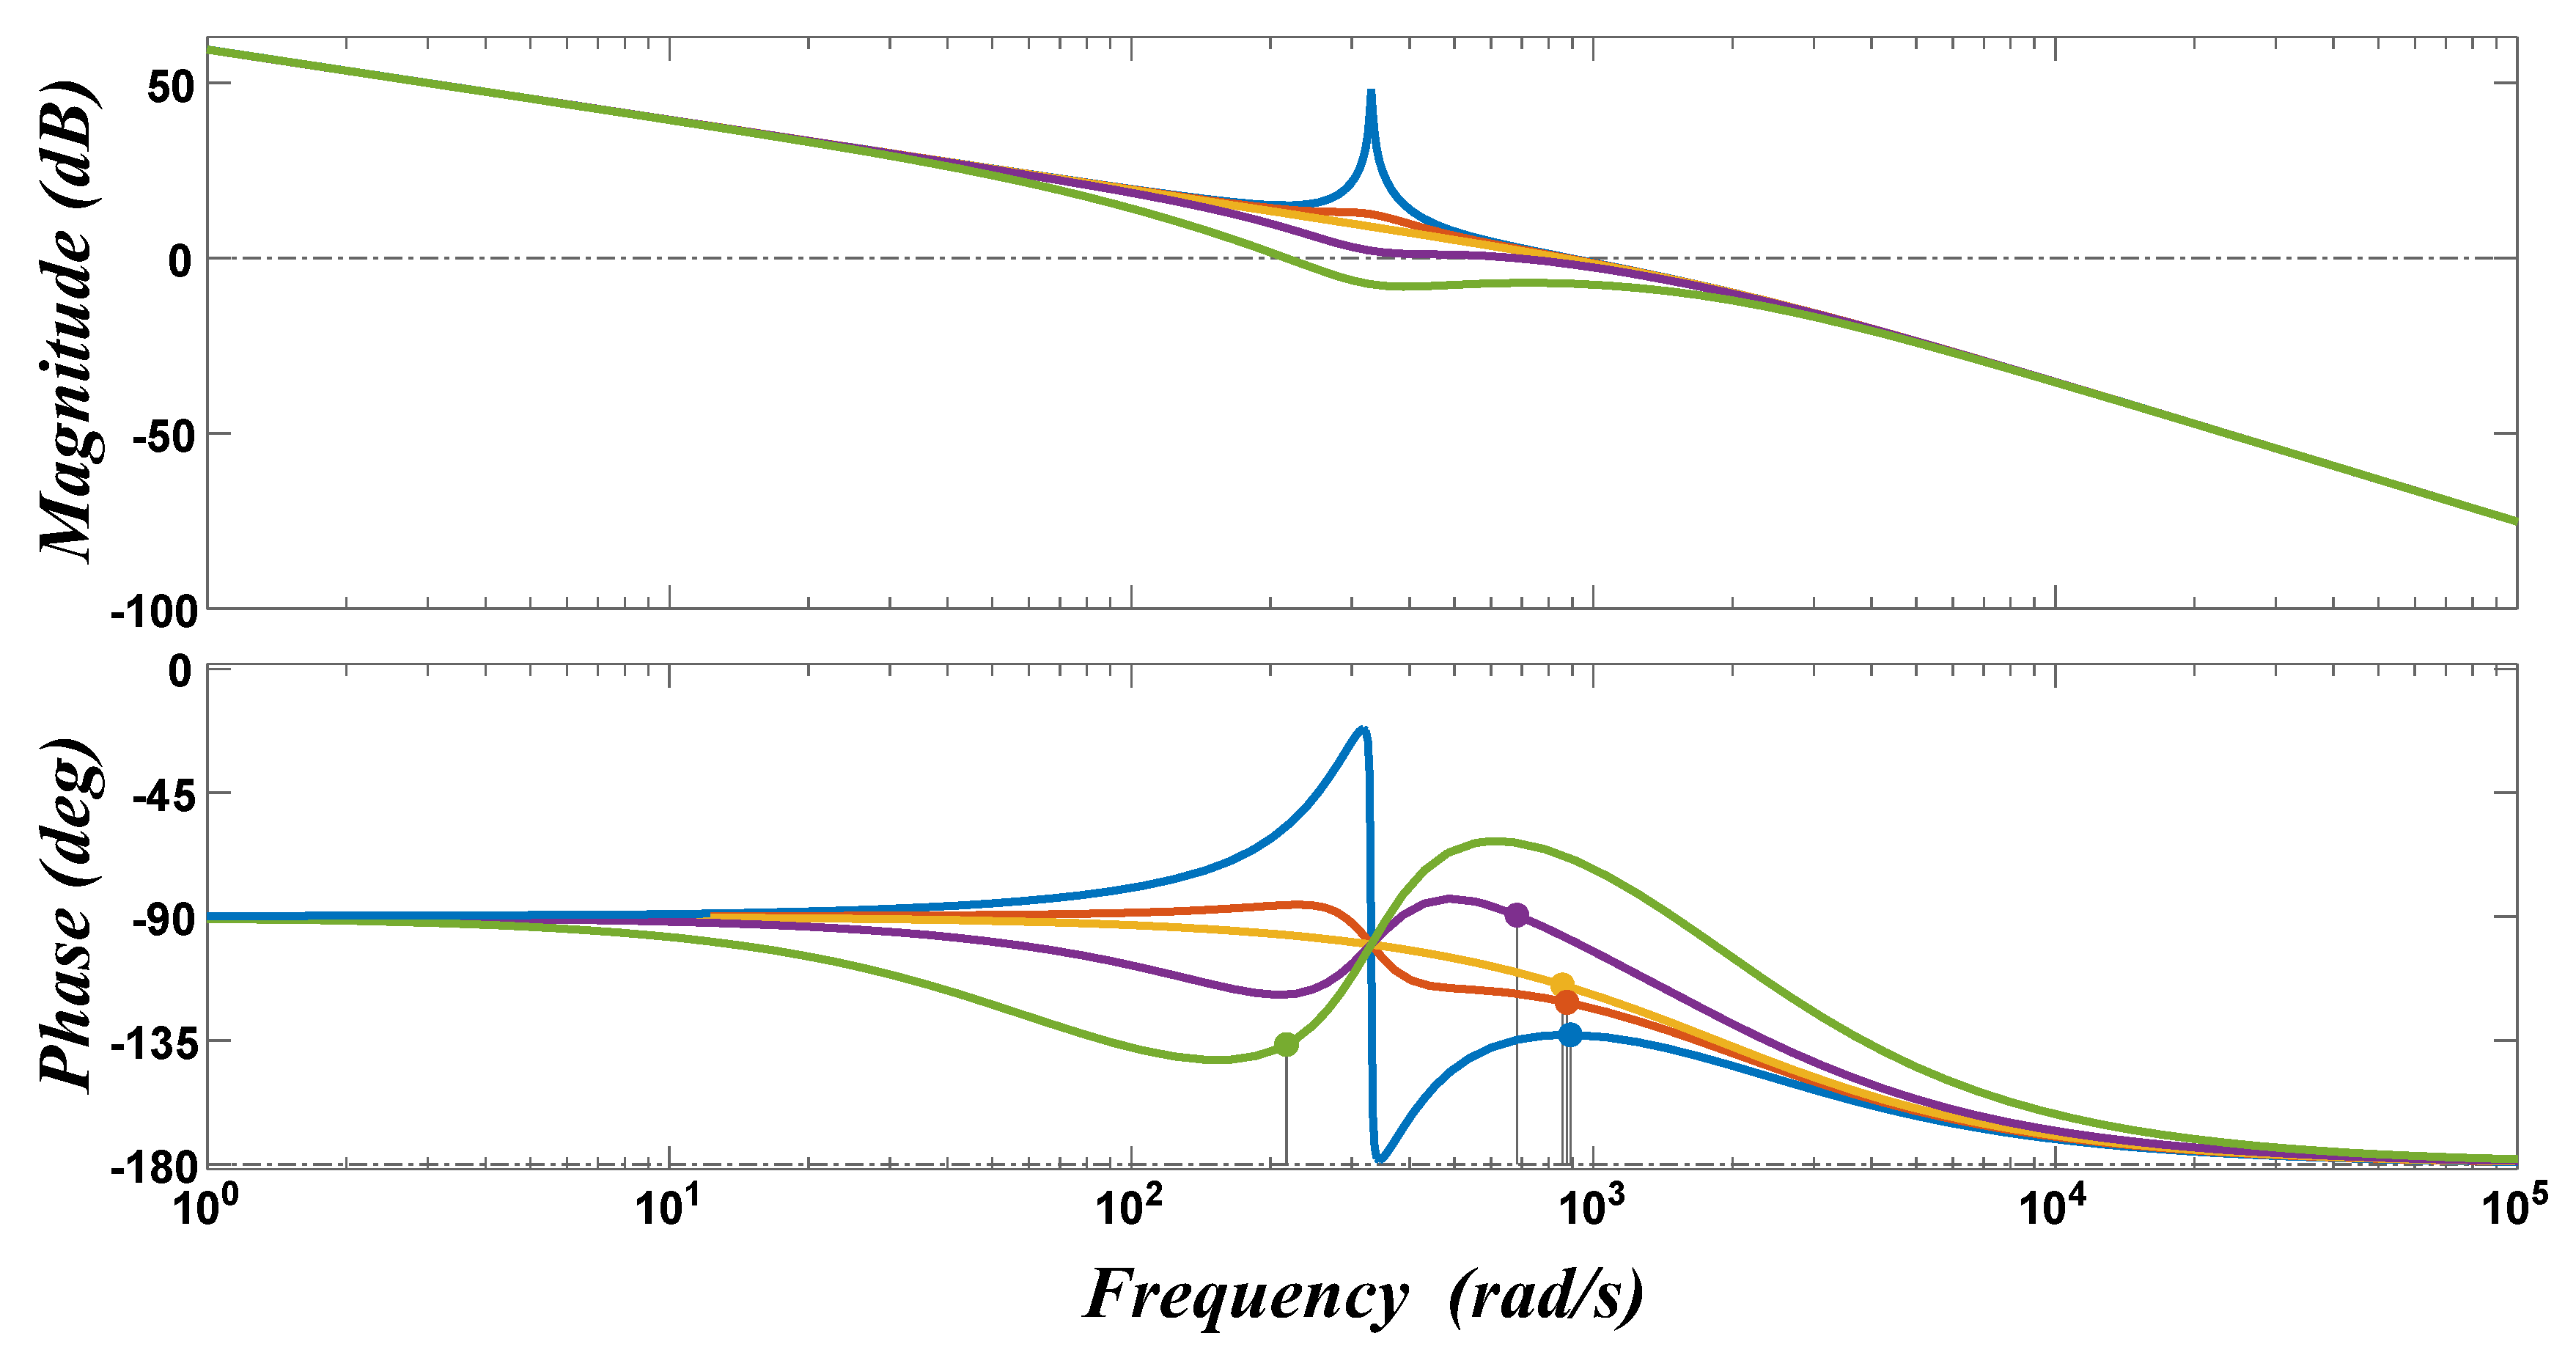
, the closed-loop robustness and stability must be verified. To do this, the Bode plot of the open loop transfer function
can be used.
Figure 13 shows Bode plots of the open-loop transfer function for five different operating conditions. The gain and phase margins guarantee a closed-loop stable operation for the five possible scenarios presented.
6. Conclusions
In this work, a novel photovoltaic power curtailment method has been developed and implemented. Unlike the existing methods in the literature, the proposed strategy allows PV systems to operate on the right and on the left side of the MPP, depending on the needs. It has been shown that left-hand side operation is preferable in case of fluctuating irradiance conditions. However, this operation side suffers from a limited power regulation interval. On the other hand, right-hand side operation has a wider power regulation range, but it may be unstable in a variable irradiance scenario. The proposed strategy avoids these limitations. In the curtailed mode, a curve fitting algorithm estimates the actual
curve and the maximum available power. The solution of the curve fitting problem has been analyzed, and the conclusion was that it is impossible to estimate the temperature when the PV system operates on the left-hand side of the MPP. Thus, our proposal is to operate photovoltaic systems on the left part of the
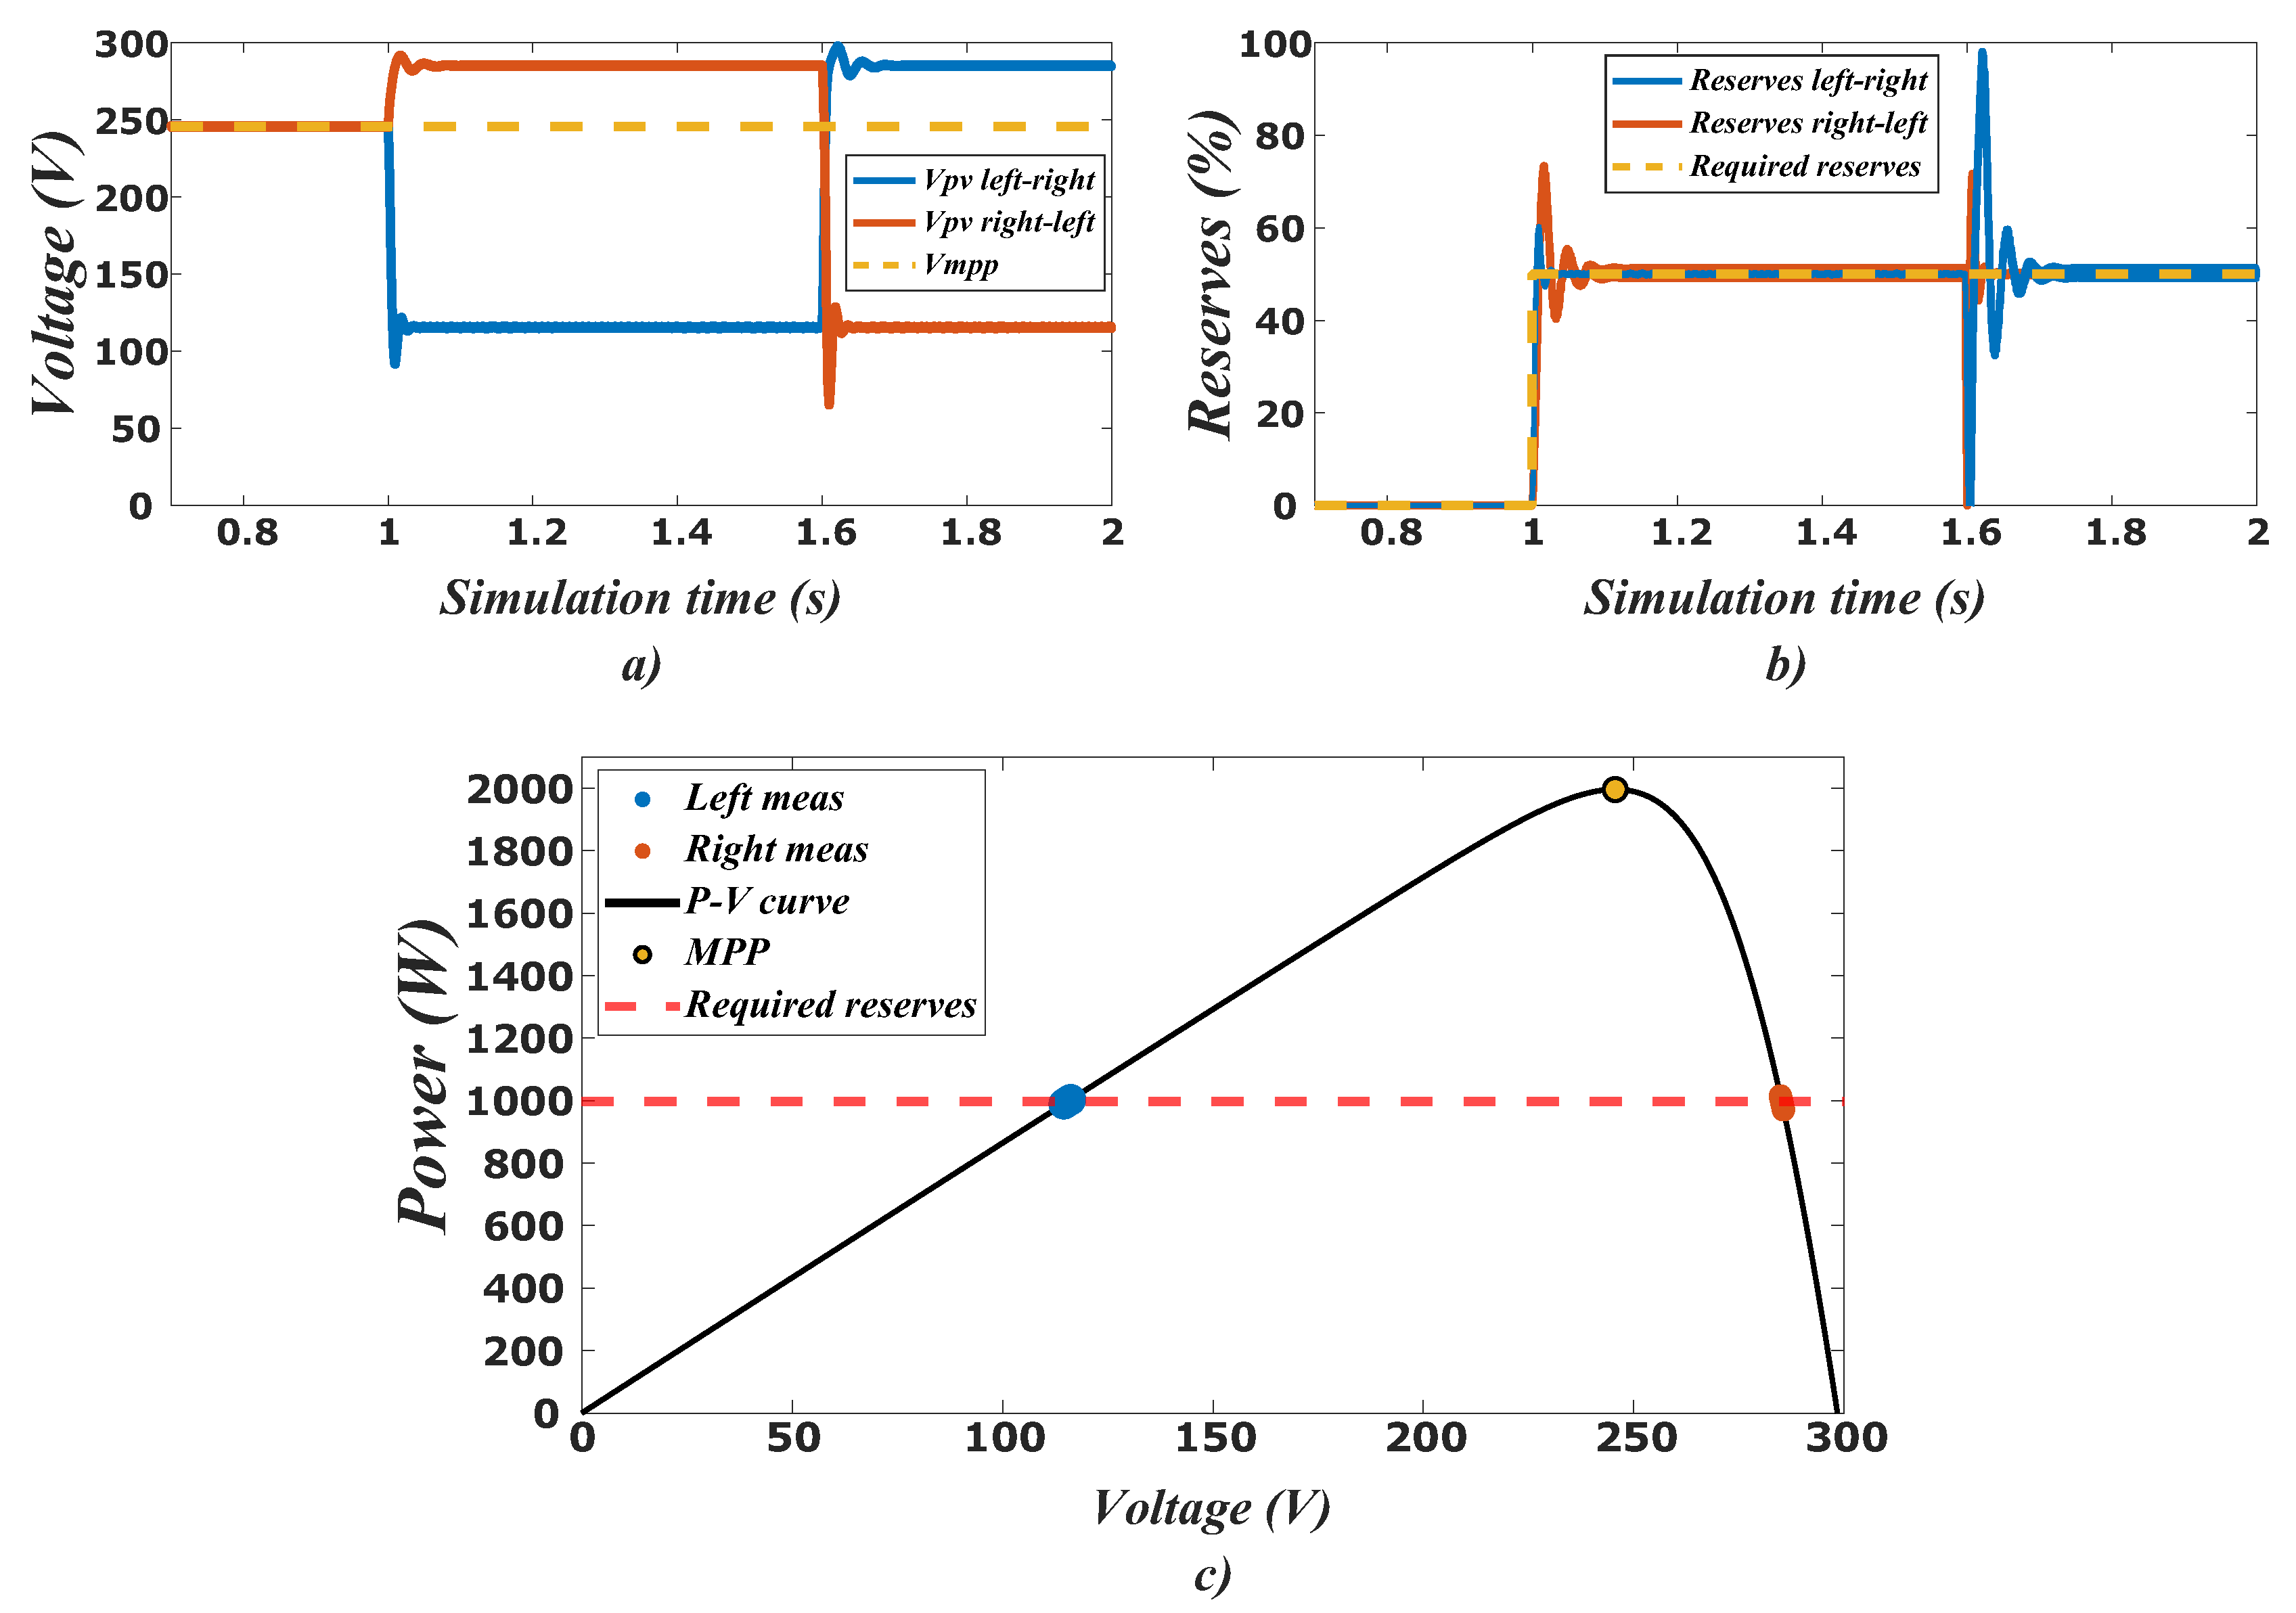
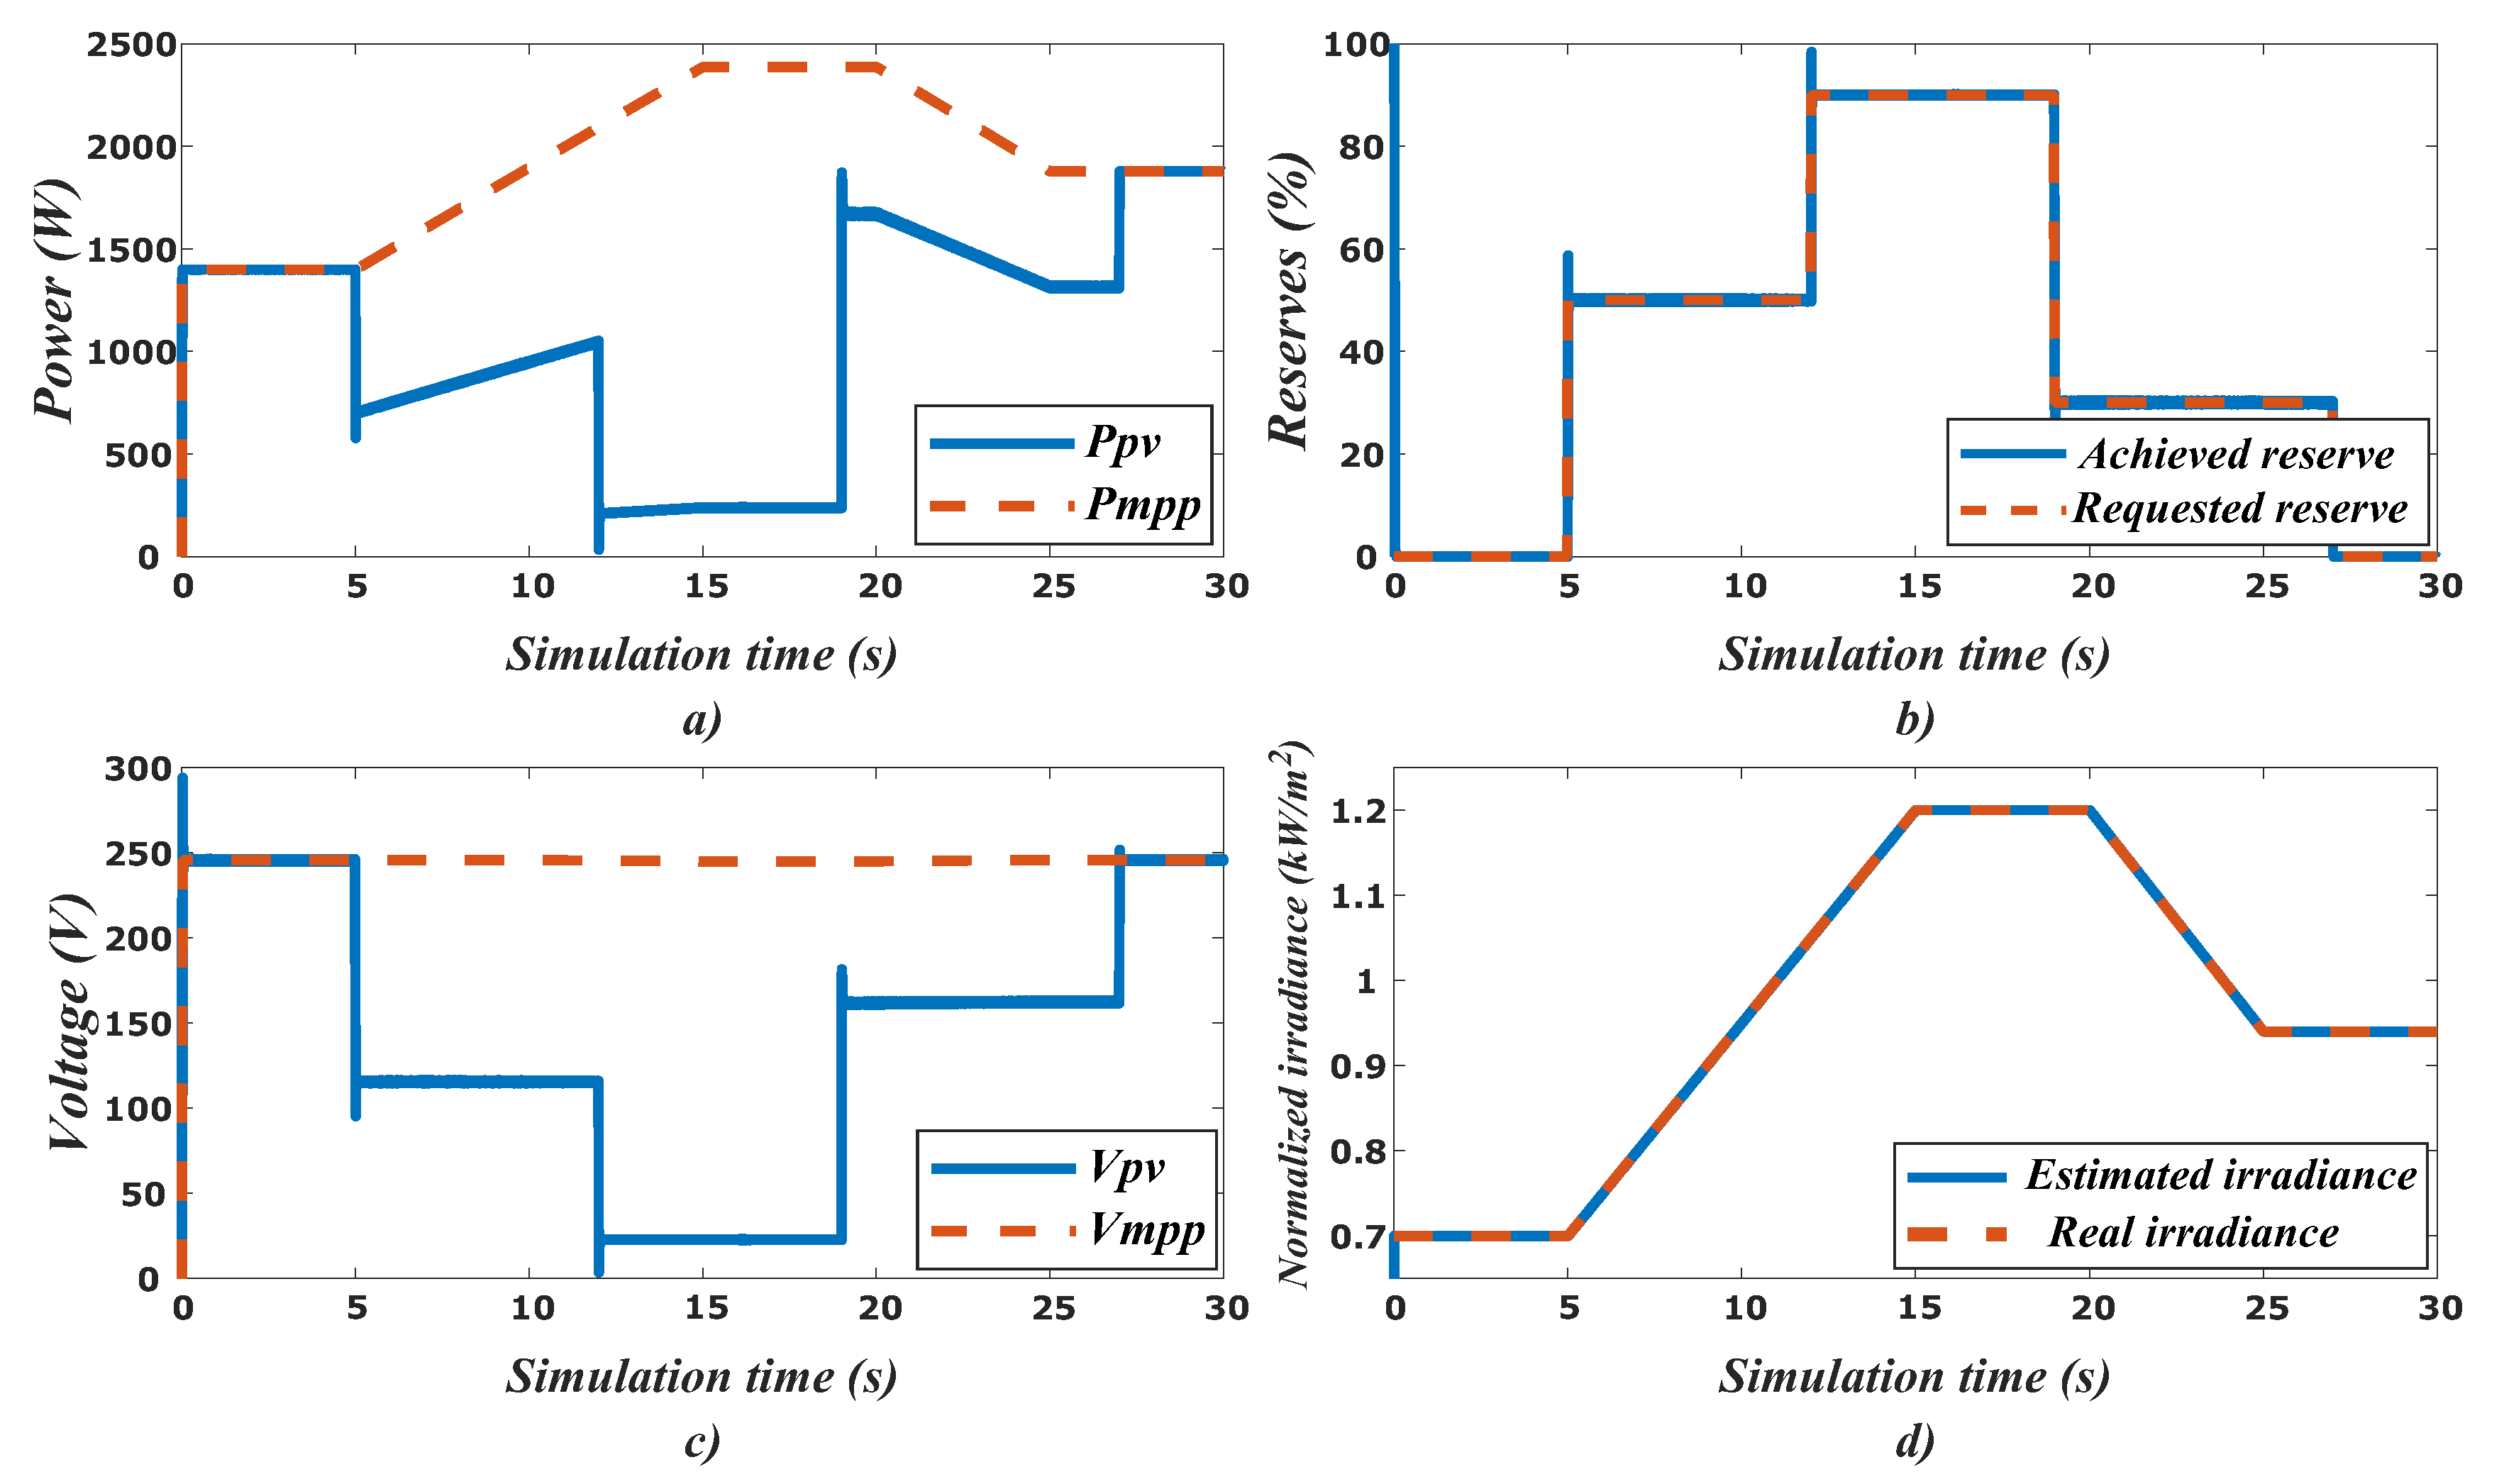
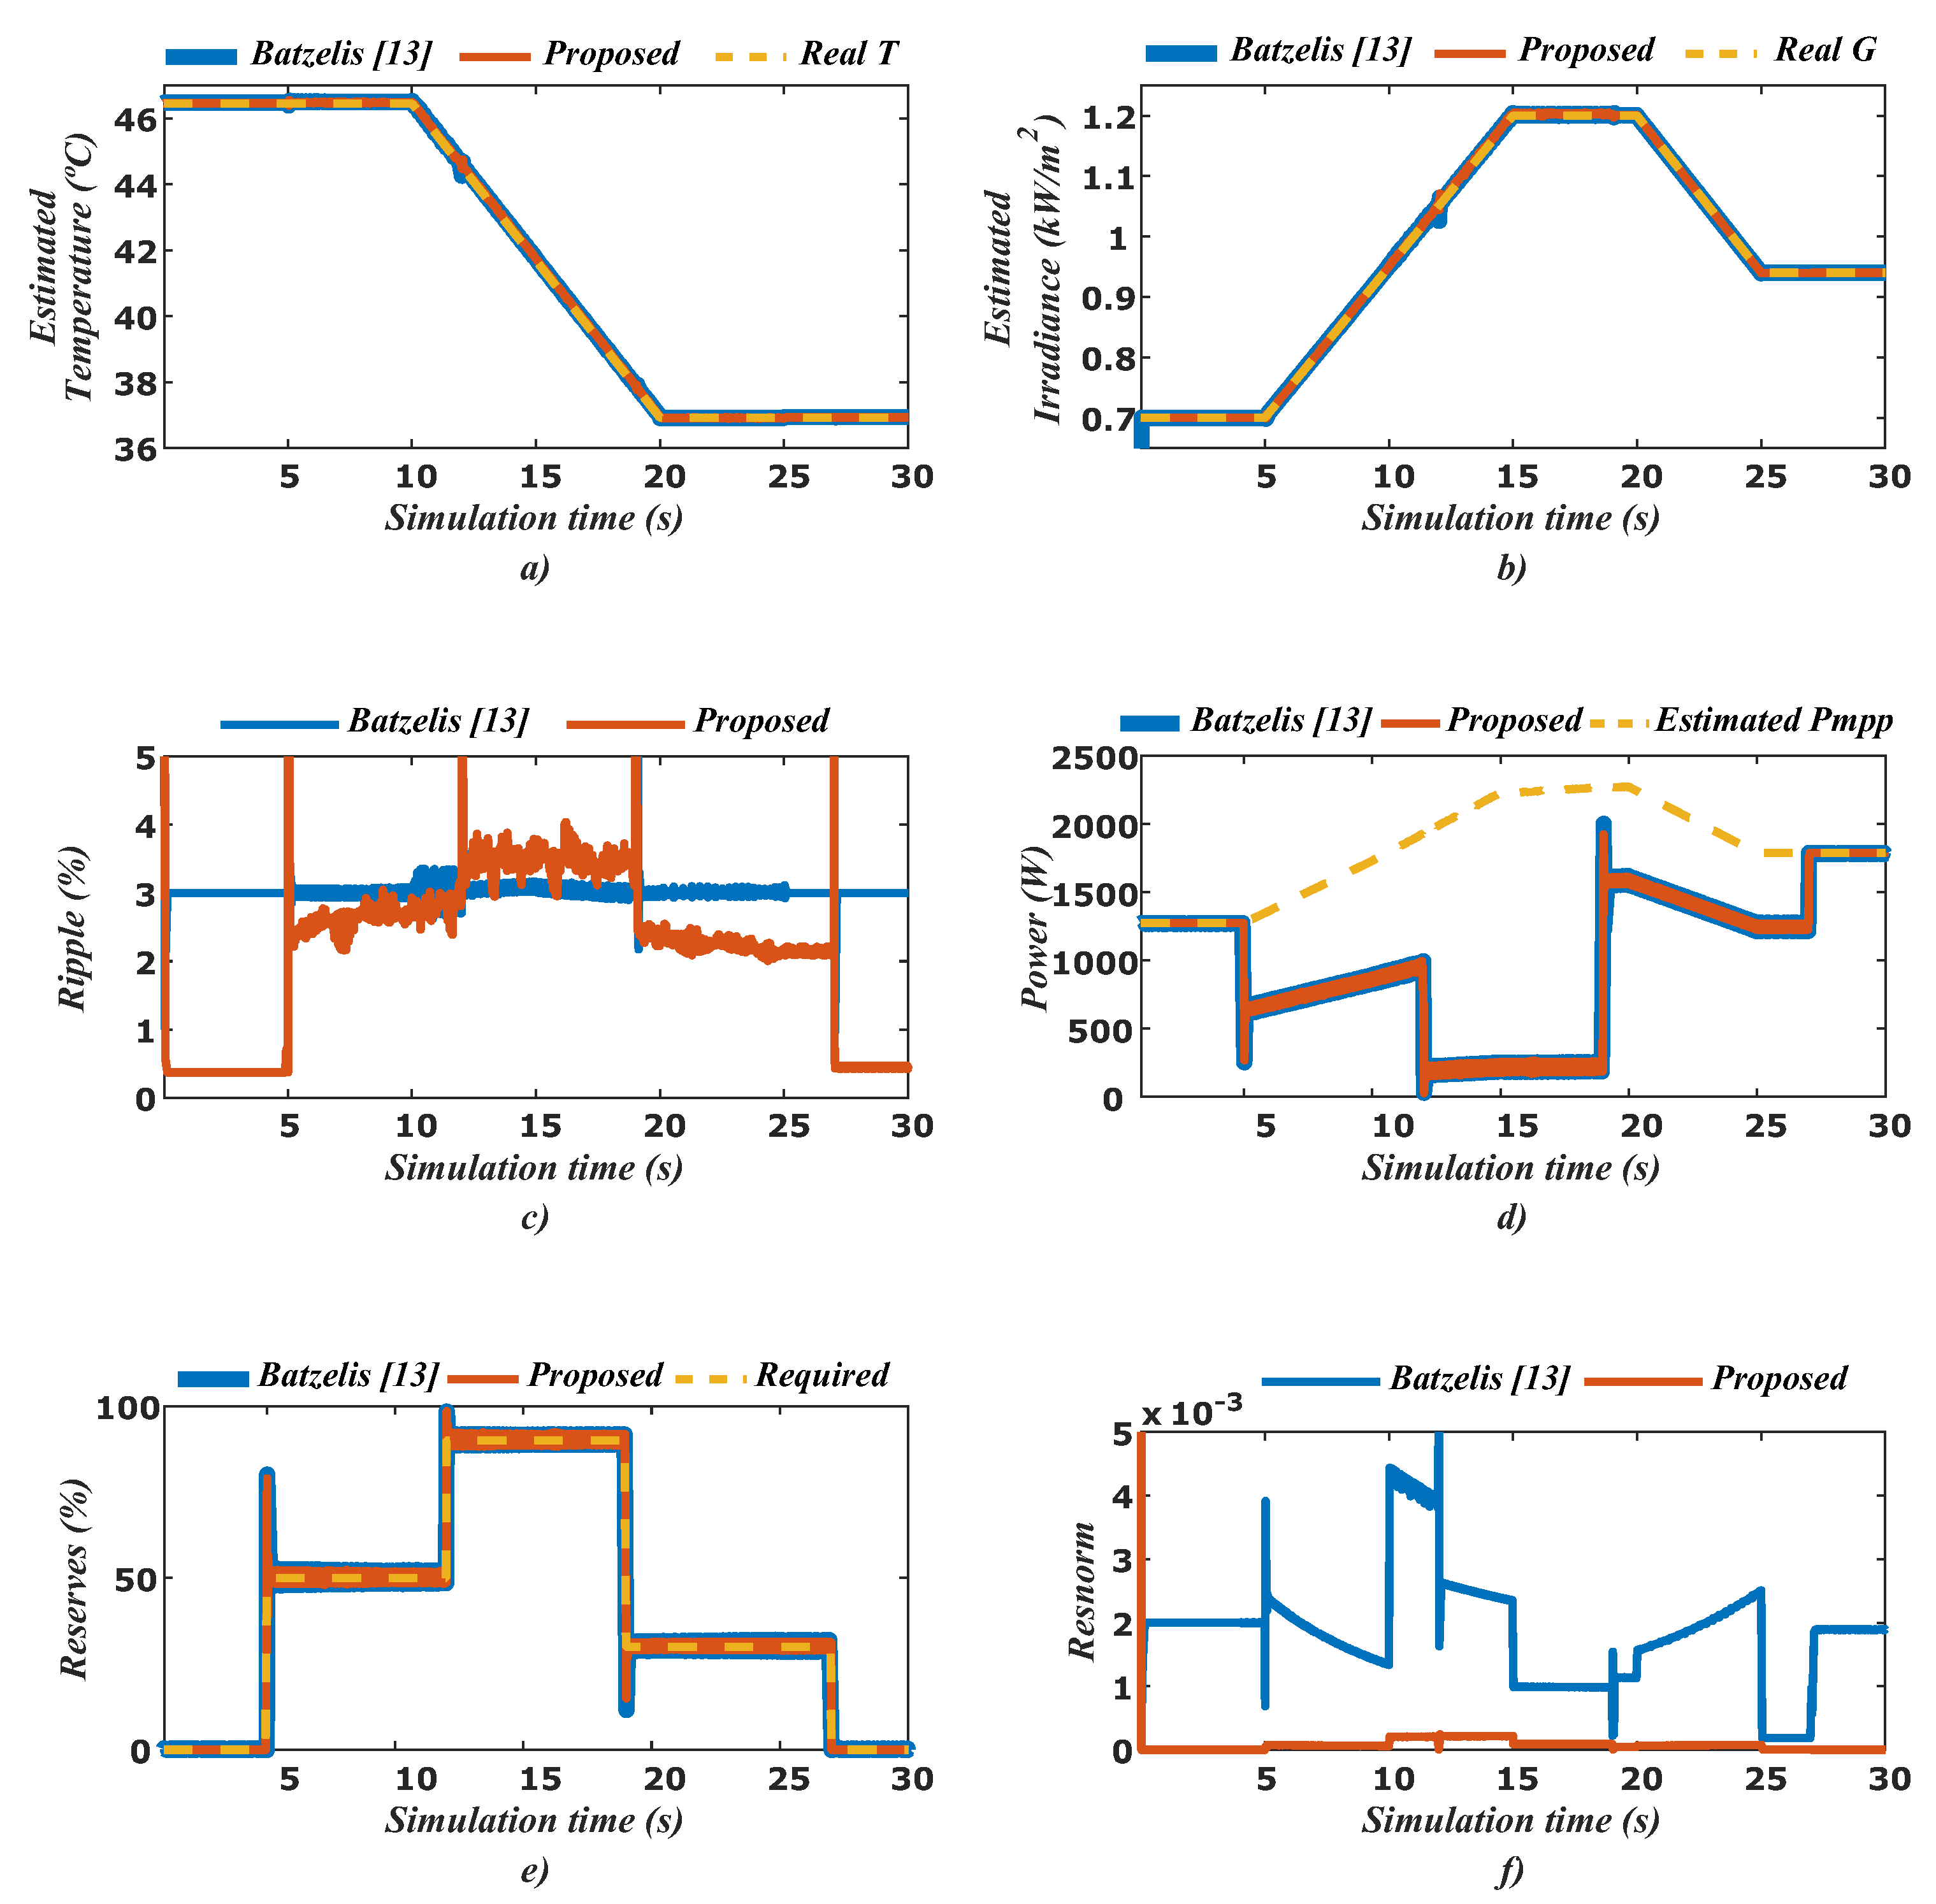
curve when there are sudden changes in irradiance and operate them on the right when curtailment is long enough that temperature may change. To evaluate the developed strategy, three case studies have been thoroughly designed. In the first case study, it has been demonstrated that with this methodology it is possible to shift the operation side without altering the available power reserve. In the second one, a scenario with a trapezoidal irradiance profile is presented. When power curtailment is required, the PV system is operated on the left part of the MPP. In these conditions, the incident irradiance and the MPP were estimated with a high level of accuracy. The last scenario compared the proposed strategy with the one suggested by Batzelis [
13]. The irradiance, temperature and power reserve profiles have been replicated from the aforementioned work. With these conditions, the proposed methodology showed a better performance in terms of the curve fitting process. In the last scenario, it can be also seen that the inherited ripple may suffice in order to obtain an adequate window measurement.
Finally, for future research, the authors suggest an experimental validation of the proposed methodology and the realization of studies on frequency stability in weak electric power systems with high photovoltaic penetration.


