Article

Environmental and Comparative Assessment of Integrated Gasification Gas Cycle with CaO Looping and CO2 Adsorption by Activated Carbon: A Case Study of the Czech Republic

1
ÚJV Řež, a. s., Hlavní 130, Řež, 250 68 Husinec, Czech Republic
2
Department of Environmental Chemistry, Faculty of Environmental Technology, University of Chemistry and Technology, Prague, Technická 5, 166 28 Praha 6, Czech Republic
3
CEG-IST, Instituto Superior Técnico, Universidade de Lisboa, 1049-001 Lisbon, Portugal
4
Department of Energy Engineering, Faculty of Mechanical Engineering, Czech Technical University in Prague, Technická 4, 166 28 Praha 6, Czech Republic
*
Authors to whom correspondence should be addressed.
Energies 2020, 13(16), 4188; https://doi.org/10.3390/en13164188
Submission received: 30 June 2020 / Revised: 10 August 2020 / Accepted: 12 August 2020 / Published: 13 August 2020
(This article belongs to the Special Issue Life Cycle Assessment of Energy Systems)

Abstract

:
The Czech Republic is gradually shifting toward a low-carbon economy. The transition process requires measures that will help to contain energy production and help to reduce emissions from the coal industry. Viable measures are seen in carbon capture technologies (CCTs). The main focus is on the environmental and economic comparison of two innovative CCTs that are integrated in the operational Czech energy units. The assessed scenarios are (1) the scenario of pre-combustion CO2 capture integrated into the gasification combined cycle (IGCC-CaL) and (2) the scenario of post-combustion capture by adsorption of CO2 by activated carbon (PCC-A). An environmental assessment is performed through a life-cycle assessment method and compares the systems in the phase of characterization, normalization, and relative contribution of the processes to the environmental categories. Economic assessment compares CCT via capture and avoided costs of CO2 and their correlation with CO2 allowance market trend. The paper concludes with the selection of the most suitable CCT in the conditions of the Czech Republic by combining the scores of environmental and economic parameters. While the specific case of IGCC-CaL shows improvement in the environmental assessment, the economic analysis resulted in favor of PCC-A. The lower environmental–economic combination score results in the selection of IGCC-CaL as the more viable option in comparison with PCC-A in the current Czech energy and economic conditions.

1. Introduction

Energy self-sufficiency and low-carbon-economy transition are the concepts currently forcing the coal-based energy industry to significantly decrease its produced emissions. The annual consumption of coal (in coal-based industries) in the Czech Republic is over 60 million tons per year, ranking Czech Republic at 17th in worldwide consumption [1]. The Czech energy industry is also dependent on imports of 97% of oil and gas [1]. Several measures were adopted to reduce energy import dependence, including implementation of a higher share of renewable energy sources and more efficient use of fossil fuels such as brown coal [1]. However, the transition process cannot be sudden and must be gradually implemented by viable investments. One such investment, which seems to be feasible for the current Czech energy industry but also usable for steel industries, is carbon capture technologies (CCTs). These technologies must be carefully assessed and planned for the specific conditions of a given country. There are three parameters that must be considered for the feasibility assessment of CCT—(i) technological feasibility, (ii) economic performance, and (iii) environmental performance. This paper considers each of these three parameters in a new combined analysis.
In the conditions of the Czech operational power units, several CCT options were considered, such as post-combustion technologies of ammonia scrubbing, activated carbon adsorption (PCC-A), and pre-combustion integrated gasification gas cycle with integrated carbonate loop (IGCC-CaL). These technologies are the subject of intensive research and optimization to achieve their implementation into the operational power units. The decision-making process for the choice of suitable technologies may be significantly influenced by environmental performance consideration via comprehensive methodology. Life cycle assessment (LCA) is one of the best certified methods to create environmental models of the considered systems. LCA allows the comparison of the assessed systems among each other [2].
The ammonia scrubbing process of LCA was already performed [3]. The ammonia scrubbing process increased the impact of fossils depletion and mineral resource depletion in comparison with the power unit (250 MWe) without CCT. That is caused by a large amount of additional energy consumption for ammonia solvent preparation. Moreover, energy efficiency of the power unit decreased from 38% to 27%. The environmental problem occurs with the treatment of ammonia salts, currently considered as non-utilized waste. On the other hand, CO2 was captured in a ratio of 90%.
An LCA for the PCC-A system for Czech conditions was recently published by the authors of this paper [4]. The LCA model in the study considers a functional unit nominal power output of 250 MWe. The paper concludes that adding such technology would increase the energy demand (an additional 1133 MJ for hard coal activation) and fossils depletion. The reason for this is the resource consumption of hard coal (additional fresh carbon 23 kg/h) in the production chain of the activated carbon.
IGCC-CaL was not previously assessed for the Czech conditions from the environmental point of view. However, several studies were made for the IGCC systems integration and its environmental assessment. A summary of the following studies can be found in Table 1.
The extensive study by Singh et al. [5] compares the environmental results for 400 MWe power plants with post, pre, and oxy-fuel combustion capture systems. For pre-combustion systems with IGCC based on Selexol absorption, the CO2 capture ratio is 90%, with an energy efficiency of 37.6%. Comparative LCA was made by hybrid LCA approach, using input–output analysis together with the ReCiPe 2008 version 1.02 method. Environmental results of a pre-combustion system show a reduction of 78% in the category of global warming potential (GWP), the highest reduction in comparison with the aforementioned systems. On the other hand, IGCC system contributes to increase of 120% in category of freshwater eutrophicaton (FE), influenced mainly by infrastructure development.
Cormos C. [6] evaluated the techno-economic and environmental performance of IGCC system for power plant concepts of a net power output of about 400–500 MWe. The study states that the introduction of the CCT system decreased net plan energy efficiency by 7.1–9.5%. The environmental part of the study compared the IGCC systems based on the physical solvent Selexol. Environmental impacts refer to the production of 1 kWh of electricity. However, the impacts were categorized in normalized mass and energy flows where the integration of the IGCC systems caused an increase of coal (25%), oxygen (24%), and cooling water (22%) consumption, and the ratio of captured CO2 was modelled at 90%.
In another study [7], three following three systems were compared: (i) a conventional supercritical coal power system, (ii) an IGCC-CCS system based on Selexol solvent system, (iii) and an IGCC without CCS. The systems were chosen according to equal coal consumption rather than equal electricity production. The environmental results for IGCC systems per 1 MWh are based on mass–energy balances and show higher water consumption due to the gasification process and the shift reaction in comparison to the power unit without CCT. The IGCC system with CO2 capture was designed for 81% CO2 capture ratio. The IGCC-CCS system reduced net energy efficiency from 32.1% (IGCC without CCS) to 26.1%.
The work of Petrescu et al. [8] compares IGCC power plant with gross electric output of 570.61 MWe and 2 IGCC-CCS systems. Two compared IGCC-CCS systems are based on Ca-based (IGCC-CaL) sorbents and iron-based oxygen carriers (IGCC-FeL). The used method for LCA analysis was CML 2001 using GaBi software. In both scenarios, the highest values refer to GWP, where the majority (85%) comes from coal mining and extraction. The results show that the highest carbon capture rate happens with IGCC-FeL (99.45%), with a net electrical efficiency drop from 45.09% to 38.76%. Energy efficiency dropped for IGCC-CaL from 45.09% to 36.44%, and the capture rate was 91.56%.
Regarding CaO looping, some studies were done for post-combustion CO2 capture. One study [9] considers 600 MWe supercritical pulverized coal power plant as a basis for CCT. According to the study [9], net energy efficiency drops from 39% to 32% due to CaO looping. LCA analysis was done at the endpoint level via SimaPro v8.3 software. The results indicate an increase in resources depletion, ozone depletion, and toxicities. The climate change impact was reduced by 72%.
Clarens et al. [10] compared a sub-critical coal power plant without CCT (500 MWe; net plant efficiency 36.9%), post-combustion capture technologies based on amine absorption (Econamine and Econamine FG+), and CaO looping without capture. This study used the LCA method of ReCiPe v1.04 and Simapro software. The CaO looping results in the best environmental performance among all systems in the categories of ozone depletion, photochemical ozone formation, particulate matter, and water depletion impacts. The CO2 capture ratio was 90% in each CCT systems. However, the net plant efficiency for the Econamine case dropped from 36.9% to 22.3%, for Econamine FG+ to 25.9%, and for CaO loop to 29.6%.
The literature survey clearly shows that very few environmental assessments were done on the subject of pre-combustion IGCC-CaL and none for comparison of IGCC-CaL and PCC-A. Moreover, the data in the studies is, in the majority, based on literature sources and heat-mass models rather than real case studies. Also, the selected environmental assessment methods were based on mass-energy flows analysis or methods such as hybrid LCA or CML.
The first part of the paper is focused on the environmental study that compares both CCT systems integrated into their reference power plants. The environmental study does not evaluate the reference power plants without CCT due to lack of data for a single IGCC system. Moreover, IGCC-CaL was designed as the one whole technology with an already integrated CCT system. Yet, in the case of PCC-A, a recent study [4] published by the same authors compares the reference 250 MWe power unit and the same reference power unit with PCC-A.
The second part of the paper is the economic study of both systems. The economic part compares the investments of both systems (IGCC-CaL, PCC-A) with the case of the energy system without CCT based on the cost and market trend of CO2 allowances.
The third part of the paper combines environmental and economic results to determinate the specifics that can influence the decision-making process for the final technology selection.
The paper has several contributions:
  • Environmental performance of two innovative systems in the conditions of the Czech energy mix;
  • Comprehensive LCA model including decision-making processes of characterization, normalization, pareto analysis;
  • Identification of cost effectiveness of energy systems without CCT and with assessed CCT;
  • Selection of the most suitable technology via a combined analysis of the environmental and economic dimensions.
The paper is structured as follows: Section 2.1 defines the LCA methodology, Section 2.2 defines the economical assessment method, Section 3.1 provides a technical description of case study 1, Section 3.2 provides a technical description of case study 2, Section 3.3 defines the systems boundaries, Section 3.4 describes a life cycle inventory, Section 3.5 defines the cost effectiveness parameters, Section 4.1 presents the results of the life cycle impact assessment. Section 4.2 presents the Pareto analysis, Section 4.3 presents the results for cost effectiveness comparison, and Section 5 and Section 6 provide the discussion and conclusions.

2. Materials and Methods

2.1. Life Cycle Assessment

The environmental assessment of this study was made using a life cycle assessment (LCA). Life cycle is comprised by the materials extraction, whole supply chain of materials and energies, production process of the specific product, utilization, and end of life. Therefore, the LCA method is considered as a “cradle to grave” analysis. The LCA method consists of the following four steps, defined by the ISO 14,040 standards [11]: goal and scope definition, inventory analysis, life cycle impact assessment, and interpretation.

2.1.1. Goal and Scope Definition

This step outlines the depth of the study by defining the assessed scenarios, their system boundaries, and functional unit. This study aims to assess and compare the environmental impacts of CO2 capture of two scenarios:
(1)
Scenario 1 defines IGCC pre-combustion CO2 capture via CaO looping;
(2)
Scenario 2 defines post-combustion CO2 capture via activated carbon adsorption.
The functional unit (FU) definition provides a reference to which all inputs and outputs of the system are calculated. Thus, FU allows the comparison between the different systems. In this study, FU is defined as 1 kWh of produced electricity, the usual definition of FU for energy systems. The system boundaries describe the processes and modules of the assessed systems included (and excluded) in the environmental model.

2.1.2. Life Cycle Inventory (LCI)

This phase aims to model the system via data collection. Data collection must follow the system boundaries and FU definition. Both scenarios are based on real case studies data from the operational power units. Data was collected within the time frame of one year. For the CCT units, data was collected from the technical project reports [12,13].

2.1.3. Life Cycle Impact Assessment (LCIA)

LCIA comprises classification, characterization, normalization, and weighting process, where the energy and mass flows of the previous step are transformed into environmental impacts. These environmental impacts are calculated according to the selected impact method. Each substance of the assessed systems is multiplied by the characterization factors that determine the potential contribution to the specific environmental impact. An optional step for LCIA is normalization. Normalization enables the comparison between different impact categories. Normalization uses the dataset of the reference indicators of environmental impacts for the European region or worldwide. Thus, the results are values that show the contribution to the sum of European (or world) impacts in the specific environmental category [14].
In this study, the chosen LCIA method is the ReCiPe v.1.08 method of GaBi software at the midpoint level. Based on Carvalho et al. [2], the ReCiPe method is the LCIA, which is intended and tailored for the comprehensive environmental process impact assessment. Also, the ReCiPe method is highly recommended by the EU commission [15]. The characterized midpoint environmental indicators are ozone depletion (OD), human toxicity (HT), ionizing radiation (IR), photochemical oxidant formation (POF), particulate matter formation (PMF), terrestrial acidification (TA), climate change (CC), terrestrial ecotoxicity (TET), agricultural land occupation (ALO), urban land occupation (ULO), natural land transformation (NLT), marine ecotoxicity (MET), marine eutrophication (ME), fresh water eutrophication (FE), fresh water ecotoxicity (FET), fossil depletion (FD), metal depletion (MD), and water depletion (WD) [16].

2.1.4. Interpretation

In this phase, the results are further processed and discussed. The interpretation identifies the significant environmental problems and suggests the optimization of the process toward lowering the impacts. Moreover, it describes the hotspots from assessed processes and indicates significant impact categories. The identification of the significant environmental problems can be done through a Pareto analysis, using the statistical Pareto rule (80/20 rule) [17]. It determines that 20% of all impact categories contributes to 80% of the total environmental impact [2]. Data for Pareto analysis is normalized.
To summarize, the LCA method used in this study was performed by the ReCiPe method. The characterization and normalization were done according to the midpoint level of ReCiPe v 1.08. Moreover, additional Pareto analysis were done to specify key environmental impacts, and further analysis of the concrete processes was made to identify the influence on the environmental impacts.

2.2. Economical Feasibility of the CCT Integration

The economical assessment is the feasibility evaluation required for the comprehensive comparison of the considered technologies. The aim of this economical study is to analyze and compare the cost effectiveness of the reference energy units (REUs) without CCT systems and REU with integration of CCT. The key parameters to compare cost effectiveness are the costs of 1 ton CO2 separated (for REUs with CCT) and emitted (for REUs without CCT). To perform a cohesive economical assessment, this assessment is based on the technical report [18], which combines several economical international standards and methods tailored for the considered CCT. The economical assessment for this study is based on basic parameters such as
  • Capital expenditures (CAPEX);
  • Operational expenditures (OPEX);
  • Cost of electricity (COE);
  • Capture cost (CCo);
  • Avoided cost (AvCo).
CAPEX represents the capital expenditures required for the construction of the CCT as a completely new technology or as a retrofit of current technology. This study considers the construction of new technologies from the “greenfield” in both case studies. The costs of the required systems are taken from the market offers of the suppliers of the technological subsystems [19].
OPEX represents the sum of all the operational costs in the first year of the system’s operation. The operational costs for energy systems include fuel costs, costs for each media (water, sorbents, desulphurization media, etc.), waste management costs, personal costs, and maintenance costs. Data for the OPEX calculations was taken from the literature sources and real operational data taken by experts from the Czech energy group UJV [18,19].
COE reflects the cost of the electricity produced by the energy source. This criterion shows a simplified view on the economic efficiency of the considered energy source. Thus, if the COE of the assessed energy source is lower than the actual market price of the electricity (in the specific year of operation), the energy source is economically effective (and would therefore generate profit).
CCo represents all the costs required for the separation and capture of 1 ton of CO2. For REUs without CCT, CCo is determined by the price of CO2 allowance. The correlation between CCo of carbon capture systems and the market trend of CO2 allowance determines the cost effectiveness of the carbon capture systems. Moreover, the cost effectiveness of the carbon capture systems shows potential competitiveness in the CO2 trading market.
AvCo represents the equivalent of CO2 emissions allowance costs. AvCo defines the costs of 1 tone CO2 emitted to air.

3. Case Study Definition—Technological Possibilities for CO2 Emissions Reduction in the Czech Republic

Two innovative technologies via IGCC integrated CaO looping and CO2 adsorption on active carbon will be explored in the context of Czech coal power units. The adsorption process for the Czech conditions was described in detail in the recent publication of Zakuciová et al. [4].

3.1. Case Study 1—IGCC Power Plant with CaO Looping

The case study is represented by the steam-gas cycle of gross power output of 392 MWe connected to the pre-combustion technology of the integrated gasification combined cycle (IGCC) with integration of the carbonate loop. IGCC uses the high pressure gasifier to produce pressurized gas (synthesis gas) from the carbon-based fuels [12]. The principle of the system is based on steam-gas cycle with hydrogen combustion and with integrated gasification of lignite with CO2 capture from the gas before combustion. The IGCC system ensures the removal of impurities such as sulfur dioxides and particulates from the syngas before the actual carbonate looping. The case study represents a specific technology, where the elimination of the acid impurities is based on high temperature desulphurization by adsorbent of CaO/CaCO3.
The main advantage of the calcium looping system is the high degree of CO2 removal (up to 95%) and the process of simultaneous desulfurization [20].
To understand and define the system’s boundaries while comparing scenarios, it is important to describe both scenarios from technical point of view.
The IGCC process can be divided into the following technological segments (Figure 1):
  • Management and treatment of the fuel;
  • Oxygen production—cryogenic separation;
  • Gasification process—shell gasification technology;
  • Purification of the synthetized gas (high temperature desulphurization and ceramic filter for particulates separation), water gas shift reaction, and CO2 separation by carbonate looping;
  • Energetic utilization of synthetized gas with high H2 content (steam–gas cycle).

3.1.1. Fuel Management and Treatment

The management of the fuel comprises lignite mining, transportation, storage, crushing (max. 40 mm), drying and grinding (max. 200 µm). Lignite is expected to be mined from the ČSA (Karviná region) quarry due to specific parameters (low concentration of ash). The lignite is then transported by railways to the storage located next to the power unit, ground, and dried to 200 µm with a maximum level of moisture (11%). The process of lignite drying uses the energy from the steam produced in the steam-gas cycle. For drying we expect use WTA (waste heat utilization) technology.

3.1.2. Oxygen Production

Oxygen will be produced in the separated oxygen unit. The recommended process of the oxygen separation from the air is the cryogenic separation, a well-known and viable process. The electricity used for the cryogenic separation will be generated from the steam–gas cycle. The main outputs from the cryogenic separation are oxygen with 95% purity and nitrogen with purity of 98.7%. The nitrogen is then mixed with hydrogen as a fuel to the steam–gas cycle.

3.1.3. Gasification Process

The gasification process of lignite is operated in a Shell generator (considered a modern and verified technology for this process). This type of generator ensures the lowest content of organic compounds that can create problems in the further purification process. In the generator, the oxygen reacts with the lignite (chemical reactions (1) and (2) [21]) in an exothermic reaction, creating a temperature around 1500 °C. In this temperature, the ash from the fuel is transformed into liquid slag. Gas coming out of the generator is cooled down by the injection of water to the temperature of 900 °C.
C + O2 → CO2H= − 394 kJ/mol
C + 0.5 O2 → CO ∆H= − 111 kJ/mol

3.1.4. High-Temperature Purification Process, Water Gas Shift Reaction, and Carbonate Looping

The high-temperature purification process includes high-temperature desulphurization at temperatures between 800–900 °C. Desulphurization is done via adsorption of all the acidic impurities (e.g., H2S) on sorbent CaO/CaCO3 (reaction (3)) [22] that comes from the carbonator. The waste product after the purification process is a mix of CaCO3 + CaSO4, which is transported as waste to a landfill.
CaO + H2S → CaS + H2O
The output from the purification process is purified gas. The gas is then transported into the water–gas shift reactors where the shift reaction is achieved. Said reaction (4) [21] converts CO into CO2 by steam. The purified gas after the shift reaction contains a higher rate of CO2.
CO + H2O → CO2 + H2H = −41 kJ/mol
After the shift reaction, the gas is transported into the carbonate loop system, where the CO2 is separated. At first, the gas enters the carbonator. In the carbonator the exothermic reaction of CaO with CO2 takes place (reaction (5)) [21].
CaO (s) + CO2 (g) → CaCO3 (s) ∆H = −178.2 kJ/mol
The temperature in the carbonator should not exceed 800 °C. The gas after the carbonation process proceeds into the combustion chamber with turbine.
The produced CaCO3 from the carbonator is transported into the calcinator that works in the oxyfuel regime. The temperature in the calcinator increases to 950 °C and the CaCO3 is decomposed back into CaO and CO2 (reaction (6)) [21]. CaO returns into the carbonator to be used as sorbent. Moreover, a fresh batch (2.5 t/h) of CaCO3 is periodically (once in 20 min) added into the calcinator.
CaCO3 (s) → CaO(s) + CO2 (g) ∆H = −178.2 kJ/mol
The emissions from the calcination process (mainly CO2) are cooled and compressed. The liquefied CO2 is separated. The CO2 compression requires auxiliary energy, provided from the steam–gas cycle.

3.1.5. Energetic Utilization of Synthetized Gas

Gas with high H2 content (after the purification, shift and CO2 capture) will be mixed with nitrogen (waste product of oxygen production). The mixture of the synthetized gas with nitrogen ensures the high energy efficiency of the whole system. Thus, the net calorific value of the synthetized gas must not be lower than 12.8 MJ/kg (6.9 MJ/m3).
The unique principle of the case study was designed and tailored for the conditions of Czech operational power unit. The whole concept was designed by the biggest energy research company in the Czech Republic (UJV group) for the national project [12]. The advantage of this system is not requiring such a high external energy input. On the other hand, IGCC-CaL system lowers the power generation efficiency to 25.3%.

3.2. Case Study 2—Activated Carbon Adsorption

Case study 2 considers the thermal power unit with the gross output of 250 MWe connected to post-combustion carbon capture technology based on adsorption. The adsorption unit was designed as a pilot facility to capture CO2 from operational flue gases. It is based on a rotative adsorber of continuous operation. The rotative adsorber operates in three phases of adsorption, desorption, and cooling. In the operation (even with minimum concentration of pollutants in the flue gases entering adsorber), the sorbent will degrade, and it is necessary to periodically it with 23 kg/h of the activated carbon pellets. The source for active carbon production is hard coal. Hard coal is further processed in two steps of (1) carbonization of the raw hard coal without presence of oxygen and (2) activation of the carbonized product by water vapor. The whole process chain can be divided into technological segments as follows:
  • Preparation of fuel for the power unit;
  • Preparation of solvent for flue gas purification and cooling;
  • Preparation of activated carbon for CO2 capture;
  • Operational part of the power unit;
  • CO2 capture and compression.
The technological details of the whole technology are described in Zakuciová et al. [4] and the technological segments are shown in Figure 2. The advantage of this process is the continuous operation and higher power generation efficiency of 33.73%. However, the activated carbon production requires a process of activation and carbonization that consumes more raw material (hard coal) and energy.

3.3. LCA Study—System Boundaries Definition

The system boundaries for both scenarios are based on the technological description of each system (Figure 1 and Figure 2). Scenario 1 (case study 1) includes all the described technological segments of fuel management, carbonate loop with carbonate production chain, gasification and purification processes, combustion of the syngas, steam gas cycle with electricity production, and CO2 capture.
Scenario 2 (case study 2) was proposed in a previous study [4]. The system boundaries for the adsorption process includes the fuel supply chain for the power unit, sorbent supply chain for adsorption process, and the NaOH treatment process. Moreover, the boundaries consider the operational part of the power unit including energy production, fuel combustion, flue gas treatment, CO2 adsorption process, and treatment of the waste products.
Both scenarios are including CO2 compression (CO2 compressed to 10–11 MPa). The further CO2 transport and storage are not included in the system boundaries due to lack of current scenarios for the storage of the captured CO2 in Czech conditions. The assumption is to sell the captured CO2 as a viable product for greenhouse farming or algae-based CO2 conversion.

3.4. Life Cycle Inventory

The inventory data for both scenarios are based on the Czech operational power units in the conditions of the Czech national energy mix. The actual operational data was taken from the reference power unit of 250 MWe. In the case of post-combustion by activated carbon adsorption, data was calculated to comply with the dimensions of the 250 MWe power unit. In the case of IGCC-CaL, the whole system was designed and simulated for dimensions comparable with the 250 MWe power unit.
Inventory data for scenario 1 (Table 2) was collected from data calculated by experts based on operational parameters of the power unit. The data is the subject of the national research project [12].
The composition of syngas [12] is described in the following table (Table 3).
Inventory data for the scenario 2 is described in Table 4. Inventory data for PCC-A was (like in case study 1) optimized by calculations based on the operational parameters of the power unit. Data for operational power unit without CCT was obtained from the actual operation of 250 MWe unit [13].
The following table (Table 5) shows the differences between both scenarios in terms of energy consumption for both systems with implemented carbon capture systems, percentage of captured CO2 and differences in the thermal efficiency before and after carbon capture implementation.
Moreover, these additional assumptions were taken into consideration for both scenarios:
  • Energy required for activated carbon production and calcium carbonate production is based on natural gas;
  • Carbonate waste and reactive products are considered as a waste for landfill;
  • CO2 captured is considered as a valuable product for further utilization;
  • Transport distances by diesel from mining quarries to power unit are modelled as average distance of 500 km;
  • Wastewater is considered for the further treatment in the wastewater treatment plant data taken from the database of EU standard of the Thinkstep dataset;
  • Process of oxygen production via cryogenic separation is based on database process from the EU28 Thinkstep database;
  • Water for the power units is considered as processed water (demineralized, deionized);
  • Production chain of materials such as limestone, NaOH, and oxygen are taken from the EU standard of the Thinkstep dataset;
  • Specific regional production a mix of hard coal and lignite is taken from the Czech and Slovak Thinsktep dataset.

3.5. Economical Assessment-Cost Effectiveness Parameters Definition

As stated in Section 2.2, CAPEX, OPEX, and COE are the basic parameters for the cost effectiveness comparison. It is important to mention that CAPEX and OPEX are different for both REUs that are prepared for IGCC-CaL and adsorption integration. Apart from the difference in the technological segments, which influence CAPEX data [18,19], also OPEX variables such as fuel costs, solvent/adsorbent cost and final cost of the produced electricity vary for each REU system (Table 6). However, the operational time for both systems is assumed to be equal (7400 h/year). CAPEX and OPEX for the REUs and REUs with CCT systems are summarized in the Table 7.
COE is based on the following Equation (7):
C O E = I 0 ( t = 1 ) + O f i x + O v a r P e
where
  • I0 is the modified ratio of capital expenditures that refer to 1 year of the operation (€/year);
  • Ofix are fixed operational costs (e.g., costs for maintenance and repairs) (€/year);
  • Ovar are variable operational costs (e.g., fuel costs) (€/year);
  • Pe amount of produced and delivered electric energy to the net in the first year of operation (MWh/year).
The cost effectiveness is based on Capture cost (CCo) and is calculated as follows Equation (8):
C C o = C O E w i t h   C C T C O E w i t h o u t   C C T a m o u n t   o f   s e p a r a t e d   C O 2
For REU, the cost effectiveness is based on the price of the CO2 allowance. This study is taking into account the market trend of the price of CO2 allowances for the time frame of 2015–2050 [23,24,25,26].
The parameter of avoided cost of emitted CO2 is expressed as follows Equation (9):
A v C o = C O E w i t h   C C T C O E w i t h o u t   C C T e m i s s i o n s   C O 2 w i t h o u t   C C T e m i s s i o n s   C O 2 w i t h   C C T

4. Results

This section presents the results according to the methodology for LCIA and economic methodology. Further analysis of the results is discussed in detail in Section 5.

4.1. Life Cycle Impact Assessment

The results for both scenarios (Table 8) are divided into three groups of values:
  • Characterization values of the environmental category;
  • Normalized values according to ReCiPe 1.08 Midpoint normalization for the European region (units for all the impact categories are points);
  • Relative contribution of each environmental category to the sum of all impact categories based on normalized values.
The characterization values show results in absolute values (first column for scenario 1 and 2), comparable only within one impact category.
The normalized results (second column for scenario 1 and 2) allow us to compare the severity of environmental impact categories among them, as all the impact categories are calculated in common units (points).
The relative contribution (third column for scenario 1 and 2) helps to identify a contribution of each environmental category in a certain ratio (%) to the sum of normalized values of all impact categories (100%). Relative contribution of each environmental category computes according to Equation (10).
C o n t i c = N V i c S U M N V × 100
where
  • Contic is the relative contribution of each environmental impact category to the sum of environmental impacts;
  • NVic is the normalized value of the specific impact category;
  • SUMNV is the total sum of the normalized values of all impact categories.
The sum of all normalized values indicates that scenario 1 has lower environmental impacts than scenario 2 and, therefore, better environmental performance. From Table 8, it is possible to verify that POF, TA, and PMF show the highest relative contributions regarding the total environmental impact of the systems.
In scenario 1, marine eutrophication and fossils depletion have also (6.71% and 5.46%) notable relative contribution. All other categories have relative contribution below 1%.
Categories of CC and FD are also important to analyze. The assessed systems are dealing with CO2 capture; thus, the category of CC is directly influenced. Also, the brown coal mining and treatment are key processes which influence the category of FD.

4.2. Pareto Analyses and Comparison of the Processes among Scenarios

As previously stated, Pareto analysis helps to define the environmental categories of the highest significance to the total of environmental impacts. Figure 3 and Figure 4 show the key impact categories for each scenario. Both scenario 1 and scenario 2 identify the most significant environmental categories of POF, TA, and PMF. Both figures show just the visible values on the plot. The remaining impact categories have a relative contribution below 1%.
In the next step, it is important to define the hotspots in the processes (most impactful processes) for both scenarios. Therefore, further analysis of the potential contribution of the processes for the most critical impact categories was performed. In this analysis, the categories cannot be compared between each other. The analysis is based on the characterization values, and therefore, it is focused on one impact category at the time, influenced in different ratios (%) by different processes. The results for the processes contribution are summarized in Table 9.
In the category of climate change, the flow of captured CO2 is referred to as environmental credit. However, in both cases, the CO2 emissions and clean flue gases are still released to the air and therefore contribute to the environmental impacts. Some of the processes do not have any relative impact to the environmental categories.

4.3. Cost Effectiveness Comparison

According to the Equations (7)–(9), COE, CCo, and AvCo for both IGCC-CaL and PCC-A systems are summarized in the following table (Table 10).
The cost effectiveness is shown in Figure 3. The figure shows the correlation between the carbon price on the market (black lines) from 2015 up to 2050 [23,24,25,26] and CO2 avoided costs of both CCT systems connected to REU. The comparative economic criteria were defined/re-calculated with respect to the inputs and variables based on 2018. Two primary cases were analyzed. The first case (red and green dotted lines) describes CCT utilization as a key economic unit in carbon capture utilization (CCU) scheme with the possibility of using CO2 within the enhanced oil recovery, fuel production, etc. The second case (red and green dashed lines) reflected the CCT as a fundamental unit together with transportation and storage in the carbon capture and storage (CCS) scheme. The Czech Republic considers CO2 transport by pipelines into salt aquifers in the Zatec Basic (North-West Bohemia, the Czech Republic) [27,28].
The carbon price curve demonstrates the possible development of the market of carbon price in 2015–2050. The proposed estimation in Figure 5 was defined as a combination of the real average annual data from the market (black line) and an estimate based on CAKE/KOBiZE forecast (dashed black line). Moreover, the initial CAKE/KOBiZE forecast [25] is also displayed in Figure 5 (dotted black line). This forecast was evaluated based on the Paris Agreement for the Central Europe power sector (more precisely Poland).

5. Discussion

The discussion part follows the sections of the results. At first, the environmental assessment with processes analysis will be discussed. In the second part, the economical assessment will be analyzed. In the last part, the combination of environmental and economic results will be concluded.

5.1. Environmental Assessment

The results of the characterization, normalization, and relative contribution of the environmental impacts are shown in Table 8. The absolute values of the characterization process enable the comparison of the same environmental impact category among scenarios. At first glance, scenario 1 has a lower characterization values in comparison with scenario 2 in almost all environmental categories except in the category of ionizing radiation. Ionizing radiation in scenario 1 is influenced by the process of oxygen production via cryogenic separation. This process is the database process and does not reflect the local impact. Moreover, the radiation impact has an insignificant contribution in comparison with other impacts (sc.1 0.16%; sc.2 0.06%).
When we aggregate the environmental impact categories after normalization (see Table 8 sum of normalized values), the scenario 2 has a higher global environmental impact (0.00231) than scenario 1 (0.0042). However, it is important to stress out that the case studies considered within this manuscript are different in several parameters such as (i) different scale of REU, (ii) site specific case studies (iii) different power generation technology. Therefore, the environmental performance for scenario 2 might be improved regarding LCA results if the REU technology would have the same technological basis in both cases.
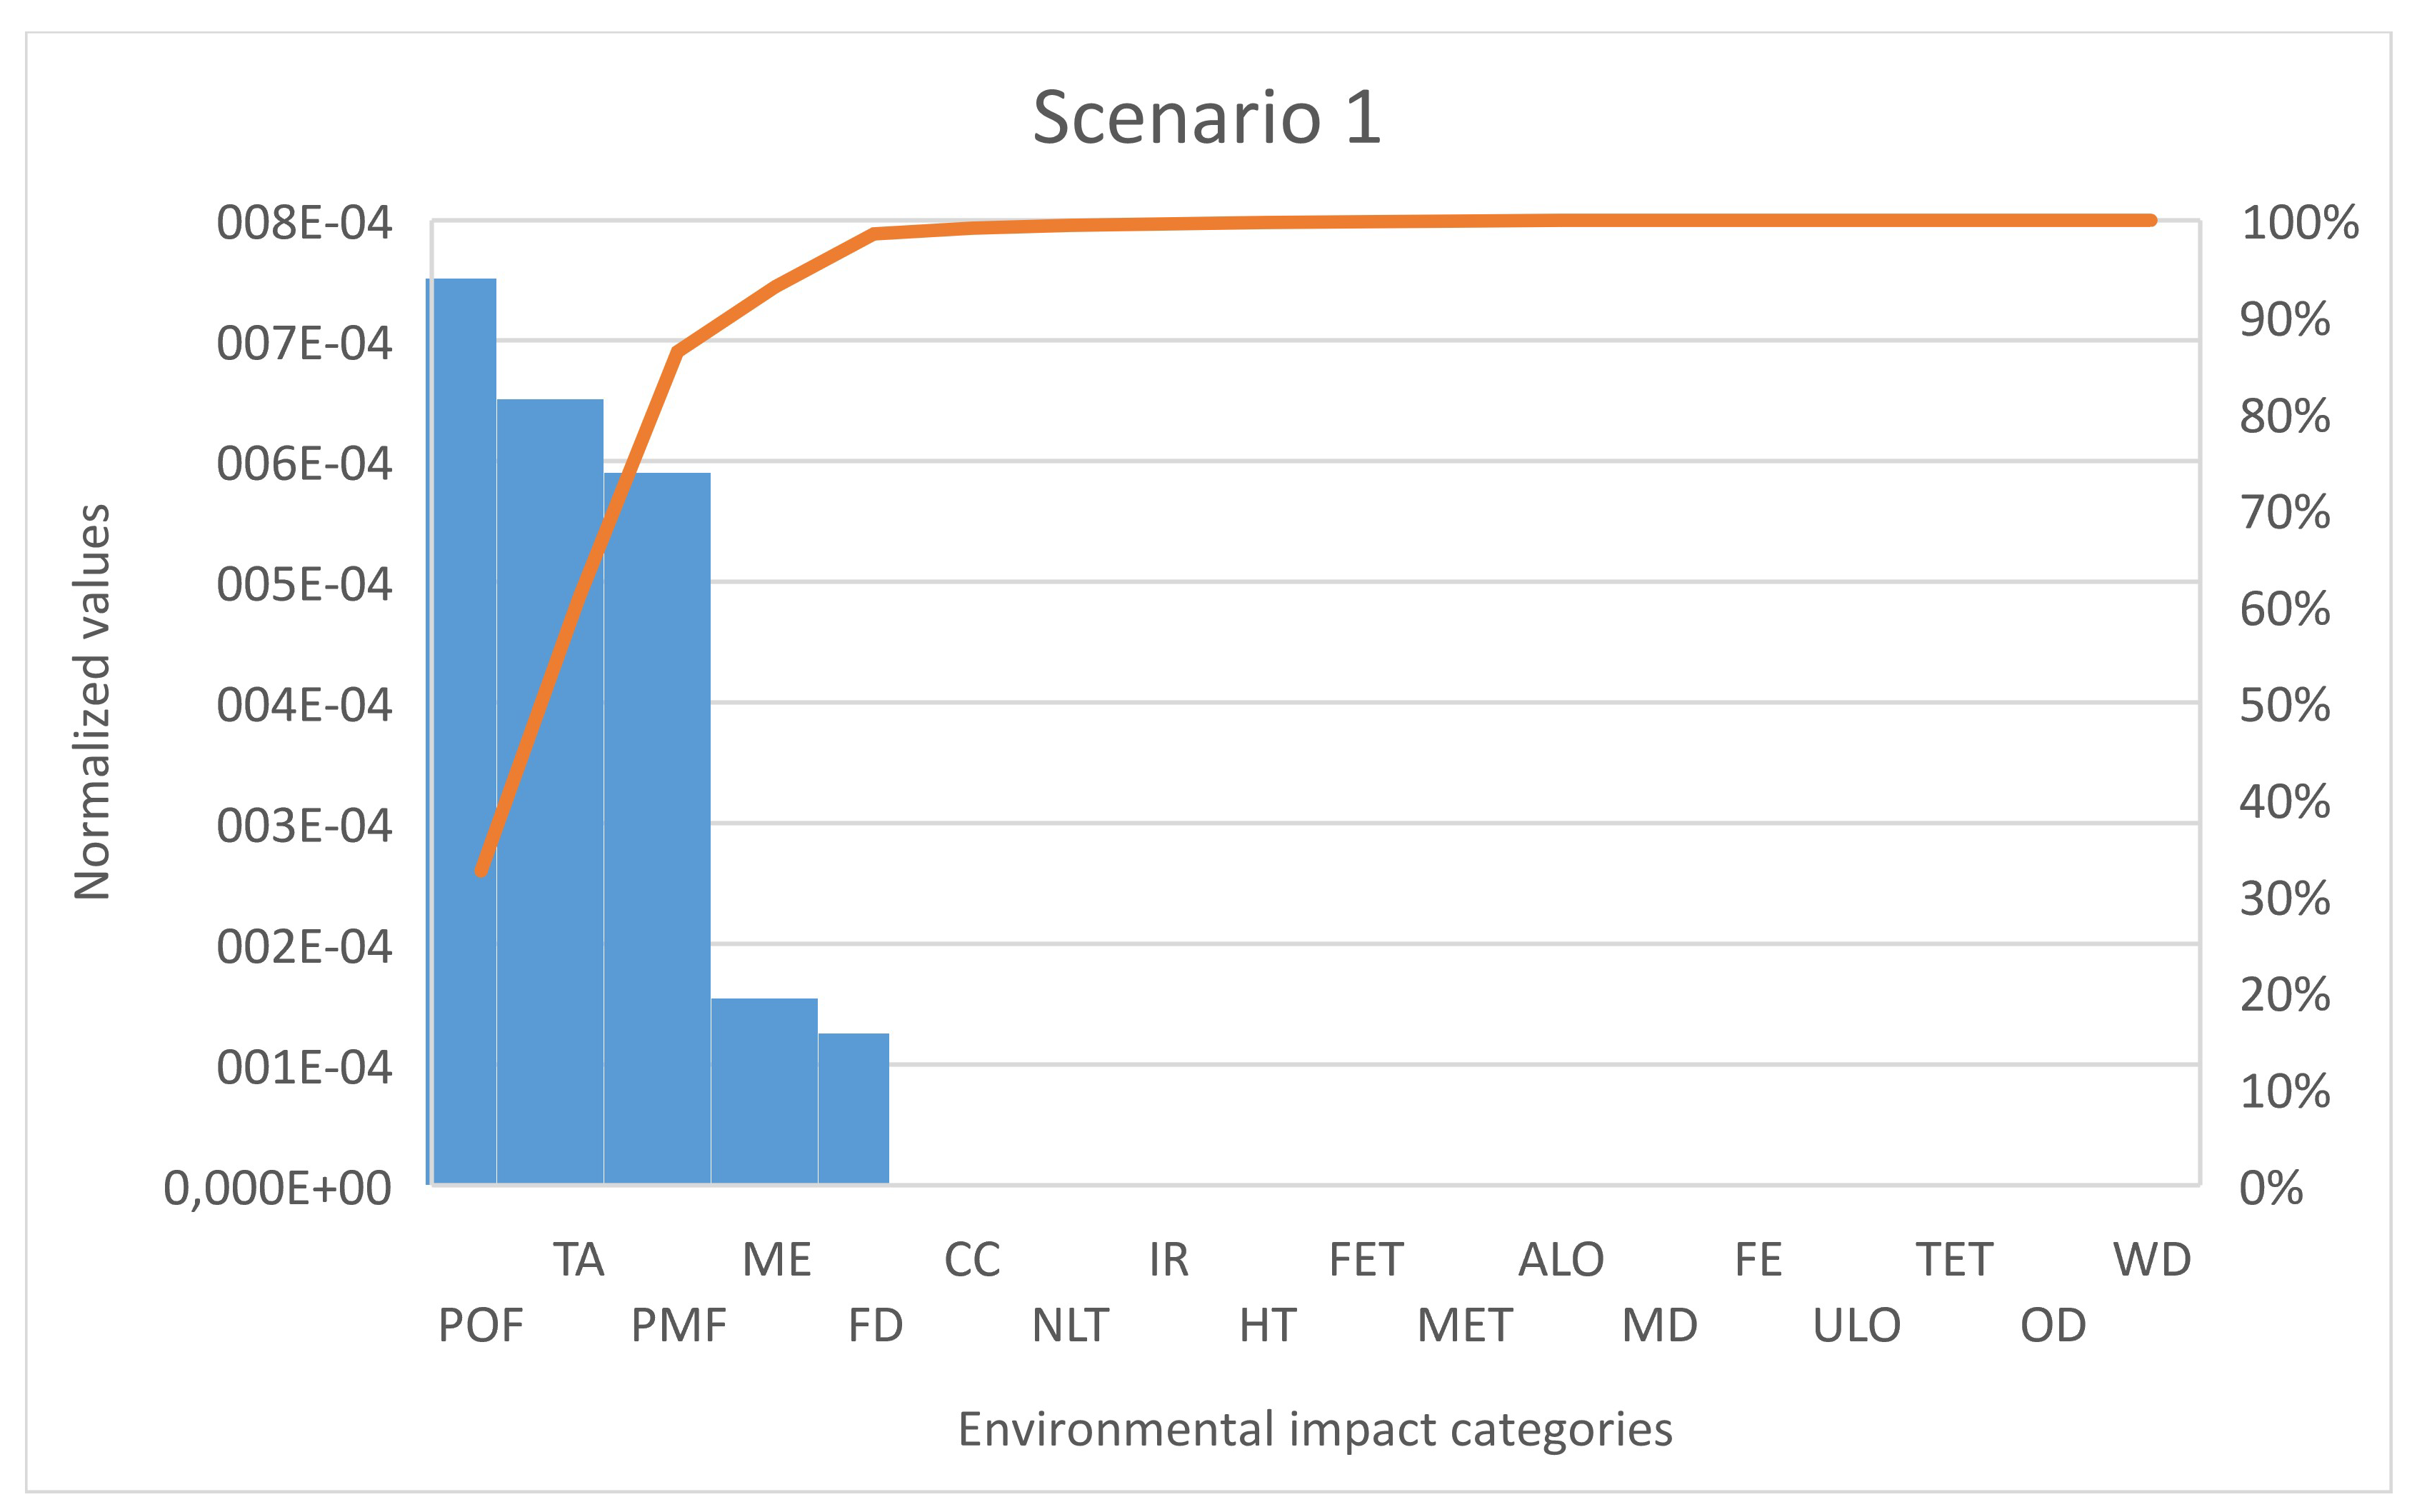
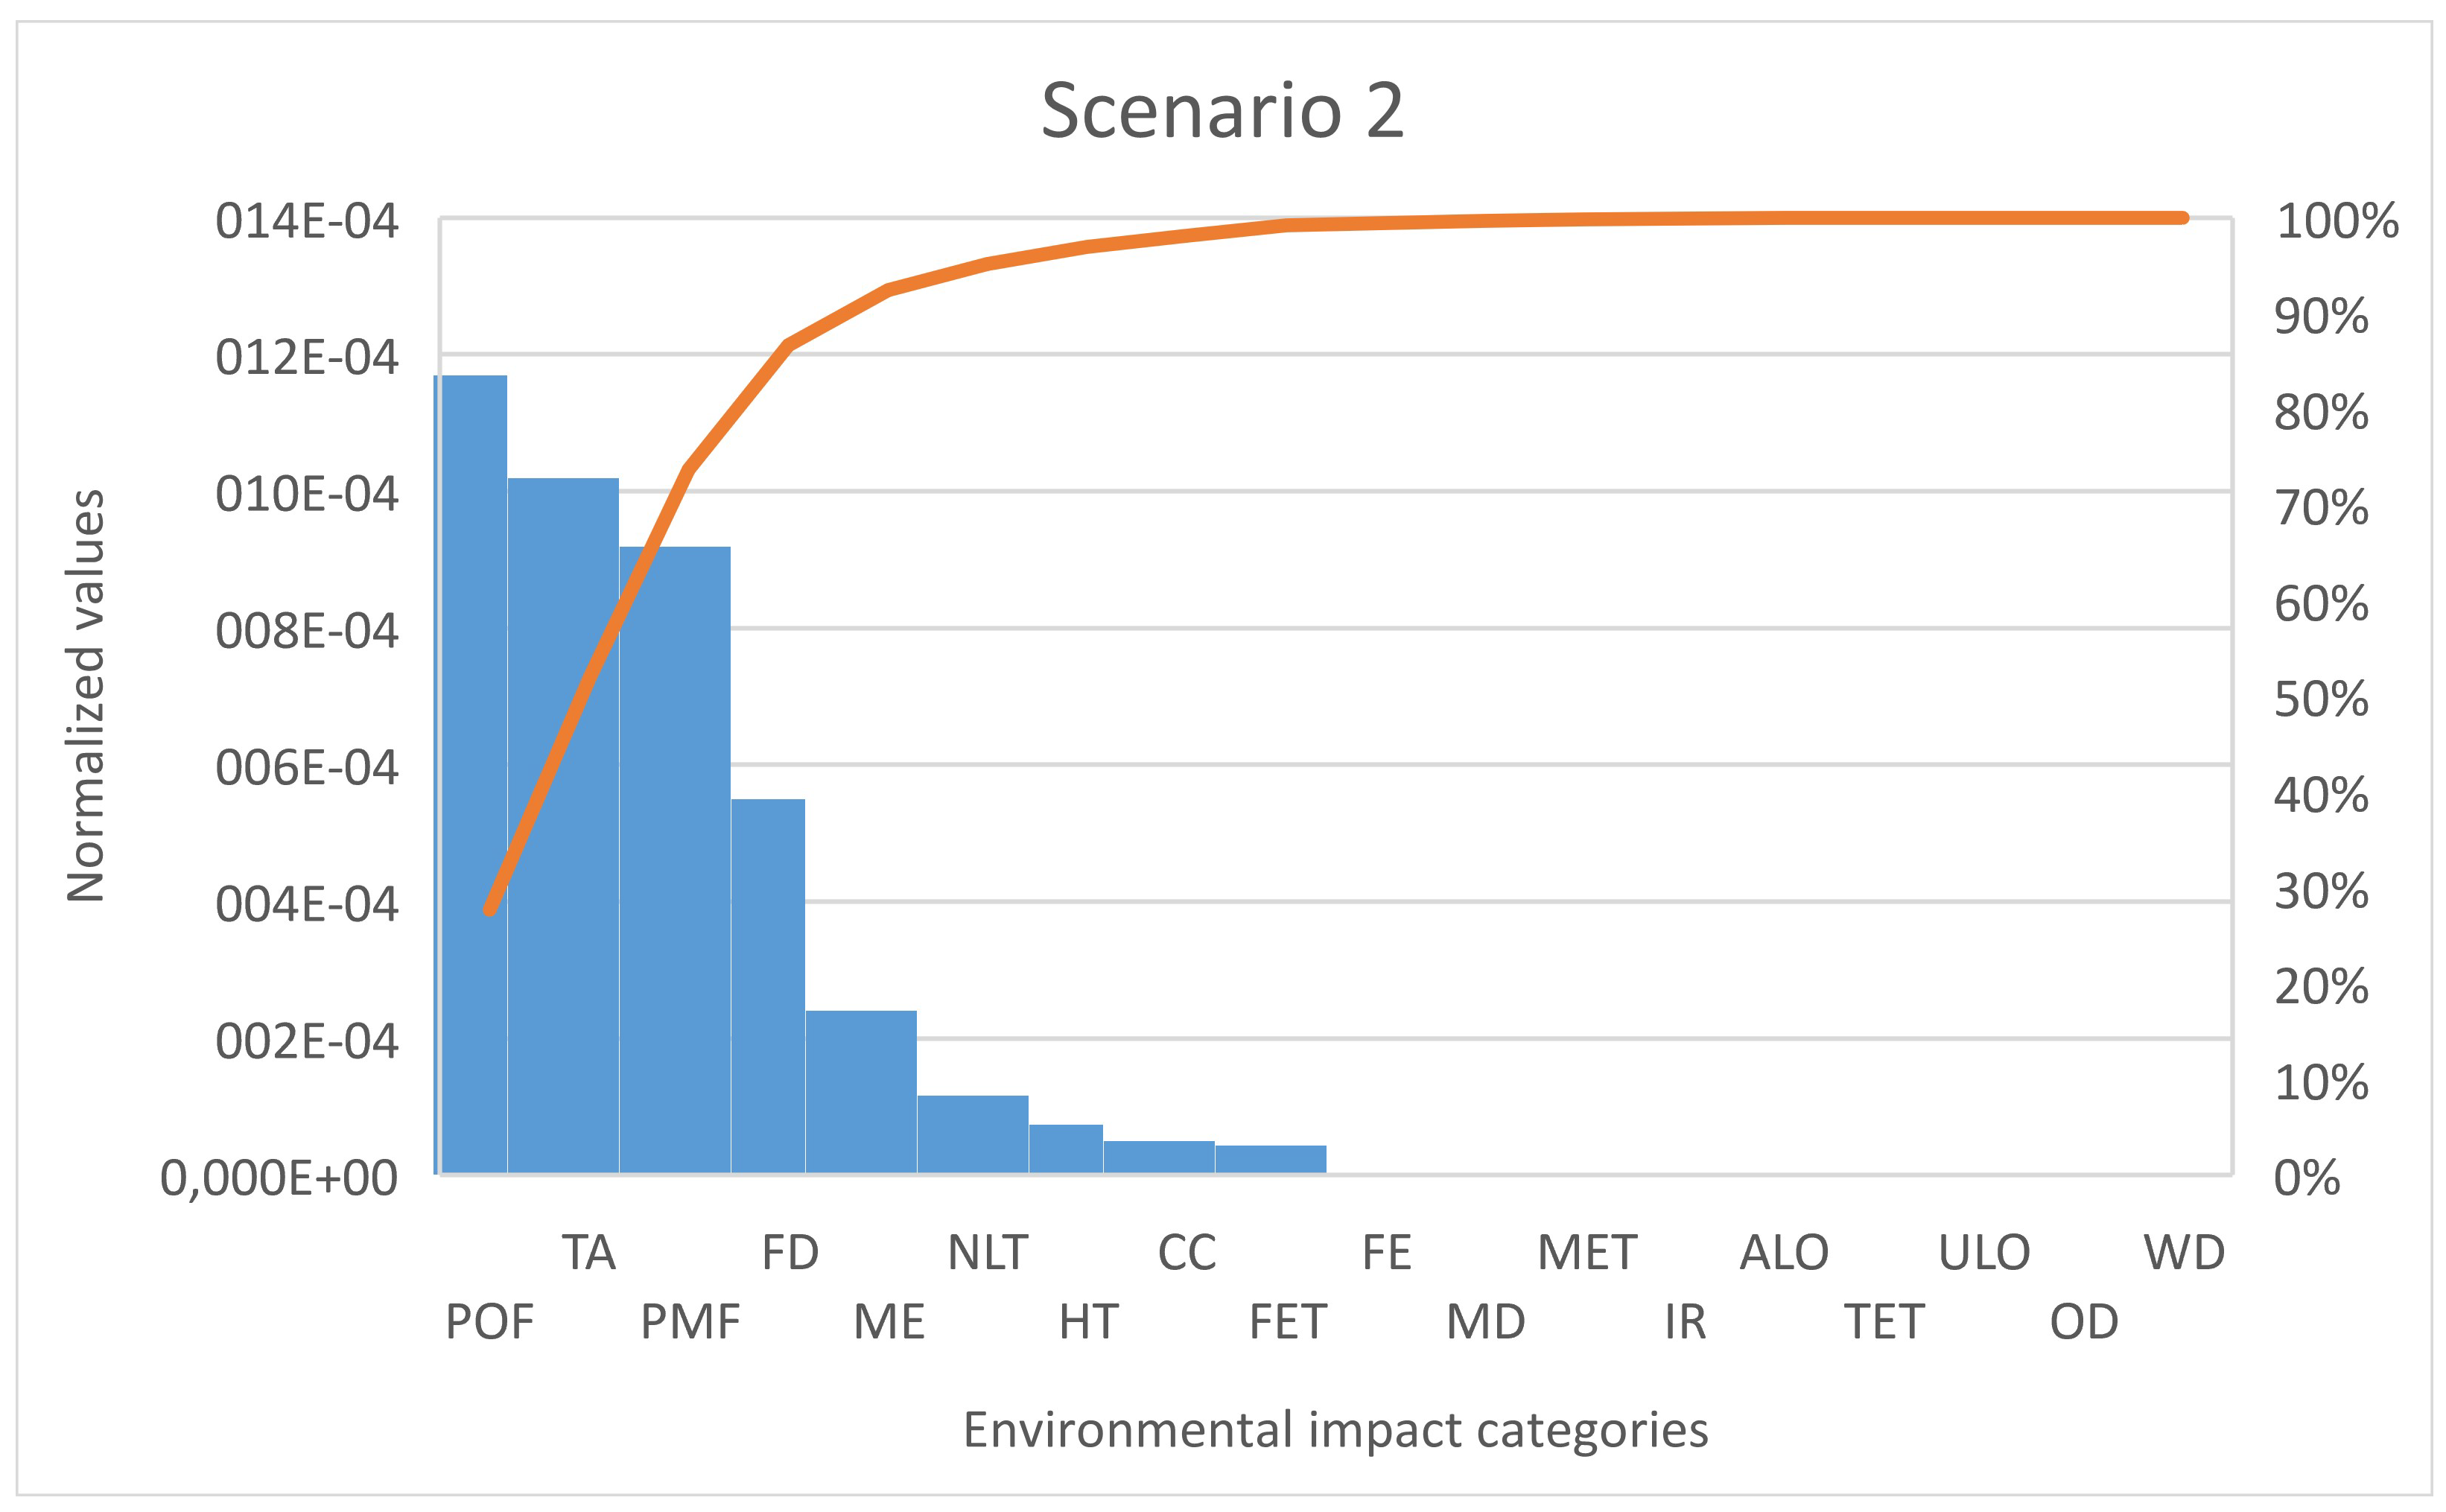
However, it is important to analyze the contribution of the individual impact categories in the total environmental impact. To analyze the highest significance of the impact categories of each scenario, the pareto analysis was chosen as a decision-making tool (Figure 3 and Figure 4). Both figures are confirming the relative contribution results that impacts category of POF, TA and PMF have the highest contribution to the sum of all normalized values. Nevertheless, in comparison to scenario 2, scenario 1 has in the category of ME a slightly higher contribution of 1%, and in the category of FD, it has a lower contribution of 7.57%. Another difference is seen in the category of NLT, where scenario 2 exceeds scenario 1 by 2.5%. As both scenarios have CO2 capture as primary function, the environmental impact category of climate change (CC) (which measures the contribution of CO2 and other compounds to the global warming) has a lower contribution to the total environmental impact. This was expected since both technologies capture the CO2.
The impact categories are influenced by the environmental impact of the different processes in the life cycle. Table 9 shows that the significant impact categories taken from the pareto analysis are influenced by specific processes in both scenarios. According to Table 9, the categories of POF, TA, PMF, and ME are influenced in 95% to 99.6% by the emissions of CO2 capture process (carbonate looping, adsorption) in both scenarios (Table 2 and Table 4). However, the characterization values, for instance in category POF, are very small (scenario 1—0.039 kg NMVOC eq./1 kWh; scenario 2—0.062 kg NMVOC eq./1 kWh).
In the category of FD, the production chain of the lignite from Slovak lignite mix (which has a similar thermal efficiency as Czech lignite of 11 MJ/kg [12]) results as the most significant process in both scenarios. In scenario 1, the lignite mix for the power unit contributes almost 86.40% to FD (Table 9). In scenario 2, the hard coal mix for active carbon production increases the FD contribution by 40.70%, whereas lignite mix for power unit contributes 19.10%. Moreover, in scenario 2, the category of FD is influenced 40% by the utilization of thermal energy from natural gas mix for activated carbon production.
An interesting result is shown for the category of NLT. In scenario 1, major land transformation would be impacted by the construction of an air separation unit for oxygen production. In scenario 2, the hard coal production chain with all the mining process necessary for active carbon production turns out to be the process with the highest impact to the natural land transformation. Moreover, in comparison with scenario 1, hard coal would need to be mined and transported to the power unit, which creates an additional environmental burden. In scenario 1, the air separation unit would need to be built right in the local area of the power unit.
The category of CC is mainly influenced by the ratio of captured CO2. It is obvious that adsorption process would require higher amount of active carbon to be able to capture 95% of CO2 such as an IGCC-CaL system. That would lead to the increase of the total environmental impact. Also, the thermal energy from the natural gas combustion as a primary energy for activated carbon production, is influencing category of CC in 72%.
The primary goal for the CCT solution under Czech energy conditions was to design and compare post combustion and pre combustion systems for the same REU. However, during the research, problems occurred with the technological requirements (such as quality of the lignite for each REU) of each system. Thus, the input parameters had to be optimized, which led to different scale of REU, different lignite quality and different technological segments. Therefore, the specific case studies considered in this manuscript do not have the same basis for fair comparison. Still, in LCA analysis relating all the environmental impacts to 1 kWhe, the aforementioned differences are still present in particular environmental impacts.
This paper considers the specific case of activated carbon production from hard coal. However, activated carbon can be produced in several options from biomass or other organic waste that would decrease total environmental performance of the process. Also, different adsorption process configurations may lead to different results. This specific case of the PCC-A points out the problem with Na salts production after flue gas purification, which are currently considered as waste material with no other use.
The main advantage of PCC-A against IGCC-CaL is the thermal efficiency of the whole system. For the process of the CO2 capture and compression, PCC-A requires a consumption of 28 MWe from the power unit, whereas IGCC-CaL requires for the same process 119.31 MWe (Table 5). Thus, PCC-A decreases the thermal efficiency of the power unit by 4.67%, and IGCC-CaL decreases the thermal efficiency of the power unit by 12.5%. The thermal efficiency decrease would require a higher energy production that might also influence the environmental performance of IGCC-CaL system as well. Moreover, the thermal efficiency decline may be significant for the further operational costs increase. On the other hand, the specific energy consumption (MWe/t CO2) in Table 5 states that PCC-A (1.3 MWe/t CO2) would require a slightly higher energy demand than the IGCC-CaL process (0.9 MWe/t CO2).
The following table (Table 11) shows the comparison of this study with other studies of [8,9,10]. The environmental results of this study for pre-combustion IGCC-CaL system shows a lower kg CO2 eqv./MWh than in a similar study of Petrescu et al. [8]. The lower impact of climate change of this study (global warming potential) corresponds to the smaller size of the reference energy power plant and higher capture ratio. For eutrophication potential this study is resulting in much lower values that are comparable with the study of Clarens et al. [10]. However, the impacts of the acidification potential in this study are the highest among of all studies. This might be influenced by the production of the used sorbent in the form of CaCO3 + CaSO4 as non-utilized waste product of high-temperature desulphurization. Moreover, the study shows the highest drop in net energy efficiency due to CCT implementation. The reason might be that the IGCC-CaL design of this study does not consider utilizing the heat losses due to lack of commercially viable heat exchangers for such amount of heat. In the case of post-combustion capture, PCC-A has the lowest CO2 capture rate among all the studies. It corresponds to higher values in climate change in comparison with similar study of Clarens et al. [10]. Also, in this study of PCC-A, specific emissions are the highest, which refers to the low CO2 capture rate.

5.2. Economical Assessment

The key economic parameter for CCT integration is capture cost. The comparison of capture costs (Table 10) among assessed CCT systems states that the less expensive technology is PCC-A system. The difference is shown in the values of CAPEX, which for IGCC-CaL is higher by €167 million and in OPEX by €17 million annually. The main reason for this difference is that PCC-A does not require high technological adjustments when compared to the IGCC-CaL systems. The IGCC-CaL system requires an initial batch of lignite with higher quality for gasification process, therefore the technological components (such as boiler) would increase the initial CAPEX. Moreover, IGCC-CaL requires the construction of an additional segment with auxiliary systems of air separation unit that also increases the initial investment.
Another parameter—cost of electricity (COE)—is influenced by OPEX. The higher OPEX of the IGCC-CaL system increases the energy cost by €33/MWh in comparison with the PCC-A (Table 7). However, both case CCT studies are showing a higher COE per MWh in comparison with the actual market price of electricity (Table 6). That leads to the conclusion that both systems tailored for the current Czech conditions are currently not economically viable.
The economical assessment of this study is based on the comparison of the cost effectiveness of both CO2 capture systems with the reference energy units. The results are shown in Figure 3. The graph describes the rising trend of the price of CO2 allowance throughout the years 2015–2050. The analyzed CCTs have the potential to achieve cost-effectivity in comparison to the power plant without CCT in the observed time frame. The PCC-A would be cost-competitive in the case the carbon price would be lower than €22.5/tCO2 (for CCU case), or €26.3/tCO2 (for CCS case). The IGCC-CaL would be cost-effective in the condition that the carbon price increases up to €58.7/tCO2 (for CCU case) and €60.9/tCO2 (for CCS case). PCC-A could achieve cost-effectiveness with carbon price at €24.1/tCO2 or €20/tCO2 under the condition of total CAPEX reduction by 5% and 15%, respectively.
It is important to note that the capital investments are decreasing over time for CCT, and therefore, total CCT costs will gradually decrease (dashed green and red lines in Figure 5). These economic dynamics might be the subject of further comprehensive economic study on CCT.
It is assumed that the price of the CO2 allowance will continue to rise (dashed black line in Figure 3) in the current state of climate crisis and economy crisis. Therefore, the economic decision to invest into the CCT may be major but only in the first years (3–4 years of the CCT construction) but it will lead to cost savings after the payback period (six years according to Reference [4]), as opposed to dealing with the inflating price of CO2 allowance.

5.3. Environmental and Economic Combination Score

The decision-making process of the CCT integration into power units must be based on a complex assessment, where the environmental and economic scores combine. This combination can be done by simple multiplying the environmental score (sum of all normalized values) and values of OPEX or CAPEX. PCC-A in comparison with IGCC-CaL, has a worse environmental score (0.004) and lower OPEX (€123.06 million) and CAPEX values (€1.097 billion). The IGCC-CaL system has lower values for environmental score (0.0023) but higher values for OPEX (€140.3 million) and CAPEX (€1.2641 billion).
This decision conflict between environmental and economic performance can be resolved by the total product (multiplying the environmental score and CAPEX (or OPEX) value (Figure 4). If the total value is low, it leads to the conclusion that the combination of environmental and economic performance is more favorable for the chosen technology.
The product of environmental score by CAPEX and OPEX can be seen in Figure 6. The graph shows that the IGCC-CaL unit has a smaller total score for both CAPEX and OPEX combination with the environmental score. It concludes that even if the CAPEX and OPEX of IGCC are higher than in the PCC-A process, the environmental performance seems to lower the total combination score.

6. Conclusions

The study presents one of the possible options to select the suitable form of carbon capture technology (CCT) that would meet the sustainability indicators (technical, environmental, and economic) in the Czech energy industry. The presented paper combines environmental and economic variables to conclude the viable choice of carbon capture integration into the brown coal power units. The comparison of both systems concludes into the following points:
  • The specific case of IGCC with CaO looping integration has an overall better environmental performance with higher CO2 ratio capture of 95%; IGCC-CaL decreases the power unit thermal efficiency by 12.5%; IGCC-CaL has a higher capture cost and would become competitive if the carbon price increases up to €58.7/tCO2 (for CCU case) and €60.9/tCO2 (for CCS case).
  • The specific PCC-A case has an overall worse environmental performance with 75% of CO2 capture; PCC-A decreases the power unit thermal efficiency by 4.67%; Adsorption has lower capture costs and would become competitive if the carbon price is lower than €22.5/tCO2 (for CCU case) or €26.3/tCO2 (for CCS case).
  • The cost of electricity of both assessed carbon capture systems is exceeding the current market price.
  • The product of the environmental score by CAPEX, and the product of the environmental score by OPEX is lower for IGCC system with CaO looping.
Although it seems that IGCC-CaL integration would be the most suitable option for the carbon capture, thermal efficiency decrease can cause the additional increase in CAPEX and OPEX, which can also result in some environmental burden. On the other hand, the adsorption process can be optimized to enhance the environmental performance with relatively low investments.
It must be stressed that the decision-making process of CCT integration is affected by many other factors such as political decisions, social acceptance, or the economic statements of the energy industry and companies of the Czech Republic. This study presents how an environmental tool such as LCA and economical computation of cost effectiveness may help to contribute to the extensive feasibility study and complex decision-making process.
Further research of CCT technologies integrated into the Czech energy conditions could enhance this research and consider robust techno-economic and environmental analysis of all three considered technologies: post-combustion ammonia scrubbing, post-combustion capture by activated carbon adsorption, and pre-combustion IGCC-CaL.

Author Contributions

Conceptualization, K.Z. and A.C.; methodology, K.Z., A.C., J.Š., M.V., and V.K.; formal analysis, K.Z.; resources, K.Z. and M.V.; data curation, K.Z., J.Š., L.P., and M.V.; writing—original draft preparation, K.Z. and M.V.; writing—review and editing, K.Z., A.C., J.Š., M.V., and L.P.; supervision, V.K. and A.C. All authors have read and agreed to the published version of the manuscript.

Funding

This research received no external funding.

Acknowledgments

This work was supported by the Technology Agency of the Czech Republic, project number TH03020169 and project number TA02020205, and by institutional support from the University of Chemistry and Technology Prague.

Conflicts of Interest

The authors declare no conflict of interest.

Abbreviations

ALOAgricultural land occupation
AvCoAvoided cost
CAPEXCapital expenditures
CCClimate change
CCoCapture cost
CCSCarbon capture and storage
CCTCarbon capture technology
COECost of electricity
EPEutrophication potential
FDFossils depletion
FEFreshwater eutrophication
FETFresh water ecotoxicity
FUFunctional unit
GWPGlobal warming potential
HTHuman toxicity
IGCC-CaLIntegrated gasification combined cycle with calcium looping
IGCC-FeLIron-based oxygen carriers
IRIonizing radiation
LCALife cycle assessment
MDMetal depletion
MEMarine eutrophication
METMarine ecotoxicity
NLTNatural land transformation
ODOzone depletion
OPEXOperational expenditures
PCC-APost combustion capture by adsorption
PMFParticulate matter formation
POFPhotochemical oxidant formation
REUReference energy unit
Sc.Scenario
TATerrestrial acidification
TETTerrestrial ecotoxicity
ULOUrban land occupation
WDWater depletion
WTAWaste heat utilization

References

  1. European Association for Coal and Lignite, 2020: The Voice of Coal in Europe—Czech Republic. Available online: https://euracoal.eu/info/country-profiles/czech-republic/ (accessed on 10 June 2020).
  2. Carvalho, A.; Mimoso, A.F.; Mendes, A.N.; Matos, H.A. From a literature review to a framework for environmental process impact assessment index. J. Clean. Prod. 2014, 64, 36–62. [Google Scholar] [CrossRef]
  3. Štefanica, J.; Smutná, J.; Kočí, V.; Macháč, P.; Pilař, L. Environmental gains and impacts of a CCS technology—Case study of post-combustion CO2 separation by ammonia absorption. Energy Procedia 2016, 86, 215–218. [Google Scholar] [CrossRef] [Green Version]
  4. Zakuciová, K.; Štefanica, J.; Carvalho, A.; Kočí, V. Environmental Assessment of a Coal Power Plant with Carbon Dioxide Capture System Based on the Activated Carbon Adsorption Process: A Case Study of the Czech Republic. Energies 2020, 13, 2251. [Google Scholar] [CrossRef]
  5. Singh, B.; Strømman, A.H.; Hertwich, E.G. Comparative life cycle environmental assessment of CCS technologies. Int. J. Greenh. Gas Control 2011, 5, 911–921. [Google Scholar] [CrossRef]
  6. Cormos, C.C. Integrated assessment of IGCC power generation technology with carbon capture and storage (CCS). Energy 2012, 42, 434–445. [Google Scholar] [CrossRef]
  7. Falcke, T.J.; Hoadley, A.F.A.; Brennan, D.J.; Sinclair, S.E. The sustainability of clean coal technology: IGCC with/without CCS. Process Saf. Environ. Prot. 2011, 89, 41–52. [Google Scholar] [CrossRef]
  8. Petrescu, L.; Cormos, C.C. Environmental assessment of IGCC power plants with pre-combustion CO2 capture by chemical & calcium looping methods. J. Clean. Prod. 2017, 158, 233–244. [Google Scholar]
  9. Rolfe, A.; Huang, Y.; Haaf, M.; Rezvani, S.; Dave, A.; Hewitt, N.J. Techno-economic and Environmental Analysis of Calcium Carbonate Looping for CO2 Capture from a Pulverised Coal-Fired Power Plant. Energy Procedia 2017, 142, 3447–3453. [Google Scholar] [CrossRef]
  10. Clarens, F.; Espí, J.J.; Giraldi, M.R.; Rovira, M.; Vega, L.F. Life cycle assessment of CaO looping versus amine-based absorption for capturing CO2 in a subcritical coal power plant. Int. J. Greenh. Gas Control 2016, 46, 18–27. [Google Scholar] [CrossRef]
  11. International Organization for Standardization (ISO). International Standard ISO 14044 Environmental Management—Life Cycle Assessment—Requirements and Guidelines; ISO: Geneva, Switzerland, 2006. [Google Scholar]
  12. Pilař, L.; Vlček, Z. Projektový Návrh Technického Řešení Nízkoemisního Energetického Systému; ÚJV Řež, a. s.: Husinec, Czech Republic, 2018. [Google Scholar]
  13. Vávrová, J.; Štefanica, J.; Hájek, P.; Smejkalová, J. Technical Report of Project TA02020205; ÚJV Řež, a. s.: Husinec, Czech Republic, 2013. [Google Scholar]
  14. Michael, Z.; Hauschild, R.K.; Rosenbaum, S.I.O. Life Cycle Assessment, Theory and Practice; Springer International Publishing AG: Montpellier, France, 2018. [Google Scholar]
  15. Tobergte, D.R.; Curtis, S. ILCD Handbook. J. Chem. Inf. Model. 2013, 53, 1689–1699. [Google Scholar]
  16. Goedkoop, M.; Heijungs, R.; Huijbregts, M.; De Schryver, A.; Struijs, J.; Zelm, R. Van ReCiPe 2008. Potentials 2009, 1, 1–126. [Google Scholar]
  17. Mimoso, A.F.; Carvalho, A.; Mendes, A.N.; Matos, H.A. Roadmap for Environmental Impact Retrofit in chemical processes through the application of Life Cycle Assessment methods. J. Clean. Prod. 2015, 90, 128–141. [Google Scholar] [CrossRef]
  18. Vivarová, M.; Smutná, J. Ekonomické Aspekty Nasazení Systému Záchytu CO2 na Bázi Karbonátové smy č ky v Elektrárně IGCC s Inovativním Vysokoteplotním čištěním Syntézního Plynu Výzkumná Zpráva; ÚJV Řež, a. s.: Husinec, Czech Republic, 2017. [Google Scholar]
  19. Vitvarová, M.; Dlouhý, T.; Havlík, J. TECHNICKO- Ekonomické Posouzení Nasazení Systému Záchytu CO2 v Elektrárně Výzkumná Zpráva; ÚJV Řež, a. s.: Husinec, Czech Republic, 2015. [Google Scholar]
  20. Wall, T.; Liu, Y.; Spero, C.; Elliott, L.; Khare, S.; Rathnam, R.; Zeenathal, F.; Moghtaderi, B.; Buhre, B.; Sheng, C.; et al. An overview on oxyfuel coal combustion-State of the art research and technology development. Chem. Eng. Res. Des. 2009, 87, 1003–1016. [Google Scholar] [CrossRef]
  21. Bradáčová, K.; Macha, P. Ústav Plynárenství, Koksochemie a Ochrany Ovzduší, VŠCHT Praha, Vysokoteplotní Čištění Energetického Plynu–Semestra Project Souhrn; University of Chemistry and Technology: Praha, Czech Republic, 2007. [Google Scholar]
  22. Abad, A.; de las Obras-Loscertales, M.; García-Labiano, F.; de Diego, L.F.; Gayán, P.; Adánez, J. In situ gasification Chemical-Looping Combustion of coal using limestone as oxygen carrier precursor and sulphur sorbent. Chem. Eng. J. 2017, 310, 226–239. [Google Scholar] [CrossRef]
  23. Schjolset, S. The MSR: Impact on Market Balance and Prices Price Forecast: Key Assumptions. 2014. Available online: https://ec.europa.eu/clima/sites/clima/files/docs/0094/thomson_reuters_point_carbon_en.pdf (accessed on 12 June 2020).
  24. Stock Market Markets Insider, 2020-CO2 European Emission Allowances. Available online: https://markets.businessinsider.com/commodities/co2-european-emission-allowances (accessed on 12 June 2020).
  25. Rabiega, W.; Sikora, P.; Gąska, J. CO2 Emissions Reduction Potential in Transport Sector in Poland and the Eu Until 2050; The National Centre for Emissions Management (KOBiZE): Warsaw, Poland, 2019. [Google Scholar]
  26. European Environment Agency. Trends and Projections in the EU ETS in 2018; Publications Office of the European Union: Luxembourg, 2018. [Google Scholar]
  27. Vesely, L.; Skaugen, G.; Vitvarova, M.; Roussanaly, S.; Novotny, V. Case study of transport options for CO2 from IGCC coal power plant in the Czech Republic for storage. In Proceedings of the 4th Intenrational conference of chemistry and technology, Mikulov, Czech Republic, 25–26 April 2016; pp. 315–320. [Google Scholar]
  28. Roussanaly, S.; Skaugen, G.; Aasen, A.; Jakobsen, J.; Vesely, L. Techno-economic evaluation of CO2 transport from a lignite-fired IGCC plant in the Czech Republic. Int. J. Greenh. Gas Control 2017, 65, 235–250. [Google Scholar] [CrossRef]
Figure 1. System boundaries for Scenario 1 (marked red are energies returning back to the system; dashed lines with numbers represent technological segments).
Energies 13 04188 g001
Figure 2. System boundaries for Scenario 2 (red marked is the energy returning back to the system; dashed lines with numbers represent technological segments).
Energies 13 04188 g002
Figure 3. Pareto analysis for scenario 1 (only visible values).
Energies 13 04188 g003
Figure 4. Pareto analysis for scenario 2 (only visible values).
Energies 13 04188 g004
Figure 5. The cost-effectiveness of selected CCT integration into power plants.
Energies 13 04188 g005
Figure 6. Product of environmental score by CAPEX and OPEX for pre-combustion CO2 capture integrated into the gasification combined cycle (IGCC-CaL) and post-combustion capture by adsorption of CO2 by activated carbon (PCC-A).
Energies 13 04188 g006
Table 1. Review of references focused on environmental assessment of pre-combustion integrated gasification gas cycle technology with CO2 capture (IGCC-CCT), global warming potential (GWP), acidification potential (AP), fossils depletion (FD), eutrophication potential (EP), terrestrial acidification (TA), and freshwater eutrophication (FE).
StudiesType/Size/Net Energy Efficiency of Reference Power PlantType/Size of IGCCType/Size of IGCC-CCTIGCC Efficiency (without CCT)IGCC Efficiency with CCTCO2 Capture RateCO2 Specific Emissions for CCTEnvironmental Assessment MethodologyMain Environmental Results of IGCC + CCTCO2 Product Specification
Falcke et al. (2011)Supercritical boiler with limestone desulphurization—455 Mwe/37%Oxygen blown IGCC/394 MWeEntrained-flow gasification, sour water gas shift reactors, use of Selexol—321 MWe32.1%26.1%81%N/AMass-energy flowsEnvironmental results expressed graphicallyCo-sequestration CO2 with H2S removal; CO2 compression to 100 bar, CO2 dried by triethylen glycol
Singh et al. (2011)Supercritical coal power plant/400 MWe/43.4%IGCC power unit +gasification, gas cleaning unit + gas-fired combined cycle/400 MWePre-combustion capture use of Selexol/400 MWe44.1%37.60%90%85.7 g/kWhHybrid LCA input-output model and ReCiPe 2008 v1.02GWP (1.8 × 10⁻¹ kg CO2eqv/kWh); TA (1.1 × 10⁻³ kg SO2 eqv./kWh) FE (2.3 × 10⁻⁶/kWh)CO2 compressed to 110 bar and transported over 500 km
Cormos (2012)Coal based IGCCIGCC based on Shell gasifier/485 MWePre- combustion capture based on Selexol/433.18 MWe46.61%37.11%90%86.92 kg/MWhNormalized mass energy balance methodEnvironmental results expressed as mass or energy/MWh; Introduction of CCT increase all normalized flowsCO2 drying by triethylen glycol; CO2 compression to 110 bar
IGCC based on Siemens gasifier/448.97 MWePre-combustion capture based on Selexol/420.41 MWe43.13%36.02%90%76.12 kg/MWh
Petrescu et al. (2017)IGCC power plant/493.13 MWeIGCC power plant with acid gas removal based on SelexolPre-combustion IGCC-CaO looping/607.82 MWe45.09%36.44%91.56%58.87 kg/MWhLCA method based on CML 2001, GaBi software v. 6GWP (917.25 kg CO2 eqv/MWh), AP (1.47 kg SO2 eqv/MWh), EP (1461.97 kg PO43− eqv/MWh)Co-sequestration with hydrogen-rich gas; CO2 dried and compressed up to 120 bar, transported 800 km
Pre-combustion IGCC-FeL based oxygen carriers chemical looping/443.07 MWe38.76%99.45%3.01 kg/MWhGWP (338.73 kg CO2 eqv/MWh), AP (1.75 kg SO2 eqv/MWh), EP (1949.12 kg PO43− kg eqv/MWh)
Table 2. Basic inventory data for scenario 1.
ProcessesInputsAmountUnitsOutputsAmountUnits
Fuel treatment and gasificationBrown coal (dried)175.3t/hAsh39.19t/h
O2102.88t/hSyngas425.73t/h
Water150.4t/h
Gas purificationCaO7.65t/hCaCO3 + CaSO4 (waste)11.75t/h
Oxgen productionAir864,767m3/hO2181,169m3/h
Electricity90.2kWN2675,556m3/h
Carbonate loopingO295.52t/hCO2 captured290.97t/h
CaCO3 total batch130tCO with flue gases into air13.16t/h
Syngas234.07t/h
CaCO3 fresh sorbent input25t/h
Steam-gas cycleSyngas (energy efficiency)12.8MJ/kgNominal power output (without CCT)381.71MWe
Table 3. Syngas composition after gasification and carbon dioxide removal.
Syngas after Gasification Processt/hSyngas after Shift Reaction and CO2 Removalt/h
CO202.58CO2.25
CO234.65CO29.61
H29.94H213.43
N218.84N210.44
H2O150.4Ar2.86
Others9.32Sum38.59
Table 4. Basic inventory data for scenario 2.
ProcessesInputsAmountUnitsOutputsAmountUnits
Power unitBrown coal (dried)214t/hNominal power output (without CCT)226MWe
Water9258.63t/hCondensate and wastewater145t/h
Gas purificationNaOH7.65t/hReactive products0.526t/h
Activated carbon productionHard coal190tTar76t
Energy for activation1132MJ
CO2 adsorptionActivated coal total batch760tFlue gases685,955m3/h
Flue gases766,045m3/hCO2 captured158t/h
CO2211t/h
Table 5. Differences in significant technological parameters of both scenarios.
Scenario 1Scenario 2
Power consumption for CO2 capture and compression119.31 MWe28 MWe
CO2 capture ratio95%75%
Thermal efficiencyWithout CO2 capture
37.80%38.40%
With CO2 capture system
25.30%33.73%
Specific power consumption (MWe/t CO2 captured)0.91.3
Nominal power output262.4 MWe198 MWe
Table 6. Operational expenditures (OPEX) variables for reference energy units (REUs) of both case studies [18,19].
CostsREU (IGCC-381.71 MWe)REU (Sub-Critical Coal Power Unit-226 MWe)
Fuel cost (€/t)35.7623.07
Cost of solvent/adsorbent (€/kg)0.340.76
Market price of electricity (€MWh)4545
Fixed operational costs (€/year)2,692,3081,507,692
Table 7. Capital expenditures (CAPEX) and OPEX for REUs without and with carbon capture technology (CCT) systems [18,19].
Technological SegmentsREU (IGCC)REU (Sub-Critical Coal Power Unit)REU + CCT (IGCC-CaL)REU + CCT (PCC-A)
381.71 MWe226 MWe262.4 MWe198 MWe
CAPEX (million Euros)1025.9716.91264.11097
OPEX (million Euros)114.1121140.3123.05
Table 8. Results for both scenarios (EIC—environmental impact categories, CHV—characterization values, NV—normalization values, RC—relative contribution); ozone depletion (OD), human toxicity (HT), ionizing radiation (IR), photochemical oxidant formation (POF), particulate matter formation (PMF), terrestrial acidification (TA), climate change (CC), terrestrial ecotoxicity (TET), agricultural land occupation (ALO), urban land occupation (ULO), natural land transformation (NLT), marine ecotoxicity (MET), marine eutrophication (ME), fresh water eutrophication (FE), fresh water ecotoxicity (FET), fossil depletion (FD), metal depletion (MD), water depletion (WD).
Scenario 1Scenario 2
EICCHVNVRC in %CHVNVRC in %
ALO1.54 × 10−3 (m2a)1.18 × 10−60.059.70 × 10−3 (m2a)2.15 × 10−60.05
CC1.54 × 10−1 (kg CO2 eq.)1.38 × 10−50.65.72 × 10−1 (kg CO2 eq.)5.10 × 10−51.21
FD1.96 × 10−1 (kg oil eq.)1.26 × 10−45.468.58 × 10−1 (kg oil eq.)5.50 × 10−413.03
FET2.62 × 10−5 (kg 1.4 DB eq.)2.40 × 10−60.14.74 × 10−4 (kg 1.4 DB eq.)4.35 × 10−51.03
FE2.17 × 10−7 (kg P eq.)5.24 × 10−70.024.19 × 10−6 (kg P eq.)1.01 × 10−50.24
HT2.01 × 10−3 (kg 1.4-DB eq.)3.40 × 10−60.154.38 × 10−2 (kg 1.4-DB eq.)7.40 × 10−51.75
IR2.33 × 10−2 (U235 eq.)3.72 × 10−60.161.62 × 10−2 (U235 eq.)2.59 × 10−60.06
MET1.07 × 10−5 (kg 1.4-DB eq.)1.26 × 10−60.058.02 × 10−5 (kg 1.4-DB eq.)9.44 × 10−60.22
ME1.56 × 10−3 (kg N eq.)1.55 × 10−46.712.43 × 10−3 (kg N eq.)2.41 × 10−45.71
MD4.48 × 10−4 (kg Fe eq.)6.28 × 10−70.037.07 × 10−3 (kg Fe eq.)9.91 × 10−60.23
NLT1.03 × 10−6 (m2)6.38 × 10−60.281.89 × 10−5 (m2)1.17 × 10−42.77
OD2.31 × 10−13 (kg CFC−11 eq.)1.05 × 10−1102.15 × 10−13 (kg CFC-11 eq.)9.76 × 10−120
PMF8.80 × 10−3 (kg PM10 eq.)5.91 × 10−425.591.37 × 10−2 (kg PM10 eq.)9.19 × 10−421.77
POF3.99 × 10−2 (kg NMVOC eq.)7.52 × 10−432.566.20 × 10−2 (kg NMVOC eq.)1.17 × 10−327.72
TA2.24 × 10−2 (kg SO2 eq.)6.52 × 10−428.233.49 × 10−2 (kg SO2 eq.)1.02 × 10−324.16
TET1.13 × 10−6 (kg 1.4-DB eq.)1.38 × 10−70.019.20 × 10−6 (kg 1.4-DB eq.)1.12 × 10−60.03
ULO1.05 × 10−4 (m2a)2.57 × 10−70.011.91 × 10−4 (m2a)4.68 × 10−70.01
WD2.40 × 10−1 (m3)0.0002.99 × 10−1 (m3)0.000
SUM-2.31 × 10−3100-4.22 × 10−3100
Table 9. Relative contribution of the processes to significant environmental categories.
Scenario 1Scenario 2
Lignite MixOxygen Production by Cryogenic SeparationLimestone Mining and TreatmentCarbonate LoopingLignite MixHard Coal Mix for Activated CarbonProcess Water for Cooling and PurificationAdsorptionThermal Energy from Natural Gas Mix
POF0.10%0.10%0.008%99.60%0.18%1%0.20%96%1.80%
TA0.10%0.47%0.01%99.40%0.14%2%0.36%95%2.10%
PMF0.10%0.36%0.05%99.40%0.13%2%0.30%95%2%
ME0.12%0.66%0.15%98%0.10%1.30%1.02%95%1.16%
FD86.70%9.40%1.66%-19.10%40.70%1.70%-40%
NLT4.50%80.90%10.30%-0.60%94%5.00%--
CC66.14%28.40%4.44%0.02%7.65%16.50%3.38%0.05%72%
Table 10. Results of cost of electricity (COE), CO2 capture cost, and avoided CO2 cost.
ParametersIGCC-CaLPCC-A
COE (€/MWh)123.190.24
CO2 capture cost (€/t CO2)57.137.48
Avoided cost (€/t CO2)10534.06
Table 11. Comparison of study results with several references; GWP/CC—global warming potential/climate change; TA/AP—terrestrial acidification/acidification potential; FE/EP—reshwater eutrophication/eutrophication potential.
StudiesReference Power Plant/Type/Net Energy Power OutputType of CCT/Net Energy Power OutputNet Energy Efficiency without CCT (in %)Net Energy Efficiency with CCT (in %)CO2 Capture Rate in %CO2 Specific Emissions for CCSLCA Method and SoftwareEnvironmental Impacts
Zakuciová et al. (2020)Coal based IGCC with Shell gasifier/381.7 MWePre-combustion IGCC-CaO looping/262.4 MWe37.825.39536.32 kg/MWhReCiPe method v 1.08, Gabi Sotware v. 6CC 154 kg CO2 eqv./MWh; TA 22.4 kg SO2 eqv./MWh; FE 0.0002 kg P eqv./MWh
Sub-critical brown coal power unit/226 MWePost combustion adsorption on activated carbon/198 MWe38.433.7375267 kg/MWhReCiPe method v 1.08, Gabi Sotware v. 6CC 572 kg CO2/MWh; TA 34.9 kg CO2/MWh; FE 0.0042 kg P eqv./MWh
Petrescu et al. (2017)IGCC power plant with acid gas removal based on Selexol/493.13 MWePre-combustion IGCC-CaO looping/607.82 MWe45.0936.4491.5658.87 kg/MWhLCA method based on CML 2001, GaBi software v. 6GWP 917.25 kg CO2 eqv./MWh, AP 1.47 kg SO2 eqv./MWh, EP 1461.97 kg PO43− eqv./MWh
Pre-combustion IGCC-FeL based oxygen carriers chemical looping/443.07 MWe45.0938.7699.453.01 kg/MWhGWP 338.73 kg CO2 eqv./MWh, AP 1.75 kg SO2 eqv./MWh, EP 1949.12 kg PO43− kg eqv./MWh
Rolfe et al. (2017)Supercritical pulverized coal power plant with flue gas desulphurization and selective catalytic reduction/588.6 MWePost combustion CaO looping/924 MWe39.132.19088 g CO2/kWhReCiPe method, SimaPro software v 8.3Not indicated absolute values; reduction in 72% GWP; 9% increase in resource use
Clarens (2016)Sub-critical power plant/469.9 MWePost combustion CaO looping/519.4 MWe36.929.690N/AReCiPe midpoint method v1.04, SimaPro softwareCC 0.26 kg CO2 eqv./kWh; TA 0.001 kg SO2 eqv./kWh; FE 0.0051 kg P eqv./kWh

