Abstract
Technologies to produce electric energy from renewable geothermal source are gaining increasing attention, due to their ability to provide a stable output suitable for baseload production. Performing life cycle assessment (LCA) of geothermal systems has become essential to evaluate their environmental performance. However, so far, no documented nor reliable information has been made available for developing robust LCA studies. This work provides a comprehensive inventory of the Italian Bagnore geothermal power plants system. The inventory is based exclusively on primary data, accounting for every life cycle stage of the system. Data quality was assessed by means of a pedigree matrix. The calculated LCA results showed, with an overall low level of uncertainty (2–3%), that the commissioning and operational phases accounted for more than 95% of the environmental profile. Direct emissions to atmosphere were shown to be the major environmental impact, particularly those released during the operational phase (84%). The environmental performances comparison with the average Italian electricity mix showed that the balance is always in favor of geothermal energy production, except in the climate change impact category. The overall outcome confirms the importance, for flash technology employing fluid with a high concentration of gas content, of using good quality primary data to obtain robust results.
1. Introduction
The European Commission (EC) is promoting the transition of the European Union (EU) to a highly energy efficient and low-carbon economy system [1]. Energy production from renewable energy sources (RES), saving energy and natural resources, as well as reducing carbon dioxide (CO2) emissions while managing wastes, are pivotal actions to enable such a transition [2]. The EC adopted the “2030 climate and energy framework” in 2014, which has been subsequently revised in 2018 to include broader targets and policy objectives on greenhouse gasses (GHG) emission reduction for the period from 2021 to 2030. The targets for RES and energy efficiency are set to at least 40% cuts in greenhouse gas emissions (from 1990 levels), at least a 32% share for renewable energy, and at least a 32.5% improvement in energy efficiency [3]. On November 2018, the EC presented the analytical foundation for the development of an EU Long Term Strategy for climate and energy policy and a political vision for achieving a Net Zero economy by 2050 [4]. In this context, power generation has been identified as one of the sectors with the highest potential to decarbonize. To ensure that the EU targets are met, EU legislation [5] requires that each Member State drafts a 10-year National Energy and Climate Plan (NECP), setting out how to reach its national targets. The Italian NECP [6], largely built on the 2017 Italian Energy Strategy, broadly meets the requirements set by the Regulation. The draft of the plan has been positively judged by EC, as it includes an extensive list of 101 policies and measures. These would be enough for Italy to meet the above targets, with a particularly important contribution coming from the objective of gradually phasing out coal for electricity generation by 2025. The draft plan qualitatively mentions the interactions with air quality and air emissions policy, specifically in the context of the proposed contribution expressed as 30% share of energy from RES in gross final consumption of energy in 2030. Electric energy production from RES, particularly those not emitting into the atmosphere during the operational phase like solar, wind and hydro, will play a key role in achieving such an ambitious objective. Biomass and geothermal can also play a role in replacing fossils toward a more sustainable development, but they are not exempt from drawbacks concerning CO2 emissions [7]. As geothermal energy has big potential for development [8], it is becoming important to explore the state of the art of the technology in terms of a benefit/cost ratio from an environmental point of view. Among RES, geothermal energy is considered a competitive energy source, because of its independence from seasonal and climatic conditions [9], ensuring reliable performances peculiar to non-renewable sources. Geothermal power plants can provide a stable production output, unaffected by the external environment, resulting in high capacity factors (ranging from 60% to 90%), and making the technology suitable for baseload production [10]. The technologies for power production from geothermal resource exploitation depend on the quality of the geothermal field, which, in general, increases with its enthalpy, typically spanning from liquid-only to steam-only (i.e., dry steam) reservoirs. Naturally occurring geothermal systems, known as hydro-thermal, are characterized by a resource fluid condition that can be considered directly available. By contrast, enhanced geothermal systems (EGS) aim to produce hot water at locations where natural aquifers are not present by developing an “engineered reservoir”. This technology has received significant attention, because it allows the exploitation of geothermal energy virtually anywhere. Hydrothermal (mono, double or triple flash and dry steam) plants account for around 85% of the global geothermal power generation. In 2018, this was an estimated 90 TWh, while the cumulative capacity reached 14 GW [11]. Around 14% of the global electricity production is due to a different technology based on binary cycles [12]. This technology often exploits the total re-injection of non-condensable gases (NCGs) with some environmental advantages, despite a significant decrease in efficiency and larger land occupancy [8]. In this context, the concern about the environmental performance of geothermal energy exploitation has been growing in recent years, due to the expected increase of power production from geothermal sources [13].
Life Cycle Assessment (LCA) methodology is one of the most reliable and powerful tools to assess the environmental performance of power generation systems, capable of providing results that cover several environmental aspects, thus approaching the system in a more comprehensive and holistic way [14,15,16].
Even though LCA has been applied for quite a long time now to energy-producing systems, the field of geothermal energy exploitation still lacks primary data. Only a few studies have been aimed at determining the environmental profile of currently operating geo-thermoelectric installations in Italy [17,18,19] and in Iceland [20,21].
The relative complexity and high dependency on geomorphological factors of the geothermal energy source also contributes to the scarcity of specific information. Reviews performed by several authors [22,23,24] underlined the inaccuracy due to the lack of primary data. This trend is even more evident in harmonization [25,26,27], which needs to deal with very large variability, making the elaboration of reliable eco-profile very difficult [28,29].
The consequence is that papers which analyze geothermal power plants mostly use secondary data, forcing the authors to rely on the general literature data, which are often not adequately representative of the technology and of the investigated system [30,31].
Recently, special attention has been paid to the evaluation of environmental performances of EGS [32,33]. However, at present, hydro-thermal systems dominate current electricity generation in the geothermal sector, and the exploitation of this type of reservoir is predicted to become dominant in the future [11,34]. This picture outlines the importance of assessing the life cycle environmental impacts of conventional geothermal technologies to make sustainable choices in the context of the electric energy production sector. To avoid uncertainties, a reliable and high-quality life cycle inventory of a flash installation is needed. The only current source of data is the one provided in the study by Karlsdottir et al. [35].
The scope of the present work is to provide a high-quality, complete and documented life cycle inventory of a flash power plant, and to perform the LCA of electricity production from geothermal source with a cradle to grave approach, and to evaluate how much uncertainty of data is reflected on the final LCA results. The quality of data was assessed employing a so-called pedigree or uncertainty matrix. The Italian Bagnore power plant was selected as one of the most representative flash-based conversion system power plants. This work has been made possible by the full availability of primary data which, according to our knowledge, is unique in the literature.
The Bagnore power plant system consists of three connected units, namely: Bagnore 3, the binary group of Bagnore 3 and Bagnore 4. To correctly assess the environmental footprint of these plants, it is necessary to consider them as a whole system, namely the Bagnore system. Bagnore power plants integrate two systems for atmospheric emissions abatement, namely the AMIS (i.e., the abatement system for mercury (Hg) and hydrogen sulfide (H2S)) and the ammonia (NH3) abatement system. The adoption of state-of-the-art management strategies by the operator, Enel Green Power (EGP), aims for the best trade-off between production performance and environmental compliance [36].
2. Materials and Methods
2.1. Power Plants Description
The production of electricity from geothermal exploitation in Italy is concentrated in the Tuscany region. Currently, all the geothermal power plants have been built and operated by EGP, which manages 37 productive units, allowing for the production of about 5.8 TWh/y.
The geothermal area in Tuscany is divided in four districts: Larderello, Lago and Radicondoli (halfway from the province of Siena, Grosseto and Pisa) and, in the south Tuscany, the area of Mount Amiata (between Grosseto and Siena) [37]. The area of Monte Amiata is composed by two productive geothermal fields, namely Bagnore and Piancastagnaio. The Bagnore field is characterized by the presence of 2 power plants: Bagnore 3 and Bagnore 4, entirely constructed and operated by EGP. Bagnore 3 is a flash plant with 20 MWe of installed power producing 170 GWh/y of electric energy. Additionally, the plant is powered by a 1 MWe Organic Rankine Cycle (ORC) unit, which provides 6.8 GWh/y of additional electric energy. Bagnore 4 is powered by two 20 MWe groups, which can input 367 GWh/y to the electric grid. Thus, the electricity production from the Bagnore field is about 544 GWh/y. In addition to electric generation, heat delivery is also achieved by exploiting residual heat after turbine expansion. The total heat delivered to the final users is about 32 GWh/y.
The two power plants are connected to each other to enhance the performance of the whole system. Such an enhancement is reached in both power production and environmental compatibility of the geothermal power plants [38]. A shared steam network powering the two power plants, allows the optimization of the available steam flow, thus, maximizing the power output. The shared steam network also improves the environmental footprint: in case of maintenance operations to one of the three productive units, it is possible to reroute the overflowing steam towards the operating units, thus avoiding free release into atmosphere. The operator also equipped the power plants with oversized AMIS system, able to treat 150% of the entering fluid for each turbine. Such oversizing allows the system to also abate the emissions during flow rerouting for maintenance operations.
2.2. LCA Methodological Approach
2.2.1. Goal and Functional Unit
The goal of the present LCA study is to assess the potential environmental impacts that are associated with the production of electricity from the geothermal power plants of Bagnore 3 and Bagnore 4. The functional unit selected is 1 kWh of net electricity produced. This study was conducted according to the requirements of ISO 14040 standard series [39,40] and the ILCD Handbook [41], following an attributional approach. The broader scope of the study was to provide insight and reference values on the environmental performances of an operating flash-based geothermal facility relying on a very detailed LCI. The intended application was to calculate the comprehensive eco-profile of the Bagnore power plants system. Data for building the life cycle inventory was obtained directly from EGP through accurate surveys and questionnaires.
2.2.2. System Boundaries
Figure 1 shows the system boundaries of the LCA study. The system modelling approach is cradle to grave, and it included the following phases: commissioning, operation and maintenance (which together constitute the use phase), decommissioning and end of life (EoL). The system boundaries were set up to the point where energy, in the form of electricity and heat, is produced from the plant. The distribution of energy was not considered. The life cycle phases included in the boundaries were modelled using foreground and background processes. The distinction between the foreground and background processes consists of the former being explicitly modelled for the investigated system employing data directly measured in situ, and is therefore highly representative of the technological and geographical situation of the studied system (primary data). Background processes are all the other processes for which data were retrieved from the Ecoinvent database version 3.5 [42] (secondary data). Background processes represent an average situation with a different level of geographical and technological representativeness, ranging from national to worldwide averages.
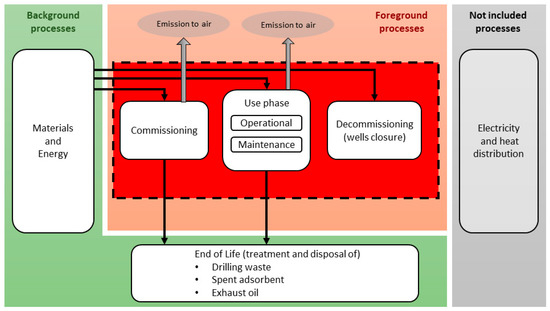
Figure 1.
Graphical representation of the system boundaries considered in this study. A distinction is made between background processes that use secondary data (Ecoinvent database v3.5) and foreground processes that use primary data representative of the Bagnore power plant system. Electricity and heat distribution infrastructure and processes are not included in this study.
The geothermal power plant system was modelled in more detail, as follows:
- (1)
- The commissioning phase included the drilling of production and injection wells and the well-pad construction; the construction of pipelines; the power plants building; all the equipment needed for the power generation plant and the heating station, including the cooling towers, the ORC unit and the production of the working fluid used by the ORC system; the construction of AMIS was also included in the commissioning stage; on the contrary, the exploration and wells’ testing stages were excluded from the analysis, due to lack of data.
- (2)
- The operational phase included the production of sulfuric acid (H2SO4) used in the fluid treatment for the oxidation of (NH3); working fluid losses during normal operation of the ORC system were inventoried as direct emissions to air; the operational phase accounted for direct emissions of NCGs, Arsenic (As) and Hg to air. Maintenance activities included in the system were: AMIS maintenance, which involved the substitution of selenium based sorbent; the evaporative tower maintenance, which involved substitution of plastic parts (drift eliminator, fan); equipment maintenance, which includes lubricant oil refilling, substitution of metals components of various technical parts (i.e., turbine, compressors). More details are given in the Supplementary Materials in the “Inventory” sheet.
- (3)
- When the geothermal power plant runs out of its lifetime, a decommissioning phase was assumed, which included exclusively the closing of the wells with cement. The activities of dismantling and recycling of machinery and equipment were excluded from the decommissioning stage, because they can be employed in other plants operated by EGP.
- (4)
- Finally, the EoL phase included the treatment and disposal of drilling mud and of the spent sorbent from AMIS maintenance, as well as the treatment of exhaust oil from equipment maintenance activity.
2.2.3. LCA Key Modelling Parameters
This section reports the key modelling parameters of the geothermal plant (see Table 1), as well as the secondary data selection. The inventory of the Bagnore system is discussed in Section 3, where a general comparison in terms of data quality and coverage with the currently available LCI for Hellisheidi [35] is performed.

Table 1.
Bagnore power plant system LCA key modelling parameters.
Site specific data have always been used when possible, whereas background data were retrieved from the Ecoinvent database [42], with a preference for specific Italian dataset when available (i.e., for the electricity mix). When not available, average European or global dataset were selected.
2.2.4. Data Representativeness and Quality
The quality of collected data was assessed by means of the Ecoinvent data quality system [43]. Five indicators (i.e., reliability, completeness, temporal correlation, geographical correlation, further technological correlation) were assessed using a score from the best quality (score 1 corresponding to a verified measured data) to the worst (score 5 corresponding to not qualified/or estimate data). The complete description of indicators and scores is reported in Table 2.
Table 2.
Data quality indicators and score description on scores 1.
After a score was assigned to each data indicator for all material and energy inputs included in the inventory, the Ecoinvent data quality system calculates a corresponding numerical value of uncertainty, assigning a specific geometric standard deviation to a log-normal distribution (see the Supplementary Materials for standard deviation values). The propagation of uncertainty throughout the model was then calculated by means of the Monte Carlo analysis (i.e., 10,000 runs), obtaining a final standard deviation on the results in each impact category.
2.2.5. Important Assumptions
Transport of assembled machinery to the geothermal plant site was excluded, because of the limited distance between the plant and the production site (i.e., 150 km). However, the transport of the semi-products and raw material was included using the background processes in the Ecoinvent database.
For small steel parts, an aggregated mass value was provided by EGP. This quantity is supposed to cover all the steel used for general parts in the commissioning phase. Thus, it was equally divided between the six components: AMIS, gas intercooler, gas compressor, condenser, evaporative tower and turbine.
During the maintenance of the power plant, 10% of the steel content of the steam turbine rotor was assumed to be substituted with new steel every four years.
Drilling wastes spent mineral oil and sorbent were considered to be sent to landfill. According to the information supplied, no additional treatment processes were considered.
Data on direct emissions from the power plant’s stack was taken from Ferrara et al. [44]. These emissions were modelled as output flows “emission to air, low population density”.
2.2.6. Allocation Procedure
The Bagnore 3 and 4 power plant is a multifunctional system, since it produces both electricity and thermal energy. In this study, an exergy-based allocation procedure was chosen to deal with such multifunctionality as a proper allocation method, according to the ILCD Handbook [41]. The exergy allocation method accounts for the quality (i.e., exergy content, ability to do work) of the two energy products (i.e., electricity and heat) generated by the power plant. Thus, 95% of total impacts were allocated to the electricity produced. The complete procedure to calculate allocation coefficients for electricity and heat is reported in detail in the Supplementary Materials, in the sheet “Allocation”.
2.2.7. Life Cycle Impact Assessment Method
The ILCD 2011 Midpoint+ method v1.0.9 was adopted for translating the emissions and resources use into environmental impacts, which were quantified during the inventory phase. The impact categories acidification potential (AC); climate change (CC); freshwater ecotoxicity (EC); freshwater eutrophication (FEP); human toxicity, cancer effects (HTc); human toxicity, non-cancer effects (HTnc); ionizing radiation human Health effect (IRHH); land use (LU); marine eutrophication (MEP); mineral, fossil and ren resource depletion (MFRD); ozone depletion (ODP); particulate matter (PM); photochemical ozone formation (POF); terrestrial eutrophication (TE); water resource depletion (WRD) were included in the analysis. The ionizing radiation E (interim) impact category was excluded, due to its incomplete development [45]. The normalization step was performed by applying the reference values of the “EU27 2010, equal weighting” set. According to the latest development in European guidelines of the ILCD method [45], the discussion related to the toxicity categories was excluded from the analysis. All the calculations and modelling were performed using the open-source software OpenLCA version 1.10 and LCIA package v2.0.4 [46].
3. Life Cycle Inventory Analysis
One main objective of this research was to present the most detailed and accurate life cycle inventory based on primary data for a state-of-the-art flash geothermal power plant. The collection of information was performed with the intent of obtaining the highest level of detail in terms of LCA requirements [41]. The inventory of materials and energy input and output flows was collected for each of the separated components, and based only on primary data. To our knowledge, the data inventory built in the present work represents the first of a kind LCI available in the state-of-the-art literature for geothermal power plants based on flash technology. The resulting inventory is presented in its extended version in the Supplementary Materials (sheet “Inventory”).
Currently, the most referred LCI available in the literature concerning flash technology is the one published by Karlsdottir et al. [35]. As much as this inventory is quite comprehensive and detailed, and it has often been employed for geothermal system modelling in LCA studies ([24] and references therein), it fails by not providing primary data and accounting for all the life cycle stages of the energy generation system. The present work aims to provide an improved inventory for the flash technology, which could potentially be used in conjunction with the work by Karlsdottir et al. [20,35] for geothermal system modelling in future LCA studies of geothermal power plants.
Table 3 reports the main differences between the present work (right side) and the work by Karlsdottir et al. [35] (left side). Regarding data accuracy, the inventory presented in this work is entirely based on primary data coming from the EGP Company that has executed the activities. Only a few assumptions were made based on expert knowledge, for instance, concerning power building material requirements. In this case, the primary data used for modelling of Bagnore 4 was also used also for Bagnore 3, as suggested by the power plant operator EGP, employing a scaling factor. Even though this can be considered as an estimation, it is still based on primary data and, more importantly, on the expert judgment of the operator. As a result, when considering data quality, a large part of the indicators scored between 1 and 3 (see Table 2).
Table 3.
Main differences between the currently available life cycle inventories for flash technology.
On the other hand, Karlsdottir et al. [35] includes a higher component’s specificity, for example, steel grades are provided, as are mass weight for smaller equipment parts. However, these data are mainly based on secondary data and authors’ assumptions. The data coverage featured in this paper is higher, compared to the one in Karlsdottir et al. [35]. Specifically, the present work considers all the regular maintenance activities, for example, lubricating oil substitution and regular maintenance operation of machinery, EoL treatments of wastes and wells closure operations, previously never considered.
In this paper, the same approach used in Parisi et al. [37] was adopted. Such an approach relies on a statistical analysis of all the compounds emitted during power generation from geothermal exploitation. The only difference compared to the work of Parisi et al. [37] is represented by the emission values that have been updated with the most recent ones provided by the regional environmental agency [47].
Table 4 reports the main energy and material inputs for the commissioning phase related to the functional unit. Diesel consumption is primarily associated with the wells drilling process with a specific consumption of about 12 GJ/m. Concerning material use, Portland cement and steel represent the most used materials, accounting for about 70% of the total weight of equipment used in this stage. Portland cement is employed in the casing of wells and power station buildings, whereas steel is partitioned among casing, pipelines and machinery. Depending on the application, different steel grades can be used.
Table 4.
Main material and energy inputs employed in the commissioning phase. The cut-off is set at 2% of the total mass, to reduce the number of inputs reported. Complete information can be found in the Supplementary Materials.
The material input for maintenance activities are reported in Table 5. The maintenance stage represents the planned activities required to keep the power plant in operation. Extraordinary maintenance activities are hence omitted. The maintenance activities that result in the highest material consumption are those related to the substitution of the spent Hg absorber (Selenium), the lubricating oil replacement, as well as the steel and polyvinyl chloride (PVC) replacement for power plant machinery. In this case, a substitution of 10% of the total weight of the steam turbine rotor every four years was considered.
Table 5.
Main material and energy inputs employed in the maintenance phase. The cut-off is set 2% of the total mass, to reduce the number of inputs reported. Complete information can be found in the Supplementary Materials.
The operational stage considers the atmospheric emissions, due to geothermal fluid exploitation and the material input needed by the NH3 abatement system. As shown in Table 6, the emission of CO2 and methane (CH4) dominates the environmental emission profile of the Bagnore power plant system. In contrast, the H2SO4 is by far the most used material during the operational phase.
Table 6.
Main material input and direct atmospheric emissions from the operational phase. The cut-off is set 2% of the total mass to reduce the number of inputs to be reported. Complete information can be found in the Supplementary Materials.
Table 7 provides information on energy and materials inputs for the decommissioning phase. The assumption is that all the drilled wells will undergo a closure process when the plant runs out its lifetime. This approach was adopted more to test the influence of the EoL processes of wells than to represent a real option. The Bagnore power plant system is managed in a sustainable way, ensuring a constant productivity without depletion of the resource. However, since a lifetime must be set in LCA, this work has considered the unlikely option that the wells will be closed after the given lifespan to account for the EoL process.
Table 7.
Main material and energy input employed in the well closure phase. The cut-off is set 2% of the total mass, to reduce the number of inputs reported. Complete information can be found in the Supplementary Materials.
4. Results
4.1. Life Cycle Assessment of the Bagnore Power Plant System
Figure 2 reports the percentage of contribution of commissioning, operational, maintenance, decommissioning and EoL phases of the Bagnore power plant system, to the total impacts for all the categories included in the ILCD method. The potential impacts on the 15 categories that were considered are essentially determined by the commissioning and operational phases, which contribute for more than 90% on the total impacts in each category. In more detail, the operational phase contributes for 80%–90% of the overall potential impacts on the AC, CC, HTnc, MEP, PM, POF and TE categories, and about 70% to WRD. These impacts are mainly linked with direct emissions to the air of NH3, CO2 and CH4. The emission of NH3 determines the impact on AC (i.e., 96% of the total impact), MEP (84% of the total impact), TE (99% of the total impact) and PM (86% of the total impact). In contrast, the impact on the CC category is shared between the CO2 (i.e., 57% of the total impact) and CH4 (i.e., 42% of the total impact) emissions. The 75% of the total impact on POF is determined by CH4.
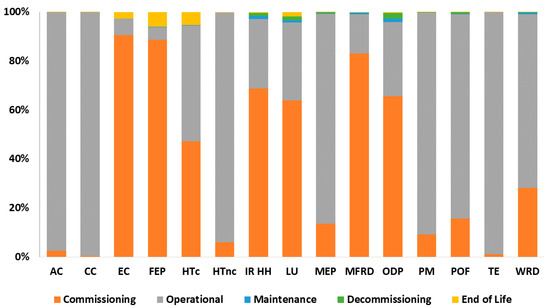
Figure 2.
Percentage of contribution of commissioning, operation, maintenance, decommissioning and EoL phases to the total impact in all the assessed impact categories.
The commissioning phase is responsible for more than 80% of the total potential impacts on EC, FEP and MFRD. The copper requirement during the building construction process is the main contributor to such impacts. The commissioning phase contributes about 60% to 70% to the IRHH, LU and ODP categories, for which the deep well construction process shows the highest contribution.
Subsequently, the decommissioning and EoL phases show a negligible contribution to all the considered impact categories.
The characterized results of each impact category were divided by a selected reference value, in order to better understand the magnitude of the results of impact category indicators, and to bring all the results on the same normalized scale (see the Supplementary Materials for normalization values). After the normalization step, the CC, TE and AC categories, in this order, had the highest impacts among all the selected impact categories (Figure 3). The impacts from geothermal electricity production were compared with the impacts from the average Italian energy mix [48], to give a reference system and interpret the magnitude of the geothermal eco-profile. The Ecoinvent version 3.5 employed for the analysis is based on the Italian electric energy mix by 2014. The share consisted of 60% arising from fossils (coal, gas, oil) and import (mostly nuclear). RES represents 40% of the total, with 18% generated by hydro, 7% by photovoltaics, 5% wind, 6% biofuel, 2% waste and 2% geothermal.
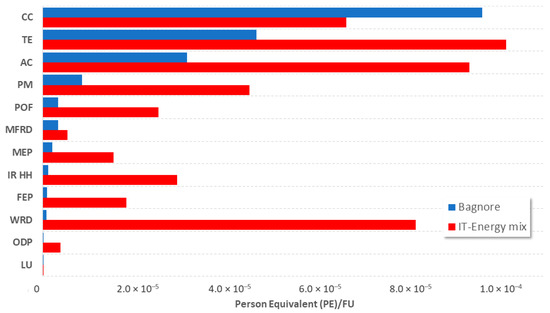
Figure 3.
Normalized results for the production of 1 kWh of electric energy from the Bagnore power plant system (blue) and from the average Italian electricity mix (light grey). Climate change (CC), terrestrial eutrophication (TE), acidification potential (AC) and particulate matter (PM) have been identified as the categories with the highest impact.
As shown in Figure 3, all the impacts caused by the average Italian electricity mix are higher than those of geothermal energy production, with the exception of climate change, due to the emissions of CO2 and CH4 that are intrinsic to the geothermal resource exploitation activities.
The impacts on the CC, TE and AC categories for geothermal electricity production are determined almost exclusively by emissions to the air during the operational phase (i.e., NH3, CO2 and CH4). As shown in Figure 3 and Table 8, all the impacts caused by the average operational phase are mainly related to the geothermal fluid composition, and can thus be considered site-dependent.
Table 8.
Contribution of LC phases to the most impacting categories: AC, CC, PM and terrestrial eutrophication (TE). Impacts are reported as person equivalent (PE) per functional unit (FU). Complete information can be found in the Supplementary Materials.
On the contrary, the commissioning phase is common to all flash technologies, and Figure 4 shows the contribution of processes within this phase. The processes considered in the commissioning phase are clustered in drilling, drilling waste (disposal), equipment and pipelines. The drilling process includes, in addition to the drilling activities themselves, the construction of the well pads. In contrast, equipment includes all the materials and energy needed to realize the components present in the power plants and the power plants building itself. The pipelines construction process is separated from the others, because they are structures connecting wells and power plants.
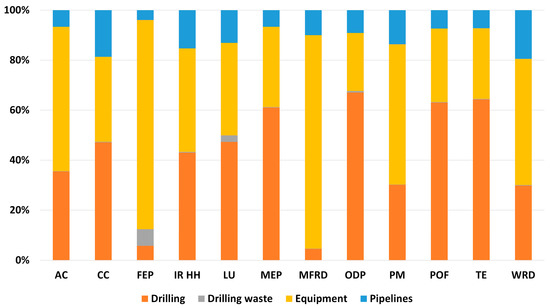
Figure 4.
Percentage of contribution from drilling, drilling waste disposal, equipment and pipelines to the commissioning phase.
The hotspot analysis results show that the potential impacts of the commissioning phase are fairly divided among equipment and drilling processes. Building construction and the production of metals (i.e., copper) determine the impact of the equipment. Emissions from the combustion of diesel used to drive the drilling rig are the most responsible for the impact during drilling. Pipelines generally give a contribution of around 10% of the total impacts in all categories, except for CC and WRD. Drilling waste disposal has a negligible impact.
4.2. Uncertainty Analysis of Results
Figure 5 reports the uncertainty values (MIN, MAX and standard deviation) related to the average potential impact for the categories CC, TE, AC and PM, which were previously identified as having the highest impact. The uncertainty associated with the results was calculated following the procedure described in Section 2.2.4.
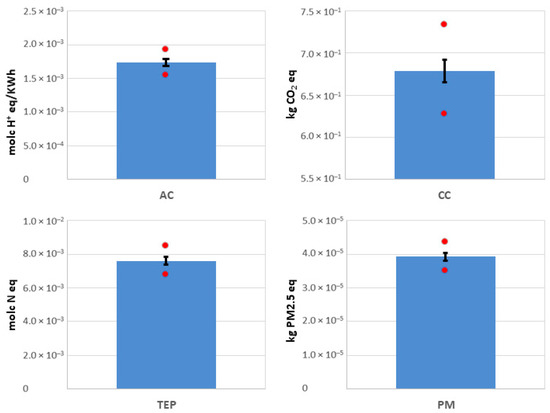
Figure 5.
Characterized impact results per kWh of electricity produced for the categories CC, TE, AC and PM. Bars represent the standard deviation around the average impact values, whereas red dots refer to MIN and MAX values.
The calculated uncertainty of results for the identified categories is low and ranging between 2–3%. The impact of these categories is exclusively determined by airborne emissions (primary data) during the operational phase. The good quality of data for airborne emissions (low score in all indicators, see Table 2) results in a low uncertainty of the final LCA results. In those cases where the impact is determined by other stages, with different levels of quality of primary data, the final uncertainty is generally higher and, in some cases, up to a standard deviation around the mean value of 58%.
In Table 9, the uncertainty related to the impacts for all categories is reported together with the overall score for each data quality indicator used to calculate the impacts. Generally, a low overall data quality (high scores in Table 2) corresponds to a relatively high standard deviation (>10%). The uncertainty of results is not exclusively related to the inventory data, but also to the secondary (background) data and their relative uncertainty as specified in the Ecoinvent database.
Table 9.
Uncertainty analysis for each impact category results and data quality indicator score. (R) Reliability; (C) Completeness; (T) Temporal correlation; (G) Geographical correlation; (F) Further technological correlation.
5. Discussion
The LCA results show that direct emissions to the atmosphere released during the commissioning and operational phases are the dominant impact for the Bagnore system. For the commissioning phase, as the emissions of CO2 associated with the combustion of diesel used to drive the drilling rig are the principal factors responsible for the environmental impact, the eco-profile would certainly improve in the future by changing the drilling technology. Unfortunately, so far, the initiatives promoted by operators to employ an electric rig, directly powered by the medium-voltage network, aiming for a simplification of the process and a reduction of impact and costs, have been unsuccessful. The main difficulties arose with the medium-voltage network connections, and for authorization procedures, which look quite complex due to safety requirements.
However, the applicability of such a system looks only suitable for the consolidated stations with several wells.
The potential environmental impacts generated during the operational phase are mainly linked with airborne emissions. The comparison with the Italian energy mix makes it possible to highlight the differences in the environmental performances, which are in favor of geothermal energy exploitation for all the environmental impact categories, with the exception of climate change. This outcome is due to the significant contribution given to the average Italian electricity mix from RES like hydro, photovoltaics and wind energy, whose CO2 emission contributions in the atmosphere during the operational phase are negligible. This confirms previous evidence that geothermal energy, although renewable, is not the cleanest one, even if it performs better than any other fossil source. This finding gives a benchmark to interpret the magnitude of the power plant eco-profile. As the emissions of NH3, CH4 and CO2 during the operational phase are mainly related to the geothermal fluid composition, they can be considered site-dependent, therefore particular care should be exercised in deciding the localization of plants in the project phase. In this context, it should be mentioned that, to date, in the analysis of greenhouse gases emissions, the Intergovernmental Panel on Climate Change [49] considers the release of greenhouse gases of geothermal origin quantitatively negligible, despite the fact that this has been demonstrated not always to be true [7]. Notwithstanding the evidence that flash geothermal electricity production is contributing to CO2 emissions more than the Italian electricity mix, some intrinsic benefits connected with geothermal development should be considered. This is particularly important in the frame of a policy sensitive to environmental and social issues: (i) geothermal energy is a renewable local based energy source and not imported; (ii) a secondary, but not negligible advantage can be found in the use of thermal fluids for civil or light industry purposes in the neighboring area; (iii) electricity generated by geothermal contributes to the basic load and it is independent on atmospheric conditions. However, regarding this latter issue, we should be aware that in the future, due to discontinuity of solar and wind electricity supply, flexible power systems will be even more valuable.
The main achievement of the assessment method implemented in this work relies mainly on two aspects. Firstly, the investigated system has been selected from the latest in technological excellence in the field of flash geothermal generation in Italy. Secondly, the EGP operator granted the availability of primary data to build the LCI, as reported in the Supplementary Materials. This is noteworthy compared to the state-of-the-art LCA literature on geothermal systems, which very often uses secondary or tertiary data.
The representativeness and quality of the inventory data, presented in Section 3, should always be assessed to ensure robustness of LCA results. Significant elements of improvement in this work are represented by the level of detail for machinery and components, data quality and coverage, as well as the inclusion of the EoL as shown in Table 3.
The exergy-based allocation method chosen to address the multifunctionality represents another feature of this work: although not fully new, most LCA studies allocate according to mass, energy content or monetary value. Exergy reflects the difference in terms of energy quality among energy outputs and represents the most suitable method, from a thermodynamic point of view, for discerning the benefits of combined heat and power systems.
The uncertainty evaluation on LCA results performed with the Monte Carlo analysis shows a non-negligible dependence on the background Ecoinvent database and the LCIA method assumptions, not on foreground data. This confirms the reliability of the LCA system modelling adopted in this work. The scientific approach employed offers a detailed insight of the research findings in agreement with the ISO 14040 and ILCD requirements. From a policy point of view, the transparency of the assessment method could support effective decision-making.
As mentioned in the Introduction, the EU has committed itself to a clean energy transition, which will contribute to fulfilling the goals of the Paris Agreement on climate change [1,5]. According to the Italian NECP targets [6], the electric generation power will be affected by an important transformation, due to the goal of the phasing out of coal generation plants by 2025, and the necessary promotion of a large contribution from RES to replace them. The maximum contribution to the growth of RES will arise particularly from the electricity sector, which, by 2030, will reach 187 TWh of generation from RES, equal to 16 Mtep. The strong penetration of technologies for renewable electrical energy production, mainly photovoltaics and wind, will make it possible to cover 55.0% of the final gross electric consumptions with RES, compared to the 40% contributed in 2014. The photovoltaics and wind capacity should triple and double, respectively, by 2030. With regards to other RES in the NECP, a limited growth of additional geothermal power from 813 to 950 MWe is foreseen, which would represent the only maintenance of the actual 2% of the Italian electric mix. This target is considered for conventional geothermal technology, with reduced direct emission limits. It arises from the awareness that, even if geothermal energy is quite suitable for replacing fossils in electricity production, the limits due to environmental impacts still hold. The possibility of providing incentives for other technologies like that with zero emissions in plants, with a total reinjection of fluids, is under evaluation. At the moment, these technologies, like geothermal at reduced environmental impact, are considered to be as innovative in the national context as offshore wind, concentrated solar power and ocean energy.
6. Conclusions
In this paper, a cradle to grave LCA of the Italian flash technology Bagnore power plants system has been performed, based on a comprehensive and accurate life cycle inventory of primary data supplied by the plant manufacturer and operator EGP. From the LCA results, it can be inferred that the potential environmental impacts are determined for more than 95% by the operational (direct emissions to air of NH3, CH4, CO2) and commissioning (CO2 emissions due to diesel combustion during drilling) phases. Maintenance, decommissioning and EoL phases show a negligible contribution to all the considered impact categories. Globally, out of the sixteen impact categories selected, climate change, ccidification, terrestrial eutrophication and particulate matter were the most affected. These outcomes imply that LCA results of electricity generation from flash technology employing a mid to high dissolved gas content fluid are primarily determined by emissions to air. Direct emissions into the atmosphere are the responsible for most of the environmental impact in the operational phase (84%). The comparison made with the life-cycle environmental impacts caused by the production process of the average Italian electricity mix showed that the balance is almost always in favor of the geothermal energy production, with the only exception being the climate change category. A further finding of this work is that, in the commissioning phase, the impact is equally divided between well drilling and equipment. It is notable that the copper requirement during the building construction process is the main contributor to impact in the commissioning phase. Accordingly, future research might explore the possibility of replacing metals and particularly copper in building the plant.
It should be noticed that the data referring to the commissioning, maintenance and EoL stages presented in this study might be used by the scientific community to evaluate the potential environmental impact of geothermal systems. On the other hand, site-specific information, such as direct environmental emissions measured during the operational phase, is exclusively valid in this specific geothermal field.
This work offers the most complete life cycle inventory for a state-of-the-art flash system conversion technology accounting for the whole life cycle of the geothermal power plant. The robustness of the results obtained here, as demonstrated by the uncertainty analysis, emphasises the need for high quality primary data for performing reliable and consistent LCA studies. This is particularly true in the geothermal sector, where the lack of primary data and precise information about the conversion technology and the geo-specificity of the reservoir for long periods prevented the possibility to get reliable results, affecting the quality of the LCA studies. In this context, the availability of primary data and open access to technical repositories become essential to reach high standards in the LCA literature concerning geothermal systems. We believe that the accurate approach presented in this paper will aid promoting the implementation of environmental assessment studies, which are essential to undertake impact minimization actions on currently operating power plants, and to improve the eco-design perspective of future installations.
Supplementary Materials
The following are available online at https://www.mdpi.com/1996-1073/13/11/2839/s1, Excel file S1: energies-13-02839-supplementary.xls.
Author Contributions
Conceptualization, R.B. and M.L.P.; methodology, R.B. and M.L.P.; validation, R.B. and M.L.P.; formal analysis, L.T., N.F. and M.L.P.; investigation, L.T., N.F. and M.L.P.; data curation, L.T., N.F. and M.L.P.; writing-original draft preparation, L.T., N.F., R.B. and M.L.P.; writing-review and editing, L.T., N.F., R.B. and M.L.P.; visualization, L.T. and N.F.; supervision, R.B. and M.L.P.; project administration, R.B. and M.L.P.; funding acquisition, M.L.P. All authors have read and agreed to the published version of the manuscript.
Funding
This research received no external funding.
Acknowledgments
MIUR Grant—Department of Excellence 2018–2022. L.T. and M.L.P. acknowledge the European Union’s Horizon 2020 Framework Program for funding Research and Innovation under Grant agreement no. 818242 (GEOENVI) for funding. Authors would like to thank Romina Taccone, Marco Paci and Massimo Luchini (EGP) for primary data supplying. EGP and Roberto Bonciani are gratefully acknowledged for fruitful discussion. NF thanks COSVIG (Regione Toscana) for contributing to his grant. Careful reading and revising of the manuscript by Emeritus Michael Rodgers, Bowling Green State University, is gratefully acknowledged.
Conflicts of Interest
The authors declare no conflict of interest.
Abbreviations
| AMIS | Atmospheric emissions abatement system |
| AC | Acidification potential |
| CC | Climate change |
| EC | Freshwater ecotoxicity |
| EGP | Enel Green Power |
| EGS | Enhanced Geothermal System |
| EoL | End of Life |
| FEP | Freshwater eutrophication |
| GHG | Greenhouse gas |
| GWh/y | Giga Watt hour per year |
| HTc | Human toxicity, cancer effects |
| HTnc | Human toxicity, non-cancer effects |
| IRE | Ionizing radiation Environment effect (interim) |
| IRHH | Ionizing radiation Human Health effect |
| LCA | Life cycle assessment |
| LCI | Life cycle inventory |
| LCIA | Life cycle impact assessment |
| LU | Land use |
| MEP | Marine eutrophication |
| MFRD | Mineral, fossil & ren resource depletion |
| MWe | Mega Watt electric |
| NCGs | Non-condensable gasses |
| ODP | Ozone depletion |
| ORC | Organic Rankine cycle |
| PM | Particulate matter |
| POF | Photochemical ozone formation |
| RES | Renewable energy sources |
| TE | Terrestrial eutrophication |
| WRD | Water resource depletion |
References
- European Commission. Clean Energy for all Europeans; European Commission: Brussels, Belgium, 2019. [Google Scholar]
- EU. Directive (EU) 2018/2001 of the European Parliament and of the Council on the promotion of the use of energy from renewable sources. Off. J. Eur. Union 2018, 2018, 82–209. [Google Scholar]
- European Commission. EUR-Lex—52014DC0015—EN 2014; European Commission: Brussels, Belgium, 2014. [Google Scholar]
- European Commission. A Clean Planet for All A European Strategic Long-Term Vision for a Prosperous, Modern, Competitive and Climate Neutral Economy; European Commission: Brussels, Belgium, 2018; pp. 1–25. [Google Scholar]
- European Commission. EUR-Lex—32018R0842—EN 2018; European Commission: Brussels, Belgium, 2018. [Google Scholar]
- European Commission. EUR-Lex—52018DC0716—EN 2018; European Commission: Brussels, Belgium, 2018. [Google Scholar]
- Bravi, M.; Basosi, R. Environmental impact of electricity from selected geothermal power plants in Italy. J. Clean. Prod. 2014, 66, 301–308. [Google Scholar] [CrossRef]
- Dumas, P.; Garabetian, T.; Serrani, C.; Pinzuti, V. EGEC Geothermal Market Report 2018; EGEC: Brussels, Belgium, 2019. [Google Scholar]
- Fridleifsson, I.B.; Bertani, R.; Huenges, E. The possible role and contribution of geothermal energy to the mitigation of climate change. In Proceedings of the IPCC Scoping Meeting on Renewable Energy Sources; Hohmeyer, O., Trittin, T., Eds.; The Intergovernmental Panel on Climate Change: Luebeck, Germany, 2008; pp. 59–80. [Google Scholar]
- International Energy Agency. Geothermal—Tracking Power; International Energy Agency: Paris, France, 2019. [Google Scholar]
- International Energy Agency. World Energy Outlook; International Energy Agency: Paris, France, 2019. [Google Scholar]
- Bertani, R. Geothermal power generation in the world 2010–2014 update report. Geothermics 2016, 60, 31–43. [Google Scholar] [CrossRef]
- Sanner, B. Summary of EGC 2019 Country Update Reports on Geothermal Energy in Europe. In Proceedings of the European Geothermal Congress 2019, The Hague, The Netherlands, 11–14 June 2019; p. 18. [Google Scholar]
- Turconi, R.; Boldrin, A.; Astrup, T. Life cycle assessment (LCA) of electricity generation technologies: Overview, comparability and limitations. Renew. Sustain. Energy Rev. 2013, 28, 555–565. [Google Scholar] [CrossRef]
- Parisi, M.L.; Maranghi, S.; Vesce, L.; Sinicropi, A.; Di Carlo, A.; Basosi, R. Prospective life cycle assessment of third-generation photovoltaics at the pre-industrial scale: A long-term scenario approach. Renew. Sustain. Energy Rev. 2020, 121, 109703. [Google Scholar] [CrossRef]
- Rossi, F.; Parisi, M.L.; Maranghi, S.; Basosi, R.; Sinicropi, A. Environmental analysis of a Nano-Grid: A Life Cycle Assessment. Sci. Total Environ. 2019, 700, 134814. [Google Scholar] [CrossRef]
- Basosi, R.; Bonciani, R.; Frosali, D.; Manfrida, G.; Parisi, M.L.; Sansone, F. Life cycle analysis of a geothermal power plant: Comparison of the environmental performance with other renewable energy systems. Sustainability 2020, 12, 2786. [Google Scholar] [CrossRef]
- Buonocore, E.; Vanoli, L.; Carotenuto, A.; Ulgiati, S. Integrating life cycle assessment and emergy synthesis for the evaluation of a dry steam geothermal power plant in Italy. Energy 2015, 86, 476–487. [Google Scholar] [CrossRef]
- Parisi, M.L.; Basosi, R. Geothermal energy production in Italy: An LCA approach for environmental performance optimization. In Life Cycle Assessment of Energy Systems and Sustainable Energy Technologies—The Italian Experience; Basosi, R., Cellura, M., Longo, S., Parisi, M.L., Eds.; Springer: Berlin/Heidelberg, Germany, 2019; pp. 31–43. ISBN 18653529. [Google Scholar] [CrossRef]
- Karlsdottir, M.R.; Heinonen, J.; Palsson, H.; Palsson, O.P. Life cycle assessment of a geothermal combined heat and power plant based on high temperature utilization. Geothermics 2020, 84, 101727. [Google Scholar] [CrossRef]
- Paulillo, A.; Striolo, A.; Lettieri, P. The environmental impacts and the carbon intensity of geothermal energy: A case study on the Hellisheiði plant. Environ. Int. 2019, 133, 105226. [Google Scholar] [CrossRef]
- Bayer, P.; Rybach, L.; Blum, P.; Brauchler, R. Review on life cycle environmental effects of geothermal power generation. Renew. Sustain. Energy Rev. 2013, 26, 446–463. [Google Scholar] [CrossRef]
- Menberg, K.; Pfister, S.; Blum, P.; Bayer, P. A matter of meters: State of the art in the life cycle assessment of enhanced geothermal systems. Energy Environ. Sci. 2016, 9, 2720–2743. [Google Scholar] [CrossRef]
- Tomasini-Montenegro, C.; Santoyo-Castelazo, E.; Gujba, H.; Romero, R.J.; Santoyo, E. Life cycle assessment of geothermal power generation technologies: An updated review. Appl. Therm. Eng. 2017, 114, 1119–1136. [Google Scholar] [CrossRef]
- Asdrubali, F.; Baldinelli, G.; D’Alessandro, F.; Scrucca, F. Life cycle assessment of electricity production from renewable energies: Review and results harmonization. Renew. Sustain. Energy Rev. 2015, 42, 1113–1122. [Google Scholar] [CrossRef]
- Sullivan, J.L.; Clark, C.E.; Han, J.; Wang, M. Life cycle analysis of geothermal systems in comparison to other power systems. Trans. Geotherm. Resour. Counc. 2010, 34, 128–132. [Google Scholar]
- Sullivan, J.L.; Clark, C.E.; Yuan, L.; Han, J.; Wang, M. Life-Cycle Analysis Results for Geothermal Systems in Comparison to Other Power Systems: Part. II; Argonne: Lemont, IL, USA, 2012. [Google Scholar]
- Lacirignola, M.; Meany, B.H.; Padey, P.; Blanc, I. A simplified model for the estimation of life-cycle greenhouse gas emissions of enhanced geothermal systems. Geotherm. Energy 2014, 2, 1–19. [Google Scholar] [CrossRef]
- Lacirignola, M.; Blanc, P.; Girard, R.; Pérez-López, P.; Blanc, I. LCA of emerging technologies: Addressing high uncertainty on inputs’ variability when performing global sensitivity analysis. Sci. Total Environ. 2017, 578, 268–280. [Google Scholar] [CrossRef] [PubMed]
- Marchand, M.; Blanc, I.; Marquand, A.; Beylot, A.; Bezelgues-Courtade, S.; Traineau, H. Life Cycle Assessment of High Temperature Geothermal Energy Systems. In Proceedings of the World Geothermal Congress 2015, Melbourne, Australia, 19–24 April 2015; pp. 19–25. [Google Scholar]
- Martínez-Corona, J.I.; Gibon, T.; Hertwich, E.G.; Parra-Saldívar, R. Hybrid life cycle assessment of a geothermal plant: From physical to monetary inventory accounting. J. Clean. Prod. 2017, 142, 2509–2523. [Google Scholar] [CrossRef]
- Frick, S.; Kaltschmitt, M.; Schröder, G. Life cycle assessment of geothermal binary power plants using enhanced low-temperature reservoirs. Energy 2010, 35, 2281–2294. [Google Scholar] [CrossRef]
- Pratiwi, A.; Ravier, G.; Genter, A. Geothermics Life-cycle climate-change impact assessment of enhanced geothermal system plants in the Upper Rhine Valley. Geothermics 2018, 75, 26–39. [Google Scholar] [CrossRef]
- European Commission. SET Plan Integrated SET—Plan Action 7 “Become Competitive in the Global Battery Sector to Drive E-Mobility and Stationary Storage Forward”; European Commission: Brussels, Belgium, 2018; pp. 1–70. [Google Scholar]
- Karlsdóttir, M.R.; Pálsson, Ó.P.; Pálsson, H.; Maya-Drysdale, L. Life cycle inventory of a flash geothermal combined heat and power plant located in Iceland. Int. J. Life Cycle Assess. 2015, 20, 503–519. [Google Scholar] [CrossRef]
- Fedeli, M.; Mannari, M.; Sansone, F. BAGNORE 4: A benchmark for geothermal power plant environmental compliance. In Proceedings of the European Geothermal Congress, Strasbourg, France, 19–23 September 2016. [Google Scholar]
- Parisi, M.L.; Ferrara, N.; Torsello, L.; Basosi, R. Life cycle assessment of atmospheric emission profiles of the Italian geothermal power plants. J. Clean. Prod. 2019, 234, 881–894. [Google Scholar] [CrossRef]
- Bonciani, R.; Lenzi, A.; Luperini, F.; Sabatelli, F. Geothermal power plants in Italy: Increasing the environmental compliance. In Proceedings of the Conference European Geothermal Congress 2013, Pisa, Italy, 3–7 June 2013. [Google Scholar]
- International Organization for Standardization. ISO 14040:2006—Environmental Management—Life Cycle Assessment—Principles and Framework 2006; International Organization for Standardization: Geneva, Switzerland, 2006. [Google Scholar]
- International Organization for Standardization. ISO 14044:2006 Environmental management—Life cycle assessment—Requirements and guidelines 2006; International Organization for Standardization: Geneva, Switzerland, 2006. [Google Scholar]
- European Commission. International Reference Life Cycle Data System (ILCD) handbook: Framework and Requirements for Life Cycle Impact Assessment Models and Indicators; European Commission: Brussels, Belgium, 2010; ISBN 9789279175398. [Google Scholar]
- Wernet, G.; Bauer, C.; Steubing, B.; Reinhard, J.; Moreno-Ruiz, E.; Weidema, B. The ecoinvent database version 3 (part I): Overview and methodology. Int. J. Life Cycle Assess. 2016, 21, 1218–1230. [Google Scholar] [CrossRef]
- Weidema, B.P.; Bauer, C.; Hischier, R.; Mutel, C.; Nemecek, T.; Reinhard, J.; Vadenbo, C.O.; Wenet, G. Overview and Methodology. Data Quality Guideline for the Ecoinvent Database Version 3. Ecoinvent Report 1 (v3); The ecoinvent Centre: St. Gallen, Switzerland, 2013. [Google Scholar]
- Ferrara, N.; Basosi, R.; Parisi, M.L. Data analysis of atmospheric emission from geothermal power plants in Italy. Data Br. 2019, 25, 104339. [Google Scholar] [CrossRef] [PubMed]
- Saouter, E.; Biganzoli, F.; Ceriani, L.; Versteeg, D.; Crenna, E.; Zampori, L.; Sala, S.; Pant, R. Environmental Footprint: Update of Life Cycle Impact Assessment Methods: Ecotoxicity Freshwater, Human Toxicity Cancer, and Non-Cancer; Publications Office of the European Union: Luxembourg, 2018. [Google Scholar]
- Greendelta OpenLCA V 1.8 2018. Available online: http://www.openlca.org/greendelta/ (accessed on 11 January 2020).
- ARPAT. Geothermal Emissions Monitoring; Tuscany Regional Agency for Environmental Protection: Pisa, Italy, 2018. (In Italian) [Google Scholar]
- Itten, R.; Frischknecht, R.; Stucki, M.; Scherrer, P.; Psi, I. Life Cycle Inventories of Electricity Mixes and Grid; Paul Scherrer Institute: Villigen, Switzerland, 2014; pp. 1–229. [Google Scholar]
- Stocker, T.F.; Qin, D.; Plattner, G.-K.; Tignor, M.; Allen, S.K.; Boschung, J.; Nauels, A.; Xia, Y. Climate Change 2013: The Physical Science Basis. Contribution of Working Group I to the Fifth Assessment Report of the Intergovernmental Panel on Climate Change; IPCC: Geneva, Switzerland, 2013. [Google Scholar]


© 2020 by the authors. Licensee MDPI, Basel, Switzerland. This article is an open access article distributed under the terms and conditions of the Creative Commons Attribution (CC BY) license (http://creativecommons.org/licenses/by/4.0/).