Article

Roadmap for Decarbonization of the Building and Construction Industry—A Supply Chain Analysis Including Primary Production of Steel and Cement

1
Department of Space, Earth and Environment, Chalmers University of Technology, SE-412 96 Gothenburg, Sweden
2
Department of Economics, University of Gothenburg, SE-405 30 Gothenburg, Sweden
*
Author to whom correspondence should be addressed.
Energies 2020, 13(16), 4136; https://doi.org/10.3390/en13164136
Submission received: 2 July 2020 / Revised: 30 July 2020 / Accepted: 3 August 2020 / Published: 10 August 2020
(This article belongs to the Special Issue Enhancement of Industrial Energy Efficiency and Sustainability)

Abstract

:
Sweden has committed to reducing greenhouse gas (GHG) emissions to net-zero by 2045. Around 20% of Sweden’s annual CO2 emissions arise from manufacturing, transporting, and processing of construction materials for construction and refurbishment of buildings and infrastructure. In this study, material and energy flows for building and transport infrastructure construction is outlined, together with a roadmap detailing how the flows change depending on different technical and strategical choices. By matching short-term and long-term goals with specific technology solutions, these pathways make it possible to identify key decision points and potential synergies, competing goals, and lock-in effects. The results show that it is possible to reduce CO2 emissions associated with construction of buildings and transport infrastructure by 50% to 2030 applying already available measures, and reach close to zero emissions by 2045, while indicating that strategic choices with respect to process technologies and energy carriers may have different implications on energy use and CO2 emissions over time. The results also illustrate the importance of intensifying efforts to identify and manage both soft and hard barriers and the importance of simultaneously acting now by implementing available measures (e.g., material efficiency and material/fuel substitution measures), while actively planning for long-term measures (low-CO2 steel or cement).

1. Introduction

Sweden has committed to reducing greenhouse gas (GHG) emissions to net-zero by 2045 and to pursue negative emissions thereafter, in line with its obligations to the Paris agreement [1,2]. It is clear that the future development over several decades of the economic, social, and technical dynamics that govern demand for energy and materials, and the associated greenhouse gas emissions, are likely to be speculative. Nevertheless, as there is an urgent need to start a transformation towards deep decarbonization, decisions must be made now as to how to best manage the transition, while taking the future into account [3]. This includes starting with the current situation to map mitigation measures to see which measures that can be applied already at present and those which will require longer lead times to be implemented.
Seeing that the energy and climate performance of the user phase of the built environment in Sweden keeps improving, the climate impact of the construction process has increasingly come in to focus [4]. Emissions arising from manufacturing, transporting, and processing of construction materials to buildings and infrastructure account for approximately one-fifth of Sweden’s annual CO2 emissions [5,6,7]. However, current estimates of the climate impact from building and construction processes in Sweden is associated with a significant degree of uncertainty. Environmentally extended input-output data has provided estimates for the year 2015. These determine territorial emissions associated with building construction to be 6.6 Mt CO2e, increasing to 11.6 Mt CO2e when including imports [7,8]. Territorial emissions linked transport infrastructure construction is similarly estimated at 1.5 Mt CO2e increasing to 1.9 Mt CO2e including imports [7,9]. The imported emissions are associated with greater uncertainty as they are estimated by calculating differences in emissions from trading partners compared to emissions in Sweden, giving the limitation of not capturing differences between different industries in the importing countries [10]. On the other hand, a process-based bottom-up life cycle analysis (LCA) approach, combining statistics detailing new net area from newbuilds and refurbishments with LCA data per building type, provides a lower estimate of 5.4 Mt CO2e emissions associated with building construction in 2015 [8,11].
Indeed, as demonstrated in literature, there is evidence that life-cycle assessments based on process data and environmental extended input–output (EEIO) tend to lead to very different results, where EEIO LCAs often lead to higher emissions and process LCAs to lower emissions [12]. There are several reasons for these discrepancies, with EEIO LCAs suffering from inherent homogeneity and linearity assumptions, along with aggregation errors due to several different industries being comprised into one input-output sector [12,13]. The combination multiple economic subsectors with quite different emissions profiles into one sector, along with the assumption that the market price linearly correlates with higher emissions results in systematic overestimations [14]. On the other hand, process LCA suffers from an inherent ‘truncation error’ due to indirect impacts (e.g., capital goods) or excluding upstream processes along the supply chain due to the need for a system boundary leading to systemic underestimation [14,15,16]. Comparative building case studies demonstrate 20–73% higher embodied carbon emissions for EEIO LCA versus process LCAs [12,17,18,19].
In view of the differences in the LCA approaches, several studies regard EEIO methods most useful in assessments of entire economies or industries [13,20,21]. We conclude that, to enable analysis into the ongoing development in the construction sector and the opportunities for the sector to contribute to the national climate targets, better estimates are needed, including the main components making up those emissions, from different materials to transport of those materials and construction processes.
The focus of this study was on the path towards net-zero emissions in 2045, which necessitates not only looking at current emissions and the components therein but also require comprehensive assessments into current, as well as prospective future, abatement options and potentials. In literature, one can find an array of sector-specific or industry level studies focused on future carbon abatement options (see, e.g., Reference [22,23,24,25,26]) for steel, Reference [27,28,29] for cement/concrete, and Reference [30,31,32,33] for heavy transport and construction equipment). A comprehensive review of 40 energy-intensive industry roadmaps was recently performed by Gerres et al. [34]. This review remarked that roadmaps with a focus on subsector specific technology assessments often disregard the cross-sectorial dimensions of the abatement options considered, while top-down approaches tend to provide limited details on technological and economic feasibility. Gerres et al. found little consensus on how deep decarbonizations of industry are to be achieved but could identify a few key areas of importance and agreement, including alternative feedstock and carbon capture in the cement industry, carbon neutral steelmaking, and decarbonization of low temperature heat in the petrochemical industry. The authors finally noted that carbon capture, transport and storage (CCS), the electricity system, and the hydrogen economy, i.e., external system transformations, must be considered when evaluating decarbonization pathways.
In addition to sector-specific abatement studies, we have found recent evidence, particularly in grey literature of synthesis reports, reports which integrate the perspectives from different industries [35,36,37,38,39,40,41]. The target of these reports is predominantly either a European or a global level, emphasizing the cross-sectorial potential of reducing demand for products and services via circular economy, logistic optimization, and material efficiency measures while highlighting the potential and alternatives contributed by biomass, carbon capture, and electrification, including links to hydrogen.
Thus, we see that roadmaps detailing industry decarbonization on a sector by sector or multinational level are prevalent. However, focusing in on the building and construction sector, there are limited examples in literature of national assessments of future abatement options and potentials and the pathway towards close to zero emissions [42,43], with most studies pertinent to the UK [44,45,46,47].
In Sweden, within the government-initiated Fossil Free Sweden (http://fossilfritt-sverige.se/in-english/) initiative, business industries have drawn up roadmaps towards 2045, describing in varying details technological solutions, investment needs, and obstacles required to be removed. These provide some key information on abatement options within individual industry sectors with the construction sector roadmap capturing a cross-sectorial perspective [48,49]. Some initial assessments have also been made on emissions reductions and energy needs on a cumulative level for the year 2045 [50,51]. However, to explore critical factors on the pathway towards 2045, including impacts from upscaling and the risk of lock-in effects, there is a need for studies that take a broader perspective while combining a short and long-term perspective of abatement potential across the supply chain.
In this study, we used material and energy flow analysis combined with an extensive literature review to assess (i) the current status of emissions from the Swedish construction sector and (ii) the extent to which abatement technologies across the construction supply chain could reduce the GHG emissions if combined to its full potential based on implementation timelines linked to their technical maturity and expected readiness for implementation. The ambition was to analyze the current and future GHG emissions reduction potential by considering the development, over time, of emission abatement measures in different parts of the construction supply chain.
With support of scenarios, we created a roadmap exploring different future trajectories of technological developments in the supply chains for buildings and transportation infrastructure. By matching short-term and long-term goals with specific technology solutions, the roadmap made it possible to identify key decision points and potential synergies, competing goals, and lock-in effects. While the study is performed in a Swedish setting, and the updated estimate of current emissions are predominantly based on northern European LCAs, the analysis of abatement options, timelines, and pathways are relevant and applicable on a European, if not a global level.

2. Materials and Methods

This work combines quantitative analytical methods, i.e., scenarios and stylized models, with a participatory process involving relevant stakeholders in the assessment process. The participatory process served to identify the main abatement options but also to adjust decisions and assumptions regarding abatement portfolios and timelines to make these as realistic and feasible as possible. Stakeholders have thus provided input and feedback via workshops undertaken during the study development period. Stakeholders include industry representatives and experts along the supply chain: material suppliers, contractors, consultants, clients, and governmental agencies.
Estimates are provided of the magnitude of current and future GHG emissions reduction potential across the building and transport infrastructure construction supply chain by (i) estimating the current emissions, material, and energy flows associated with the sector; (ii) identifying possible GHG abatement options relevant to the construction works and their estimated abatement potentials; (iii) using (i) and (ii) to assess the impact of combining abatement measures along the construction supply chain; and (iv) crafting scenarios to highlight challenges and possibilities up to 2045 given different assumptions regarding future practices and technological development.
Current emissions from the Swedish building and construction industry is analyzed by comparing existing estimates with a mapping of the material and energy flow through the supply chain of building and transport infrastructure construction produced via a literature review of life cycle analyses and equivalent studies (where literature searches were conducted in Scopus and Web of Science with search string algorithms targeting a combination of LCA OR “life cycle analysis” OR “life cycle assessment” OR “carbon footprint” AND building* OR construction OR infrastructure with subsequent screening to identify studies of relevance for the scope of this study, e.g., transport infrastructure and buildings of equivalent design and construction techniques, as in Sweden.). In the technology roadmap of this work, we analyze the climate impact linked to construction of buildings and transport infrastructure, i.e., we do not include construction of for example utilities, such as waterworks, wastewater treatment plants, power plants, and power lines. Construction of buildings and transport infrastructure is equivalent to around 80% of construction investments in Sweden [52]. Focus of the analysis is on emissions from materials production and the construction phases (i.e., corresponding to life cycle stage A1–A5 [43]). The latter includes emissions from mass and material transport and the construction process. A schematic of the mapping is shown in Figure 1.
The Swedish Transport Administration (STA) provides a breakdown of the emission share from various materials and activities regarding new construction of state-owned transport infrastructure. However, this is not a complete picture of transport infrastructure as around half of the transport infrastructure investments in Sweden are made by regional and local government [53]. More detailed analysis has been performed by [9], including both state, municipal, and privately-owned transport infrastructure. The analysis by Liljenström et al. describes the emissions share of material production and on-site activities (transports and construction processes) for both new construction and reinvestments (defined as larger projects intended to restore the infrastructure to its original state by replacing a construction component (for example, the bounded base layer and tunnel lining) with the same, or a similar, type of construction component.) for road and rail infrastructure, ports, and fairways and airports. In this study, we slightly refined the emissions shares given by Liljenström et al. based on additional data [52,54], while excluding airports due to the minor emissions associated with airport construction (0.03 kt CO2e [9]). We further used the total emissions for construction of transport infrastructure provided by the detailed bottom-up analysis performed by Liljenström et al. [9] and national environmentally extended input-output modeling [7], as these provide a coherent result of 1.9 Mt CO2e emissions for the year 2015.
As this coherence does not apply for building construction, an estimate for the national emissions associated with building construction was developed using data on the emissions share from different lifecycle stages and materials sourced from the literature review combined with validated emissions levels of different components. Where available, the literature review was concentrated to LCA studies in a Northern European setting as to account for equivalent design and construction techniques, along with requirements stemming from climatic conditions. While LCA studies of buildings are prevalent, studies that describe and separate material inputs, material transports, and construction processes are more limited, particularly regarding non-residential buildings and refurbishments (see, e.g., reviews in Reference [55,56,57]). As LCA studies are limited for refurbishments, no detailed breakdown for refurbishments has been developed here. We instead use an adjustment factor to reflect emissions from transports and specific materials considered dominant in refurbishments in the few studies available.
The share of emissions for specific materials for construction of different building types was calculated based on the estimates in literature for these building types and the estimated share of emissions per building type. The total share of emissions for different material/activities for building construction were subsequently calculated using estimates for different life cycle stages for the various building types.
The compilation of material, energy, and emissions flow serves as the baseline when applying identified abatement potentials from the abatement options review. The inventory of GHG abatement options (described in detail in Section 2.2) is established by means of a comprehensive literature review, including industry and governmental agency reports (grey literature), together with input from supply chain stakeholders. (Literature searches were conducted via a combination of academic bibliometric databases (Scopus and Web of Science) and web browser searches was used to enable the sourcing of the relevant grey literature, which is not as evident in academic bibliometric databases. Search string algorithms targeted a combination of the material/activity in question together with “carbon emissions” OR CO2 OR GHG OR “greenhouse gas emissions” AND abatement OR “emission* reduction” OR mitigation OR decarbonization.), The main types of abatement options considered in the assessment are material efficiency and optimization measures together with shifts in: material production processes, transport vehicles and construction equipment technologies, and fuel substitutions in both equipment and production plants. The options include certain reuse and recycling measures resulting in emissions reductions, but not for the specific purpose of resource conservation. The inventory comprises both current best available technology and technologies assumed to be available over time to 2045.
A timeline is applied to test the potential implications to the climate impact when constructing the same assets while applying a combination of GHG abatement measures along the supply chain appraised to have reached commercial maturity at different points in time (over 5-year time periods until 2045). From this inventory, portfolios of abatement measures for the respective supply chain activities are constructed with selections of measures applied on a timeline up to the year 2045. The abatement measures are combined in pathways according to strategic choices [58], namely access to biofuels and renewable electricity, as well as enactment of material efficiency measures (as described in detail in Section 2.3).
The analysis assumes emission factors for electricity and district heating declining in accordance with scenario analysis from the Swedish Energy Agency, implying that GHG emissions related to electricity generation are close to zero in 2045 [59].

2.1. Pathway Generation and Quantification Approach

Total emissions from buildings and infrastructure construction in each time period t is calculated as:
E t o t , t = E b , t + E t i , t ,
where E b , t is the emissions resulting from building construction, and E t i , t is the emissions resulting from transport infrastructure construction. The analysis includes emissions from materials production and the construction phase (i.e., corresponding to life cycle stage A1–A5 according to EN 15978 [60]), with the latter comprising emissions from mass and material transport, and the construction process (A4 and A5, respectively).

2.1.1. Emissions from Transport Infrastructure Construction

The transport infrastructure construction emissions, Eti,t, are calculated as the sum of emissions from the material production stage and the construction activities as:
E t i , t = m ( E t i , m , t ) + t c ( E t i , t c , t ) ,
where E t i , m , t is the emissions associated with material production of material m in timestep t; and E t i , t c , t is the emissions for construction activities tc in timestep t. Construction activities tc comprise mass and material transport and the construction process. Five material categories (m) are included in the analysis: concrete, reinforcement steel, construction steel, asphalt, and others.
The share of emissions from transport infrastructure construction coming from materials production and the construction process activities, respectively, in the base year, year 2015, is based on data from the Swedish Road Administration [53,61] and Liljenström et al. [9]. The emissions E t c , 2015 from the construction activities, tc, in the base year, year 2015, is calculated as:
E t i , t c , 2015 = E t i , 2015 i , c , t c ( e i , c e i , c , t c ) ,
where E t i , 2015 is the total emissions from transport infrastructure construction in 2015; e i , c is the share of emissions from transport infrastructure type i (i.e., road, railway, ports, and fairways) and construction type c (i.e., new construction and reinvestment); e i , c , t c is the share of emissions from transport infrastructure type i, construction type c and construction activities tc.
Correspondingly, emissions from material production are calculated as:
E m , 2015 = E t i , 2015 i , c , m ( e i , c e i , c , m ) ,
where E m , 2015 is the emissions from material production in 2015 for the specific material m; E t i , 2015 is the total emissions from transport infrastructure construction in 2015; e i , c is the share of emissions from transport infrastructure type i and construction type c; e i , c , m is the share of emissions from transport infrastructure type i, construction type c and material m.

2.1.2. Emissions from Building Construction

The building construction emissions are also calculated as the sum of emissions from the material production stage and the construction activities:
E b , t = m ( E b , m , t ) + t c ( E b , t c , t ) ,
where E b , m , t is the emissions associated with material production of material m in timestep t; and E b , t c , t is the emissions for construction activities tc in timestep t. The analysis covers seven material categories, m, including: concrete, reinforcement steel, construction steel, insulation, gypsum and plaster, plastics and paint, and others (glass, aluminium, and wood).
For the base year of 2015, validated emissions for construction equipment (as per data from the national EEIO data reported in [7]) was used to extrapolate total building construction emissions:
E b , 2015 = E c p , 2015 e c p ,
where E b , 2015 is the total annual emissions associated with building construction and refurbishment in 2015; E c p , 2015 is the emissions estimate for construction equipment in 2015 according to the national EEIO data; and e c p is the emissions share estimated for construction processes.
The construction equipment data from the national EEIO data is considered reliable as construction equipment contribute to domestic emissions only and is used in construction and refurbishments (and not in operation of buildings). Once the total emissions estimate is produced, it is validated by means of comparing the resulting emissions for specific materials with available data to confirm its feasibility.
The share of emissions for the construction processes, material transports and material production were calculated using estimates for different life cycle stages for various building types
e l c = i = 0 n ( e i e l c , i ) ,
where e l c is the emissions share associated with the different life cycle stages lc (equivalent to A1–A3 for material production, A4 for material transport, and A5 for the construction process according to the European standard for “Sustainability of construction works - Assessment of environmental performance of buildings” (EN 15978)); e i is the emission share for building type i; and e l c , i is the emissions share for life cycle stage lc and building type i. The analysis covers three building types, i, including: multi-family dwellings, single-family dwellings, and non-residential buildings.
The share of emissions for different materials for construction of different building types were calculated based on the estimates in literature for these building types and the estimated share of emissions per building type. Where available and most applicable (i.e., for multi-family dwellings), the building type was also divided into building typology and frame type, namely concrete frame and wood frame. The emissions share e m associated with material production of the material m is thus calculated as:
e m = i = 0 n ( e i e m , i ) ,
where e i is the emission share for building type i; and e m , i is the emissions share for material m and building type i.
The initial estimated shares for both life cycle stages and materials were subsequently amended based on validated data for certain components in combination with adjustments for materials commonly used in refurbishments.

2.1.3. Material and Energy Demand

Emissions and energy intensity factors for materials, activities, and fuels were combined with the emissions figures to estimate material and energy demand. The emission intensity factors for materials, activities, and fuels, along with data for associated quantity and source of energy used for material production, were sourced in a literature review. Table 1 lists the details for the reference energy carriers, materials or material combinations used in the calculation of material and energy demand for the construction of buildings and transport infrastructure in the year 2015. Details on specific materials, material production processes, and energy sources can be found in Table A1 and Table A2 in Appendix A.
The specific emission intensity figures were combined with emission shares to calculate the resulting material and energy demand. Accordingly, the material demand M m for each material m for the base year of 2015 is calculated as:
M m = ( E b , 2015 + E t i , 2015   ) e m E f m ,
where E b , 2015 is the total annual emissions associated with building construction and refurbishment; E t i , 2015 is the total annual emissions associated with construction of transport infrastructure; e m is the emissions share associated with material m; and E f m is the emission intensity factor associated with material production of the material m.
The energy demand for material transports and construction processes for the base year, year 2015, is calculated as:
Q t c = s ( E b , 2015 + E t i , 2015 ) e t c , s E f s ,
where Q t c is the energy demand for construction activities tc; e t c , s is the emissions share associated with energy source s for construction activity tc; and E f s is the emission intensity factor for energy source s.
The total energy demand per energy source is calculated by using energy intensity factors combined with the energy mix data for production material processes and fuels used in transport and construction processes:
Q t o t , s = m ( M m Q f m q m , s ) + t c Q t c q t c , s
where Q t o t , s is the total energy demand associated with energy source s; M m is the material demand of each specific material m; Q f m is the energy intensity associated with the production of material m; q m , s is the share of energy in the material production of material m of the energy source s; Q t c , s is the energy demand for construction activity tc and energy source s; and q t c , s is the energy share in the reference fuel used for construction activity tc of the energy source s. Three energy sources are detailed in the analysis: fossil fuels (coal, gas, oil, and fossil waste), biofuels, and electricity.

2.1.4. Pathway Generation

Pathways are subsequently created were portfolios of abatement measures for the respective supply chain activities are constructed with selections of measures applied on a timeline up to year 2045. In the pathway analysis, the production levels of each material in each time step was estimated based on the remaining material demand after implementation of abatement options affecting demand of each material:
M m , t = ( 1 A r e , m , t ) ( 1 A m s , m , t ) ( 1 A m e , m , t ) M m ,
where M m , t is the material demand of material m in time step t; A is the total material demand reduction of material m in time step t associated with each of the following abatement measures: re- recycling, ms–material substitution, me–material efficiency measures; and M m is the original material demand of each specific material m in the base year of 2015. An illustration of how this generic calculation is performed for concrete demand (and resulting demand for cement and Supplementary Cementitious Material, SCM) is illustrated in Figure 2.
In the pathway analysis, the emissions and energy demand associated with material production, material transports and construction processes were adjusted based on the abatement options selected and applied in the assessment for each supply chain activity, as described in Section 2.3. The energy intensity factors, and energy mixes, were adjusted based on abatement measures, including energy efficiency and hybridization, biofuel substitution, and electrification. The energy demand for Q c p , t construction process cp in timestep t is consequently calculated as:
Q c p , t = ( 1 A o p , c p , t ) ( 1 A e e , c p , t ) Q c p ,
where A is the total energy demand reduction for construction processes in time step t associated with each of the following abatement measures: op–optimization and ee–energy efficiency (including from hybridization and electrification); Q c p is the energy demand for construction processes in the base year of 2015.
The energy demand Q m t , t for material transport mt in timestep t is, consequently, calculated as:
Q m t , t = ( 1 A m ¯ e , m t , t ) ( 1 A o p , m t , t ) ( 1 A e e , m t , t ) Q c p ,
where A is the total energy demand reduction for construction processes in time step t associated with each of the following abatement measures: me–average of material efficiency measures for main materials (concrete, steel, asphalt), op–optimization and ee–energy efficiency (including from hybridization and electrification); Q m t is the energy demand for material transports in the base year of 2015.
The energy demand per energy source in each time steps is consequently calculated as:
Q t o t , t , s = m ( M m , t Q f m , t q m , t , s ) + t c Q t c , t q t c , t , s ,
where Q t o t , s , t is the total energy use of energy source s in timestep t; M m , t is the material demand of material m in timestep t; Q f m , t is the energy intensity factor for production of material m in timestep t; q m , s , t is the share of energy source s for the production of material m in timesteps t; Q t c is the energy demand for construction stage tc; q t c , t , s is the energy share for construction processes and material transports in timestep t for energy source s.
For material production, emissions from direct energy use, together with process emissions, were also adjusted based on the level of carbon capture applied. The resulting emissions for each material m are calculated as:
E m , t = M m , t ( ( E f p r , m + Q f m , t s ( q m , s , t E f s ) ) ( 1 C C m , t ) + Q f m , t q m , e l , t E f e l , t ) ,
where E m , t is the emissions resulting from the production of material m in timestep t; M m , t is the material demand of material m in timestep t; E f p r , m is the process emissions intensity factor to produce material m; Q f m , t is the energy intensity factor for production of material m in timestep t; q m , s , t is the share of direct energy sources s for the production of material m in timesteps t; E f s is the emissions intensity factor of direct energy source s; C C m , t is the share of direct and process emissions captured via carbon capture technologies in the production of material m in timesteps t; q m , e l , t is the share of energy use from electricity in the production of material m in timestep t; E f e l , t is the emissions intensity factor of electricity in timestep t. Illustrations of how the generic calculation of materials emissions is performed for cement and primary steel production is displayed in Figure 3 and Figure 4. The abatement options considered and applied are described in Section 2.2.1 and Section 2.2.2, respectively. Below, an example calculation is made for construction steel in Pathway 1 for the year 2040, where 30% of the coal use is substituted for biofuel and 30% of the thermal emissions are captured:
E c o n s t r u c t i o n   s t e e l , 2040 ( ktCO 2 e ) =
414   ( kt ) ( ( 0 + 6.4 ( GWh kt ) ( 0.34 ( % ) 0.37 ( k t C O 2 e G W h ) + 0.02 ( % ) 0.228 ( k t C O 2 e G W h ) + 0.17 ( % ) 0.248 ( k t C O 2 e G W h ) ) ( 1 0.30 ) + 6.4 ( GWh kt ) 0.17 ( % ) 0.115 ( k t C O 2 e G W h ) ) = 372   k t C O 2 e ,
where the energy intensity factor and energy source shares are taken from Table 1 with the coal share reduced by 30%, and the emissions intensity factors are taken from Table A2 in Appendix A for the thermal energy sources and Table A3 in Appendix A for electricity.
For material transport and construction process, construction activities tc, the emissions in each timestep t is calculated as:
E t c , t = Q t c , t s ( q t c , s , t E f s , t ) ,
where E t c , t is the emissions for construction stage tc in time step t, Q t c , t is the energy for lifecycle stage tc in timestep t; q t c , s , t is the energy share for construction stage tc of energy source s in timestep t; E f s , t is the emissions factor for energy source s in timestep t.

2.2. Abatement Options

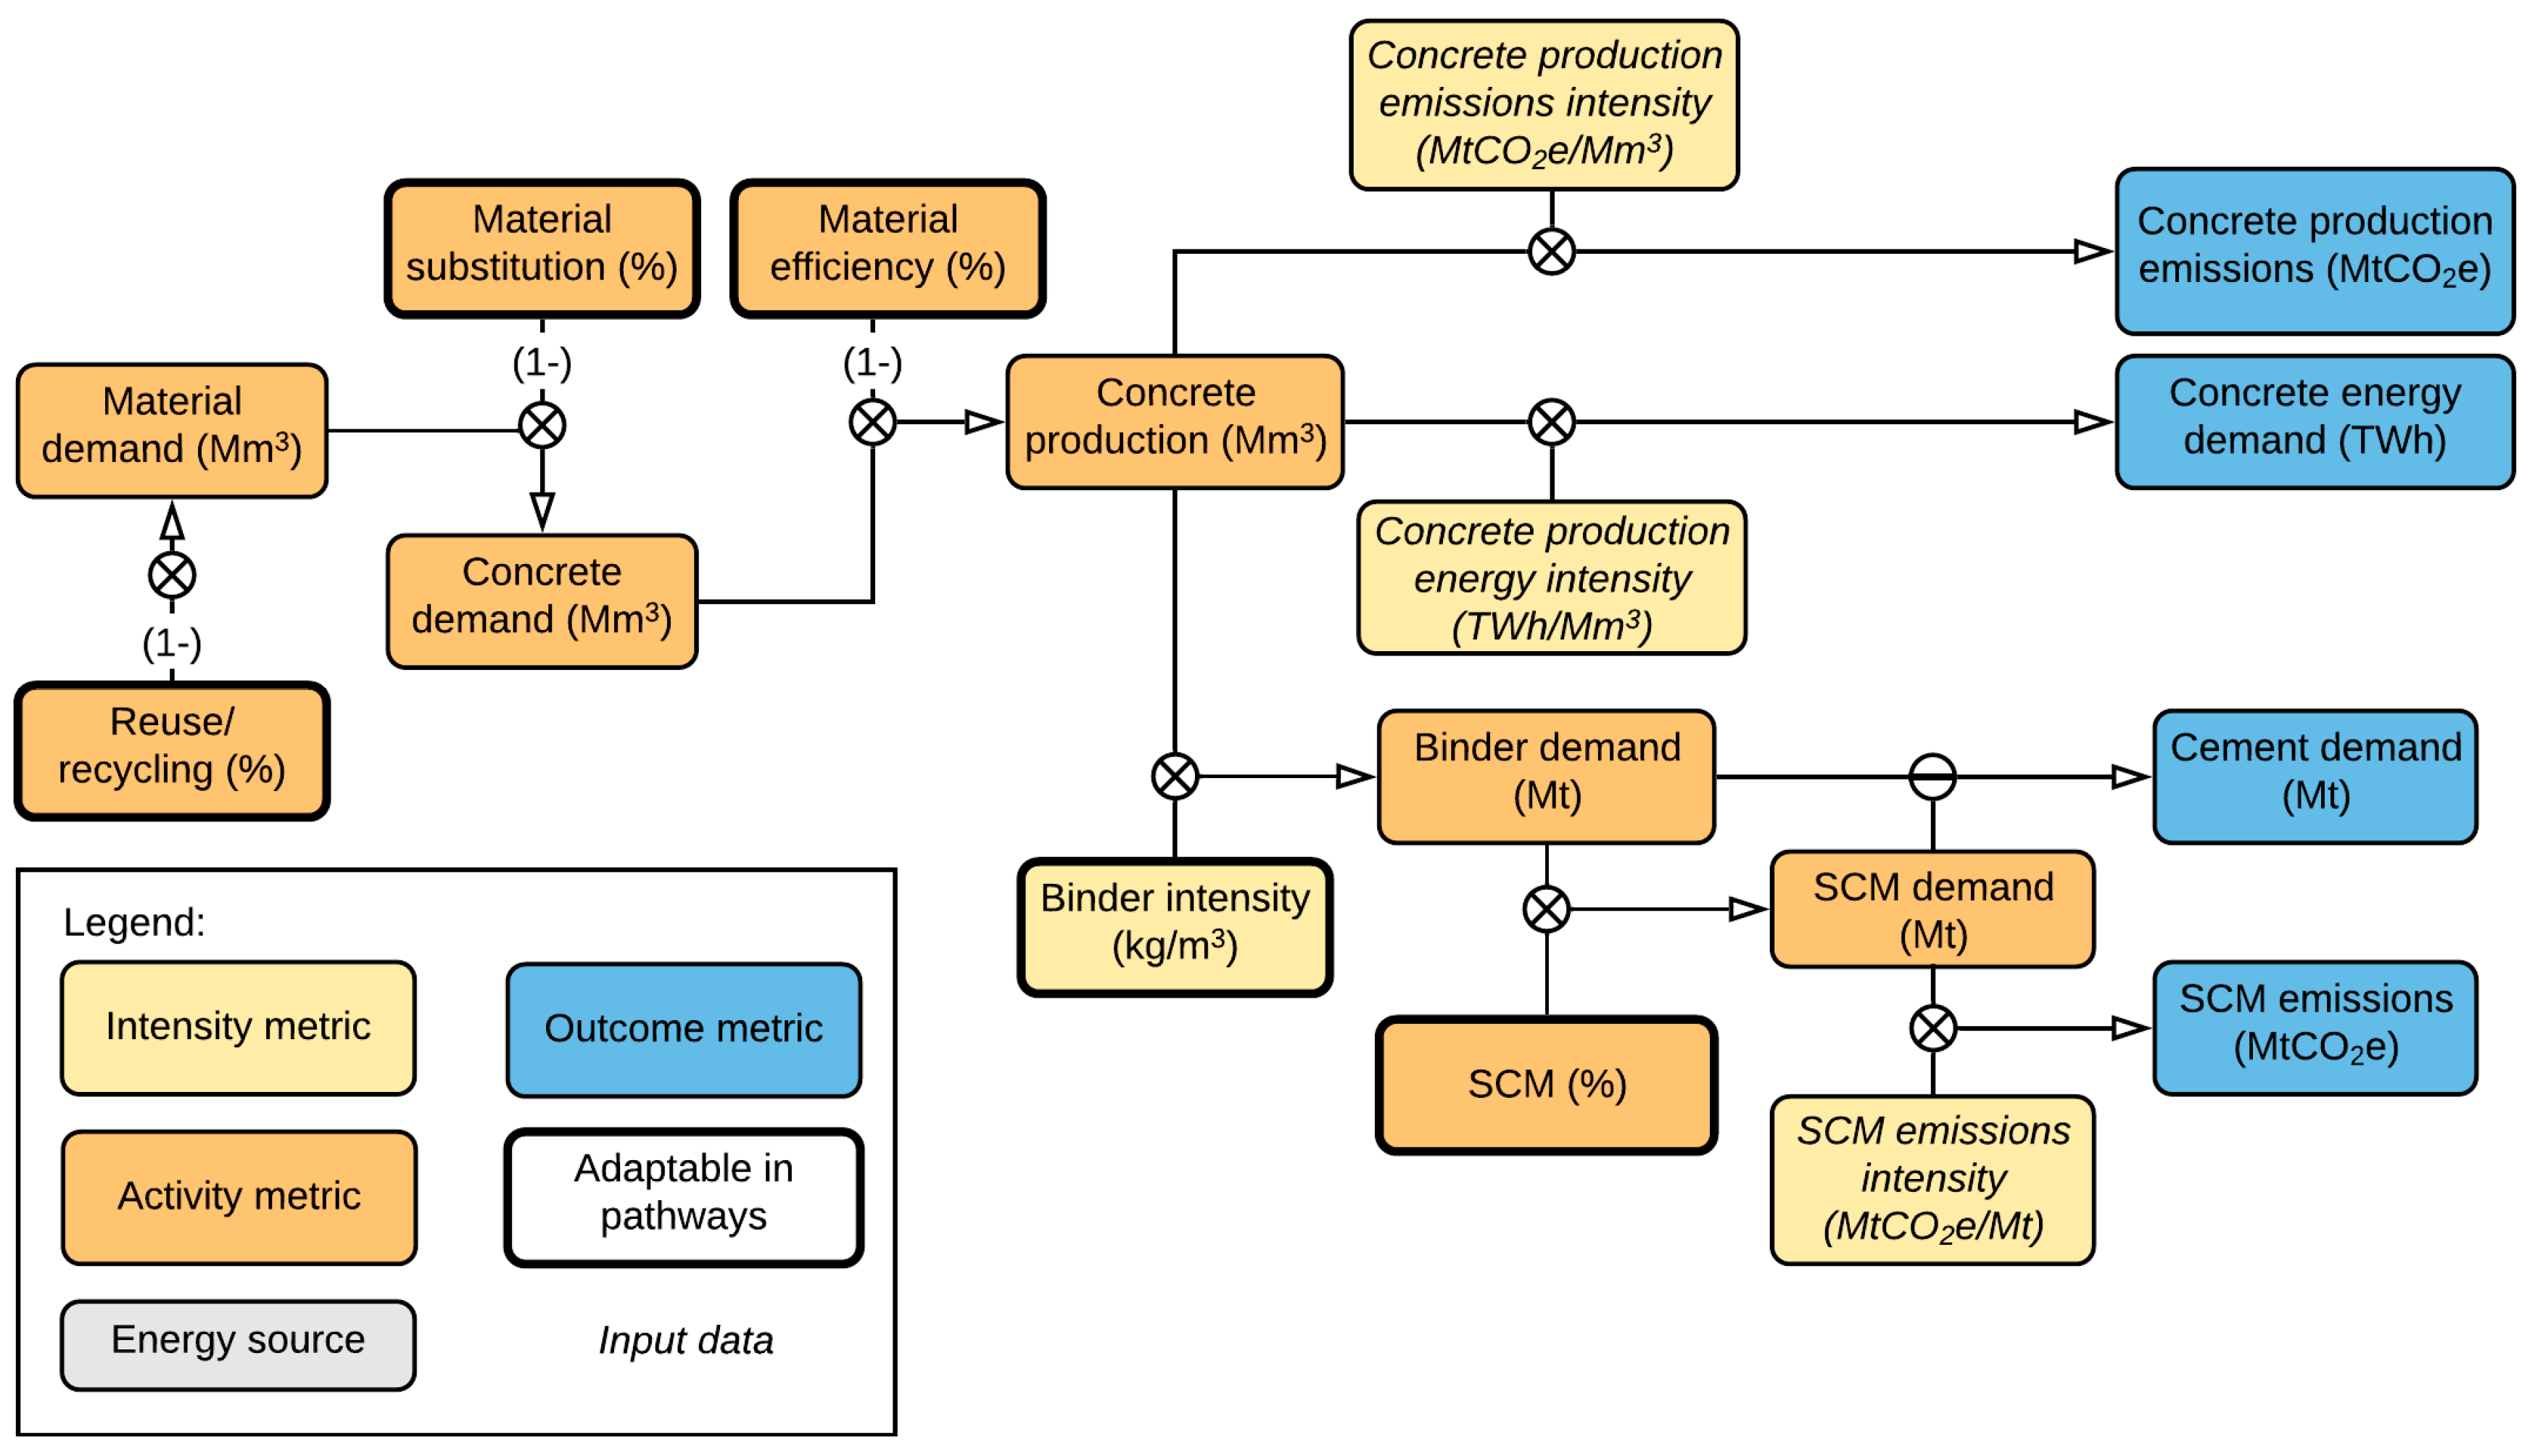
2.2.1. Cement/Concrete

The cement clinker production is responsible for the majority of GHG emissions related to concrete use with around 65% of the CO2 emissions stemming from the calcination process and 35% emanating from the fuels used in the cement ovens, the so-called kilns. The main current emission abatement options comprise of replacing fuels in the cement kilns with waste- or bio-based fuels, reducing the amount of cement clinker by using Supplementary Cementitious Material (SCMs or so-called alternative binders), and optimizing the concrete recipes to use less cement [27,29,96,97]. Sweden is a frontrunner when it comes to alternative fuels [51] but is behind the rest of Europe in using alternative binders with a clinker share of 86% [98] compared to the European average of 73% [29]. In addition, the average cement/binder content used in concrete is higher in Sweden than in other countries, with around 420 kg binder per m3 concrete compared to an average 400 kg binder per m3 concrete in Europe overall [7,99,100]. It is worth noting that high levels of SCMs require process adjustments due to additional hardening times prolonging project timelines, while optimized concrete recipes impact site practices as multiple specific concrete mixes require further logistics and on-site coordination.
Other prominent abatement options include design optimization to slim constructions, increased prefabrication to reduce waste and minimized construction process emissions, and material substitutions towards wood-based solutions [37]. For building construction, the development of engineered wood products has increased the opportunities for building multi-floor building with a structural core of timber.
Indeed, engineered wood products have recently experienced annual growth rates between 2.5% and 15% [101], with a range of studies showing that buildings with wooden structures have a lower carbon footprint than buildings with other types of structures (see reviews in, e.g., Reference [57,102,103,104,105]).
However, even if current abatement options are combined to its full potential, transformative technologies are still required to reach the goal of close to or net zero emissions in the cement industry by 2045 [54]. Carbon capture technologies (CCS) with or without electrification of the cement kilns are key deep decarbonization alternatives. The Swedish cement industry roadmap is targeting climate neutrality by 2030, with the main focus being on biofuels together with CCS [98]. However, Cementa is also pursuing electrification together with Vattenfall through its CemZero project, with a pre-feasibility study released in 2018 [106].

2.2.2. Steel

Construction steel, often galvanized, is predominantly produced by primary steel, i.e., from iron ore in integrated steel plants, while reinforcement steel is mainly produced by scrap steel in secondary steelmaking plants, called electric arc furnaces (EAF), although depending on the availability of scrap steel, this varies globally [107]. Predominant current abatement options to reduce embodied emissions associated with steel are enhanced material efficiency and circularity measures [9,15,58,108]. The main opportunities lie in reducing waste during the construction process; reduce the amount of material in each building by avoiding over-specification and using higher-strength materials; and reusing buildings and building components [38,44,109]. With better sorting and separation, there is also a potential for increased scrap share for construction steel production [38,110].
Regarding the different production methods, EAFs mainly use electricity but also require fueling by natural gas (25–30%) and a smaller share of coal (<5%) [70,71,72,73]. With electricity as the main energy carrier, the emission intensity of the electricity used is an important factor [107,108]. Refurbishments and upgrades of current electric arc furnaces provide potential for decreased electricity consumption [70,111,112], and there is also potential for biomass to substitute fossil process energy in EAFs, both as a reducing agent and as fuel in reheating furnaces [70,73,113]. Fuel substitution from natural gas to bio-based syngas or biooil is similarly proposed in metallurgical processes [114].
For primary steel production, about 80% of the CO2 emissions stem from the reduction of iron ore [22,23,115]. The main options for deep emission reduction in primary steel production are electrification with renewable electricity (either via hydrogen direct reduction or through electrowinning) [22,26,71,90,115,116,117], use of biomass to replace coke as fuel and reducing agent [26,76,113,118,119,120,121,122], and/or use of carbon capture and storage (CCS) [22,26,40,117,123,124]. Partial CO2 capture is a mature and low-cost technology that can be implemented in the coming 10–15 years without major changes to the existing process and which can be combined with biomass substitution [123,125,126].

2.2.3. Other Materials

At present, polystyrene and mineral wool are the most frequently used for insulating buildings [127], with mineral wools in general having a lower carbon footprint, which is why material substitution together with recycling is a current abatement measure for insulation [74,104]. Other abatement measures include fuel change together with energy efficiency measures for production of both mineral wool and polystyrene insulation [37,128,129]. Steam cracking is responsible for a large share of the carbon footprint (~40%) of plastics production [37] (which is also a raw material in polystyrene insulation), which is why deep abatement options for plastics production include electrification or carbon capture in cracking and polymerization [37,90]. Other abatement measures for plastics include material efficiency measures and recycling either by mechanical or chemical means [38,41,47].
In the production of gypsum for plasterboards, the most prominent abatement measure is the use of recycled gypsum which can be combined with electrification or biofuel substitution in the heating furnaces used in the gypsum production [130].
Main abatement options for asphalt include biofuel substitution, lowered temperatures, and increased recycling rates [80,131,132].

2.2.4. Material Efficiency

Material efficiency is a key abatement measure for all construction materials, and a measure that generally deserves more attention in policy and climate mitigation discussions. Evidence (see, e.g., Reference [37,38,44,47,133]) suggests that, on average, one-third of all material use could be saved if designs were optimized for material use rather than for cost reduction, since downstream production (and design) are generally dominated by labor costs and not material costs. For example, it is easier to use constant cross-sections across a structure than to design each beam and column individually since this leads to more rapid construction.
In addition, motivations to use excess material are driven by an asymmetry costs of product failure compared with the costs of over-specification, by over-specified components copied across projects to minimize costly design time, by cheaper manufacture of standard parts, and by the fact that many products experience higher loads prior to use (in installation or transport) than in use [46].

2.2.5. Construction Equipment and Heavy Transports

High potential abatement measures for heavy vehicles and machinery in the short to medium term include biofuel substitution, energy efficiency measures, hybridization, and optimization of logistics and fleet management. Over the longer term, deeper emissions reductions would result from electrification of construction equipment, crushing plants and heavy trucks. For the latter, options include plug-in hybrid or fuel-celled heavy-duty trucks/haulers potentially in combination with electric road systems. Model shifts for heavy transport to rail and ship is also an abatement measure with large potential. While such shifts are out of scope for this analysis, this is an important level towards a more transport-efficient society [134].

2.2.6. Summary of Abatement Options

A summary of all abatement options and their identified emission reduction potential are described in Figure 5. The graph illustrates the range of GHG emissions reduction potential recognized in literature for each of the abatement options explored, where the range may depend on the level of the abatement measure that is adopted. Full details of measures for all activities, including timelines, potentials, and references, are available in the Supplementary Material.

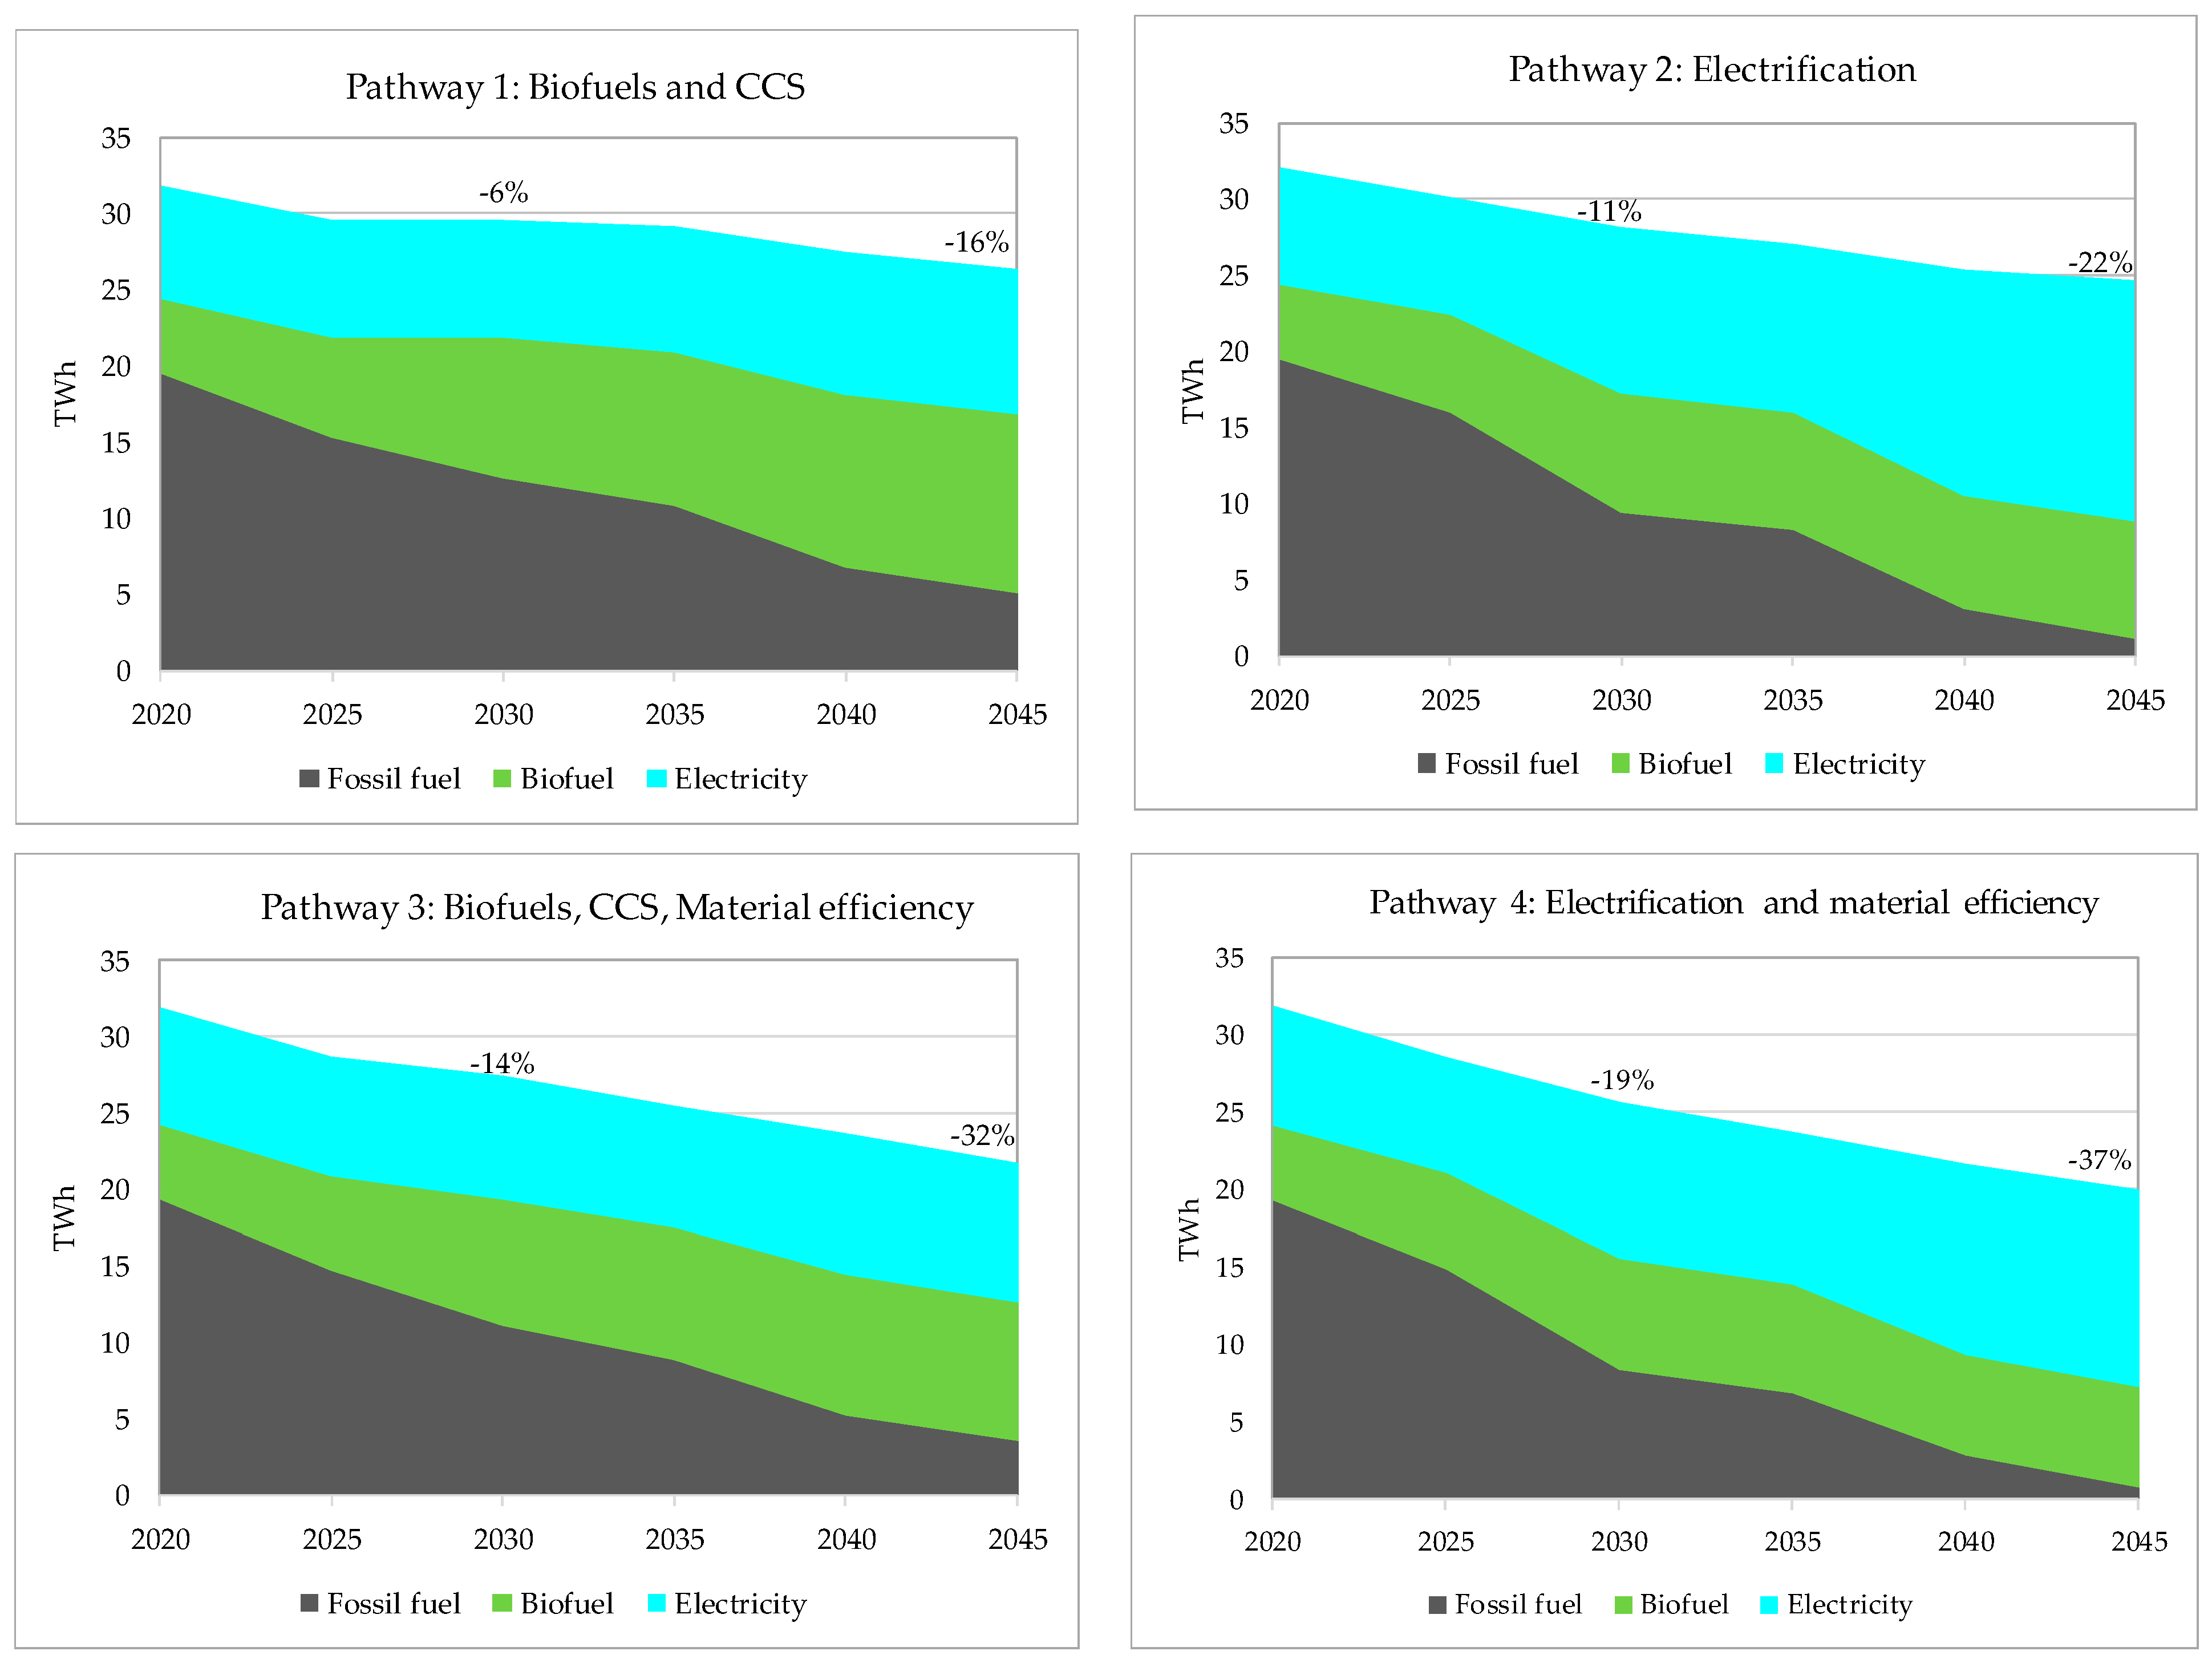
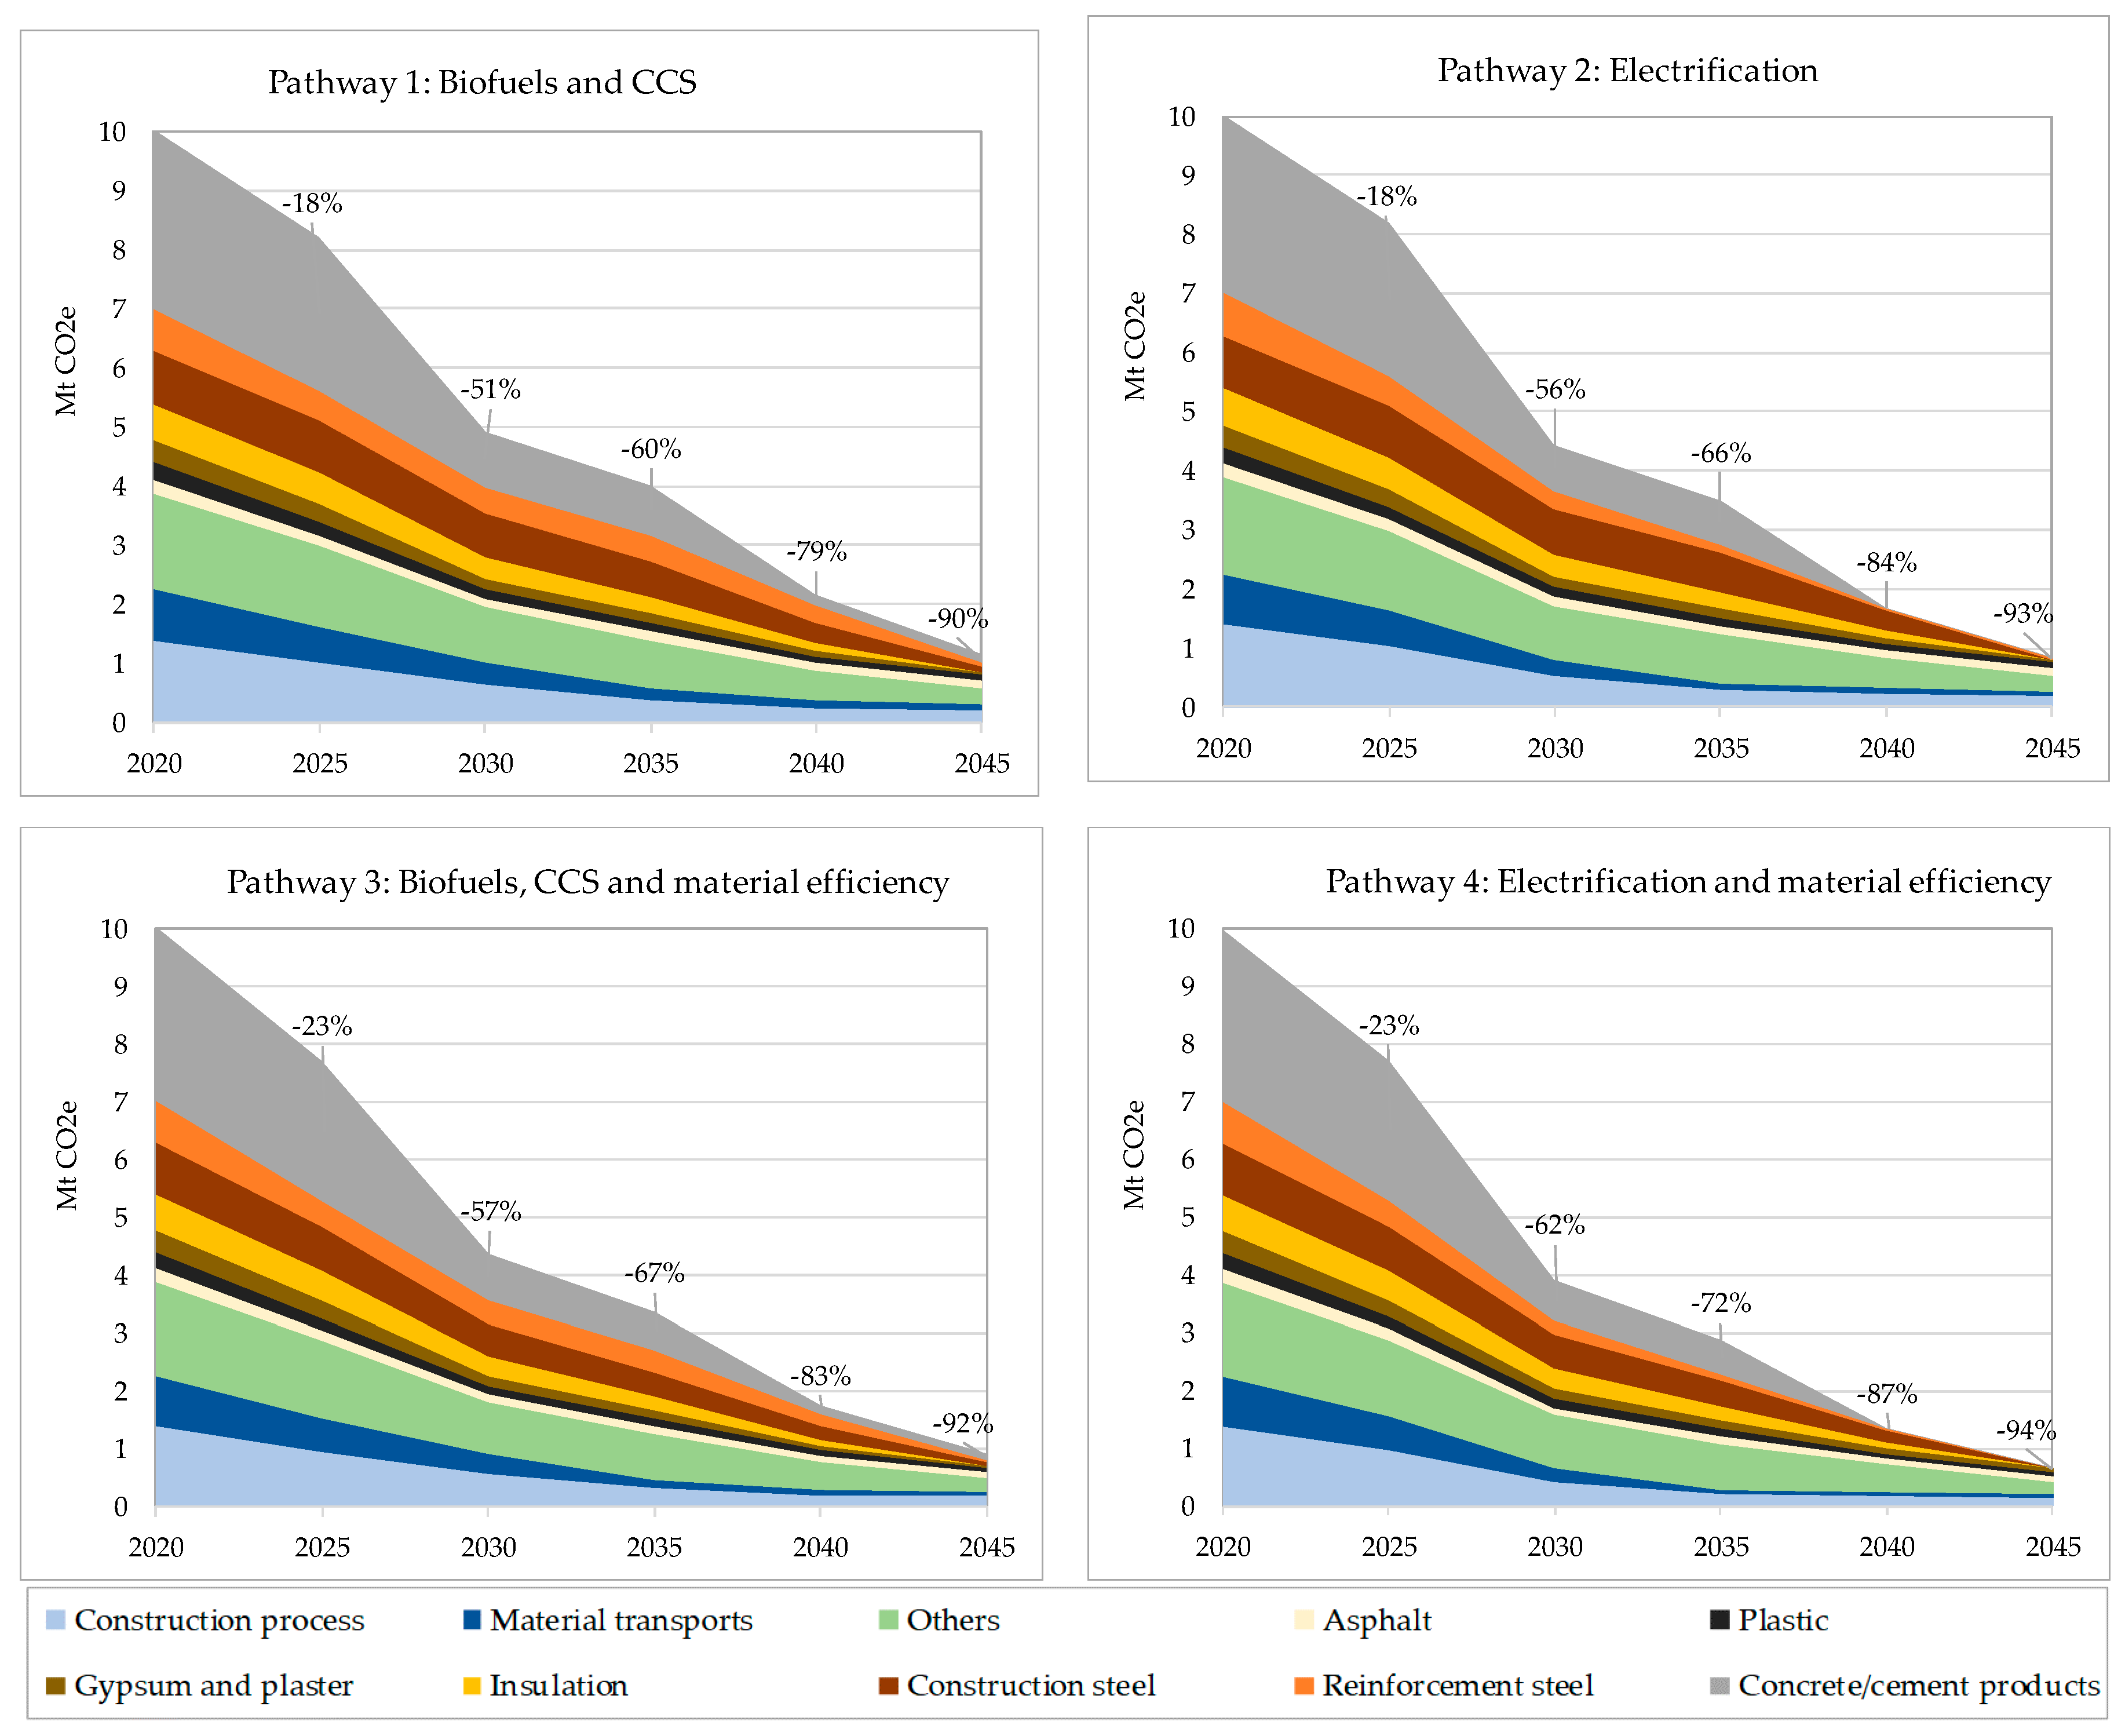
2.3. Alternative Pathways

Four pathways have been devised for buildings and transport infrastructure, describing different future trajectories of technological developments in the supply chains of buildings and transportation infrastructure in Sweden, two with a focus on bio-based measures together with CCS and two with a focus on electrification:
  • Pathway 1: Biofuels and CCS;
  • Pathway 2: Electrification;
  • Pathway 3: Biofuels, CCS and material efficiency; and
  • Pathway 4: Electrification and material efficiency.
The second of the two within each focus explores the role material efficiency measures may play in the low-carbon transition. Details of the emissions reduction measures applied over the timeline for the different pathway scenarios are displayed in Table 2.
For cement, the bio/CSS pathway adopts post-combustion carbon capture with amine scrubbing, which is the technology tested by HeidelbergCement in Breivik in Norway [135]. In all pathways, a progressive realization of cement clinker substitution and cement demand reduction from optimization of concrete recipes is assumed.
For primary steel production, the bio/CCS pathways adopt process modification enabling top gas recycling combined with carbon capture and storage, while the electrification pathways pursue a hydrogen direct reduction (H-DR/EAF) steelmaking process. Current electric arc furnaces for scrap-based secondary steel production are being refurbished and upgraded at a continuous rate in all pathways, alongside partial bioenergy substitution in the bio/CCS pathways.
Separate pathways have also been devised for construction equipment and heavy transports, while other materials follow a common decarbonization pathway (based on, e.g., Reference [37,41,74,83,108,130,136]).
The pathway portfolios are predominantly based around reaching the medium-high range of the emission reduction potentials for each selected abatement measure when fully implemented (as per Figure 5) with measures and timelines largely compatible with roadmaps and pathways developed within the EU Commission long term climate strategy (combination of electrification and hydrogen scenarios), along with relevant industry roadmaps developed within the Fossil Free Sweden project [48,137].

Sensitivity Analysis

The main assumption in the model is a constant construction demand up until 2045. However, this assumption is uncertain and different sources provide diverse interpretations of how the demand for building and transport infrastructure construction will develop. For example, the Swedish Energy Agency, in its long-term prognosis, predicts the energy use of the building construction sector to increase until 2020 due to extensive construction of new housing and to then fall back to previous lower levels after 2025 [138]. This would imply reductions of around 20% to 2030 and 30% to 2045 based on 2020 levels.
On the other hand, Boverket estimates that, by 2025, Sweden needs 600,000 new dwellings, implying a level of construction not anticipated in the prognosis of the Swedish Energy Agency [7,139]. Further, a great need for renewed transport infrastructure has been identified to enable the climate transition of the transport network to be realized while meeting increased transport demands, including the anticipated but heavily discussed construction of a highspeed railway network [140,141].
Consequently, a scenario analysis has been performed to test the implications of reductions/increases in construction demand of ±20% to 2030 and ± 30% to 2045.

3. Results

3.1. Current Emissions from Building and Infrastructure Construction

As described in the Introduction the range of current estimates of GHG emissions linked to the construction of buildings in Sweden is notable (8.5 MtCO2e based on a process-based bottom-up LCA approach, 8.1 MtCO2e for territorial emissions, and 13.5 MtCO2e including imports based on EEIO data) with potential variances including different system boundaries (e.g., agricultural properties not included in the bottom-up model) and possible overstating of the importance and emissions intensity of imports in the input-output analysis [7,8,11]. Further, a great majority of construction steel is imported [142], and, while the cement market is mostly domestic (85% of Swedish cement use) [143], the concrete market is turning more international, at least pertaining to precast elements [143,144,145].
To validate the estimates of the current GHG emissions, and to specify emissions components, further analysis into the existing estimates were combined with a literature review focused on relevant LCA studies detailing embodied emission sources for different construction types.

3.1.1. Estimate and Validation of Current Emissions from Building Construction

Around 2/3 of the construction emissions correspond to new buildings and 1/3 to refurbishments and maintenance. In addition, around 40–50% of the annual climate impact from building construction stem from construction of non-residential buildings, such as offices, schools, and other premises. A growing share of around 40–50% arise from multi-family dwellings and the remaining 10–15% from single family houses [7,52]. Multi-family buildings are predominantly constructed with concrete frames (85% in 2018), with smaller shares of timber frames (13%) and steel frames (2%) [146].
A detailed overview of the share of emissions components, and share of individual materials, related to new building construction for new builds of various building and frame types can be found in Table A4 and Table A5 in Appendix A. The total share and amount of emissions for different material/activities for building construction were calculated using estimates for different life cycle stages for various building/frame types from the literature review, with the initial estimates shown in Table 3.
Worth noting about these estimates is that ground preparation is often not included in LCA studies, which would increase the share of construction processes. On the other hand, the estimates do not include refurbishments, which would increase the share of material transports and certain materials.
The estimates can be compared to the approximate sector division for the building and real estate sector (territorial emissions including emissions associated with real estate management during building use) from the Swedish EEIO analysis. The sector division include 3.9 Mt CO2 from building materials (only domestically produced materials), 0.9 Mt CO2 from construction equipment, and 1.5 Mt CO2 from transports, while the share of the transport emissions estimate belonging to construction versus real estate management is not entirely clear [7]. The level of transport emissions nonetheless is significantly higher than the level and share of emissions allocated to transports resulting from the LCA studies in the literature review (~24% versus 5% or 0.4 Mt CO2), noting that the latter figure does not encompass refurbishments. Further, the process-based bottom-up approach estimates transport emissions from building construction of 0.9 Mt CO2 (17% of building construction emissions), while also including people transport in this estimate [8]. The initial emissions share and estimate for material transports is consequently adjusted upwards.
The initial and updated emissions estimates from materials are displayed in Table 4.
The sector division in the Swedish EEIO analysis further details an approximate 2.4 Mt CO2 from the mineral industry (predominantly cement) [7]. Regarding cement, emissions from Cementa were 2.5 Mt CO2 in 2015 [147], which corresponds to 85% of Swedish cement use [143]. In total, emissions from Swedish cement use were thus about 2.9 Mt CO2 in 2015. However, while the cement market is mostly domestic, the concrete market is turning more international, particularly pertaining to precast concrete. There is a lack of data and reporting to determine the extent of concrete imports, but an estimate can be made based on the import-export balance of concrete, cement and gypsum products of SEK 1.8 billion [143].
If these imports are considered to correspond to concrete elements and the concrete costs 60–70 EUR/ton (about SEK 600–700/ton) [148,149], this would correspond to concrete imports of 2.5–3 Mt per year, corresponding to emissions of about 0.4–0.5 Mt CO2, giving a total emissions estimate of 3.3 Mt CO2e from Swedish concrete use. With around 75% of concrete being used in building construction [150], the emissions from concrete use in building construction would correspond to around 2.5 Mt CO2. The emissions estimates of concrete and material production overall are adjusted accordingly in the model.
Additional upwards adjustments are based on literature detailing refurbishments which report the main embodied emissions resulting from insulation, windows and metals for new ventilation, and heating systems [55,151,152].

3.1.2. Estimate of Current Emissions from Building and Transport Infrastructure Construction

The total climate impact of building and transport infrastructure construction in Sweden is estimated to around 9.8 Mt CO2 per year, with building construction responsible for 80% and transport infrastructure for 20%. This can be compared with the national territorial GHG emissions of 51.8 MtCO2e in 2018 [6]. As can be seen in Figure 6, this carbon impact derives predominantly from concrete and steel together with diesel use in construction processes and material transports.

3.1.3. Validation of Building and Transport Infrastructure Construction Emissions Estimate

The total estimated emissions from buildings and transport infrastructure construction of 9.8 Mt CO2e is in the middle of the range of estimates of 8.1–13.5 Mt CO2e, as reported by Naturvårdsverket and Boverket [7,8].
Focusing in on concrete, the resulting concrete emissions estimate for building and transport infrastructure combined is 3.0 Mt CO2e, which corresponds well to the estimate of concrete use in Sweden discussed in the building construction Section 3.1.1 (considering the exclusion of utilities in this analysis).
Another validation can be made regarding steel use. A great majority of steel used in construction is imported [143]. Swedish steel imports were 3.2 Mt in 2015 [142,153] with research demonstrating that around 25–50% of steel consumption goes to the construction industry [154,155]. This would correspond to the use of 0.8–1.6 Mt steel in constructions, matching the model estimate of 1.4 Mt steel (based on the equivalent emissions intensities for reinforcement and construction steel).

3.2. Pathway Results

The main results from the pathway analysis, i.e., energy use per energy carriers and carbon emission reductions, for the construction of buildings and transport infrastructure up until 2045, are depicted in Figure 7 and Figure 8. The results show that it is possible to reduce CO2 emissions associated with construction of buildings and transport infrastructure by at least 50% to 2030 (51–62%), and reach close to zero emissions by 2045 (90–94%) with the electrification and material efficiency pathways demonstrating the highest reductions. The energy use is also reduced in all pathways albeit with more variance between the pathways (6–19% to 2030 and 16–37% to 2045). In addition, regarding energy use, it is the electrification and material efficiency pathway which demonstrates the highest reductions.
The analysis demonstrates that currently, construction of buildings and transport infrastructure use approximately 32 TWh energy, accounting for around 8% of total Swedish energy use [156]. All the pathways demonstrate a reduction in total energy use over time, with the reduction varying from 6–19% to 2030 and 16–37% to 2045.
When comparing the total energy use, the electrification pathways demonstrate a total energy use of around 6–8% lower than the biofuel pathways in by 2045. This is mainly a result of the lowered energy requirements from electric propulsion compared to combustion engines for construction equipment and heavy-duty trucks combined with the energy penalty for post-combustion carbon capture for cement production.
A focus on material efficiency has the potential to reduce total energy use by 8–10% to 2030 and 18–20% by 2045 for both the biofuel and electrification pathways (noting that the reduction potential would be even higher compared to a reference scenario).
Regarding biofuels, they are at current mainly used in the transport sector, and in asphalt, timber and cement production. Over time, the use is set to expand with the overall share of biofuels increasing from 15% of total energy use at current to around 30% in the electrification pathways and to 40% in the biofuel pathways by 2045. This would mean an increase from 5 TWh to 9 TWh, which can be compared with the current total bioenergy use of 89 TWh in 2017 [156].
Electricity use remain almost constant in the biofuel pathways, while increasing from 7 TWh up to 13–16 TWh in 2045, reaching a share of around 40% in the biofuel pathways and 65% in the electrification pathways.
As can be seen in Figure 8, all pathways reach close to zero emissions in 2045, with total emissions reduction of 90–94%, with the highest emission reduction potential in the electrification pathways. Up until 2030, we see potential emissions reductions of 51–56% for Pathways 1 and 2, indicating that the emissions reduction goal of 50% set by the Construction and Civil Engineering sector in in its own roadmap [49] could be met if the measures suggested in this roadmap would be implemented. Before 2030, most emissions reductions stem from increased use of alternative binders combined with reduced binder intensity in concrete (25%), as well as optimization and energy efficiency measures on the construction sites combined with biofuel substitution in construction equipment and material transports (36–40%). The biofuel substitution partly ensues as a result of the Swedish reduction duty regulation, which specifies increasing emissions reductions in line with a growing share of renewable content in diesel fuel [157]. The emission reduction up until 2030 is also supported by the use of reinforcement steel produced only from recycled steel combined with measures, such as improved electricity emissions factors together with material and fuel substitutions regarding insulation materials.
A focus on material efficiency provides for additional reductions, particularly in the medium term. An additional 12% brings the total emissions reductions down to around 56–62% by 2030, implying a difference of 0.5–0.6 Mt CO2 emissions per year.
After 2030, deeper emissions reductions come about as a result of continued biofuel substitution combined with hybridization and electrification for construction equipment and trucks (contributing to a large share of the emissions reductions in 2030–2035). Fuel substitution also plays a role in primary and secondary steelmaking in 2030–2035.
In the biofuel+CCS pathways, this fuel substitution is combined with CCS in primary steelmaking, as well as in cement kilns (contributing to around 40% of the emissions reductions in 2040–2045, respectively).
In the electrification pathways, plasma heating is instead used to create the necessary temperatures in secondary steelmaking, cement kilns, in cracking, and polymerization for plastic production, as well as mineral wool production (contributing to around 45% of the emissions reductions in 2040–2045 combined). Electrification in the primary steelmaking in the form of hydrogen reduction also contributes considerably in the electrification pathway (40% in 2045).
In view of the remaining carbon budget, up to 2045 the material efficiency pathways could reduce the total cumulative amount of CO2 emitted from construction of buildings and transport infrastructure over the years 2020 to 2045 by 10% compared to its corresponding biofuel/electrification pathways, equivalent to 10–11 MtCO2.

Sensitivity Analysis

The results from the sensitivity analysis into impacts on emissions and energy use from reduced/increased construction demand (denoted as low/high) are shown in Figure 9. The percentage values indicate the reduction from the reference level (cf. the pathway reduction results in Figure 7 and Figure 8).
The sensitivity analysis demonstrates that great variances are found in between scenarios of reduced or increased construction demand regarding total energy use. The main implications are seen with regards to an increased construction demand potentially leading to the energy demand remaining relatively stagnant (Pathway 2 and 3) or even growing by 13% to 2030 as in the biofuel+CCS pathway.
In this case, the biofuel demand increases to 11 TWh in 2030 and to 15 TWh in 2045 (compared to 4 TWh in 2015). For the electrification pathway, the electricity demand increases to 13 TWh in 2030 and 21 TWh in 2045 (compared to 8 TWh in 2015). In contrast, reduced construction demand combined with material efficiency measures could reduce to total energy demand by 41–56% implying a total energy demand of between 14–18 TWh in 2045.
Regarding emissions, the sensitivity analysis demonstrates that even with an increased construction demand, it will be possible to reduce CO2 emissions by at least 85% to 2045 compared to 2020 with the combination of measures proposed in this roadmap. However, it also demonstrates that the emissions reduction in the short and medium terms could be slowed down further and possibly impact the potential to reach the sector goal of 50% emissions reduction to 2030 [49]. On the other hand, a slowdown in construction rates could make emissions reductions of over 60% to 2030 possible.

4. Discussion

Cement and steel, together with diesel use in construction processes and material transports, account for the majority of the CO2 emissions associated with building and infrastructure construction (cf. Figure 6). While the analysis in the study has served to improve the current estimate of the climate impact of building and transport infrastructure construction, it is still associated with a degree of uncertainty. To provide well-grounded decision support for the climate transition ahead, it is important that sufficient resources and competence are allocated so that development of emissions can be properly evaluated and so that the effects of planned measures and policies can be assessed before implementation.
Based on the updated estimate, this roadmap served to illustrate how the basic materials industry and supply chains for buildings and transport infrastructure construction are affected, in terms of energy and material use and associated greenhouse gas emissions, by different technical choices. The study also aimed to illustrate the timing of measures needed to reach intermediary and long-term emission reduction targets. The results show that it is possible to reduce CO2 emissions associated with construction of buildings and transport infrastructure by at least 50% to 2030, applying already available measures, and reach around 90% emissions reductions by 2045, while the energy use may be reduced by varying degrees (6–19% to 2030 and 16–37% to 2045), indicating that strategic choices with respect to process technologies and energy carriers may have different implications particularly on the energy use over time. It is worth noting that no pathway reaches zero carbon emissions, which is why it is important to further investigate the potential for and accounting of negative emissions (e.g., carbon capture of biogenic emission) and carbon sinks (e.g., use of long-lived wood products in construction) as to enable an approach towards net-zero emissions by 2045. The measures proposed in this roadmap could (and perhaps should) also be backed by strategies to avoid building by exploring alternatives and by repurposing assets, as well as reduce the floor area per capita by smarter floor plans and increased shared spaces [38,43,158].
This study, in alignment with previous analysis, as reported in, e.g., Gerres et al. [34], demonstrates the importance of ensuring sufficient availability of sustainable biomass/bioenergy, electricity and hydrogen. The urgency in upscaling these energy sources becomes particularly evident as experience shows that planning, permitting, and construction of both support infrastructure (renewable energy supply, electricity grid expansion, hydrogen storage, CCS infrastructure) and piloting and upscaling to commercial scale of the actual production involve long lead times. Strategic planning for key support infrastructure therefore needs to be initiated as early as possible, even if not all uncertainties will be fully resolved.
As there are already today known measures and technologies which can reduce emissions to zero, from circularity and material efficiency measures, biofuel or biomaterial substitution, electrification (direct or indirect) with renewable electricity, and/or carbon capture and storage, the challenge to meet climate targets is not only a technological challenge but relative to economics and financial risk, particularly since the current climate policy is too weak [159]. Indeed, large scale demonstration of key processes is required to obtain confidence in technologies, gain experience, and reduce financial risk, but technologies are available at high maturity levels. This would also serve to reduce the uncertainties inherent in the span of emission reduction potential from different abatement measures found in literature (ref. Figure 5).
A key message from this work (as illustrated in Figure 10) is the importance of simultaneously focusing on short- and long-term abatement measure. With this statement, we that that the pursuit of ‘low-hanging fruits’ (e.g., material substitution and efficiency measures) cannot be an excuse for not acting to lay the foundation for the high-cost long lead-time measures (zero-CO2 basic materials) required to reach deep decarbonization. Vice versa, we cannot let the promise, e.g., of low-CO2 steel or cement, be an excuse not to act to unlock the potential for measures that already exists today. Successful decarbonization of the supply chains for buildings and infrastructure, including the production of basic materials, will involve the pursuit—in parallel—of emission abatement measures with very different characteristics. Consequently, to facilitate the transition, the support tools box will need to encompass a variety of policies and strategies.
The results thus illustrate the importance of intensifying efforts to identify and manage both soft (organization, knowledge sharing, competence) and hard (technology and costs) barriers and the importance of both acting now by implementing available measures (e.g., material efficiency and material/fuel substitution measures) and actively planning for long-term measures (low-CO2 steel or cement). Unlocking the full abatement potential of the range of emission abatement measures that are described in this study will require not only technological innovation but also innovations in the policy arena and efforts to develop new ways of co-operating, coordinating, and sharing information between actors in the supply chain. Key priorities include, e.g.,
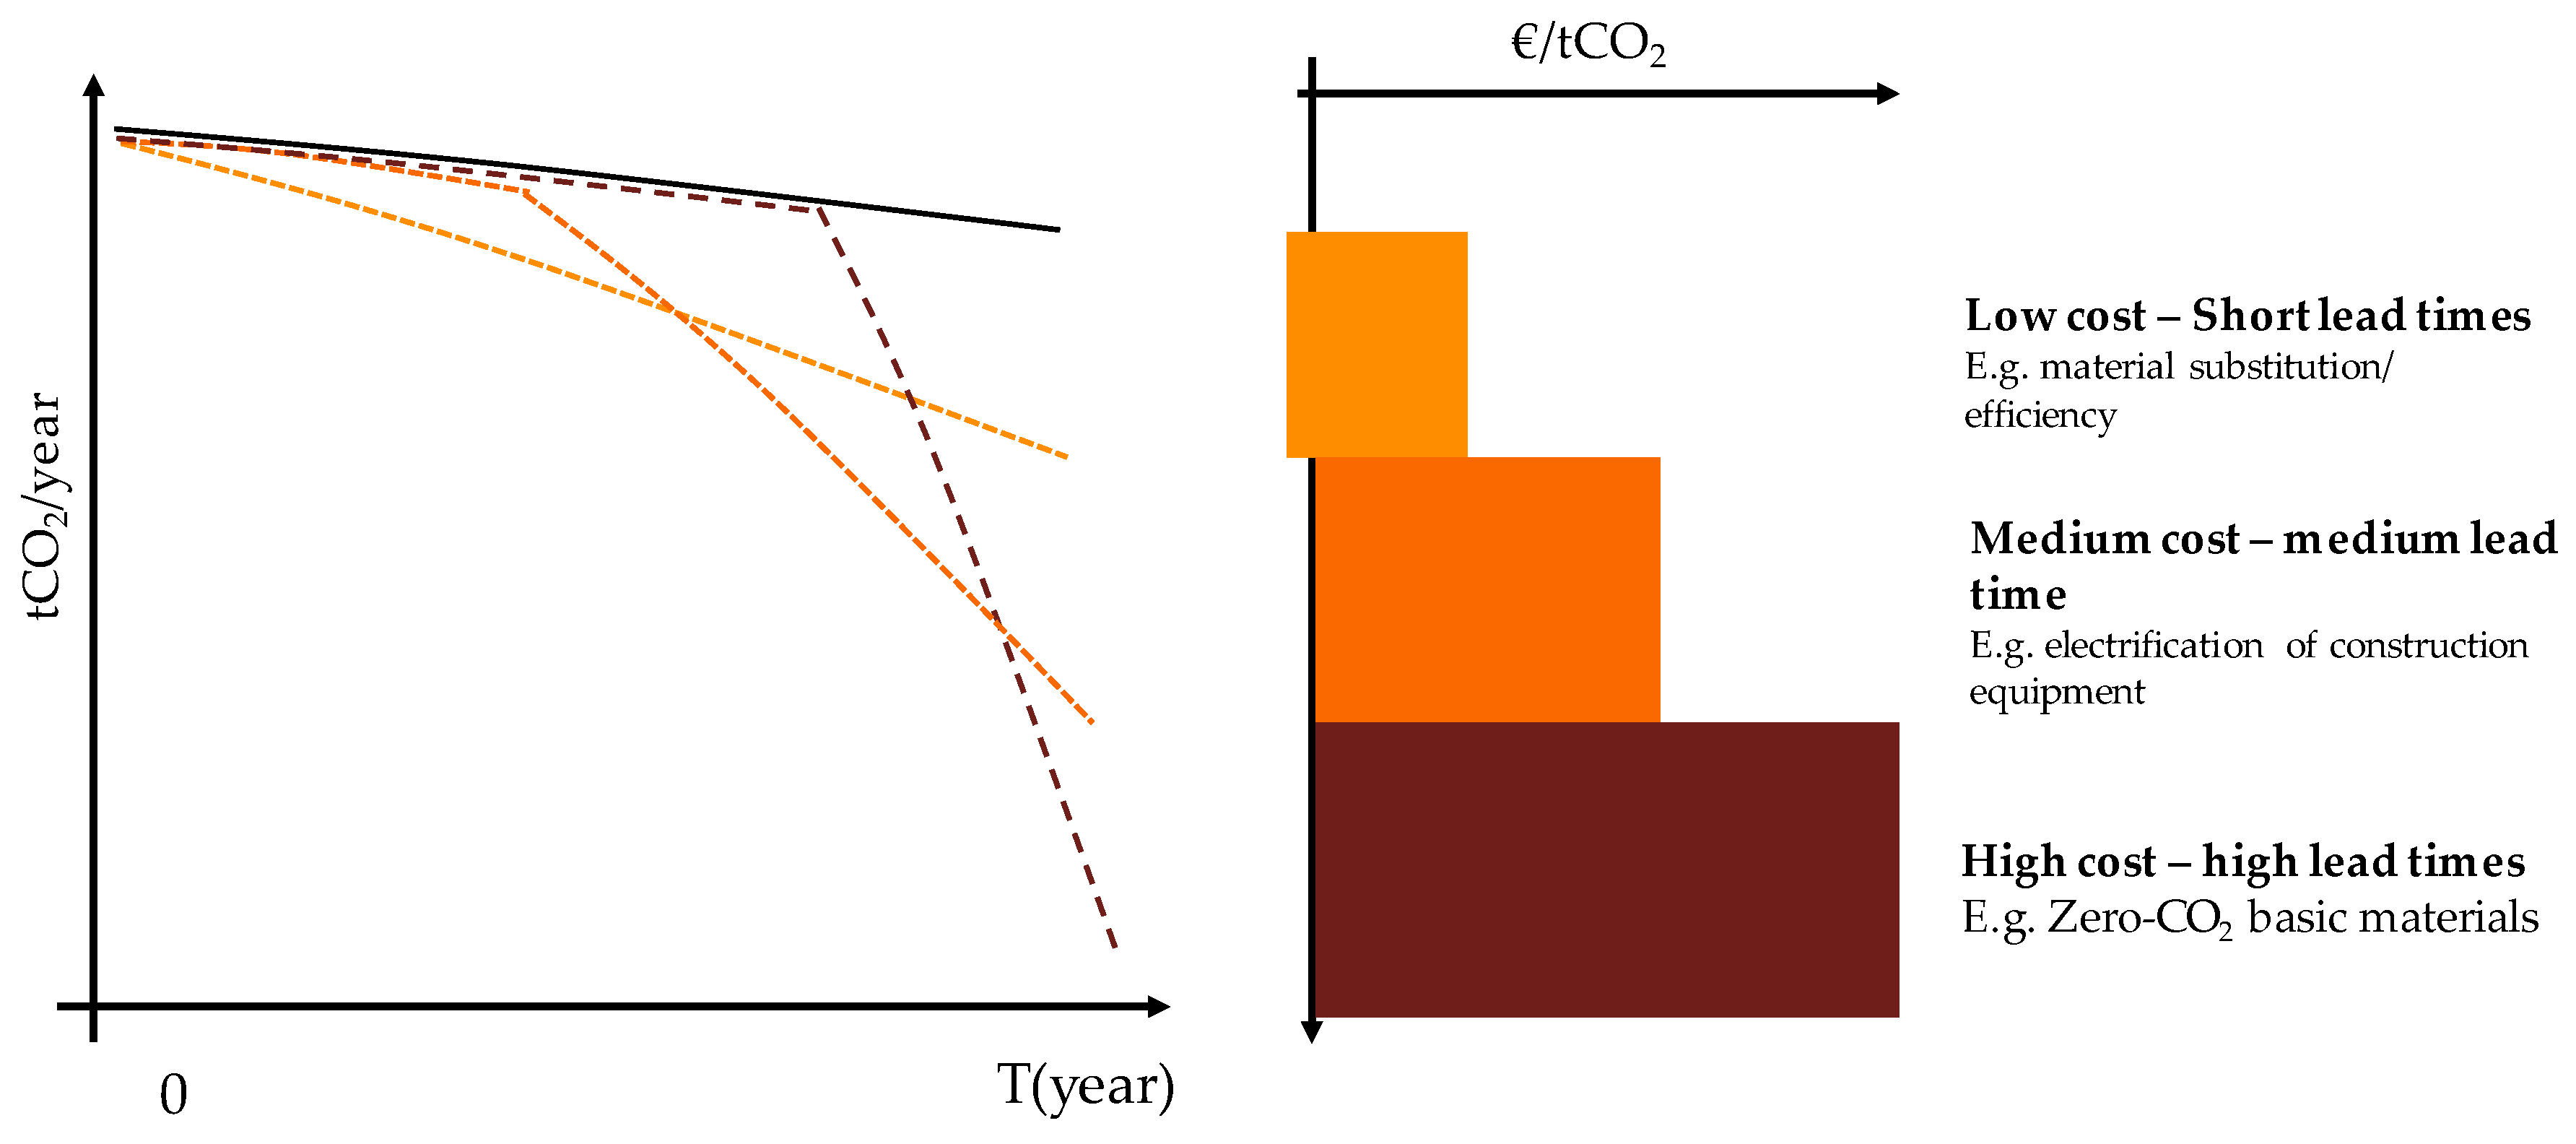
  • Continuous efforts around process optimization, material efficiency, and material substitution [43] to reduce the climate impact from basic materials and construction, particularly in the short to medium terms. This includes efforts in all planning process, and among all actors, to:
    avoid building (where possible),
    re-using old assets,
    recycle building materials and components,
    optimize material use, and
    shift to low-CO2 materials and services.
  • Development of integrated industrial climate strategy including adaptation of legislation, and innovative schemes to share the risk and costs associated with developing and implementing new process technology and infrastructures (see, e.g., Reference [161,162]).
  • Strategic planning for support infrastructure. Lead times related to planning, permitting, and construction of both support infrastructure (renewable electricity supply, electricity grid expansion, hydrogen storage, CCS infrastructure) and piloting and upscaling to commercial scale of the actual production units will influence the speed of change [163,164]. Historical transition processes provide valuable lessons around the importance of going beyond the physical planning, ensuring transparency, broad participation, and fairness (e.g., acceptable distributional effects) early on, as well as planning for agility and endurance in the face of the unforeseen (e.g., delays, changing market conditions). Similar planning processes, including identification of designated strategic areas/zones, have previously been carried out for wind and hydro power [165,166].
  • Ensuring focus on logistical optimization (via, e.g., digitalization), sufficient availability of sustainably produced second-generation biofuels and support for hybridization and electrification of heavy transport and construction equipment (as called for in, e.g., Reference [30,31,54,167,168,169]).
  • Using public procurement as a tool to spur innovation, creating markets for low-CO2 products and opening up for economies of scale [35]. Public procurers in governmental agencies, municipalities, and county councils, with their significant purchasing power, can play an important role as drivers and by setting examples. In addition, private actors can help to legitimize public strategies and increase the volume of demand for low-CO2 products [163]. It is imperative that embodied carbon emissions start weighing as heavily as project costs, timescales, functionality, and aesthetics do regarding client priorities [170]. At the same time, the applicability of procurement requirements for carbon reduction depends on how well these requirements are aligned with industry culture, policies, and capabilities in the local context (see, e.g., Reference [171]).
  • Capacity building and information spreading to change the culture and established practices of the conservative, cost-driven, and risk averse construction industry [46] via, for example:
    Establishment of an (public or private) umbrella organization with the responsibility to oversee and support the low-CO2 transition.
    Securing new competence by including low-CO2 building and construction as a central part of the in upper secondary school and higher education.
    Training of active practitioners (engineers, architects…).
It is of course also important to continue to find ways to sharpen existing climate policies, such as the EU-ETS and renewable policies, most important being to make them as long term as possible [35]. There is no guarantee that investments in the development and implementation of hydrogen direction reduction in the steel industry, CCS in the cement industry, nor other low-carbon technologies for industrial applications will pay off [172,173]. However, choosing not to, or failing to act within the next few years, to create the economic, organizational, and infrastructural conditions that could facilitate a shift towards low-CO2 production and practices will severely compromise the chances of a successful decarbonization of the steel and cement-industries, as well as the supply chains for buildings and transport infrastructure, up to the year 2045.
Although the findings reported in this paper draw primarily on Swedish experiences, with some of the conclusions valid only under certain conditions and circumstances, it is clear that many of the challenges that have been raised here, which must be overcome to achieve a transition to zero-CO2 production and practices in the supply chains for buildings and infrastructure, are universal [43,174,175]. Whereas rapid improvements of the climate performance of the use phase (i.e., related to heating and cooling) of the existing and new building stocks is a key priority in many parts of the world, it is equally important to take measures to reduce the climate impact of the construction process and the production and supply of building materials.
From a global perspective, this is important, not the least, since there are still many regions of the world where much the of the buildings and the infrastructure to provide shelter from the elements, mobility for people and goods, and infrastructures for the supply of water, electricity, and heat remains to be built. Estimates suggest that more than half of the urban infrastructure that will exist in 2050 has yet to be built [175,176] and that total global floor area of buildings will double within the next three or four decades [43,174].

5. Conclusions

In this paper, material and energy flow analysis is combined with a literature review to improve and validate the estimate of the current climate impact from building and construction processes in Sweden. The result is an estimate of around 9.8 Mt CO2 per year, close to 20% total Swedish GHG emissions, deriving predominantly from concrete and steel, together with diesel use in construction processes and material transports.
From the current estimate, the work provides a roadmap with an analysis of different pathways of technological developments in the supply chains of the buildings and construction industry, including primary production of steel and cement. The analysis combines quantitative analysis methods, including scenarios and stylized models, with participatory processes involving relevant stakeholders in the assessment process. By applying a combination of circularity and material efficiency measures, biofuel or biomaterial substitution, electrification (direct or indirect) with renewable electricity, and carbon capture and storage, this roadmap demonstrates that the CO2 emissions associated with construction of buildings and transport infrastructure could be reduced by over 50% to 2030 and by over 90% to 2045. At the same time, strategic choices with respect to process technologies, energy carriers, and the availability of biofuels, CCS, and zero CO2 electricity may have different implications on energy use and CO2 emissions over time.

Supplementary Materials

The following are available online at https://www.mdpi.com/1996-1073/13/16/4136/s1, Inventory of abatement options and potential.

Author Contributions

Conceptualization: I.K., J.R.; methodology: I.K.; software: I.K.; validation: I.K.; formal analysis: I.K., J.R., A.T.; investigation: I.K., A.T.; resources: I.K., data curation: I.K.; writing—original draft preparation: I.K.; writing–review and editing: I.K., J.R., A.T., M.O., F.J., L.G.; visualization: I.K.; project administration: F.J., M.O., L.G.; funding acquisition: F.J. All authors have read and agreed to the published version of the manuscript.

Funding

This research was funded by Mistra.

Acknowledgments

Close collaboration with both public and private stakeholders involved in the Mistra Carbon Exit research program have been important in the development of this study.

Conflicts of Interest

The authors declare no conflict of interest.

Abbreviations

The following abbreviations are used in this manuscript:
ParameterDefinitionUnit
EEmissionstCO2
eEmissions share for specific emissions sources (e.g., lifecycle stages, materials, etc.)%
MMaterial demand/productionmetric tonne (t)
QEnergy demandkWh
qEnergy share for specific energy sources in material production or fuels%
EfEmissions intensity factor per unit (t for material production and kWh for transport/ construction processes)tCO2/unit
QfEnergy intensity factor per unit (t for material production and l for transport/ construction processes)kWh/unit
AAbatement measures reducing material/energy demand, i.e., re - recycling, ms-material substitution, me - material efficiency measures, op–optimization of logistics and construction process, ee–energy efficiency measures (including from hybridization and electrification)%
CCEmissions from material production abated via carbon capture.%
The following indexes are used in this manuscript:
IndexDefinitionIndex Components
lcLifecycle stagesMaterial production, material transports, construction process
tcLifecycle stages after material productionMaterial transports, construction process
mMaterialsConcrete, reinforcement steel, construction steel, asphalt, insulation, gypsum and plaster, plastics and paint, others
bBuilding typeMulti-family dwellings, single-family dwellings, non-residential buildings
iInfrastructure typeRoad, railway, ports and fairways
pConstruction phaseNew construction, reinvestment
sEnergy sourcesFossil fuels (coal, gas, oil, fossil waste), biofuels, electricity
tTimesteps2025, 2030, 2035, 2040, 2045

Appendix A

Table A1. Emissions and energy intensity factors along with energy mix for specific materials or material production processes.
Specific Materials/Production Processes Emissions   Intensity   E f m   ( tCO 2 / t ) Energy   Intensity   Q f m   ( kWh / t ) Energy   Mix   q s h , m ,   s   ( % ) CommentReferences
Fossil FuelsCoal/CokeOilGasFossil WasteBiomassElectricity
Concrete production2*10−63650% 50%Only concrete production (i.e., excluding emissions from cement or SCM in concrete)[62,68,69]
Clinker production process emissions0.51- [27,29,177]
Clinker production carbon capture-1220 Energy penalty based on post combustion via amine scrubbing (90% capture rate)[40,106,149,178,179,180,181]
SCM (alternative binders)0.102 100%Supplementary Cementitious Materials. Average of fly ash, blast furnace slag (GGBS), limestone and calcined clay[40,149,182,183,184]
Primary steel production1.905400 77%2%9% 12% [23,37,71,72,111]
Electrolysis energy intensity-2600 100% [112,185]
Secondary steel production0.401200 3% 28% 69%Assuming European average electricity emissions factor[23,71,72]
Metallurgy0.14400 100% Assuming reheating furnaces run on gas[37,72,186]
Galvanizing0.08600 100% Assuming furnaces run on gas[76,77,78]
Polystyrene-based insulation4.702220098% 2%Average of expanded polystyrene (EPS) and extruded polystyrene (XPS)[66,74,83,84,128,187]
Mineral wool insulation1.30770075% 25%Average of rock and glass wool[66,74,83,128,187]
Table A2. Emissions intensity factors for energy sources.
Energy Sources Emissions   Intensity   E f s   ( kgCO 2 / kWh ) CommentReferences
Coal/coke0.370Average of coking coal and bituminous coal (including upstream emissions)[188,189]
Oil0.228Fuel oil (including upstream emissions)[188,189]
Fossil diesel0.338Component in Swedish standard Diesel MK1 (85% fossil diesel and 15% biofuel in 2015)[95]
Gas0.248Natural gas (including upstream emissions)[188,189]
Fossil waste0.288Average of tyres and plastic waste[190,191]
Biofuel0.299Average of forest and agricultural residues; biogenic emissions (not included in emissions calculation due to assumption of carbon neutrality from sustainable forest management); may however contribute to negative emissions when carbon capture is applied[190]
Electricity (Sweden)0.047Swedish average electricity emissions factor in 2015 (including upstream emissions). Used for construction processes, cement and concrete and non-mineral materials[95,192]
Electricity (Europe)0.314European average electricity emissions factor in 2015. Used for steel and other metals production[193]
District heating0.069Swedish national average from 2017; 23% fossil fuels, 68% biofuels, and 9% electricity (from heat pumps) [189]
Table A3. Predicted emissions intensity factors for electricity and district heating.
Energy SourcesYear Emissions   Intensity   E f s   ( kgCO 2 / kWh ) CommentReferences
Electricity (Sweden)20250.034According to a linear reduction to the figure in 2045 from the emission factor in 2015.
20300.025
20350.017
20400.008
20450.003According to the average figure in 2045 from the scenario analysis Four energy futures from the Swedish Energy Agency[194]
Electricity (Europe)20250.261Calculated according to estimated EEA projections[195]
20300.230
20350.172According to a linear reduction from the estimated figure in 2030 down to zero emissions in 2050
20400.115
20450.057
District heating20250.064According to a linear reduction to the figure in 2045 from the emission factor in 2015
20300.059
20350.055
20400.050
20450.045According to the average figure in 2045 from the scenario analysis Four energy futures from the Swedish Energy Agency[194]
Table A4. Overview of the share of emission components from life cycle analysis (LCA) literature for new builds of various building and frame types.
Building TypeBuilding Sub-TypeBuilding/Frame TypeFaçade TypeBuilding Materials (A1-A3)Transport (A4)Construction Process (A5)CommentsReferences
Non-residentialOfficesReinforced in-situ cast concreteConcrete89%2%9% [196]
Reinforced in-situ cast concretePlaster/ wood panel86%2%12% [197]
Hybrid precast/in-situ cast concrete and timberN/A95%3%2% [198]
Reinforced in-situ cast concretePlaster93%-7%Transports included in material emissions[199]
IndustrialConcrete/steelBrick97%-3% [200]
Prefab concrete/ steelSteel97%1%2% [201,202]
ResidentialMulti-family dwellingsIn-situ cast concretePlaster81–84%3–4%13–16% [92,93]
Prefab concretePlaster79%9%13% [92]
Prefab concretePlaster86%8%16% [75]
Hybrid prefab concrete/woodPlaster74%5%13% [203]
Wooden volume elementPlaster79%8%17% [92]
Cross-laminated timberPlaster75%9%17% [92]
Cross-laminated timberWood panel78%6%16%Including ground preparation of 8%[204]
Single-family dwellingsWoodenWood panel82%2%16%A5 including 14% from waste[205]
WoodenBrick85%2%14%A5 including 12% from waste[205]
MasonryBrick86%3%12%A5 including 10% from waste[205]
WoodenWood panel96%4%0% [206]
Table A5. Overview of the share of emission components from different materials in LCA literature for new builds of various building and frame types.
Building TypeBuilding Sub-TypeBuilding/Frame TypeConcreteReinforcement SteelConstruction SteelInsulationGypsum and PlasterPlastic and ChemicalsOthers (Aluminium, Glass, Timber)CommentsReferences
Non-residentialOfficesSteel-reinforced in-situ cast concrete35%4–12%33–39%6–11%3–4%4%11% [196]
Steel-reinforced in-situ cast concrete70%**11%4%3%-12%* Reinforcement steel included in concrete emissions[197]
Hybrid precast/in-situ cast concrete and timber20%-32%9%<1%-- [198]
Reinforced in-situ cast concrete48%*22%14%14%-2%*Reinforce-ment steel included in construction steel[199]
MunicipalWood frame and panel34%2%15%14%9%3%21%Pre-school[207]
IndustrialPrefab concrete/ steel35%20%28%1%1%4%17% [208]
ResidentialMulti-family dwellingsIn-situ cast concrete58–65%6%0–2%6–9%2–5%3–6%14% [92,93]
Prefab concrete43%23%6%10%3%7%8% [92]
Prefab concrete62%11%2%10%4%1%10% [75]
Wooden volume element13%--14%36%11%26% [92]
Cross-laminated timber12%2%9%16%15%9%37% [92]
Cross-laminated timber34%10%8%11%5%-54% [204]
Single-family dwellingsWooden15%0%3%4%3%2%73% [205]
Wooden40%0%9%5%7%1%38% [206]

References

  1. Regeringskansliet Riksdagen Antar Historiskt Klimatpolitiskt Ramverk. Available online: http://www.regeringen.se/pressmeddelanden/2017/06/riksdagen-antar-historiskt-klimatpolitiskt-ramverk/ (accessed on 21 July 2018).
  2. UNFCCC Paris Agreement. Conference of the Parties on Its Twenty-First Session. 2015, Volume 32. Available online: https://unfccc.int/resource/docs/2015/cop21/eng/l09r01.pdf (accessed on 22 July 2018).
  3. Bataille, C.; Waisman, H.; Colombier, M.; Segafredo, L.; Williams, J.; Jotzo, F. The need for national deep decarbonization pathways for effective climate policy. Clim. Policy 2016, 16, S7–S26. [Google Scholar] [CrossRef]
  4. Erlandsson, M.; Byfors, K.; Lundin, J.S. Byggsektorns Historiska Klimatpåverkan Och en Projektion för Nära Noll; IVL Rapport C 277; IVL Svenska Miljöinstitutet: Stockholm, Sweden, 2018. [Google Scholar]
  5. SCB Utsläpp av Växthusgaser Från Svensk Ekonomi Oförändrade. 2018. Available online: https://www.scb.se/hitta-statistik/statistik-efter-amne/miljo/miljoekonomi-och-hallbar-utveckling/miljorakenskaper/pong/statistiknyhet/miljorakenskaper--utslapp-till-luft-fjarde-kvartalet-2018/ (accessed on 25 February 2020).
  6. Naturvårdsverket. Fördjupad Analys av den Svenska Klimatomställningen 2019. Industrin i Fokus; Naturvårdsverket: Stockholm, Sweden, 2019; Volume 6911, ISBN 9789162069117. [Google Scholar]
  7. Naturvårdsverket. Boverket. Klimatscenarier för Bygg- och Fastighetssektorn—Förslag på Metod för Bättre Beslutsunderlag; Naturvårdsverket: Stockholm, Sweden, 2019. [Google Scholar]
  8. Erlandsson, M. Hur når Bygg- och Fastighetssektorn Klimatmålen 2045? Expertmöte för Utvärdering av Föreslagen Modell för Validering och Inspel inför Kommande Scenarioanalys; IVL Svenska Miljöinstitutet: Stockholm, Sweden, 2020. [Google Scholar]
  9. Liljenström, C.; Toller, S.; Åkerman, J.; Björklund, A. Annual climate impact and primary energy use of swedish transport infrastructure. Eur. J. Transp. Infrastruct. Res. 2019. [Google Scholar] [CrossRef]
  10. Steinbach, N.; Palm, V.; Cederberg, C.; Finnveden, G.; Persson, L.; Persson, M.; Berglund, M.; Björk, I.; Fauré, E.; Trimmer, C. Miljöpåverkan Från Svensk Konsumtion-nya Indikatorer för Uppföljning Slutrapport för Forskningsprojektet PRINCE; Naturvårdsverket: Stockholm, Sweden, 2018; ISBN 9789162068424. [Google Scholar]
  11. Erlandsson, M. Modell för Bedömning av Svenska Byggnaders Klimatpåverkan; Naturvårdsverket: Stockholm, Sweden, 2019. [Google Scholar]
  12. Säynäjoki, A.; Heinonen, J.; Junnonen, J.M.; Junnila, S. Input–output and process LCAs in the building sector: Are the results compatible with each other? Carbon Manag. 2017, 8, 155–166. [Google Scholar] [CrossRef]
  13. Crawford, R.H.; Bontinck, P.A.; Stephan, A.; Wiedmann, T.; Yu, M. Hybrid life cycle inventory methods—A review. J. Clean. Prod. 2018, 172, 1273–1288. [Google Scholar] [CrossRef]
  14. Crawford, R.H. Life Cycle Assessment in the Built Environment; Taylor & Francis: Oxfordshire, UK, 2011; ISBN 9780203868171. [Google Scholar]
  15. Soares, N.; Bastos, J.; Pereira, L.D.; Soares, A.; Amaral, A.R.; Asadi, E.; Rodrigues, E.; Lamas, F.B.; Monteiro, H.; Lopes, M.A.R.; et al. A review on current advances in the energy and environmental performance of buildings towards a more sustainable built environment. Renew. Sustain. Energy Rev. 2017, 77, 845–860. [Google Scholar] [CrossRef]
  16. Matthews, H.S.; Hendrickson, C.T.; Weber, C.L. The importance of carbon footprint estimation boundaries. Environ. Sci. Technol. 2008, 42, 5839–5842. [Google Scholar] [CrossRef] [Green Version]
  17. Nässén, J.; Holmberg, J.; Wadeskog, A.; Nyman, M. Direct and indirect energy use and carbon emissions in the production phase of buildings: An input-output analysis. Energy 2007, 32, 1593–1602. [Google Scholar] [CrossRef]
  18. Lenzen, M.; Treloar, G. Embodied energy in buildings: Wood versus concrete—Reply to Börjesson and Gustavsson. Energy Policy 2002, 30, 249–255. [Google Scholar] [CrossRef]
  19. Lenzen, M. Errors in conventional and input-output-based life-cycle inventories. J. Ind. Ecol. 2000. [Google Scholar] [CrossRef]
  20. Peters, G.P.; Hertwich, E. Structural analysis of international trade: Environmental impacts of Norway. Econ. Syst. Res. 2006. [Google Scholar] [CrossRef]
  21. Schuerch, R.; Kaenzig, J.; Jungbluth, N.; Nathani, C. 45th Discussion forum on LCA-environmentally extended input-output analysis and LCA, September 15, 2011, Berne, Switzerland. Int. J. Life Cycle Assess. 2012, 17, 840–844. [Google Scholar] [CrossRef]
  22. Fischedick, M.; Marzinkowski, J.; Winzer, P.; Weigel, M. Techno-economic evaluation of innovative steel production technologies. J. Clean. Prod. 2014, 84, 563–580. [Google Scholar] [CrossRef] [Green Version]
  23. Eurofer. A Steel Roadmap for a Low Carbon Europe 2050; European Confederation of Iron & Steel Industries: Brussels, Belgium, 2013. [Google Scholar]
  24. Wörtler, M.; Dahlmann, P.; Schuler, F.; Bodo Lüngen, H.; Voigt, N.; Ghenda, J.-T.; Schmidt, T. Steel’s Contribution to a Low-Carbon Europe 2050: Technical and Economic Analysis of the Sector’s CO2 Abatement Potential; European Confederation of Iron & Steel Industries: Brussels, Belgium, 2013. [Google Scholar]
  25. Arens, M.; Worrell, E.; Eichhammer, W.; Hasanbeigi, A.; Zhang, Q. Pathways to a low-carbon iron and steel industry in the medium-term—The case of Germany. J. Clean. Prod. 2017, 163. [Google Scholar] [CrossRef]
  26. Jernkontoret. Klimatfärdplan för en Fossilfri och Konkurrenskraftig Stålindustri i Sverige; Jernkontoret: Stockholm, Sweden, 2018. [Google Scholar]
  27. IEA; CSI. Technology Roadmap: Low-Carbon Transition in the Cement Industry. 2018, Volume 66. Available online: https://www.iea.org/reports/technology-roadmap-low-carbon-transition-in-the-cement-industry (accessed on 10 June 2020).
  28. CEMBUREAU. The Role of Cement in the 2050 Low Carbon Economy; The European Cement Association: Brussels, Belgium, 2013. [Google Scholar]
  29. Favier, A.; De Wolf, C.; Scrivener, K.; Habert, G. A Sustainable Future for the European Cement and Concrete Industry: Technology Assessment for Full Decarbonisation of the Industry by 2050; ETH Zürich: Zürich, Switzerland, 2018; Volume 96. [Google Scholar] [CrossRef]
  30. IEA. The Future of Trucks; Oecd/International Energy Agency: Paris, France, 2017. [Google Scholar]
  31. Skinner, I.; van Essen, H.; Smokers, H.; Hill, N. Towards the Decarbonisation of EU’s Transport Sector by 2050; European Commission: Brussels, Belgium, 2010. [Google Scholar]
  32. Bondemark, A.; Jonsson, L. Fossilfrihet för Arbetsmaskiner—En Rapport av WSP för Statens Energimyndighet; World Scientific: Singapore, 2017. [Google Scholar]
  33. Swedish Transport Administration. Arbetsmaskiners Klimatpåverkan och hur den kan Minska—Ett Underlag till 2050-Arbetet; Trafikverket: Borlänge, Sweden, 2012. [Google Scholar]
  34. Gerres, T.; Chaves Ávila, J.P.; Llamas, P.L.; San Román, T.G. A review of cross-sector decarbonisation potentials in the European energy intensive industry. J. Clean. Prod. 2019, 210, 585–601. [Google Scholar] [CrossRef]
  35. Bataille, C.; Åhman, M.; Neuhoff, K.; Nilsson, L.J.; Fischedick, M.; Lechtenböhmer, S.; Solano-Rodriquez, B.; Denis-Ryan, A.; Steiber, S.; Waisman, H.; et al. A review of technology and policy deep decarbonization pathway options for making energy-intensive industry production consistent with the Paris agreement. J. Clean. Prod. 2018. [Google Scholar] [CrossRef] [Green Version]
  36. Wyns, T.; Axelson, M. The Final Frontier—Decarbonising Europe’s Energy Intensive Industries; Institute for European Studies: Bruxelles, Belgium, 2016; p. 64. [Google Scholar] [CrossRef]
  37. Material Economics. Industrial Transformation 2050—Pathways to Net-Zero Emissions from EU Heavy Industry; Material Economics: Stockholm, Sweden, 2019. [Google Scholar]
  38. Energy Transition Commission. Mission Possible—Reaching Net Zero Carbon Emissions from Harder-to-Abate Sectors by Mid-Century; Energy Transitions Commission: London, UK, 2018. [Google Scholar]
  39. European Commission. In-Depth Analysis in Support of the Commission Communication com (2018) 773 A Clean Planet for all A European Long-Term Strategic Vision for a Prosperous, Modern, Competitive and Table of Contents. 2018. Available online: https://ec.europa.eu/knowledge4policy/publication/depth-analysis-support-com2018-773-clean-planet-all-european-strategic-long-term-vision_en (accessed on 10 June 2020).
  40. Rootzén, J.; Johnsson, F. CO2 emissions abatement in the Nordic carbon-intensive industry—An end-game in sight? Energy 2015. [Google Scholar] [CrossRef] [Green Version]
  41. Schneider, C.; Saurat, M.; Tönjes, A.; Zander, D.; Hanke, T.; Soukup, O.; Barthel, C.; Viebahn, P. Decarbonisation Pathways for Key Economic Sectors; Wuppertal Institute for Climate, Environment and Energy: Wuppertal, Germany, 2020. [Google Scholar]
  42. Grønn Byggallianse; Norsk Eiendom. The Property Sector’s Roadmap Towards 2050; Norwegian Green Building Council: Oslo, Norway, 2016. [Google Scholar]
  43. World Green Building Council. Bringing Embodied Carbon Upfront; World Green Building Council: London, UK, 2019. [Google Scholar]
  44. Allwood, J.M.; Cullen, J.M. Sustainable Materials with Both Open Eyes; UIT Cambridge: Cambridge, UK, 2012; ISBN 9781906860059. [Google Scholar]
  45. Green Construction Board Low Carbon Routemap for the UK Built Environment. 2013. Available online: https://www.researchgate.net/publication/289245351_Green_Construction_Board_Low_Carbon_Routemap_for_the_Built_Environment_-_2015_Routemap_Progress_Technical_Report (accessed on 13 January 2018).
  46. Giesekam, J.; Barrett, J.; Taylor, P.; Owen, A. The greenhouse gas emissions and mitigation options for materials used in UK construction. Energy Build. 2014, 78, 202–214. [Google Scholar] [CrossRef]
  47. Allwood, J.M.; Dunant, C.F.; Lupton, R.C.; Cleaver, C.J.; Serrenho, A.C.H.; Azevedo, J.M.C.; Horton, P.M.; Clare, C.; Low, H.; Horrocks, I.; et al. Absolute Zero. Delivering the UK’s Climate Change Commitment with Incremental Changes to Today’s Technologies. 2019. Available online: https://researchportal.bath.ac.uk/en/publications/absolute-zero-delivering-the-uks-climate-change-commitment-with-i (accessed on 1 February 2019).
  48. Fossilfritt Sverige. Roadmaps for Fossil Free Competitiveness—A Summary of Roadmaps from Swedish Business Sectors; Fossilfritt Sverige: Stockholm, Sweden, 2018. [Google Scholar]
  49. Fossilfritt Sverige. Färdplan för Fossilfri Konkurrenskraft Bygg- och Anläggningssektorn; Fossilfritt Sverige: Stockholm, Sweden, 2018. [Google Scholar]
  50. SWECO. Klimatneutral Konkurrenskraft—Kvantifiering av Åtgärder i Klimatfärdplaner; Sweco: Stockholm, Sweden, 2019. [Google Scholar]
  51. Kungliga IngenjörsVetenskaps Akademien. Så Klarar Svensk Industri Klimatmålen–En Delrapport från IVA-Projektet Vägval för Klimatet; Kungliga IngenjörsVetenskaps Akademien: Stockholm, Sweden, 2019. [Google Scholar]
  52. Sveriges Byggindustrier; IVA. Klimatpåverkan Från Byggprocessen; Sveriges Byggindustrier, IVA: Stockholm, Sweden, 2014. [Google Scholar]
  53. Trafikverket. Miljökonsekvensbeskrivning av Förslag till Nationell Plan för Transportsystemet 2018–2029; Trafikverket: Borlänge, Sweden, 2017. [Google Scholar]
  54. Karlsson, I.; Rootzén, J.; Johnsson, F. Reaching net-zero carbon emissions in construction supply chains–Analysis of a Swedish road construction project. Renew. Sustain. Energy Rev. 2020, 120. [Google Scholar] [CrossRef]
  55. Moncaster, A.M.; Rasmussen, F.N.; Malmqvist, T.; Houlihan Wiberg, A.; Birgisdottir, H. Widening understanding of low embodied impact buildings: Results and recommendations from 80 multi-national quantitative and qualitative case studies. J. Clean. Prod. 2019, 235, 378–393. [Google Scholar] [CrossRef]
  56. Schwartz, Y.; Raslan, R.; Mumovic, D. The life cycle carbon footprint of refurbished and new buildings–A systematic review of case studies. Renew. Sustain. Energy Rev. 2018, 81, 231–241. [Google Scholar] [CrossRef] [Green Version]
  57. Chastas, P.; Theodosiou, T.; Kontoleon, K.J.; Bikas, D. Normalising and assessing carbon emissions in the building sector: A review on the embodied CO 2 emissions of residential buildings. Build. Environ. 2018, 130, 212–226. [Google Scholar] [CrossRef]
  58. Amer, M.; Daim, T.U.; Jetter, A. A review of scenario planning. Futures 2013, 46, 23–40. [Google Scholar] [CrossRef]
  59. Energimyndigheten. Scenarier över Sveriges Energisystem 2016; Energimyndigheten: Eskilstuna, Sweden, 2017. [Google Scholar]
  60. European Standards EN 15978:2011. Sustainability of Construction Works—Assessment of Environmental Performance of Buildings—Calculation Method; National Standards Authority of Ireland: Dublin, Ireland, 2011. [Google Scholar]
  61. Swedish Transport Administration. Förslag till Nationell Plan för Transportsystemet 2014–2025 Underlagsrapport—Miljökonsekvensbeskrivning; Swedish Transport Administration: Borlänge, Sweden, 2013. [Google Scholar]
  62. Kurkinen, E.; Norén, J.; Peñaloza, D.; Al-Ayish, N.; During, O. Energi och Klimateffektiva Byggsystem: Miljövärdering av Olika Stomalternativ; SP Technical Research Institute of Sweden: Borås, Sweden, 2017. [Google Scholar]
  63. Svensk Betong. Klimatförbättrad Betong; Svensk Betong Service AB: Stockholm, Sweden, 2019. [Google Scholar]
  64. Cementa Miljödata Slite. Available online: https://www.cementa.se/sv/miljodata-slite (accessed on 26 March 2019).
  65. Ishak, S.A.; Hashim, H. Low carbon measures for cement plant—A review. J. Clean. Prod. 2015, 103, 260–274. [Google Scholar] [CrossRef]
  66. Basbagill, J.; Flager, F.; Lepech, M.; Fischer, M. Application of life-cycle assessment to early stage building design for reduced embodied environmental impacts Application of life-cycle assessment to early stage building design for reduced embodied environmental impacts. Build. Environ. 2013, 60, 81–92. [Google Scholar] [CrossRef]
  67. Chau, C.K.; Leung, T.M.; Ng, W.Y. A review on life cycle assessment, life cycle energy assessment and life cycle carbon emissions assessment on buildings. Appl. Energy 2015, 143, 395–413. [Google Scholar] [CrossRef]
  68. Toller, S. Rapport: Klimatkalkyl—Beräkning av Infrastrukturens Klimatpåverkan och Energianvändning i ett Livscykelperspektiv; Modell 5.0 och 6.0; Trafikverket: Borlänge, Sweden, 2018. [Google Scholar]
  69. Erlandsson, M. Byggsektorns Miljöberäkningsverktyg BM1.0; IVL Svenska Miljöinstitutet: Stockholm, Sweden, 2018. [Google Scholar]
  70. Bianco, L.; Baracchini, G.; Cirilli, F. Sustainable Electric Arc Furnace Steel Production: GREENEAF. BHM Berg-und Hüttenmännische Monatshefte 2013, 158, 17–23. [Google Scholar] [CrossRef]
  71. Otto, A.; Robinius, M.; Grube, T.; Schiebahn, S.; Praktiknjo, A.; Stolten, D. Power-to-Steel: Reducing CO2 through the Integration of Renewable Energy and Hydrogen into the German Steel Industry. Energies 2017, 10, 451. [Google Scholar] [CrossRef] [Green Version]
  72. Xylia, M.; Silveira, S.; Duerinck, J.; Meinke-Hubeny, F. Weighing regional scrap availability in global pathways for steel production processes. Energy Effic. 2018. [Google Scholar] [CrossRef] [Green Version]
  73. Gunarathne, D.S.; Mellin, P.; Yang, W.; Pettersson, M.; Ljunggren, R. Performance of an effectively integrated biomass multi-stage gasification system and a steel industry heat treatment furnace. Appl. Energy 2016, 170, 353–361. [Google Scholar] [CrossRef]
  74. Zabalza Bribián, I.; Valero Capilla, A.; Aranda Usón, A. Life cycle assessment of building materials: Comparative analysis of energy and environmental impacts and evaluation of the eco-efficiency improvement potential. Build. Environ. 2011, 46, 1133–1140. [Google Scholar] [CrossRef]
  75. Andersson, M.; Barkander, J.; Kono, J.; Ostermeyer, Y. Abatement cost of embodied emissions of a residential building in Sweden. Energy Build. 2018. [Google Scholar] [CrossRef]
  76. Mousa, E.; Wang, C.; Riesbeck, J.; Larsson, M. Biomass applications in iron and steel industry: An overview of challenges and opportunities. Renew. Sustain. Energy Rev. 2016, 65, 1247–1266. [Google Scholar] [CrossRef]
  77. European General Galvanizers Association. Batch Hot Dip Galvanizing of Steel Products to EN ISO 1461; European Average; European General Galvanizers Association: London, UK, 2016. [Google Scholar]
  78. Industrial Galvanizers. Specifiers Manual; Industrial Galvanizers: Brisbane, Australia, 2013. [Google Scholar]
  79. Lasvaux, S.; Habert, G.; Peuportier, B.; Chevalier, J. Comparison of generic and product-specific Life Cycle Assessment databases: Application to construction materials used in building LCA studies. Int. J. Life Cycle Assess. 2015, 1473–1490. [Google Scholar] [CrossRef]
  80. Swedish Transport Administration. Gröna Koncept Inom Asfaltsbeläggningar—Kunskapsöversikt; Swedish Transport Administration (Trafikverket): Borlänge, Sweden, 2015. [Google Scholar]
  81. Lehne, J.; Preston, F. Chatham House Report: Making Concrete Change Innovation in Low-carbon Cement and Concrete; Chatham House Report, Energy Enivronment and Resources Department: London, UK, 2018. [Google Scholar]
  82. Martinsson, K.; Jacobson, T.; Lundberg, R. Calculation of Energy and Carbon Dioxide on Asphalt Pavements; Swedish Transport Administration: Orebro, Sweden, 2017. [Google Scholar]
  83. Hill, C.; Norton, A.; Dibdiakova, J. A comparison of the environmental impacts of different categories of insulation materials. Energy Build. 2018, 162, 12–20. [Google Scholar] [CrossRef]
  84. Pargana, N.; Pinheiro, M.D.; Silvestre, J.D.; De Brito, J. Comparative environmental life cycle assessment of thermal insulation materials of buildings. Energy Build. 2014, 82, 466–481. [Google Scholar] [CrossRef]
  85. Gustavsson, L.; Joelsson, A.; Sathre, R. Life cycle primary energy use and carbon emission of an eight-storey wood-framed apartment building. Energy Build. 2010, 42, 230–242. [Google Scholar] [CrossRef]
  86. Lushnikova, N.; Dvorkin, L. Sustainability of Gypsum Products as a Construction Material, 2nd ed.; Elsevier Ltd.: Amsterdam, The Netherlands, 2016; ISBN 9780081003701. [Google Scholar]
  87. Quintana, A.; Alba, J.; del Rey, R.; Guillén-Guillamón, I. Comparative Life Cycle Assessment of gypsum plasterboard and a new kind of bio-based epoxy composite containing different natural fibers. J. Clean. Prod. 2018, 185, 408–420. [Google Scholar] [CrossRef]
  88. Fischedick, M.; Roy, J.; Abdel-Aziz, A.; Acquaye, A.; Allwood, J.M.; Ceron, J.; Geng, Y.; Kheshgi, H.; Lanza, A.; Perczyk, D.; et al. Industry. In Climate Change 2014: Mitigation of Climate Change. IPCC Working Group III Contribution to AR5; Cambridge University Press: Cambridge, UK, 2014; pp. 739–810. [Google Scholar]
  89. Sandberg, E.; Toffolo, A.; Krook-Riekkola, A. A bottom-up study of biomass and electricity use in a fossil free Swedish industry. Energy 2019. [Google Scholar] [CrossRef]
  90. Lechtenböhmer, S.; Nilsson, L.J.; Åhman, M.; Schneider, C. Decarbonising the energy intensive basic materials industry through electrification—Implications for future EU electricity demand. Energy 2016, 115, 1623–1631. [Google Scholar] [CrossRef] [Green Version]
  91. Lolli, N.; Hestnes, A.G. The influence of different electricity-to-emissions conversion factors on the choice of insulation materials. Energy Build. 2014, 85, 362–373. [Google Scholar] [CrossRef]
  92. Erlandsson, M.; Malmqvist, T.; Francart, N.; Kellner, J. Minskad Klimatpåverkan från Nybyggda Flerbostadshus—Underlagsrapport; Sveriges Byggindustrier: Stockholm, Sweden, 2018. [Google Scholar]
  93. Liljenström, C.; Malmqvist, T.; Erlandsson, M.; Fredén, J.; Adolfsson, I.; Larsson, G.; Brogren, M. Byggandets Klimatpåverkan Livscykelberäkning av Klimatpåverkan och Energianvändning för ett Nyproducerat Energieffektivt Flerbostadshus i Betong; IVL Svenska Miljöinstitutet: Stockholm, Sweden, 2015. [Google Scholar]
  94. Barandica, J.M.; Fernández-Sánchez, G.; Berzosa, Á.; Delgado, J.A.; Acosta, F.J. Applying life cycle thinking to reduce greenhouse gas emissions from road projects. J. Clean. Prod. 2013, 57, 79–91. [Google Scholar] [CrossRef]
  95. Swedish Energy Agency. Drivmedel 2017 Redovisning av Uppgifter Enligt Drivmedelslagen och Hållbarhetslagen; Swedish Energy Agency: Eskilstuna, Sweden, 2018. [Google Scholar]
  96. Shanks, W.; Dunant, C.F.; Drewniok, M.P.; Lupton, R.C.; Serrenho, A.; Allwood, J.M. How much cement can we do without? Lessons from cement material flows in the UK. Resour. Conserv. Recycl. 2019, 141, 441–454. [Google Scholar] [CrossRef] [Green Version]
  97. Scrivener, K.L.; John, V.M.; Gartner, E.M. Eco-Efficient Cements: Potential, Economically Viable Solutions for a Low-CO2 Cement Based Industry; Elsevier: Amsterdam, The Netherlands, 2016. [Google Scholar]
  98. Cementa; Fossilfritt Sverige. Färdplan Cement för ett Klimatneutralt Betongbyggande; Fossilfritt Sverige: Stockholm, Sweden, 2018. [Google Scholar]
  99. ERMCO. Ready-Mixed Concrete Industry Statistics. Year 2013; ERMCO—European Ready Mixed Concrete Organization: Bruxelles, Belgium, 2014. [Google Scholar]
  100. ERMCO. European Ready Mix Concrete Organization (ERMCO) Statistics 2016; ERMCO—European Ready Mixed Concrete Organization: Bruxelles, Belgium, 2017. [Google Scholar]
  101. Hildebrandt, J.; Hagemann, N.; Thrän, D. The contribution of wood-based construction materials for leveraging a low carbon building sector in europe. Sustain. Cities Soc. 2017, 34. [Google Scholar] [CrossRef]
  102. Hafner, A.; Schäfer, S. Comparative LCA study of different timber and mineral buildings and calculation method for substitution factors on building level. J. Clean. Prod. 2018, 167, 630–642. [Google Scholar] [CrossRef]
  103. Moncaster, A.M.; Birgisdottir, H.; Malmqvist, T.; Nygaard Rasmussen, F.; Houlihan Wiberg, A.; Soulti, E. Embodied carbon measurement, mitigation and management within Europe, drawing on a cross-case analysis of 60 building case studies. Embodied Carbon Build. Meas. Manag. Mitig. 2018, 443–462. [Google Scholar] [CrossRef]
  104. Birgisdottir, H.; Moncaster, A.; Wiberg, A.H.; Chae, C.; Yokoyama, K.; Balouktsi, M.; Seo, S.; Oka, T.; Lützkendorf, T.; Malmqvist, T. IEA EBC annex 57 ‘evaluation of embodied energy and CO2eq for building construction’. Energy Build. 2017, 154, 72–80. [Google Scholar] [CrossRef] [Green Version]
  105. Bahramian, M.; Yetilmezsoy, K. Life cycle assessment of the building industry: An overview of two decades of research (1995–2018). Energy Build. 2020, 219. [Google Scholar] [CrossRef]
  106. Wilhelmsson, B.; Kolberg, C.; Larsson, J.; Eriksson, J.; Eriksson, M. CemZero—Feasibility Study; Vattenfall: Solna, Sweden, 2018. [Google Scholar]
  107. Lindgren, Å.; Simonsson, P.; Olofsson, J.; Uppenberg, S.; Ekström, D.; Liljenroth, U.; Magnusson, J.; Söderqvist, J.; Wilhelmsson, B.; Lindvall, A.; et al. Klimatoptimerat Byggande av Betongbroar—Råd och Vägledning. 2017. Available online: https://vpp.sbuf.se/Public/Documents/ProjectDocuments/5091a3fe-9f6c-4f98-b1e2-c2416df0aa42/FinalReport/SBUF%2013207%20Slutrapport%20Klimatoptimerat%20byggande%20av%20betongbroar.pdf (accessed on 10 June 2020).
  108. Celsa Steel Service AS. Environmental Product Declaration, Steel Reinforcement Products for Concrete; EPD International: Stockholm, Sweden, 2012. [Google Scholar]
  109. Allwood, J.M. Transitions to material efficiency in the UK steel economy. Philos. Trans. A Math. Phys. Eng. Sci. 2013, 371, 20110577. [Google Scholar] [CrossRef] [Green Version]
  110. Fleiter, T.; Herbst, A.; Rehfeldt, M.; Arens, M. Industrial Innovation: Pathways to Deep Decarbonisation of Industry. Part 2: Scenario Analysis and Pathways to Deep Decarbonisation; Fraunhofer-Institut für System-und Innovationsforschung ISI: Karlsruhe, Germany, 2019. [Google Scholar]
  111. HYBRIT. Slutrapport HYBRIT—Hydrogen Breakthrough Ironmaking Technology—Genomförbarhetsstudie; Hybrit: Luleå, Sweden, 2018. [Google Scholar]
  112. Vogl, V.; Åhman, M.; Nilsson, L.J. Assessment of hydrogen direct reduction for fossil-free steelmaking. J. Clean. Prod. 2018, 203. [Google Scholar] [CrossRef]
  113. Norgate, T.; Haque, N.; Somerville, M.; Jahanshahi, S. Biomass as a source of renewable carbon for iron and steelmaking. ISIJ Int. 2012, 52, 1472–1481. [Google Scholar] [CrossRef] [Green Version]
  114. Wei, R.; Zhang, L.; Cang, D.; Li, J.; Li, X.; Xu, C.C. Current status and potential of biomass utilization in ferrous metallurgical industry. Renew. Sustain. Energy Rev. 2017, 68, 511–524. [Google Scholar] [CrossRef]
  115. HYBRIT. SSAB, LKAB and Vattenfall to Build a Globally-Unique Pilot Plant for Fossil-Free Steel—Press Release. Available online: https://www.ssab.com/company/newsroom/media-archive/2018/02/01/06/31/ssab-lkab-and-vattenfall-to-build-a-globallyunique-pilot-plant-for-fossilfree-steel (accessed on 13 March 2018).
  116. Energy Transition Commission. How to Decarbonize Energy Systems through Electrification–An Analysis of Electrification Opportunities in Transport, Buildings and Industry; Energy Transitions Commission: London, UK, 2017. [Google Scholar]
  117. Wesseling, J.H.; Lechtenböhmer, S.; Åhman, M.; Nilsson, L.J.; Worrell, E.; Coenen, L. The transition of energy intensive processing industries towards deep decarbonization: Characteristics and implications for future research. Renew. Sustain. Energy Rev. 2017, 79, 1303–1313. [Google Scholar] [CrossRef]
  118. Fick, G.; Mirgaux, O.; Neau, P.; Patisson, F. Using biomass for pig iron production: A technical, environmental and economical assessment. Waste Biomass Valorization 2014, 5, 43–55. [Google Scholar] [CrossRef] [Green Version]
  119. Suopajärvi, H.; Kemppainen, A.; Haapakangas, J.; Fabritius, T. Extensive review of the opportunities to use biomass-based fuels in iron and steelmaking processes. J. Clean. Prod. 2017, 148, 709–734. [Google Scholar] [CrossRef]
  120. Mandova, H.; Leduc, S.; Wang, C.; Wetterlund, E.; Patrizio, P.; Gale, W.; Kraxner, F. Possibilities for CO2emission reduction using biomass in European integrated steel plants. Biomass Bioenergy 2018, 115, 231–243. [Google Scholar] [CrossRef]
  121. Anheden, M.; Uhlir, L. Roadmap 2015 to 2025 Biofuels for Low-carbon Steel Industry—A Report by RISE; RISE: Gothenburg, Sweden, 2015. [Google Scholar]
  122. Suopajärvi, H.; Umeki, K.; Mousa, E.; Hedayati, A.; Romar, H.; Kemppainen, A.; Wang, C.; Phounglamcheik, A.; Tuomikoski, S.; Norberg, N.; et al. Use of biomass in integrated steelmaking—Status quo, future needs and comparison to other low-CO2 steel production technologies. Appl. Energy 2018, 213, 384–407. [Google Scholar] [CrossRef] [Green Version]
  123. Van der Stel, J.; Louwerse, G.; Sert, D.; Hirsch, A.; Eklund, N.; Pettersson, M. Top gas recycling blast furnace developments for ‘green’ and sustainable ironmaking. Ironmak. Steelmak. 2013, 40, 483–489. [Google Scholar] [CrossRef]
  124. Abdul Quader, M.; Ahmed, S.; Dawal, S.Z.; Nukman, Y. Present needs, recent progress and future trends of energy-efficient Ultra-Low Carbon Dioxide (CO2) Steelmaking (ULCOS) program. Renew. Sustain. Energy Rev. 2016, 55, 537–549. [Google Scholar] [CrossRef]
  125. Biermann, M.; Ali, H.; Sundqvist, M.; Larsson, M.; Normann, F.; Johnsson, F. Excess heat-driven carbon capture at an integrated steel mill—Considerations for capture cost optimization. Int. J. Greenh. Gas Control 2019. [Google Scholar] [CrossRef]
  126. Biermann, M.; Normann, F.; Johnsson, F.; Skagestad, R. Partial Carbon Capture by Absorption Cycle for Reduced Specific Capture Cost. Ind. Eng. Chem. Res. 2018. [Google Scholar] [CrossRef]
  127. Dylewski, R.; Adamczyk, J. Life cycle assessment (LCA) of building thermal insulation materials. Eco-Efficient Constr. Build. Mater. Life Cycle Assess. Eco-Labelling Case Stud. 2013, 267–286. [Google Scholar] [CrossRef]
  128. Schiavoni, S.; D’Alessandro, F.; Bianchi, F.; Asdrubali, F. Insulation materials for the building sector: A review and comparative analysis. Renew. Sustain. Energy Rev. 2016, 62, 988–1011. [Google Scholar] [CrossRef]
  129. Isover. Planet, People, Prosperity—Our Commitment to Sustainable Construction; Isover: Ottawa, ON, Canada, 2009. Available online: https://www.isover.com/sites/isover.com/files/assets/documents/lca_brochure.pdf (accessed on 14 August 2019).
  130. Pedreño-Rojas, M.A.; Fořt, J.; Černý, R.; Rubio-de-Hita, P. Life cycle assessment of natural and recycled gypsum production in the Spanish context. J. Clean. Prod. 2020, 253. [Google Scholar] [CrossRef]
  131. Hill, N.; Brannigan, C.; Wynn, D.; Milnes, R.; van Essen, H.; den Boer, E.; van Grinsven, A.; Ligthart, T.; van Gijlswijk, R. EU Transport GHG: Routes to 2050 II. The Role of GHG Emissions from Infrastructure Construction, Vehicle Manufacturing, and ELVs in Overall Transport Sector Emissions. 2012. Available online: http://eutransportghg2050.eu/cms/assets/Uploads/Reports/EU-Transport-GHG-2050-II-Task-2-draftfinal1Mar12.pdf (accessed on 10 June 2020).
  132. Thives, L.P.; Ghisi, E. Asphalt mixtures emission and energy consumption: A review. Renew. Sustain. Energy Rev. 2017, 72, 473–484. [Google Scholar] [CrossRef]
  133. WRAP. Cutting Embodied Carbon in Construction Projects; WRAP: Banbury, UK, 2013. [Google Scholar]
  134. Kungliga IngenjörsVetenskaps Akademien. Så klarar Sveriges Transporter Klimatmålen—En Delrapport från IVA-Projektet Vägval för Klimatet; Kungliga IngenjörsVetenskaps Akademien: Stockholm, Sweden, 2019. [Google Scholar]
  135. Jakobsen, J.; Roussanaly, S.; Anantharaman, R. A techno-economic case study of CO2 capture, transport and storage chain from a cement plant in Norway. J. Clean. Prod. 2017, 144, 523–539. [Google Scholar] [CrossRef] [Green Version]
  136. Chan, Y.; Petithuguenin, L.; Fleiter, T.; Herbst, A.; Arens, M.; Stevenson, P. Industrial Innovation: Pathways to Deep Decarbonisation of Industry. Part 1: Technology Analysis; ICF: Fairfax, VA, USA, 2019. [Google Scholar]
  137. European Commission. A Clean Planet for all A European Strategic Long-term Vision for a Prosperous, Modern, Competitive and Climate Neutral Economy; European Commission: Brussels, Belgium, 2018. [Google Scholar]
  138. Swedish Energy Agency. Scenarier över Sveriges Energisystem 2018; Swedish Energy Agency: Eskilstuna, Sweden, 2019. [Google Scholar]
  139. Boverket. Behov av nya Bostäder 2018–2025; Boverket: Karlskrona, Sweden, 2018; ISBN 9789175635729. [Google Scholar]
  140. Näringsdepartementet. Fastställelse av Nationell Trafikslagsövergripande Plan för Transportinfrastrukturen för Perioden 2018–2029; Ministry of Enterprise and Innovation: Stockholm, Sweden, 2018. [Google Scholar]
  141. Swedbank. Makroanalys—Höghastighetståg kan Bidra till Tillväxt, Jobb och Bättre Miljö, Men Statens Finanser Försämras; Swedbank: Stockholm, Sweden, 2018. [Google Scholar]
  142. Liljelund, L.-E.; Lundstedt, M.; Nilsson, B.O.; Nordlöf, G.; Olofsson, M.; Norr, R. Resurseffektivitet—Färdvägar mot 2050; Kungliga IngenjörsVetenskaps Akademien: Stockholm, Sweden, 2015. [Google Scholar]
  143. Energimyndigheten. Industrins processrelaterade utsläpp av växthusgaser och hur de kan minskas. ER 2018:24.; Swedish Energy Agency (Energimyndigheten): Eskilstuna, Sweden, 2018. [Google Scholar]
  144. Köhler, N. Importen av Byggvaror Ökar; Byggindustrin: Stockholm, Sweden, 2011. [Google Scholar]
  145. Transport och Logisitik. Sjöfarten kan minska antalet riskfyllda godstransporter” TransportochLogistik.se: 2019. Available online: https://www.transportochlogistik.se/index.php/20190803/6007/sjofarten-kan-minska-antalet-riskfyllda-godstransporter (accessed on 9 March 2020).
  146. SCB. Priserna för Nyproducerade Bostadshus Lägre än Föregående år. Available online: https://www.scb.se/hitta-statistik/statistik-efter-amne/boende-byggande-och-bebyggelse/byggnadskostnader/priser-for-nyproducerade-bostader/pong/statistiknyhet/priser-for-nyproducerade-bostader-2018/ (accessed on 9 March 2020).
  147. Naturvårdsverket. Klimatscenarier för Bygg—och Fastighetssektorn; Naturvårdsverket: Stockholm, Sweden, 2018. [Google Scholar]
  148. Zhang, C.; Hu, M.; Yang, X.; Amati, A.; Tukker, A. Life cycle greenhouse gas emission and cost analysis of prefabricated concrete building façade elements. J. Ind. Ecol. 2020, 1–15. [Google Scholar] [CrossRef]
  149. Rootzén, J.; Johnsson, F. Managing the costs of CO2 abatement in the cement industry. Clim. Policy 2017. [Google Scholar] [CrossRef] [Green Version]
  150. Svensk Betong. Betongindikatorn–Resultat 2011–2018; Svensk Betong Service AB: Stockholm, Sweden, 2018. [Google Scholar]
  151. Almeida, M.; Ferreira, M.; Barbosa, R. Relevance of embodied energy and carbon emissions on assessing cost effectiveness in building renovation-Contribution from the analysis of case studies in six European countries. Buildings 2018, 8, 103. [Google Scholar] [CrossRef] [Green Version]
  152. Piccardo, C.; Dodoo, A.; Gustavsson, L.; Tettey, U.Y.A. Energy and carbon balance of materials used in a building envelope renovation. IOP Conf. Ser. Earth Environ. Sci. 2019, 225. [Google Scholar] [CrossRef] [Green Version]
  153. Jernkontoret Utrikeshandel. Available online: https://www.jernkontoret.se/sv/stalindustrin/branschfakta-och-statistik/utrikeshandel/ (accessed on 27 February 2020).
  154. Moynihan, M.C.; Allwood, J.M. The flow of steel into the construction sector. Resour. Conserv. Recycl. 2012, 68, 88–95. [Google Scholar] [CrossRef]
  155. Ekvall, T.; Fråne, A.; Hallgren, F.; Holmgren, K. Material pinch analysis: A pilot study on global steel flows. Metall. Res. Technol. 2014, 111, 359–367. [Google Scholar] [CrossRef]
  156. Energimyndigheten. Energiläget 2019—En Översikt; Swedish Energy Agency (Energimyndigheten): Eskilstuna, Sweden, 2019. [Google Scholar]
  157. Svensk Författningssamling. Förordning (2018: 195) om Reduktion av Växthusgasutsläpp Genom Inblandning av Biodrivmedel i Bensin och Dieselbränslen; Svensk Författningssamling: Stockholm, Sweden, 2018. [Google Scholar]
  158. Material Economics. The Circular Economy: A Powerful Force for Climate Mitigation; Material Economics: Stockholm, Sweden, 2018. Available online: https://materialeconomics.com/publications/the-circular-economy-a-powerful-force-for-climate-mitigation-1 (accessed on 4 November 2019).
  159. Bonde, I.; Kuylenstierna, J.; Bäckstrand, K.; Eckerberg, K.; Kåberger, T.; Löfgren, Å.; Rummukainen, M.; Sörlin, S. Klimatpolitiska Rådets Rapport 2020. Available online: https://www.klimatpolitiskaradet.se/en/rapport-2020/ (accessed on 27 March 2020).
  160. Vogt-Schilb, A.; Hallegatte, S. Marginal abatement cost curves and the optimal timing of mitigation measures. Energy Policy 2014, 66, 645–653. [Google Scholar] [CrossRef] [Green Version]
  161. Neuhoff, K.; Chiappinelli, O.; Gerres, T.; Haussner, M.; Ismer, R.; May, N.; Pirlot, A.; Richstein, J. Building Blocks for a Climate- Neutral European Industrial Sector; Climate Strategies: London, UK, 2019. [Google Scholar]
  162. Rootzén, J.; Johnsson, F. A Transformation Fund for Financing High-cost Measures for Deep Emission Cuts in the Construction Industry, Submitted for publication in Climate Policy. 2019.
  163. Wyns, T.; Khandekar, G.; Axelson, M.; Sartor, O.; Neuhoff, K. Towards an Industrial Strategy for a Climate Neutral Europe; European Climate Foundation: Brussels, Belgium, 2019. [Google Scholar]
  164. Swedish Energy Agency. Hinder för Klimatomställning i Processindustrin; Swedish Energy Agency: Eskilstuna, Sweden, 2019; Volume 49. [Google Scholar]
  165. Swedish Energy Agency. Riksintresse Vindbruk 2013; Swedish Energy Agency: Eskilstuna, Sweden, 2013. [Google Scholar]
  166. Energimyndigheten; Naturvårdsverket. Strategi för Hållbar Vindkraftsutbyggnad—Miljömålsrådsåtgärd 2018; Naturvårdsverket: Stockholm, Sweden, 2018. [Google Scholar]
  167. CEMA; CECE. CECE and CEMA: Optimising our Industry to Reduce Emissions; CECE: Kuala Lumpur, Malaysia, 2011. [Google Scholar]
  168. Preston Aragonès, M.; Serafimova, T. Zero Emission Construction Sites: The Possibilities and Barriers of Electric Construction Machinery—Bellona Europa; Bellona Publishing House: Warsaw, Poland, 2018. [Google Scholar]
  169. Davis, S.J.; Lewis, N.S.; Shaner, M.; Aggarwal, S.; Arent, D.; Azevedo, I.L.; Benson, S.M.; Bradley, T.; Brouwer, J.; Chiang, Y.M.; et al. Net-zero emissions energy systems. Science 2018, 360, 6396. [Google Scholar] [CrossRef] [PubMed] [Green Version]
  170. Giesekam, J.; Barrett, J.R.; Taylor, P. Construction sector views on low carbon building materials. Build. Res. Inf. 2016, 44, 423–444. [Google Scholar] [CrossRef]
  171. Kadefors, A.; Uppenberg, S.; Olsson, J.A.; Balian, D. Procurement Requirements for Carbon Reduction in Infrastructure Construction Projects; Formas: Stockholm, Sweden, 2019. [Google Scholar]
  172. Åhman, M. Perspective: Unlocking the “Hard to Abate” Sectors. 2020. Available online: https://www.researchgate.net/publication/340837433_Perspective_Unlocking_the_Hard_to_Abate_Sectors (accessed on 10 June 2020).
  173. Bataille, C.G.F. Physical and policy pathways to net-zero emissions industry. Wiley Interdiscip. Rev. Clim. Chang. 2020, 11, 1–20. [Google Scholar] [CrossRef]
  174. Abergel, T.; Dean, B.; Dulac, J. GLOBAL STATUS REPORT 2017 Towards a Zero-emission, Efficient, and Resilient Buildings and Construction Sector; United Nations Environment Programme: Nairobi, Kenya, 2017; ISBN 9789280736861. [Google Scholar]
  175. IRP; UN Environment. The Weight of Cities: Resource Requirements of Future Urbanization—A Report by the International Resource Panel; United Nations Environment Programme: Nairobi, Kenya, 2019. [Google Scholar]
  176. UNEP. City-Level Decoupling: Urban Resource Flows and the Governance of Infrastructure Transitions. A Report of the Working Group on Cities of the International Resource Panel; United Nations Environment Programme: Nairobi, Kenya, 2013. [Google Scholar]
  177. Gibbs, M.J.; Soyka, P.; Coneely, D.; Kruger, D. Global CO2 Emissions from Cement Production–Good Practice Guidance and Uncertainty Management in National Greenhouse Gas Inventories CO2; CICERO Center for International Climate Research: Oslo, Norway, 2006; Volume 10. [Google Scholar]
  178. Leeson, D.; Mac Dowell, N.; Shah, N.; Petit, C.; Fennell, P.S. A Techno-economic analysis and systematic review of carbon capture and storage (CCS) applied to the iron and steel, cement, oil refining and pulp and paper industries, as well as other high purity sources. Int. J. Greenh. Gas Control 2017, 61, 71–84. [Google Scholar] [CrossRef]
  179. Vatopoulos, K.; Tzimas, E. Assessment of CO2 capture technologies in cement manufacturing process. J. Clean. Prod. 2012, 32, 251–261. [Google Scholar] [CrossRef]
  180. Kuramochi, T.; Ramírez, A.; Turkenburg, W.; Faaij, A. Comparative assessment of CO2 capture technologies for carbon-intensive industrial processes. Prog. Energy Combust. Sci. 2012, 38, 87–112. [Google Scholar] [CrossRef]
  181. Cormos, C.C.; Cormos, A.M.; Petrescu, L. Assessing the CO2Emissions Reduction from Cement Industry by Carbon Capture Technologies: Conceptual Design, Process Integration and Techno-economic and Environmental Analysis; Elsevier Masson SAS: Issy-les-Moulineaux, France, 2017; Volume 40, ISBN 9780444639653. [Google Scholar]
  182. Limbachiya, M.; Bostanci, S.C.; Kew, H. Suitability of BS EN 197-1 CEM II and CEM V cement for production of low carbon concrete. Comput. Chem. Eng. 2014, 71, 397–405. [Google Scholar] [CrossRef]
  183. Zhou, D.; Wang, R.; Tyrer, M.; Wong, H.; Cheeseman, C. Sustainable infrastructure development through use of calcined excavated waste clay as a supplementary cementitious material. J. Clean. Prod. 2017, 168, 1180–1192. [Google Scholar] [CrossRef]
  184. Scrivener, K.L.; John, V.M.; Gartner, E.M. Eco-efficient cements: Potential economically viable solutions for a low-CO2 cement-based materials industry. Cem. Concr. Res. 2018, 114, 2–26. [Google Scholar] [CrossRef]
  185. HYBRIT. Summary of Findings from HYBRIT Pre-Feasibility Study 2016–2017; Hybrit: Stockholm, Sweden, 2018. Available online: https://www.wko.at/service/aussenwirtschaft/hybrit-brochure.pdf (accessed on 13 March 2018).
  186. Worrell, E.; Blinde, P.; Neelis, M.; Blomen, E.; Masanet, E. Energy Efficiency Improvement and Cost Saving Opportunities for the U.S. Iron and Steel Industry–An ENERGY STAR® Guide for Energy and Plant Managers–Iron_Steel_Guide.pdf; 2020. Available online: https://www.osti.gov/servlets/purl/1026806 (accessed on 6 June 2020).
  187. Bastante-Ceca, M.J.; Cerezo-Narváez, A.; Piñero-Vilela, J.-M.; Pastor-Fernández, A. Determination of the Insulation Solution that Leads to Lower CO2 Emissions during the Construction Phase of a Building. Energies 2019, 12, 2400. [Google Scholar] [CrossRef] [Green Version]
  188. IEA. CO2 Emissions from Fuel Combustion—Highlights; International Energy Agency: Paris, France, 2017; Volume 53. [Google Scholar]
  189. Naturvårdsverket. Vägledning i Klimatklivet-Beräkna Utsläppsminskning; Naturvårdsverket: Stockholm, Sweden, 2018; Volume 1. [Google Scholar]
  190. Benhelal, E.; Zahedi, G.; Shamsaei, E.; Bahadori, A. Global strategies and potentials to curb CO2 emissions in cement industry. J. Clean. Prod. 2013, 51, 142–161. [Google Scholar] [CrossRef]
  191. Aranda Usón, A.; López-Sabirón, A.M.; Ferreira, G.; Llera Sastresa, E. Uses of alternative fuels and raw materials in the cement industry as sustainable waste management options. Renew. Sustain. Energy Rev. 2013. [Google Scholar] [CrossRef]
  192. Moro, A.; Lonza, L. Electricity carbon intensity in European Member States: Impacts on GHG emissions of electric vehicles. Transp. Res. Part D Transp. Environ. 2018, 64, 5–14. [Google Scholar] [CrossRef]
  193. European Energy Agency CO2 Emissions Intensity Electricity Generation. Available online: https://www.eea.europa.eu/ds_resolveuid/3f6dc9e9e92b45b9b829152c4e0e7ade (accessed on 1 May 2020).
  194. Statens Energimyndighet. Fyra Framtider—Energisystemet Efter 2020. 2016. Available online: https://www.energimyndigheten.se/globalassets/klimat--miljo/fyra-framtider/fyra-framtider-for-skarmlasning.pdf (accessed on 12 September 2018).
  195. EEA. Trends and Projections in Europe 2018—Tracking Progress towards Europe’s Climate and Energy Targets; European Environment Agency: Copenhagen, Denmark, 2018. [Google Scholar]
  196. Junnila, S.; Horvath, A.; Guggemos, A.A. Life-cycle assessment of office buildings in Europe and the United States. J. Infrastruct. Syst. 2006, 12, 10–17. [Google Scholar] [CrossRef]
  197. Wallhagen, M.; Glaumann, M.; Malmqvist, T. Basic building life cycle calculations to decrease contribution to climate change—Case study on an office building in Sweden. Build. Environ. 2011, 46, 1863–1871. [Google Scholar] [CrossRef]
  198. Ylmén, P.; Peñaloza, D.; Mjörnell, K. Life cycle assessment of an office building based on site-specific data. Energies 2019, 12, 2588. [Google Scholar] [CrossRef] [Green Version]
  199. Luo, Z.; Yang, L.; Liu, J. Embodied carbon emissions of office building: A case study of China’s 78 office buildings. Build. Environ. 2016, 95, 365–371. [Google Scholar] [CrossRef] [Green Version]
  200. Rodrigues, V.; Martins, A.A.; Nunes, M.I.; Quintas, A.; Mata, T.M.; Caetano, N.S. LCA of constructing an industrial building: Focus on embodied carbon and energy. Energy Procedia 2018, 153, 420–425. [Google Scholar] [CrossRef]
  201. Bonamente, E.; Cotana, F. Carbon and energy footprints of prefabricated industrial buildings: A systematic life cycle assessment analysis. Energies 2015, 8, 12685–12701. [Google Scholar] [CrossRef] [Green Version]
  202. Bonamente, E.; Merico, M.C.; Rinaldi, S.; Pignatta, G.; Pisello, A.L.; Cotana, F.; Nicolini, A. Environmental impact of industrial prefabricated buildings: Carbon and Energy Footprint analysis based on an LCA approach. Energy Procedia 2014, 61, 2841–2844. [Google Scholar] [CrossRef] [Green Version]
  203. Erlandsson, M.; Malmqvist, T. Olika byggsystem av betong och trä där mix av material inklusive stål ger klimatfördelar. Bygg och Tek. 2018, 7, 25–29. [Google Scholar]
  204. Larsson, M.; Erlandsson, M.; Malmqvist, T.; Kellner, J. Climate Impact of Constructing an Apartment Building with Exterior Walls and Frame of Cross-laminated Timber—the Strandparken Residential Towers; IVL Swedish Environmental Research Institute AB: Stockholm, Sweden, 2017. [Google Scholar]
  205. Monahan, J.; Powell, J.C. An embodied carbon and energy analysis of modern methods of construction in housing: A case study using a lifecycle assessment framework. Energy Build. 2011, 43, 179–188. [Google Scholar] [CrossRef]
  206. Petrovic, B.; Myhren, J.A.; Zhang, X.; Wallhagen, M.; Eriksson, O. Life cycle assessment of a wooden single-family house in Sweden. Appl. Energy 2019, 251, 113253. [Google Scholar] [CrossRef]
  207. Hall, A.; Högberg, A.; Ingelhag, G.; Ljungstedt, H.; Perzon, M.; Stalheim, N.J. Hoppet—The first fossil free preschool. IOP Conf. Ser. Earth Environ. Sci. 2019, 323. [Google Scholar] [CrossRef]
  208. Tulevech, S.M.; Hage, D.J.; Jorgensen, S.K.; Guensler, C.L.; Himmler, R.; Gheewala, S.H. Life cycle assessment: A multi-scenario case study of a low-energy industrial building in Thailand. Energy Build. 2018, 168, 191–200. [Google Scholar] [CrossRef]
Figure 1. Schematic figure of material flow mapping for buildings and transport infrastructure construction in Sweden. The height of the category to frame-type boxes represent the approximate relative sizes of the associated emissions. Regarding materials, the dark orange boxes depict materials studied in detail, while the dark orange contours in the primary production column depict material production processes evaluated in detail. The analysis also includes emissions from mass and material transport and construction processes.
Energies 13 04136 g001
Figure 2. Schematic illustration of the calculation of concrete, cement, and Supplementary Cementitious Material (SCM) demand, along with associated energy demand and emissions for concrete manufacture and SCM. Boxes linked with an encircled x are multiplied, a box linked with an encircled x combined with 1-in brackets are reduced by the percentage figure in the box closest to the brackets, while a box linked via an encircled minus sign is subtracted. Boxes with thick outlines are metrics that are adaptable over time in the pathways depending on the abatement measures applied, while boxes with cursive texts are input data provided in Table A1 and Table A2 in Appendix A. The initial material demand figure is only adaptable in the sensitivity analysis. Blue boxes are result figures. The cement demand figure is used as input for the cement production calculation, as displayed in Figure 3.
Energies 13 04136 g002
Figure 3. Schematic illustration of the calculation of emissions and energy demand per energy source for cement production. The cement production figure stems from the concrete calculation depicted in Figure 2. Boxes linked with an encircled x are multiplied, a box linked with an encircled x combined with 1-in brackets are reduced by the percentage figure in the box closest to the brackets, while a box linked via an encircled minus sign is subtracted, and boxes linked with an encircled plus sign are added up. Boxes with thick outlines are metrics that are adaptable over time in the pathways depending on the abatement measures applied, while boxes with cursive texts are input data provided in Table A1, Table A2, and Table A3 in Appendix A. Blue boxes are result figures.
Energies 13 04136 g003
Figure 4. Schematic illustration of the calculation of emissions and energy demand per energy source for steel production. Boxes linked with an encircled x are multiplied, a box linked via an encircled minus sign is subtracted, and boxes linked with an encircled plus sign are added up. Boxes with thick outlines are metrics that are adaptable over time in the pathways depending on the abatement measures applied, while boxes with cursive texts are input data provided in Table A1, Table A2, and Table A3 in Appendix A. The initial material demand figure is only adaptable in the sensitivity analysis. Blue boxes are result figures.
Energies 13 04136 g004
Figure 5. Range of greenhouse gas (GHG) emissions reduction potential for the abatement options identified in the literature review for the main emissions sources (color coded). The study analysis is based around reaching the medium-high range of the emission reduction potentials for each selected abatement measure when fully implemented. The Supplementary Material provides full details of measures for all activities, including timelines, potentials, and references.
Energies 13 04136 g005
Figure 6. Carbon impact from (a) construction of buildings and (b) construction of transport infrastructure with the size of the pie charts reflecting the relative magnitude of emissions.
Energies 13 04136 g006
Figure 7. Energy use for each energy carrier over time for the buildings and transport infrastructure pathways.
Energies 13 04136 g007
Figure 8. Results on CO2 emissions for the buildings and transport infrastructure pathways from 2020 to 2045.
Energies 13 04136 g008
Figure 9. Sensitivity analysis based on reduced or increased construction demand for the different pathways with (a,b) depicting the impact on total energy demand, and (c,d) depicting the impact on emissions, for low and high construction demand, respectively.
Energies 13 04136 g009
Figure 10. Successful decarbonization of the supply chains for buildings and infrastructure in less than three decades will require the parallel pursuit of emission abatement measures with very different characteristics. Figure adapted from Vogt-Schilb and Hallegatte (2014) [160].
Energies 13 04136 g010
Table 1. Emissions and energy intensity factors along with energy mix in the production of reference materials and energy carriers used in the construction of buildings and transport infrastructure in the base year of 2015.
Reference Materials (m)/ Activities (tc)Unit Emissions   Intensity   E f m   ( tCO 2 / unit ) Energy   Intensity   Q f m   ( MWh / unit ) Energy   mix   q s h , m ,   s   ( % ) CommentReferences
Fossil FuelsCoal/CokeOil/DieselGasFossil WasteBiomassElectricity
Concretem3353656.06%22% 37%17%15%18% cement share (corresponding to 420 kg cement per m3 concrete) as the average of building and infrastructure concrete[7,62,63]
Cementt0.821.35 25% 43%20%10%Cement with 86% cement clinker and 14% alternative binders. Thermal energy in clinker production; electrical energy in cement production[51,64,65]
Reinforce-ment steelt0.782.50 29%1%16% 54%85% scrap-based, 15% primary steel[24,62,66,67,68,69,70,71,72,73,74,75]
Construction steelt2.126.40 64%2%17% 17%Galvanized steel, 100% primary steel[69,71,72,76,77,78,79]
Asphaltt0.350.90100% Hot mix asphalt with 6.2% bitumen. Does not include transports and paving[80,81,82]
Insulationt3.3017.4089% 11%Varying depending on insulation material; Assuming 60% polystyrene and 40% mineral wool[66,74,79,83,84]
Gypsum and plastert0.301.5087% 13%Average of values for gypsum plasterboards[62,79,85,86,87]
Plastict2.5020.0089% 11%Average of polyvinylchloride (PVC) and polyethylene (PE)[37,62,67,74,75,79]
Aluminiumt11.019.7012% 88%Primary aluminium [67,74,75,88,89]
Glasst1.003.5070% 30% [67,74,85,90]
Timbert0.282.6015% 70%15%Average of cross-laminated timber, glulam beams and sawn timber [62,69,75,85,91]
Construction processkWh0.24-2% 64% 17%17%Based on 75% diesel use, 17% electricity use and 8% heat from district heating[11,75,92,93,94]
Material transportskWh0.30- 85% 15% Low biofuel blended diesel (Diesel MK1) with the Swedish national biofuel share from 2015[95]
Table 2. Details of abatement measures applied across pathways with percentage figures depicting the diffusion of the specific mitigation option.
Material/ProcessPathway20252030203520402045
Cement/concreteAll pathways20% alternative binders (SCM)
5% reduced binder intensity
2% wood substitution
25% alternative binders (SCM)
12% reduced binder intensity
3% wood substitution
28% alternative binders (SCM)
15% reduced binder intensity
5% wood substitution
32% alternative binders (SCM)
22% reduced binder intensity
7% wood substitution
35% alternative binders (SCM)
28% reduced binder intensity
10% wood substitution
Biofuel + CCS40% biofuels45% biofuels
45% CCS
50% biofuels
45% CCS
52% biofuels
80% CCS
55% biofuels
90% CCS
Electrification 40% biofuels45% electrification45% electrification90% electrification100% electrification
Material efficiency8%15%20%25%30%
Reinforce-ment steelBiofuel + CCS100% secondary steel10% energy efficiency
7% biofuel
14% biofuel25% biofuel35% biofuel
Electrification 100% secondary steel10% energy efficiency
7% electrification (plasma heating)
14% electrification14% electrification
10% biofuel
14% electrification
21% biofuel
Material efficiency5%10%15%20%25%
Construction steelBiofuel + CCS 20% biofuel 30% biofuel 30% CCS
30% biofuel
60% CCS
30% biofuel
Electrification 20% biofuel 30% biofuel 50% electrification (hydrogen-reduction)100% hydrogen-reduction
Material efficiency10% 15%20%25%30%
Construction equipmentAll pathways5% optimization10% optimization10% optimization10% optimization10% optimization
Biofuel + CCS42% biofuel
9% hybridization
5% electrification
63% biofuel
14% hybridization
9% electrification
78% biofuel
23% hybridization
13% electrification
85% biofuel
31% hybridization
15% electrification
81% biofuel
31% hybridization
19% electrification
Electrification 42% biofue
l9% hybridization
5% electrification
75% biofuel
14% hybridization
9% electrification
76% biofuel
23% hybridization
24% electrification
59% biofuel
23% hybridization
41% electrification
50% biofuel
23% hybridization
50% electrification
Heavy transportsAll pathways5% efficiency/optimization10% efficiency/optimization15% efficiency/optimization20% efficiency/optimization25% efficiency/optimization
Biofuel + CCS42% biofuel
5% electrification
63% biofuel
10% electrification
78% biofuel
15% electrification
80% biofuel
20% electrification
75% biofuel
25% electrification
Electrification42% biofuel
5% electrification
63% biofuel
20% electrification
70% biofuel
30% electrification
55% biofuel
45% electrification
40% biofuel
60% electrification
InsulationAll pathways2% energy efficiency
20% material substitution
4% energy efficiency
50% material substitution
10% electrification
6% energy efficiency
70% material substitution
20% electrification
70% material substitution
30% electrification/CCS
70% material substitution
30% electrification/CCS
Gypsum/plasterAll pathways25% biofuel/material substitution25% biofuel/material substitution
25% recycling
25% biofuel/electrification
50% recycling
50% biofuel/electrification
50% recycling
100% biofuel/electrification
75 recycling
PlasticAll pathways20% energy efficiency/biofuel40% energy efficiency/biofuel40% energy efficiency/biofuel50% electrification/CCS 100% electrification/CCS
Material efficiency5%10%15%20%25%
AsphaltAll pathways66% biofuel
37% recycling
4% energy efficiency
66% biofuel
45% recycling
8% energy efficiency
85% biofuel
50% recycling
12% energy efficiency
85% biofuel
55% recycling
15% energy efficiency
85% biofuel
60% recycling
15% energy efficiency
Table 3. Initial and updated annual emissions estimates per lifecycle stage for building construction in the base year of 2015.
Emissions EstimateBuilding Materials (A1–A3)Transport (A4)Construction Process (A5)
Initial estimate share of embodied emissions (%)85%5%12%
Initial estimate amount of embodied emissions (Mt CO2)6.50.40.9
Updated estimate share of embodied emissions (%)80%9%11%
Updated estimate amount of embodied emissions (Mt CO2)6.30.70.9
Table 4. Initial and updated annual emissions estimates per material for building construction in the base year of 2015. The initial estimates are based on a combination of emissions share data per lifecycle stage for construction of new buildings together with data on construction of different building/frame types, while the updated estimates are the data used in the model after adjustments for refurbishments and validation.
Building Materials (A1–A3)ConcreteReinforcement Steel Construction SteelInsulationGypsum and PlasterPlastic and PaintsOthers (Glass, Aluminium, Timber)
Initial estimate share of building material emissions (%) 44%10%11%8%6%4%17%
Initial estimate amount of material emissions (Mt CO2)2.80.60.70.50.40.31.1
Updated estimate share of building material emissions (%)40%10%11%10%6%4%19%
Updated estimate amount of material emissions (Mt CO2)2.50.60.70.60.40.31.2

