1. Introduction
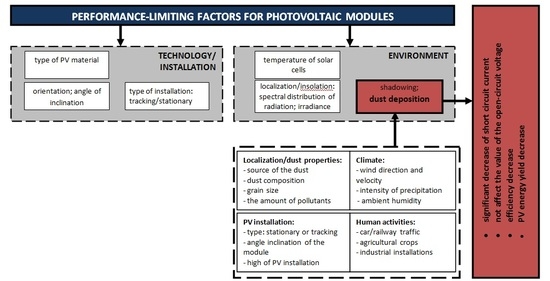
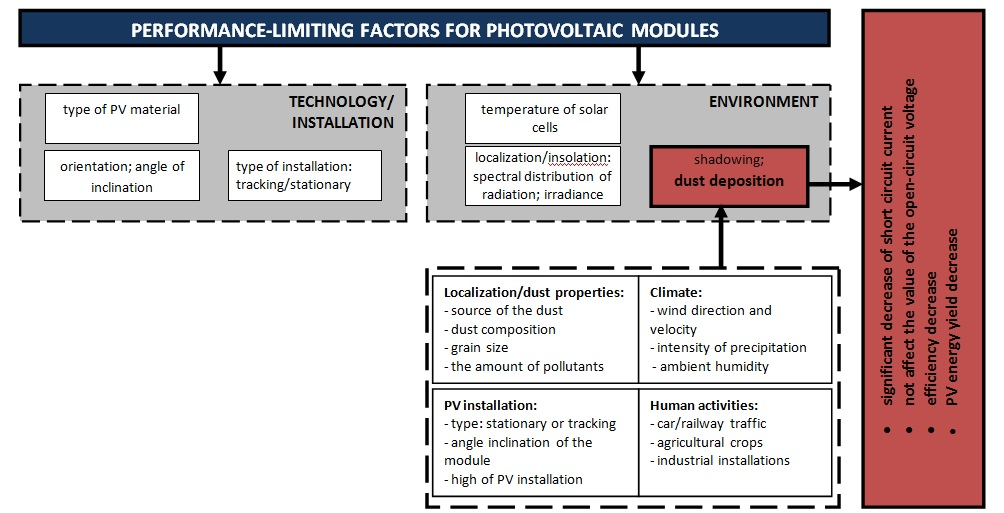
Maximization of the energy generated by photovoltaic (PV) installations is not only connected to providing modules with enhanced efficiency but also restricting elements that may impact it in a negative way. The photovoltaic conversion efficiency of a solar module is affected by several factors, most importantly solar cell material, location and region, module working temperature, inclination angle, orientation, as well as any shadowing and dust covering the surface. The latter issue has been analyzed thoroughly. The overview of research done in the area of soil pollution was presented by Sarver [
1]. Early studies linked dust buildup with the reduction of glass transmittance [
2], which directly corresponds to lessened solar irradiance reaching solar cells [
3]. This process could be divided into two parts: firstly, the accumulation phase responsible for a linear decrease of transparency, and the second phase of molecule deposition on top of the already existing dust layer [
3,
4]. Many research groups observed the correlation of short-circuit current decline with the amount of accumulated pollution on the front glass cover of PV modules [
5,
6,
7,
8,
9,
10,
11,
12]. An example of this relationship is presented in the thorough work of Al-Hasan [
6] and Rao [
9], as they take into consideration short-circuit current and power at the maximum power point. Their approach, however, does not account for a situation when the dust is not distributed uniformly on the whole module surface.
Moreover, the type of soil itself is of considerable significance, as pointed out by El-Shobokshy [
13,
14], Kaldellis [
15,
16], and Aïssa [
17]. Dust consisting of grains with a smaller diameter ensures a more uniform distribution on the surface, thus blocking light with better efficiency than bigger grains.
Frequent precipitation is one of the key factors affecting dust accumulation, as it may be helpful in removing some part of the pollution on the PV module’s surface [
18]. However, it should also be noted that high humidity facilitates molecule adhesion, thus intensifying the soiling effect [
19,
20]. Additionally, module positioning also greatly influences the overall amount of accumulated dust. The more vertical the module tilt angle is, the lesser amount of dust will affix to the glass surface [
21,
22,
23].
It seems to be most productive to analyze the soiling issue in the context of the PV installation location, as it determines the average amount of dust covering the module surface, its size and composition, and the amount and intensity of precipitation. Only then can a suitable approach be introduced, since the vast majority of research on the soiling effect in PV was done for dry climates, without taking into account other environmental conditions dictated by the specificity of seaside locations. Therefore, the aim of this study was defined as introducing the relationship between the surface density of soil and the change of electrical parameters—in this case, efficiency. The suggested approach is helpful in drawing comparisons for PV modules with different electrical and physical parameters. Additionally, the influence of the glass surface is highlighted to play a significant role in the overall decrease of working parameters of any solar device.
2. Experimental Section
2.1. The Study of Natural Dust Accumulation
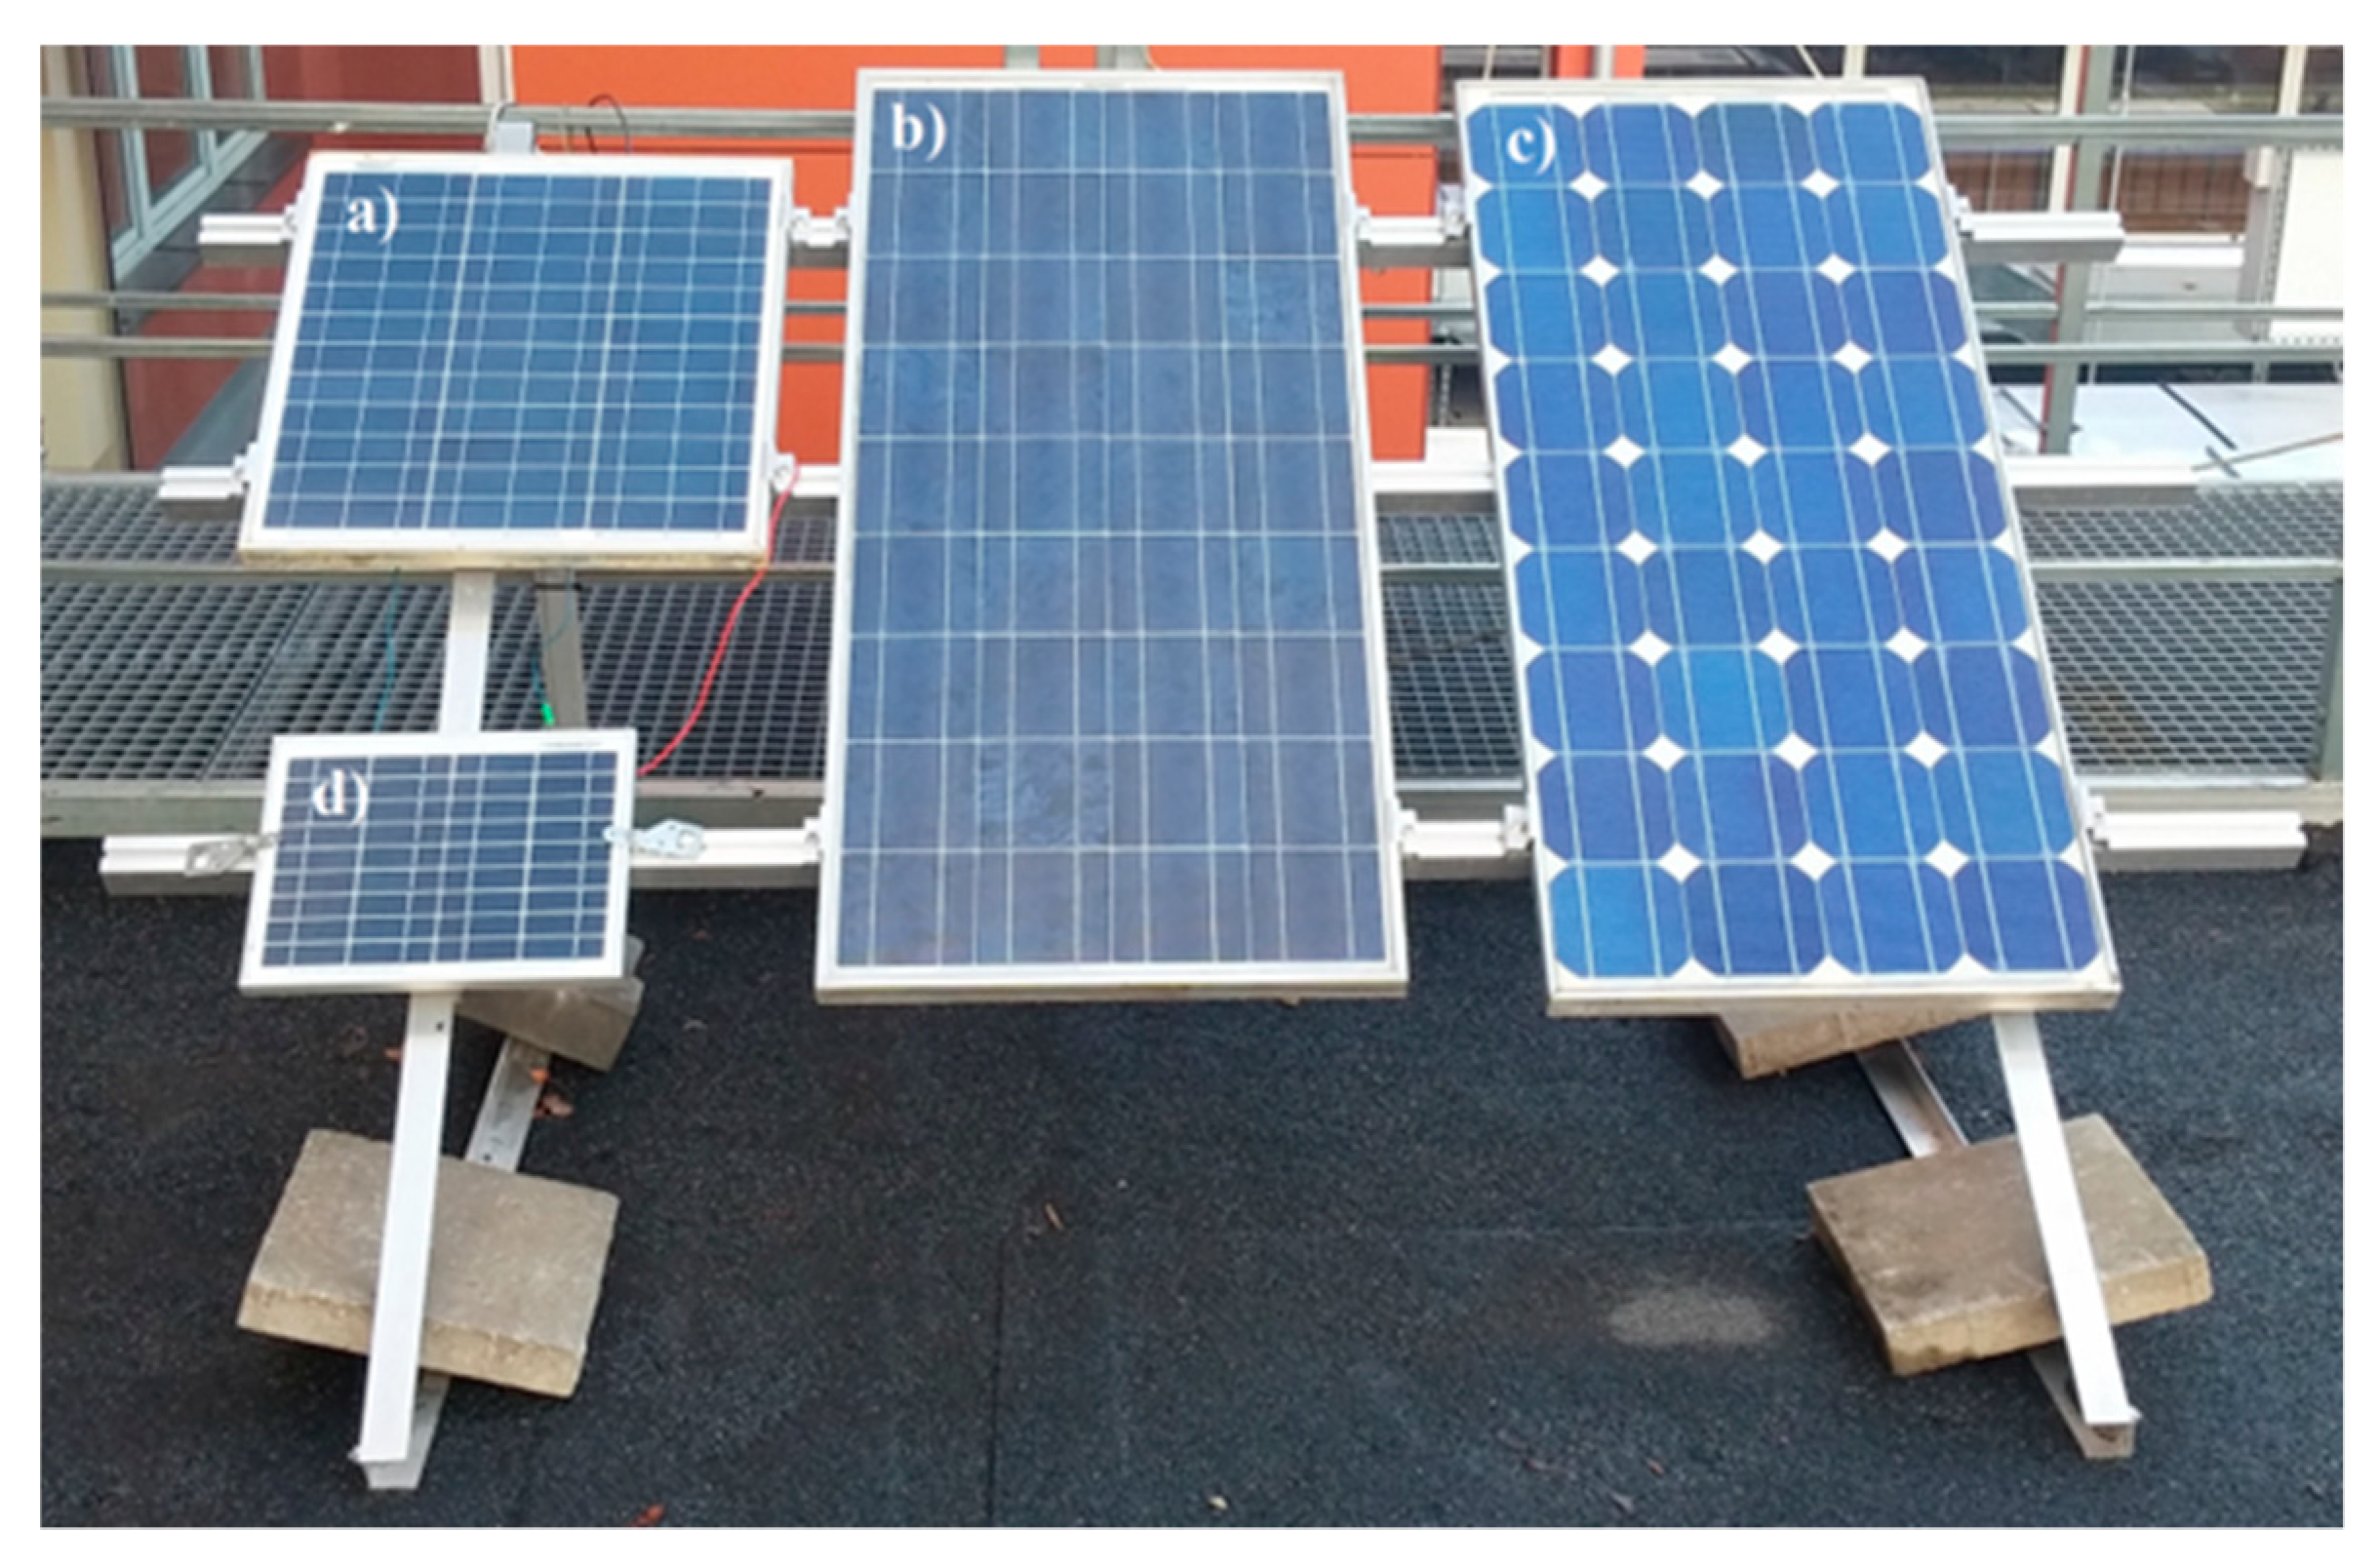
Four photovoltaic modules with different working parameters were fixed to the metal rack on top of the building, as presented in
Figure 1. The building is located in Gdansk, the seaside town in northern Poland, and has coordinates 54°37′ N, 18°62′ E. Their orientation was situated directly south and at a 34° tilt angle with respect to the horizontal surface. Before elevating them on the rooftop, their surface was diligently scraped to remove any pollution and rinsed with isopropyl alcohol several times. The decision to place the stand with modules in external conditions helped to imitate, on a small scale, a phenomenon of dust adhesion on the actual photovoltaic installation. The same mounting position was kept through the years of 2019 and 2020.
Modules MWG-30, AP-7105, and STP-085 were tested each month inside the laboratory hall, and module CLC010-12P was constantly kept outside on the stand. Its purpose was to collect dust without any interruptions, which was scraped off of its surface at the end of the year.
Table 1 contains parameters provided by the three analyzed photovoltaic modules’ manufacturers. Bigger modules—AP-7105 and STP-085—were constructed using both monocrystalline and polycrystalline silicon, respectively.
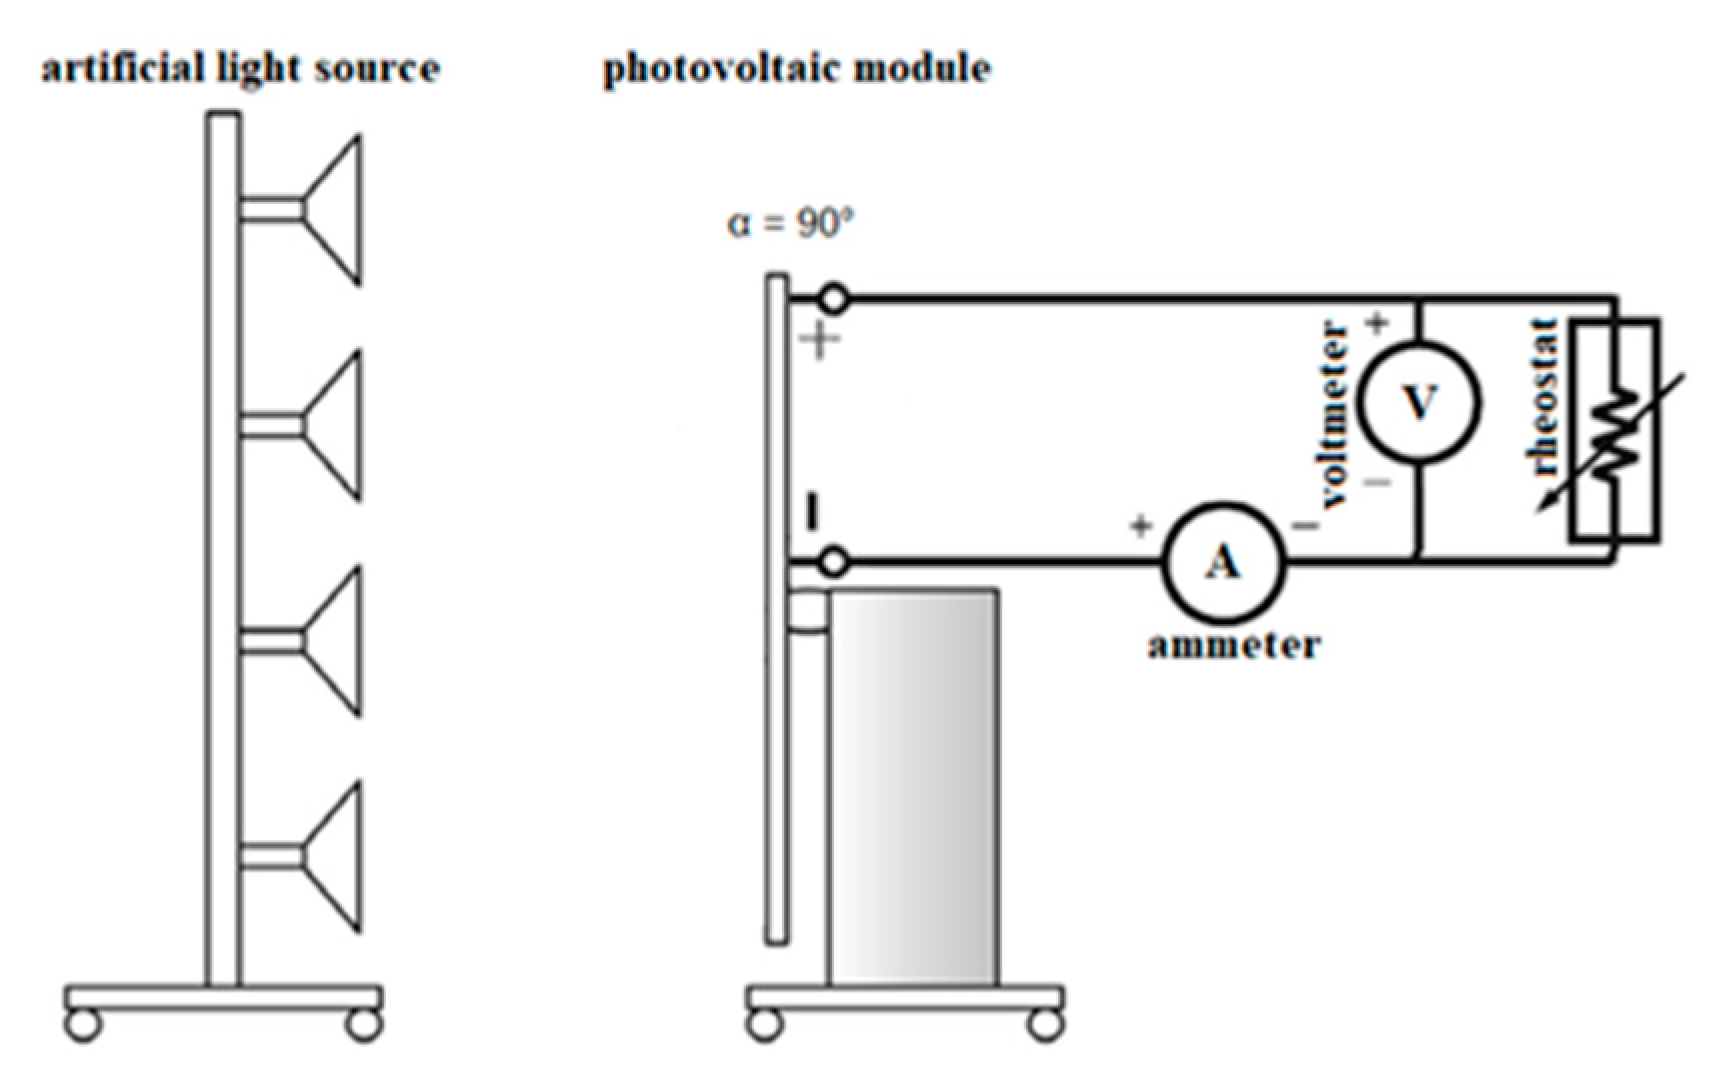
Figure 2 depicts the test stand intended for the monthly measurement taken inside the laboratory hall for the three modules presented above. It was possible to obtain constant 1000 W/m
2 irradiance conditions by placing eight halogen lamps directly perpendicular to the module surface. Each halogen lamp was adjusted separately to ensure uniform light distribution on the PV module surface. This was checked before starting each measurement by taking readouts from a few evenly distributed points on the glass surface—9 points for a smaller MWG-30 module and 12 points for bigger modules, AP-7105 and STP-085. Additionally, the surface temperature was monitored with a pyrometer so that, whenever it exceeded 30 °C, there could be a break in measurement to cool it down. Temperature measurement was taken every 30 s at 5 points, directly in the middle and in four corners, on the front glass cover of the PV module analyzed at that time. Once the current and voltage values were recorded, all three modules were set on the metal frame on the rooftop. Technical data for all of the measuring devices are listed in
Table 2.
2.2. The Study of Artificial Dust Accumulation
At the same time, there was conducted a study aimed at artificially deposited dust. Surface mass density was chosen as a basic unit for drawing any parallels between the working parameters of photovoltaic modules. Each soil type applied in both natural and artificial dust experiments is listed in
Table 3, together with location coordinates. Dust 1 corresponds to the whole pollution scraped off of MWG-30, AP-7105, and STP-085 module surfaces. Dust 2 accumulated throughout the year 2019 was collected from the additional small CLC010-12P module. The sampling point for dust 3 was located near the Chemistry Building of Gdansk University of Technology. As for dust 4, it came solely from the inside of the laboratory hall. The last two places from which dust was gathered were situated in the sandy beach area at coordinates of 54°41′ N, 18°64′ E and 54°41′ N, 18°62′ E, respectively.
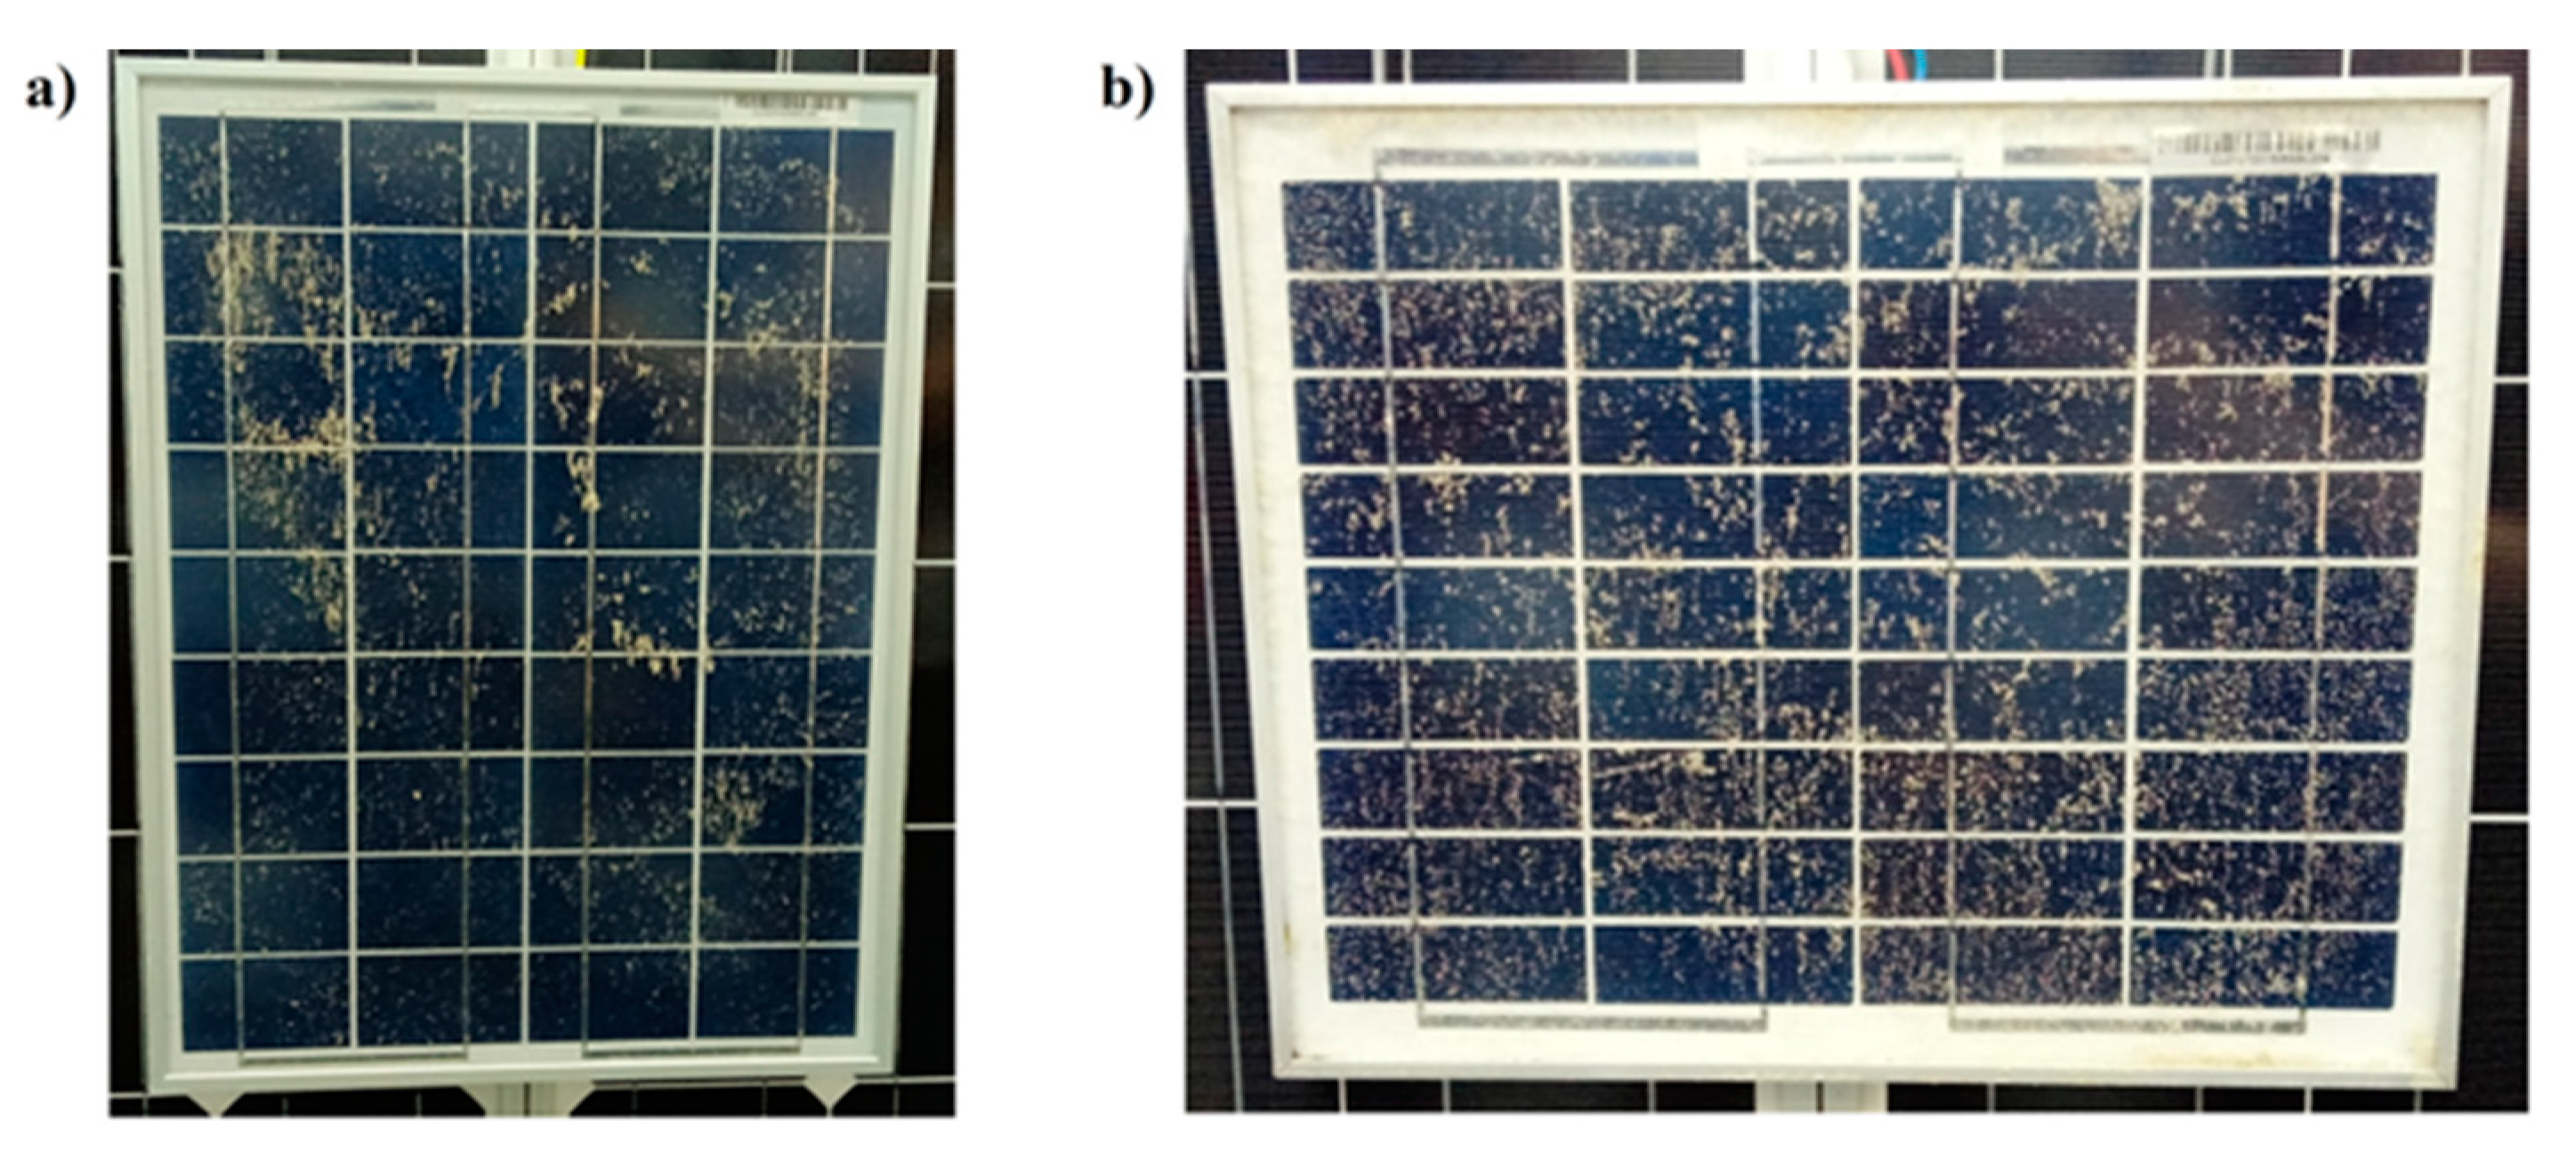
The amount of dust 3, 5, and 6 initially gathered was equal to circa 0.5 kg. Afterward, it was sieved 15–20 times with a 1 mm netted strainer to remove any elements that did not belong to loose debris. In order to obtain the desired layer of dust on the surface of the PV module, the pollutant was once again sieved and then sprayed with isopropyl alcohol to ensure adhesion and uniform distribution. An example of such application is shown in
Figure 3.
Throughout the whole experiment, the same two polycrystalline modules were used—MWG-20 and CLC010-12P. Their electrical parameters, as specified by the producer in the module datasheet, are presented in
Table 4.
3. Results and Discussion
3.1. The Study of Natural Dust Accumulation
The efficiency for MGW-30, AP-7105, and STP-085 modules was calculated on the basis of current-voltage characteristics taken inside the laboratory hall, under an artificial light source. Data were collected from January 2019 to November 2019, and, apart from one-time monthly measurements, the modules were placed outdoors and, as such, were subjected to atmospheric dust buildup.
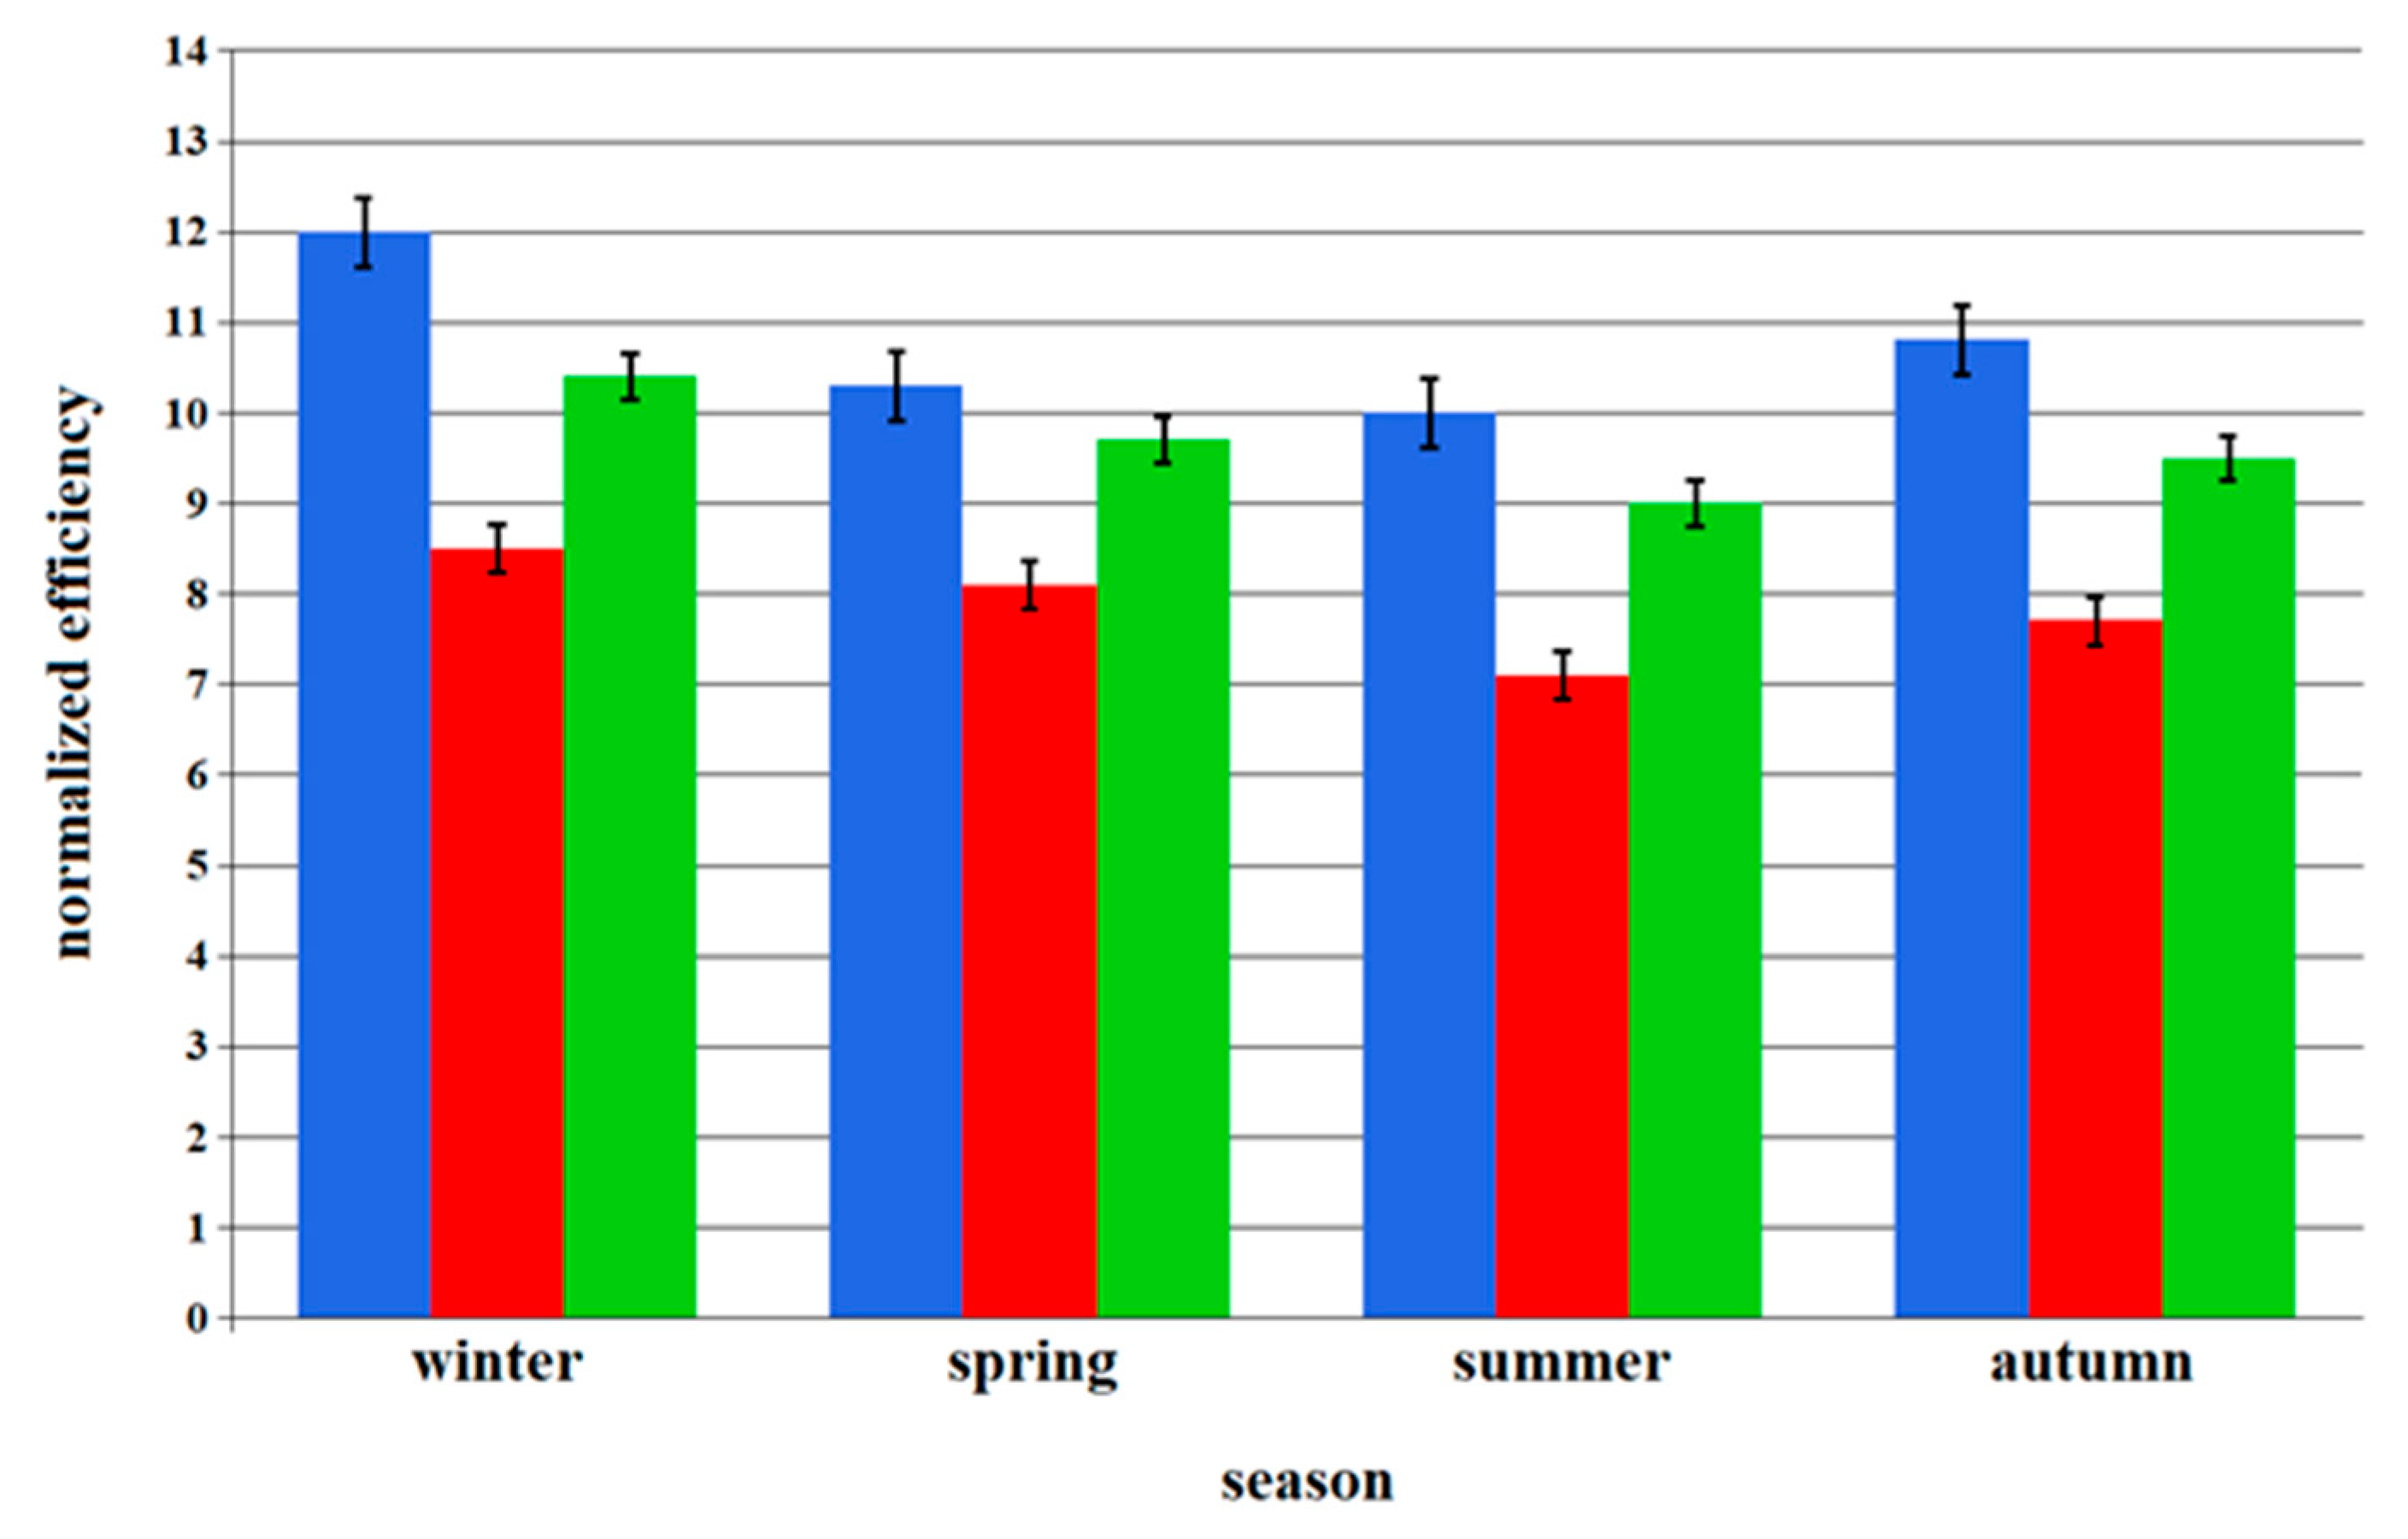
All modules experienced a clear decrease in efficiency over the course of four meteorological seasons, with exact values visualized in
Figure 4. To represent the variability among data, standard error of the mean was assumed for each column because it provides the accuracy of a sample mean. The biggest loss in spring, over 15%, was noted for MWG-30, while the remaining two experienced a much lower reduction, around several percentages. In summer, the opposite effect was observed; efficiency decline was greater for AP-7105 and STP-085 modules, namely 12% and 7%, respectively, with only around 3% for MWG-30. An interesting pattern emerged during the autumn months, as all three PV modules seem to have recovered part of their power. This may be caused by heavy precipitation that is characteristic of that time and location in the north of Poland.
3.2. SEM and EDS Analysis of Natural Dust
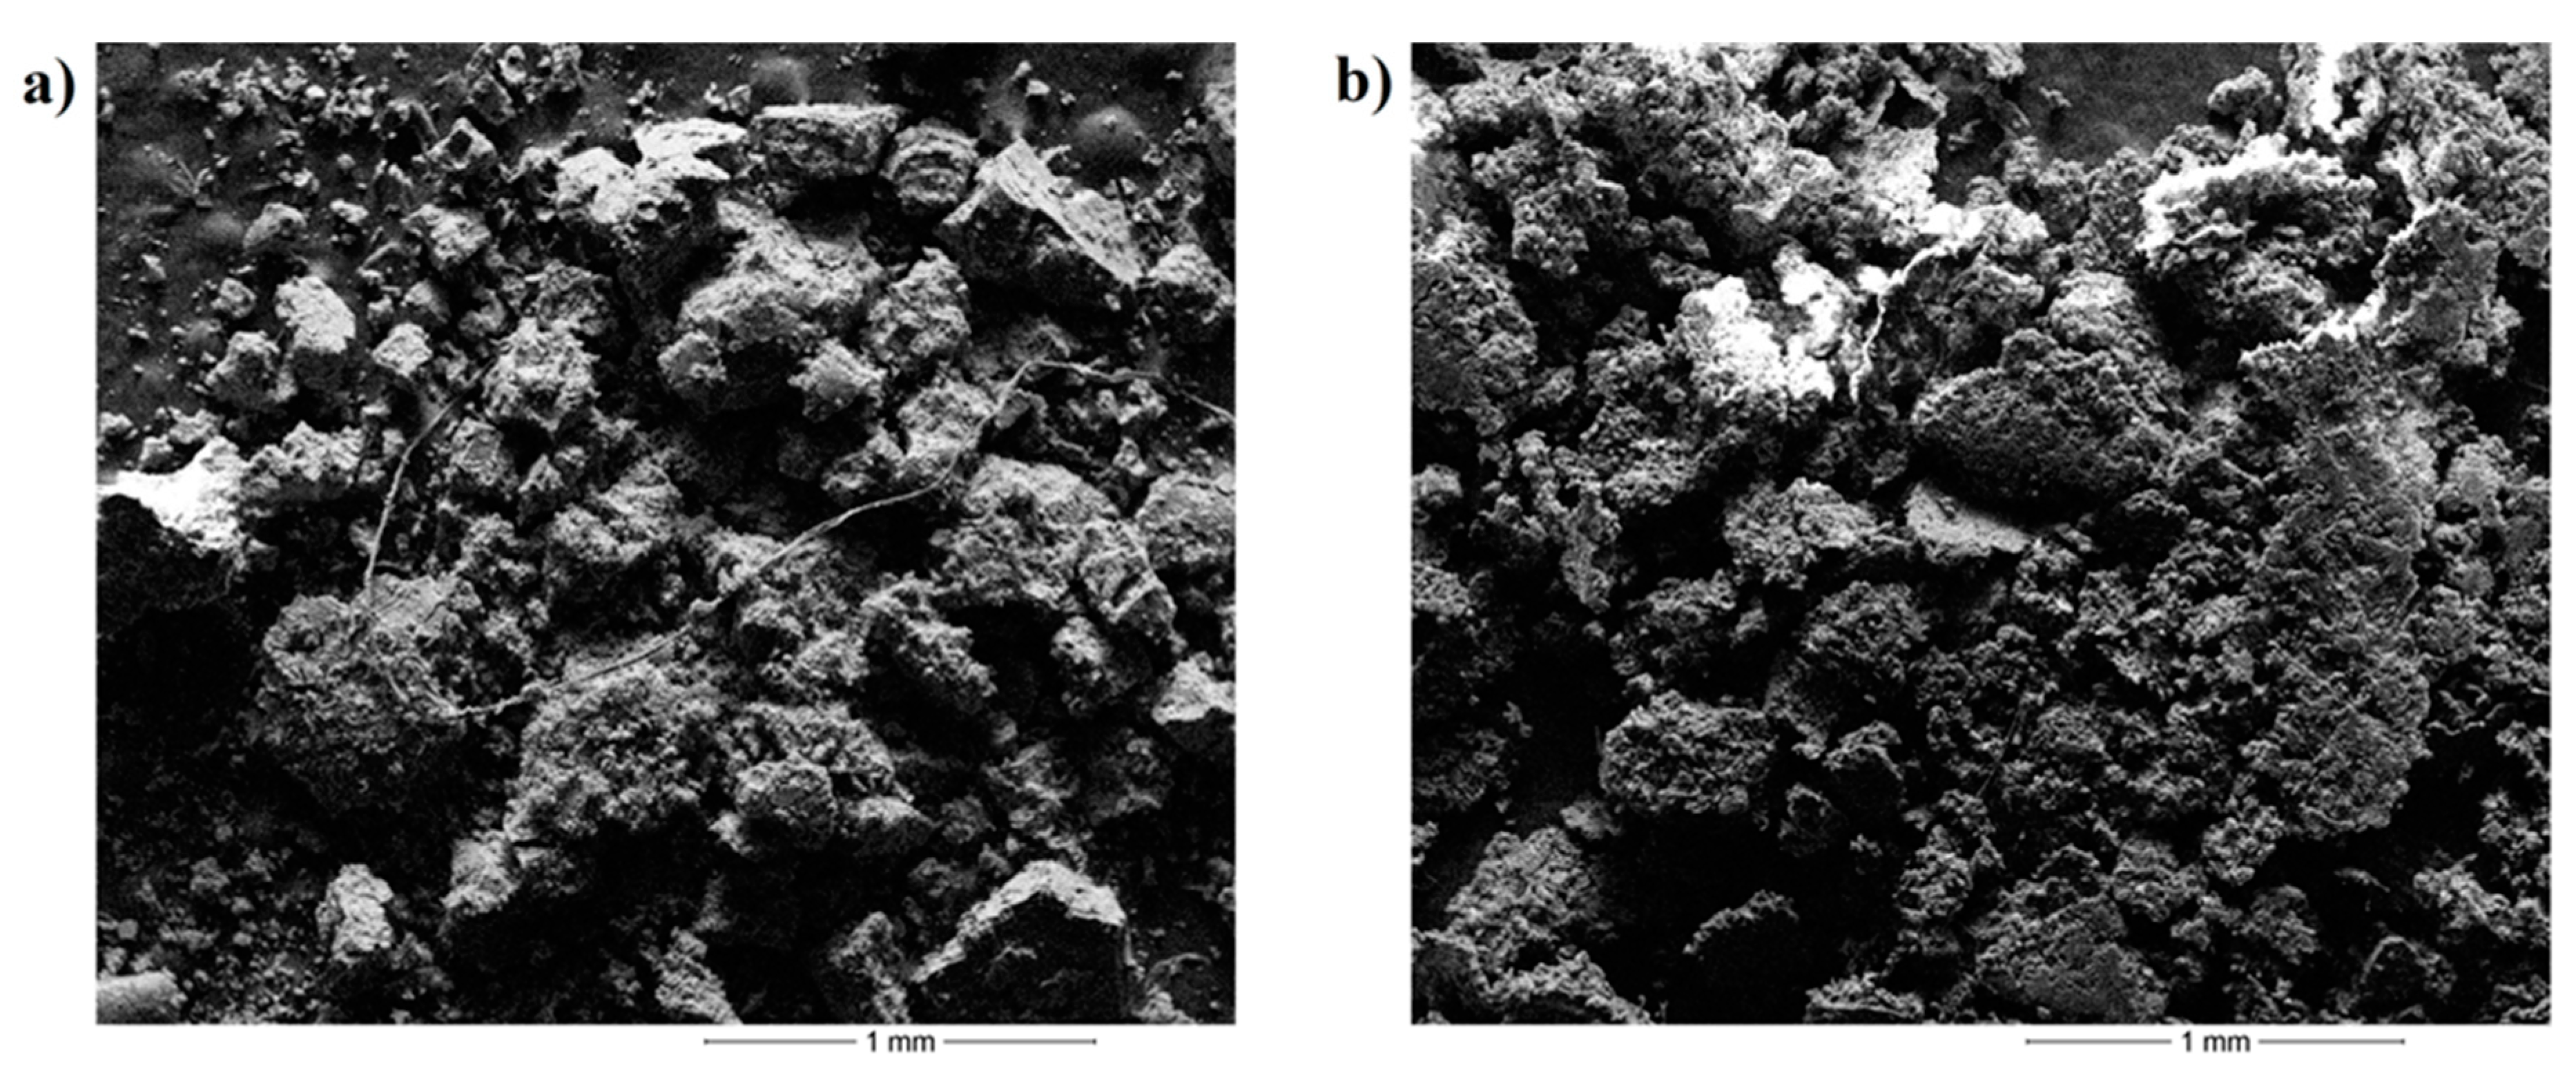
Uneven molecular structure of both dust 1 and dust 2 was captured by means of scanning electron microscopy (SEM)—
Figure 5. Grains differ in size from one another; some have sharply defined edges, while the build of others resembles sponges. In a few places, there is a higher concentration of molecules, which leads to the conclusion that an agglomeration process has already happened over the course of one year, as new pollutant particles gather on top of the old ones.
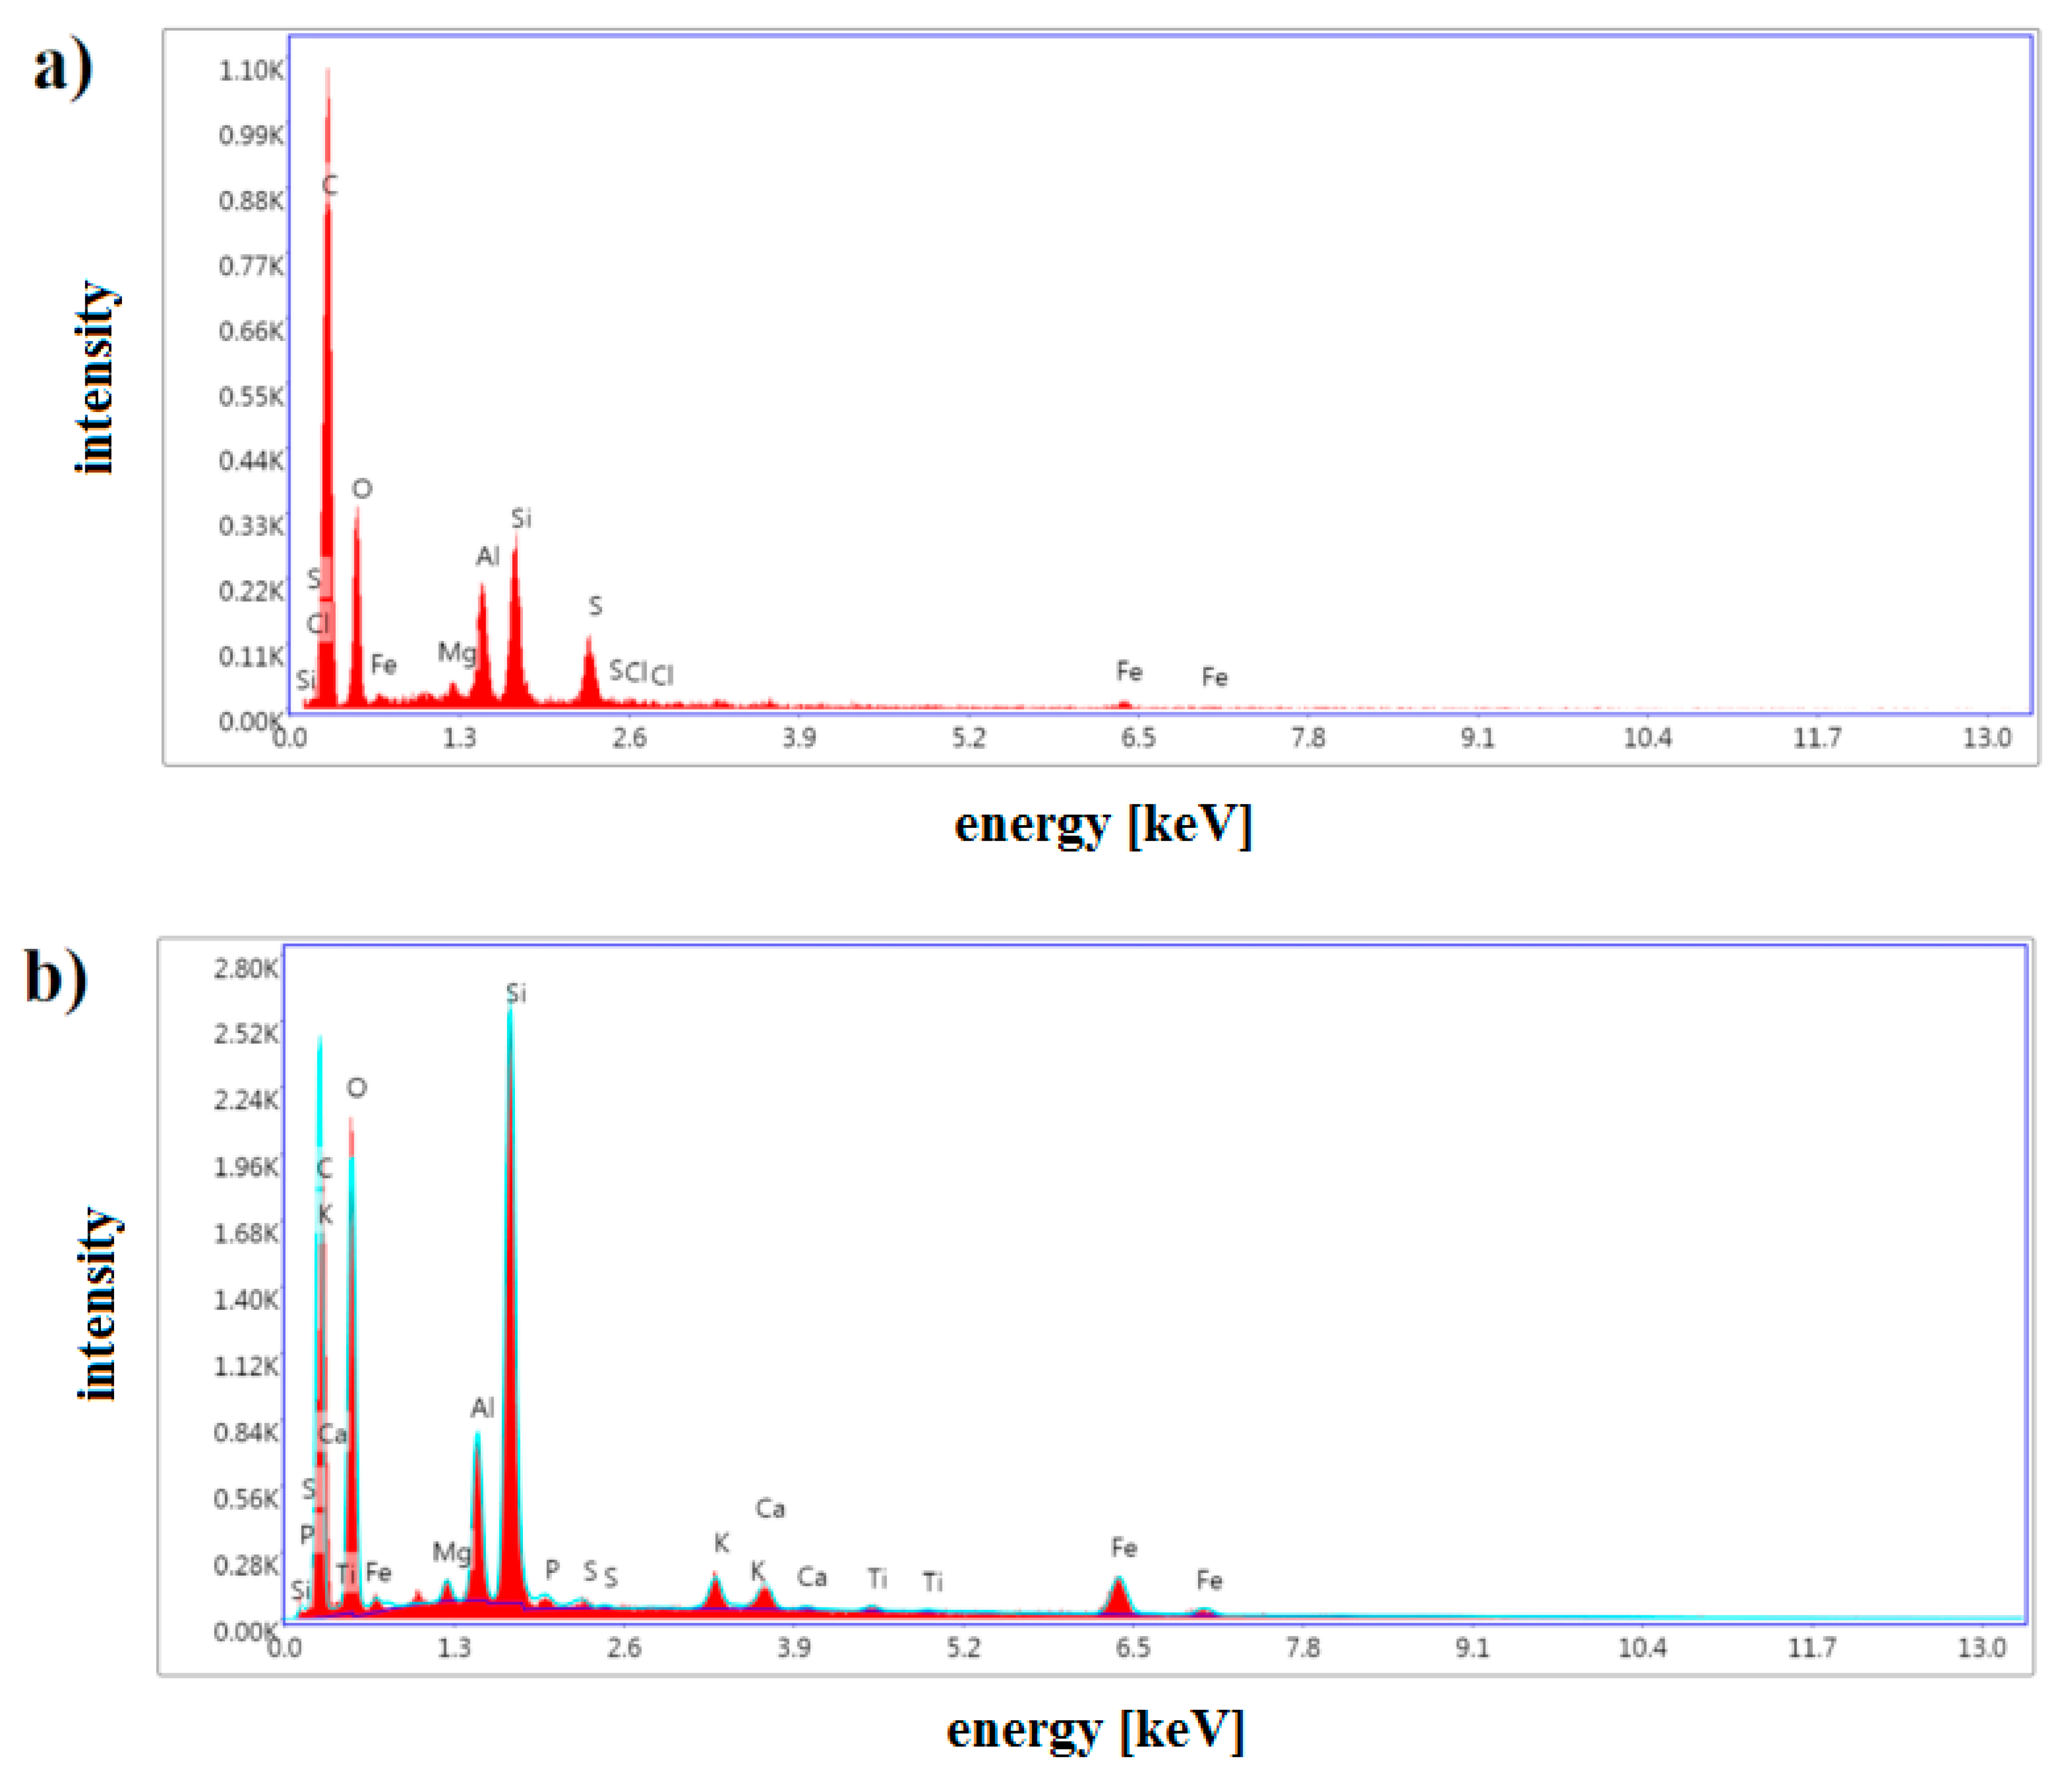
EDS spectra presented in
Figure 6 indicate that both pollutants contain considerable content of oxygen, silicon, aluminum, and trace quantities of iron and magnesium. The carbon peak visible in both graphs is a result of using carbon tape during this measurement and should not be counted as part of dust 1 or 2. Dust 1 has much bigger sulfur content and additional weak peaks from chlorine. In contrast to this pollutant, silicon and oxygen exhibit much stronger intensity in the EDS spectrum for dust 2. The peak for potassium in dust 2 is also different, with much higher intensity, and trace elements of calcium, phosphorous, and titanium appear. That big of a difference in composition between dust 1 and dust 2 could be caused by the specific conditions during the accumulation period in 2019 when construction work directly in front of the location took place for a majority of that year.
3.3. The Study of Artificial Dust Accumulation
Another part of the study was conducted on dust manually sieved above the PV module surface. For this purpose, dust 3, 5, and 6 were used, and two polycrystalline PV modules, MWG-20 and CLC010-12P, were chosen. Irradiance and surface temperature were kept respectively at 1000 W/m
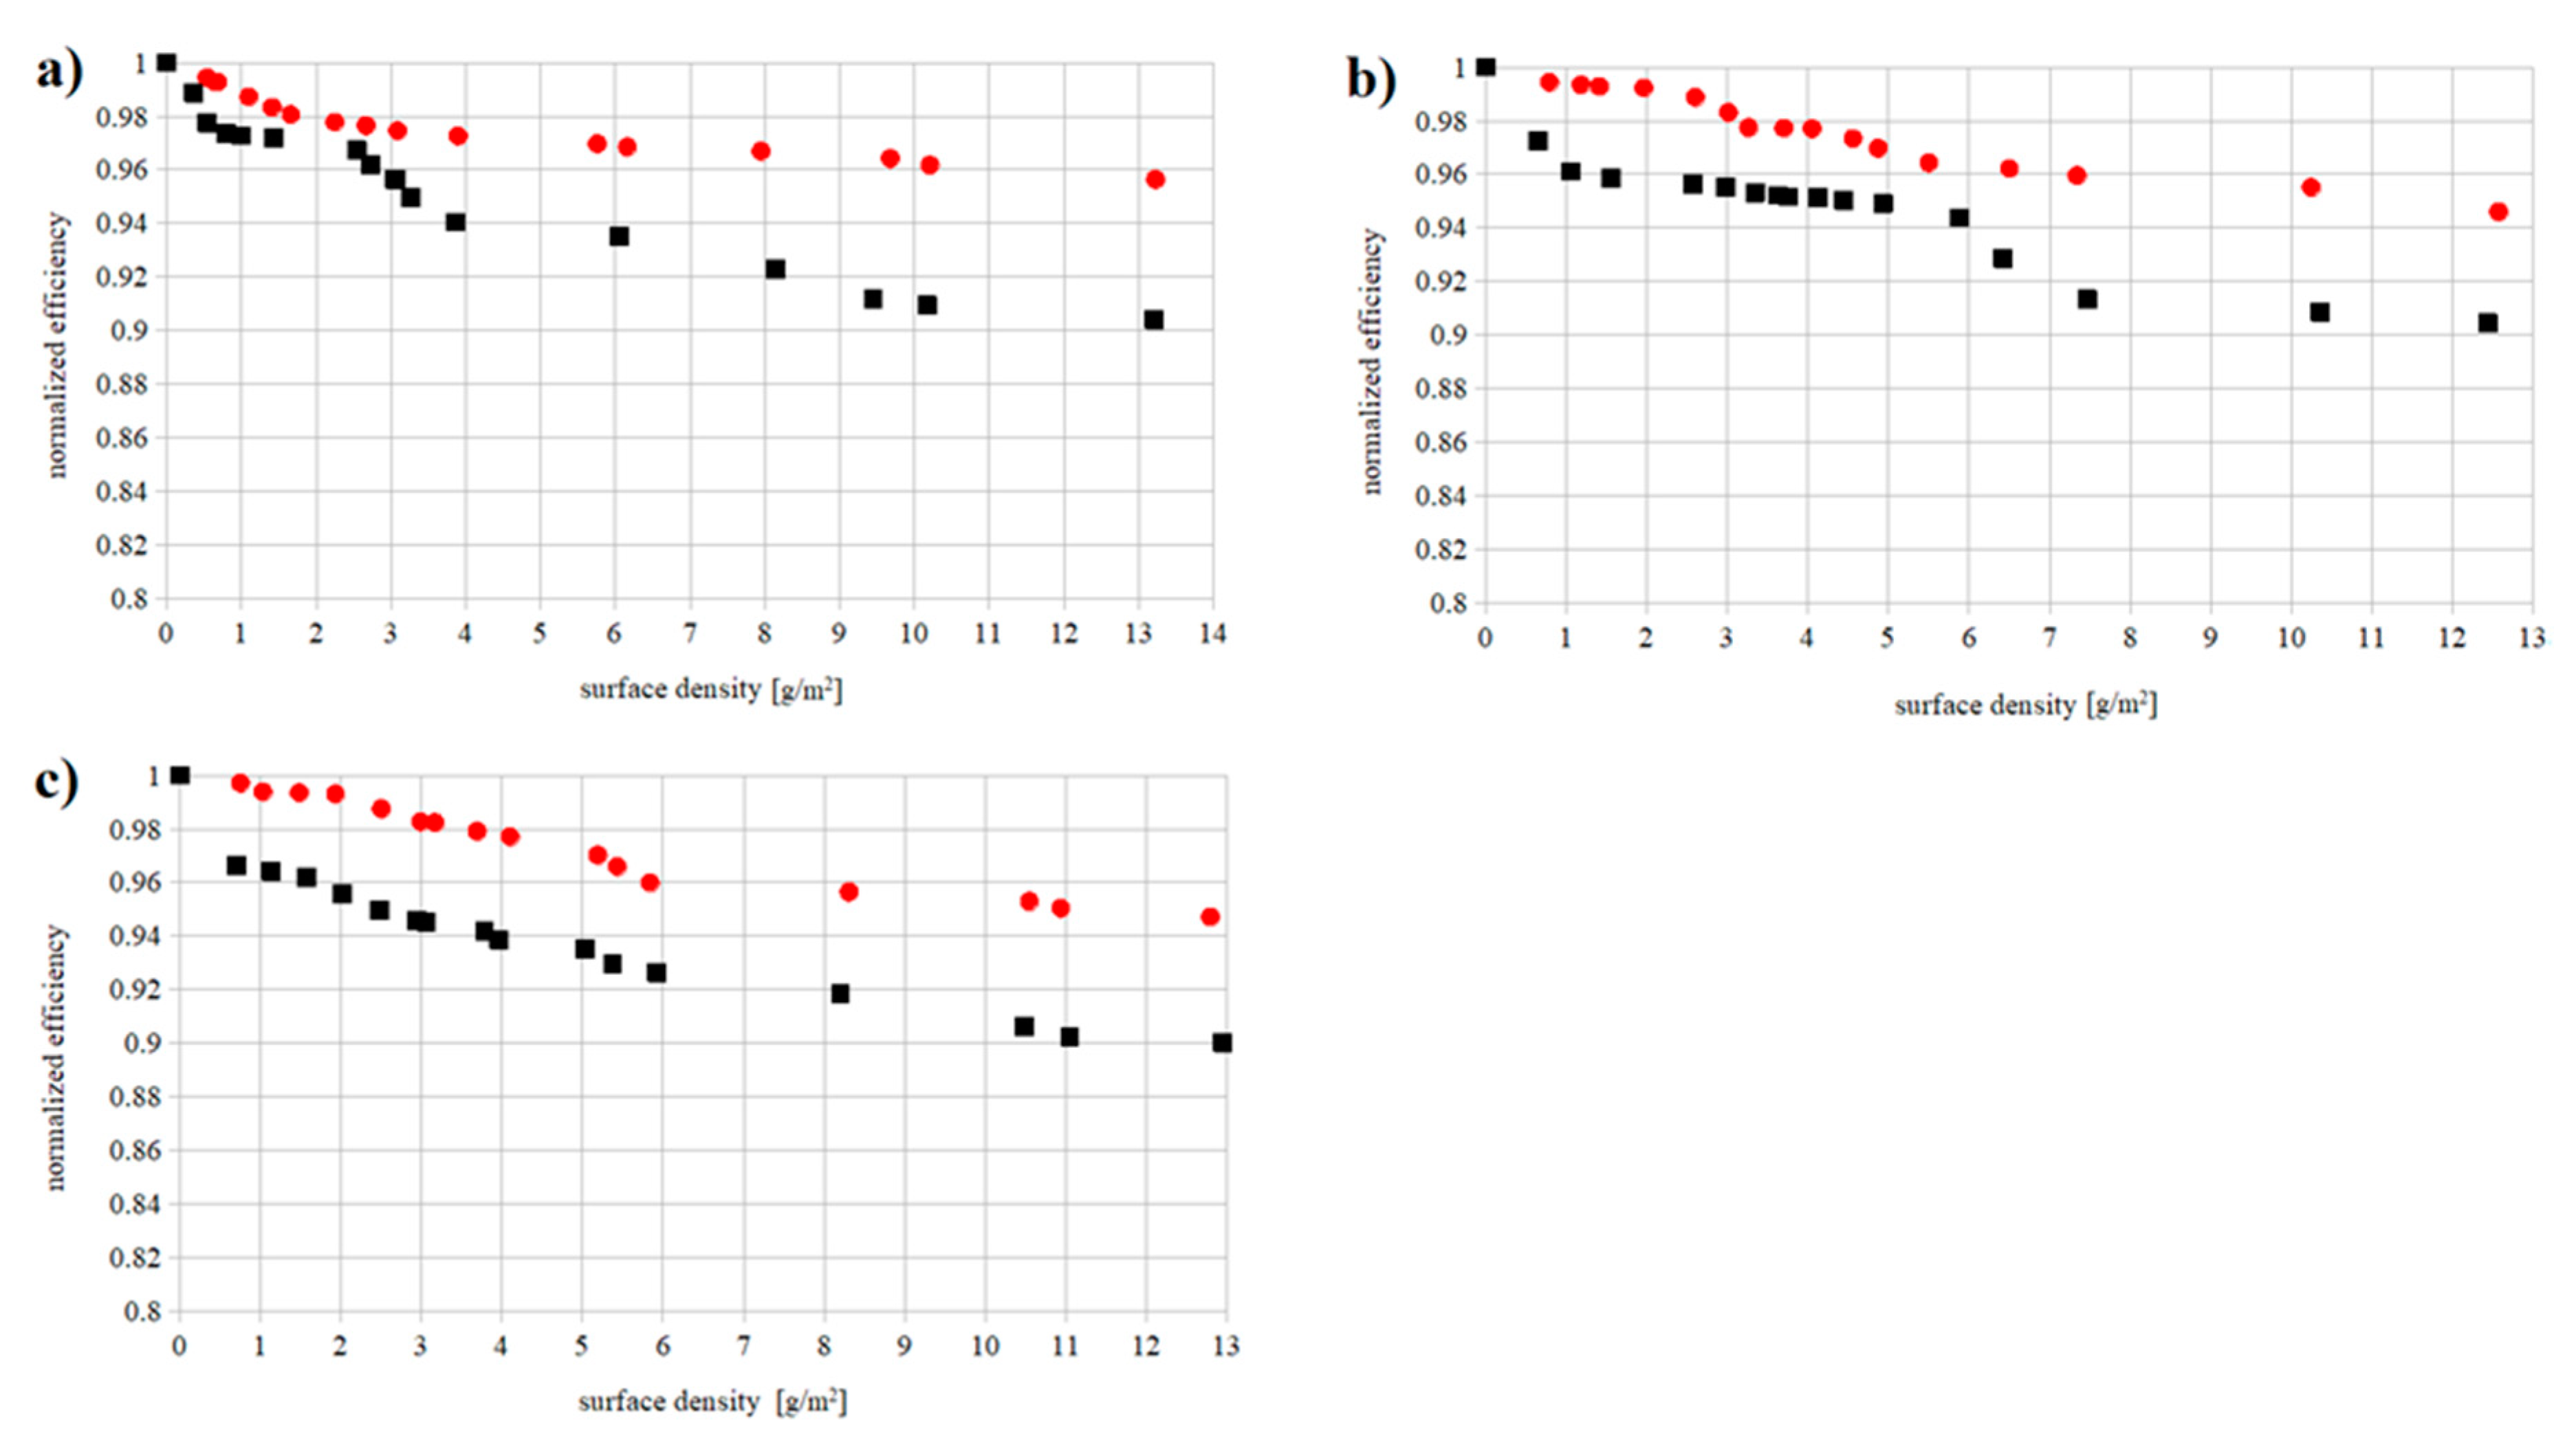
2 and 30 °C. Normalized efficiency was calculated based on obtained current-voltage characteristics, as the efficiency obtained for maximum power generated by the polluted module divided by the efficiency for maximum power generated by the clean module. Both modules were produced as polycrystalline silicon solar cells; however, their response to pollutants was slightly different, as seen in
Figure 7. Below 15 g/m
2, CLC010-12P faced higher efficiency losses, no matter the type of contaminant applied. Already, 3 g/m
2 of surface dust density caused a decrease of nearly 5% of efficiency for this module. For the dust density of the order of 10 g/m
2, this number was even higher and reached around 10%. MWG-20 seemed to better cope with soil contamination, as its efficiency was never reduced by more than 6% for each of the three pollutants.
The analysis was supposed to imitate outdoor conditions that allowed for dust accumulation on PV module surfaces. All three contaminants caused a linear efficiency decrease, which could be attributed to the first phase of dust accumulation reported by many research groups [
4,
6,
9,
13]. The efficiency, however, did not decrease as abruptly as was noted for some other measurements using artificial pollution in laboratory conditions [
6,
7,
8,
9]. The average efficiency reduction obtained in this research for each 1 g/m
2 of dust accumulated on PV module surfaces was 0.77% for CLC-010-12P and 0.38% for MWG-20.
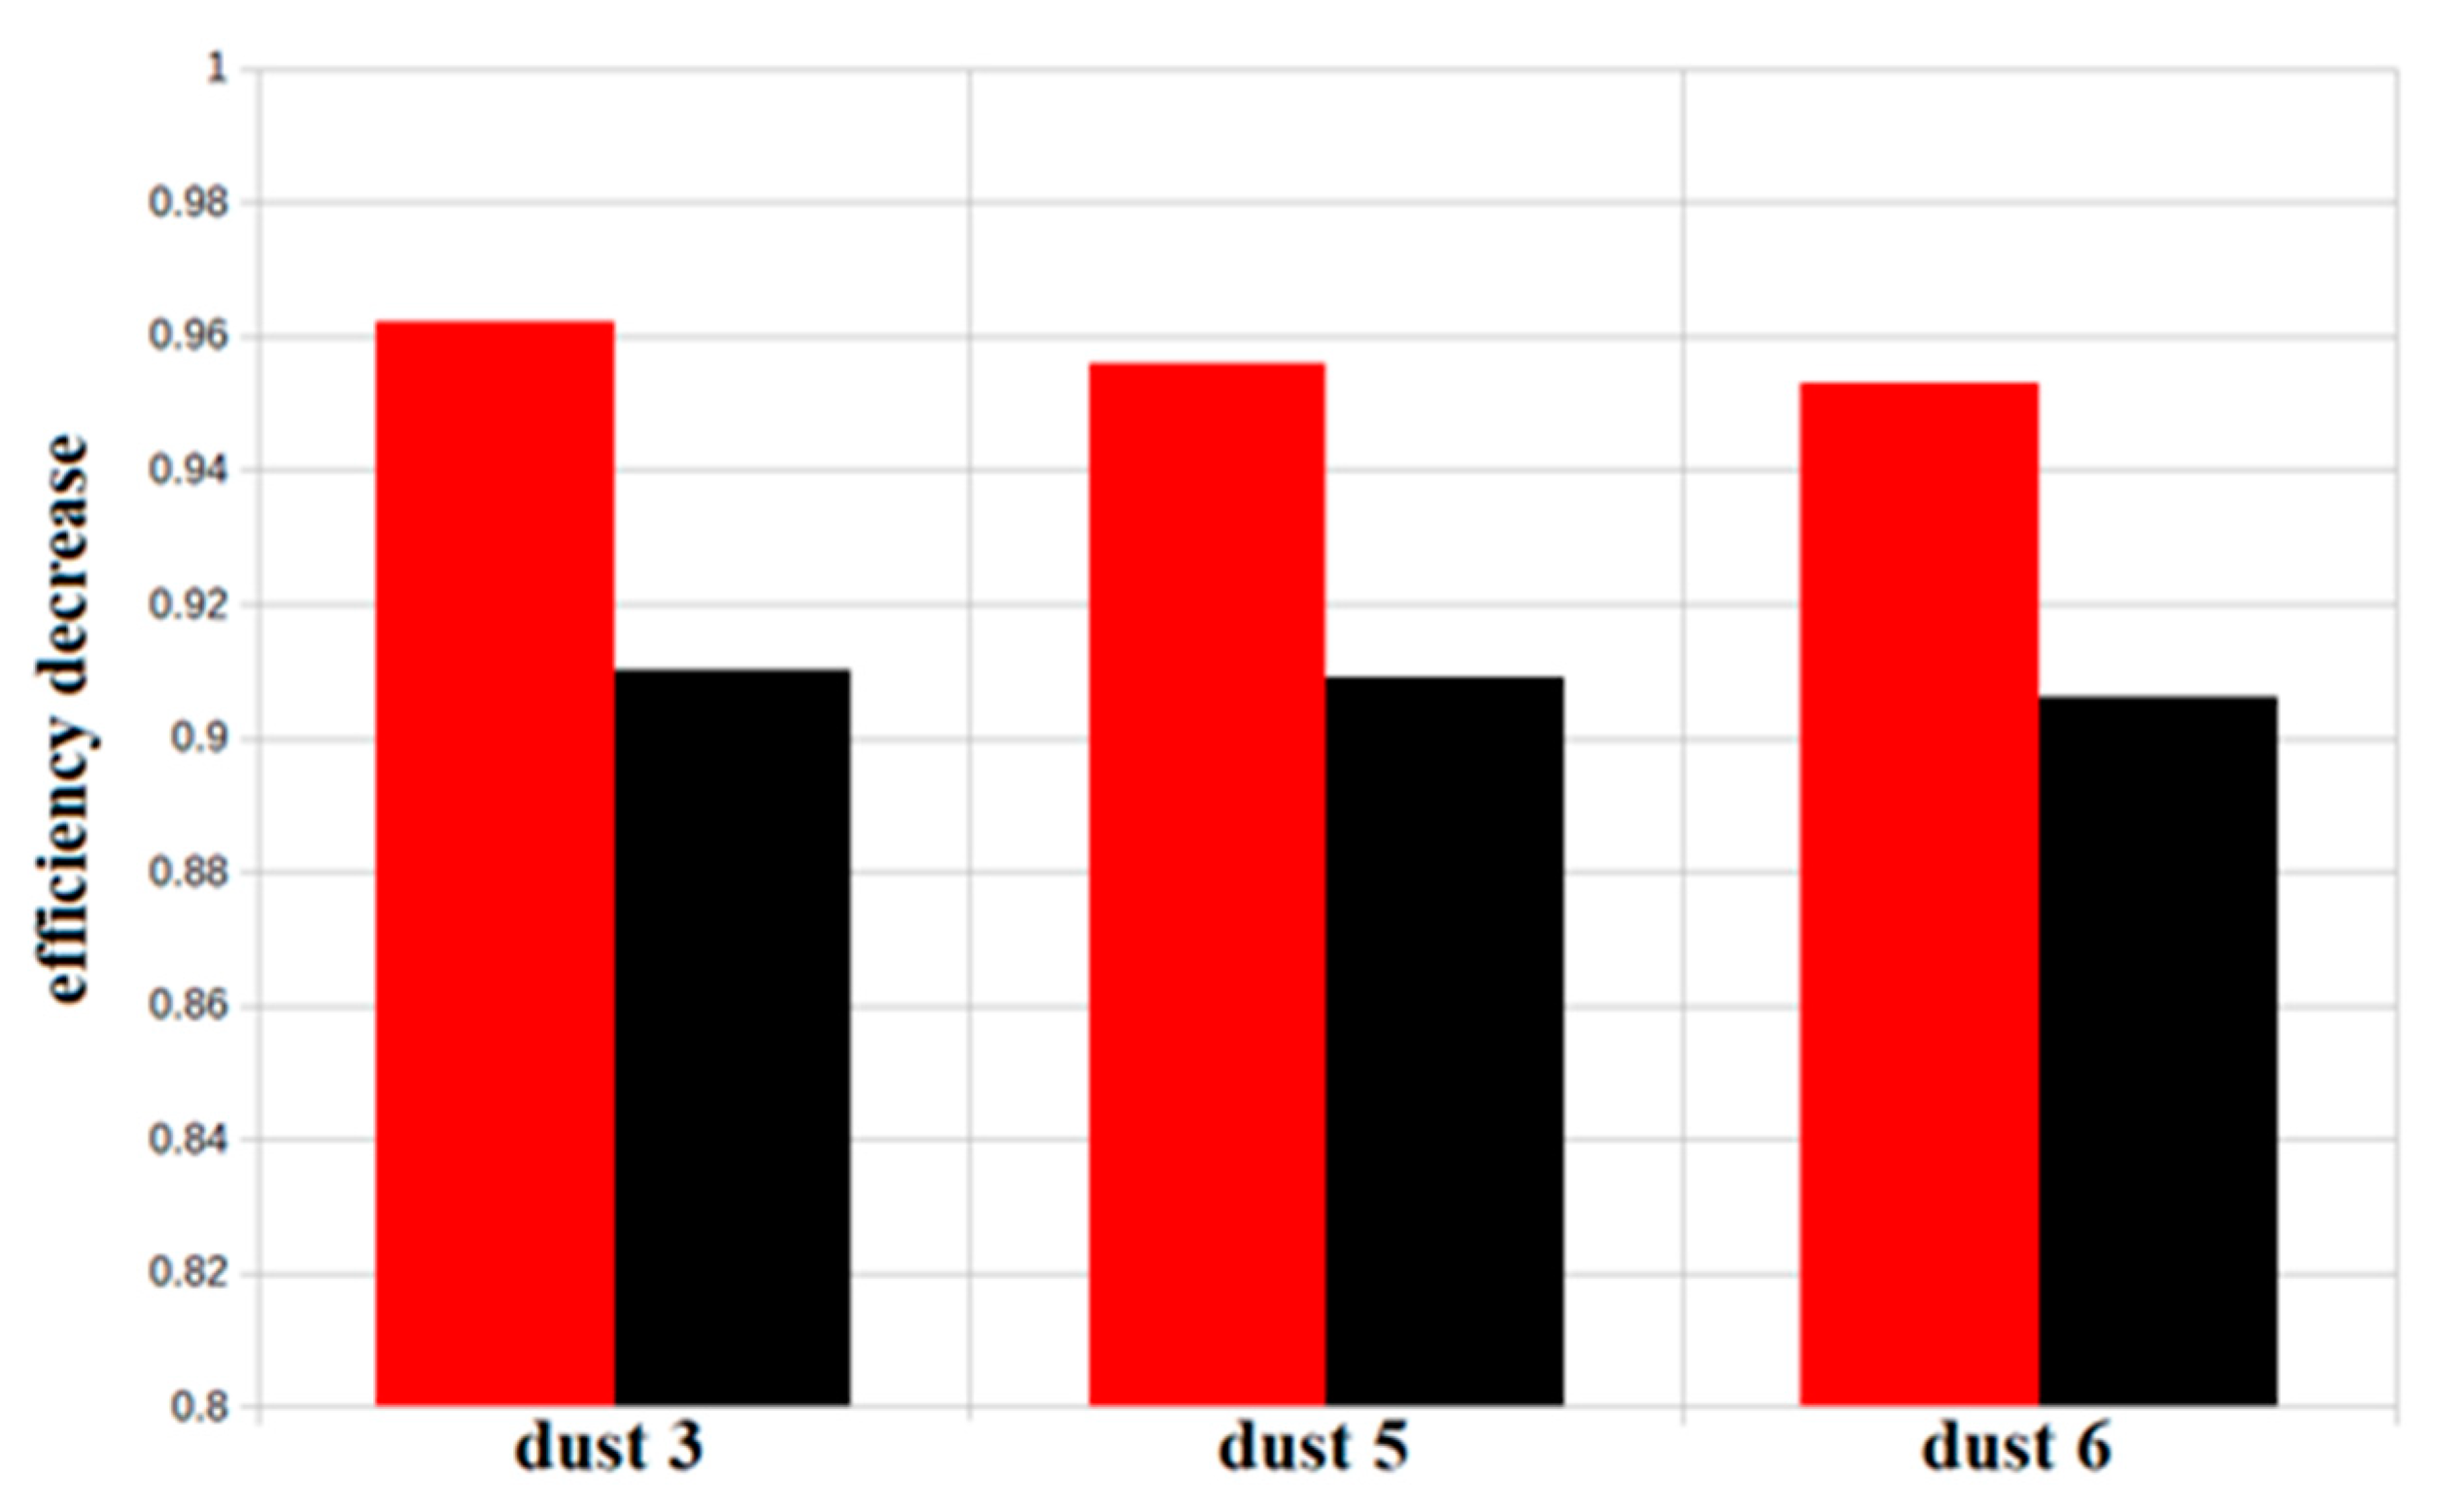
Figure 8 gives a better focus on the issue of contamination for a fixed surface density of 10.4 g/m
2. The efficiency decline was calculated as a ratio of efficiency η after soil contamination to the efficiency η
0 of a clean module. For all three types of dust, it equaled the average of 4.3% for MWG-20 and 9.2% for CLC010-12P. This varying response cannot be explained by the type of module or dust since both were manufactured in the same technology and polluted with only a specific type of dust. The factor of dust composition influencing the electric response in MWG-20 and CLC010-12P may be omitted, as they were both polluted with the same dust type at the time of carrying out the exact measurement. Most probably, it was caused by the glass layer itself, as it is supposed to change in PV modules produced by different companies. This conclusion is supported by an analysis of results obtained by two independent research groups—under Cabanillas’ [
24] and Gandhi’s [
25] supervision. Efficiency decrease acquired in those experiments does not appear to exhibit any correlation to the solar cell type (monocrystalline or polycrystalline).
3.4. SEM and EDS Analysis of Artificial Dust
Pictures taken by SEM in
Figure 9 present dust types gathered from three different outside locations and from the laboratory hall. Unlike in
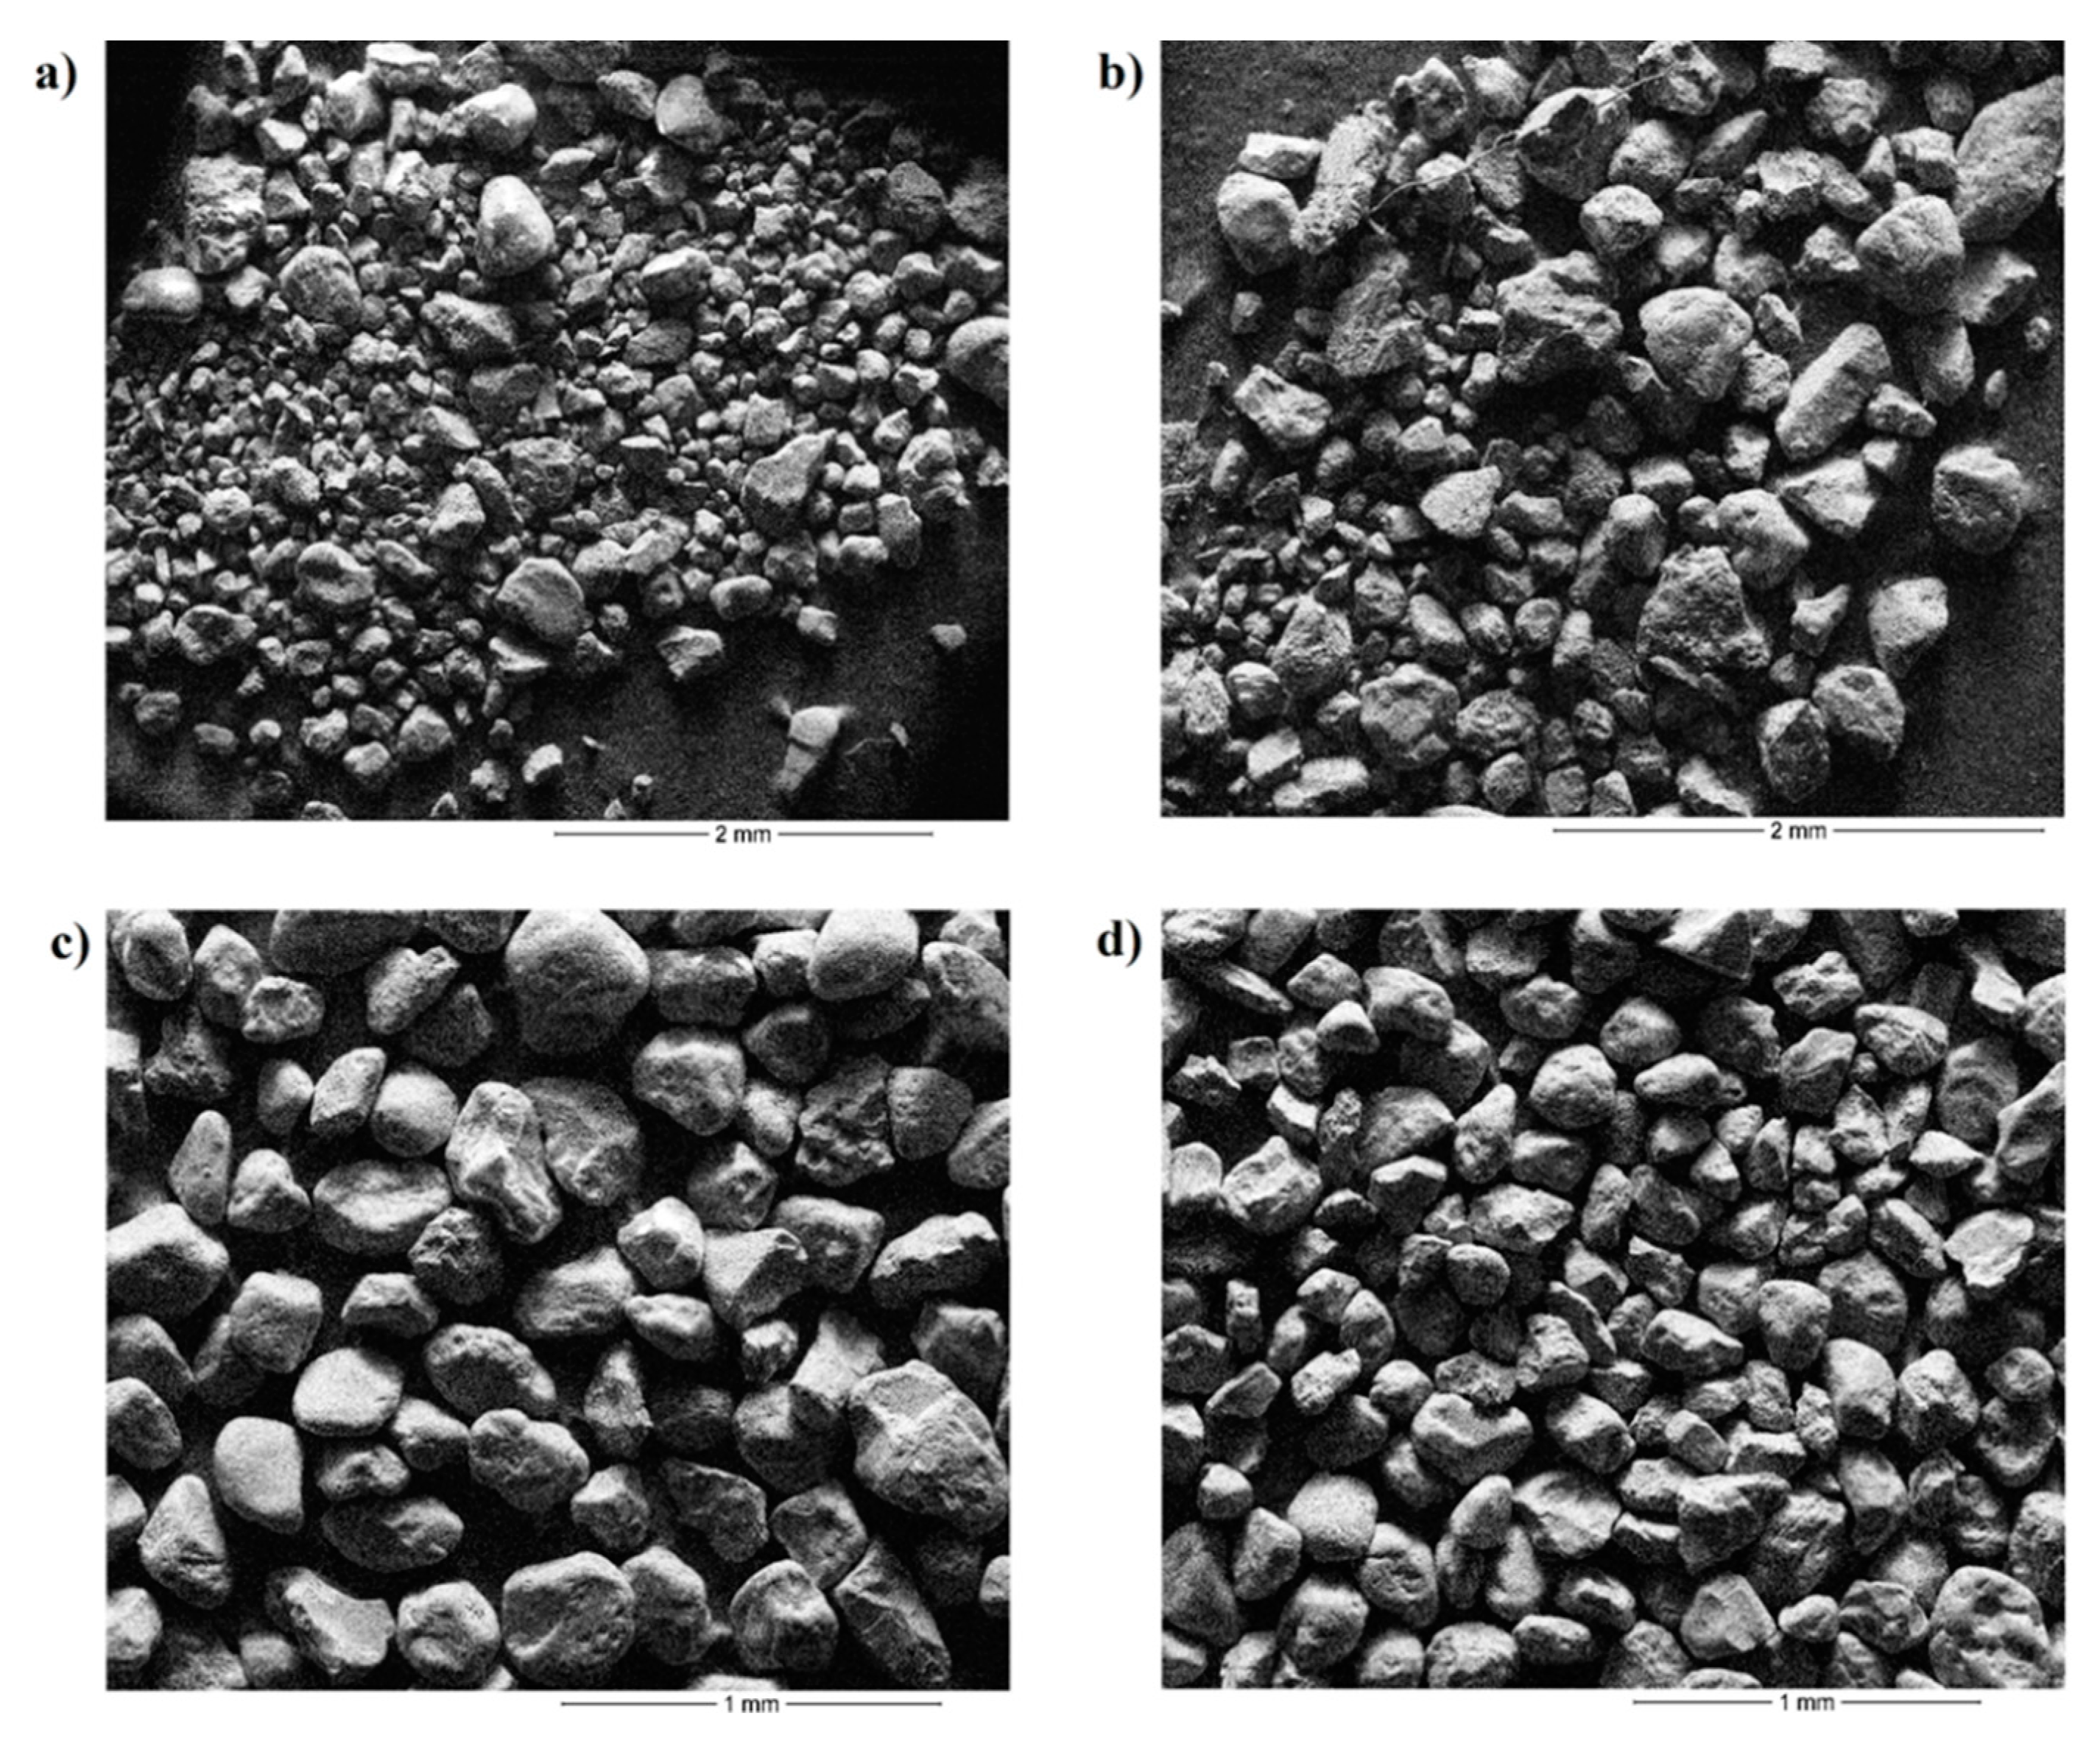
Figure 5, all of them have well-defined edges. Varying grain size with distinctive cracks in some places characterizes pollution occupying roads near the university campus (
Figure 9a), as well as the inside of the laboratory hall (
Figure 9b). Dust 3 consists of elements of two distinct sizes—smaller grains with an average diameter of around 0.2 mm, and bigger ones with an average diameter of roughly 0.45 mm. The average grain size for dust 4 is in the range of 0.2–0.35 mm, with some noticeably bigger parts exceeding 0.5 mm. Two types of soil gathered from a sampling point located at a short distance from the beach contain grains with a similar diameter, which have more even edges and are less fractured. The average grain diameter for dust 5 (
Figure 9c) falls in the range of 0.23–0.36 mm and for dust 6 (
Figure 9d) in the range of 0.22–0.33 mm.
EDS spectra in
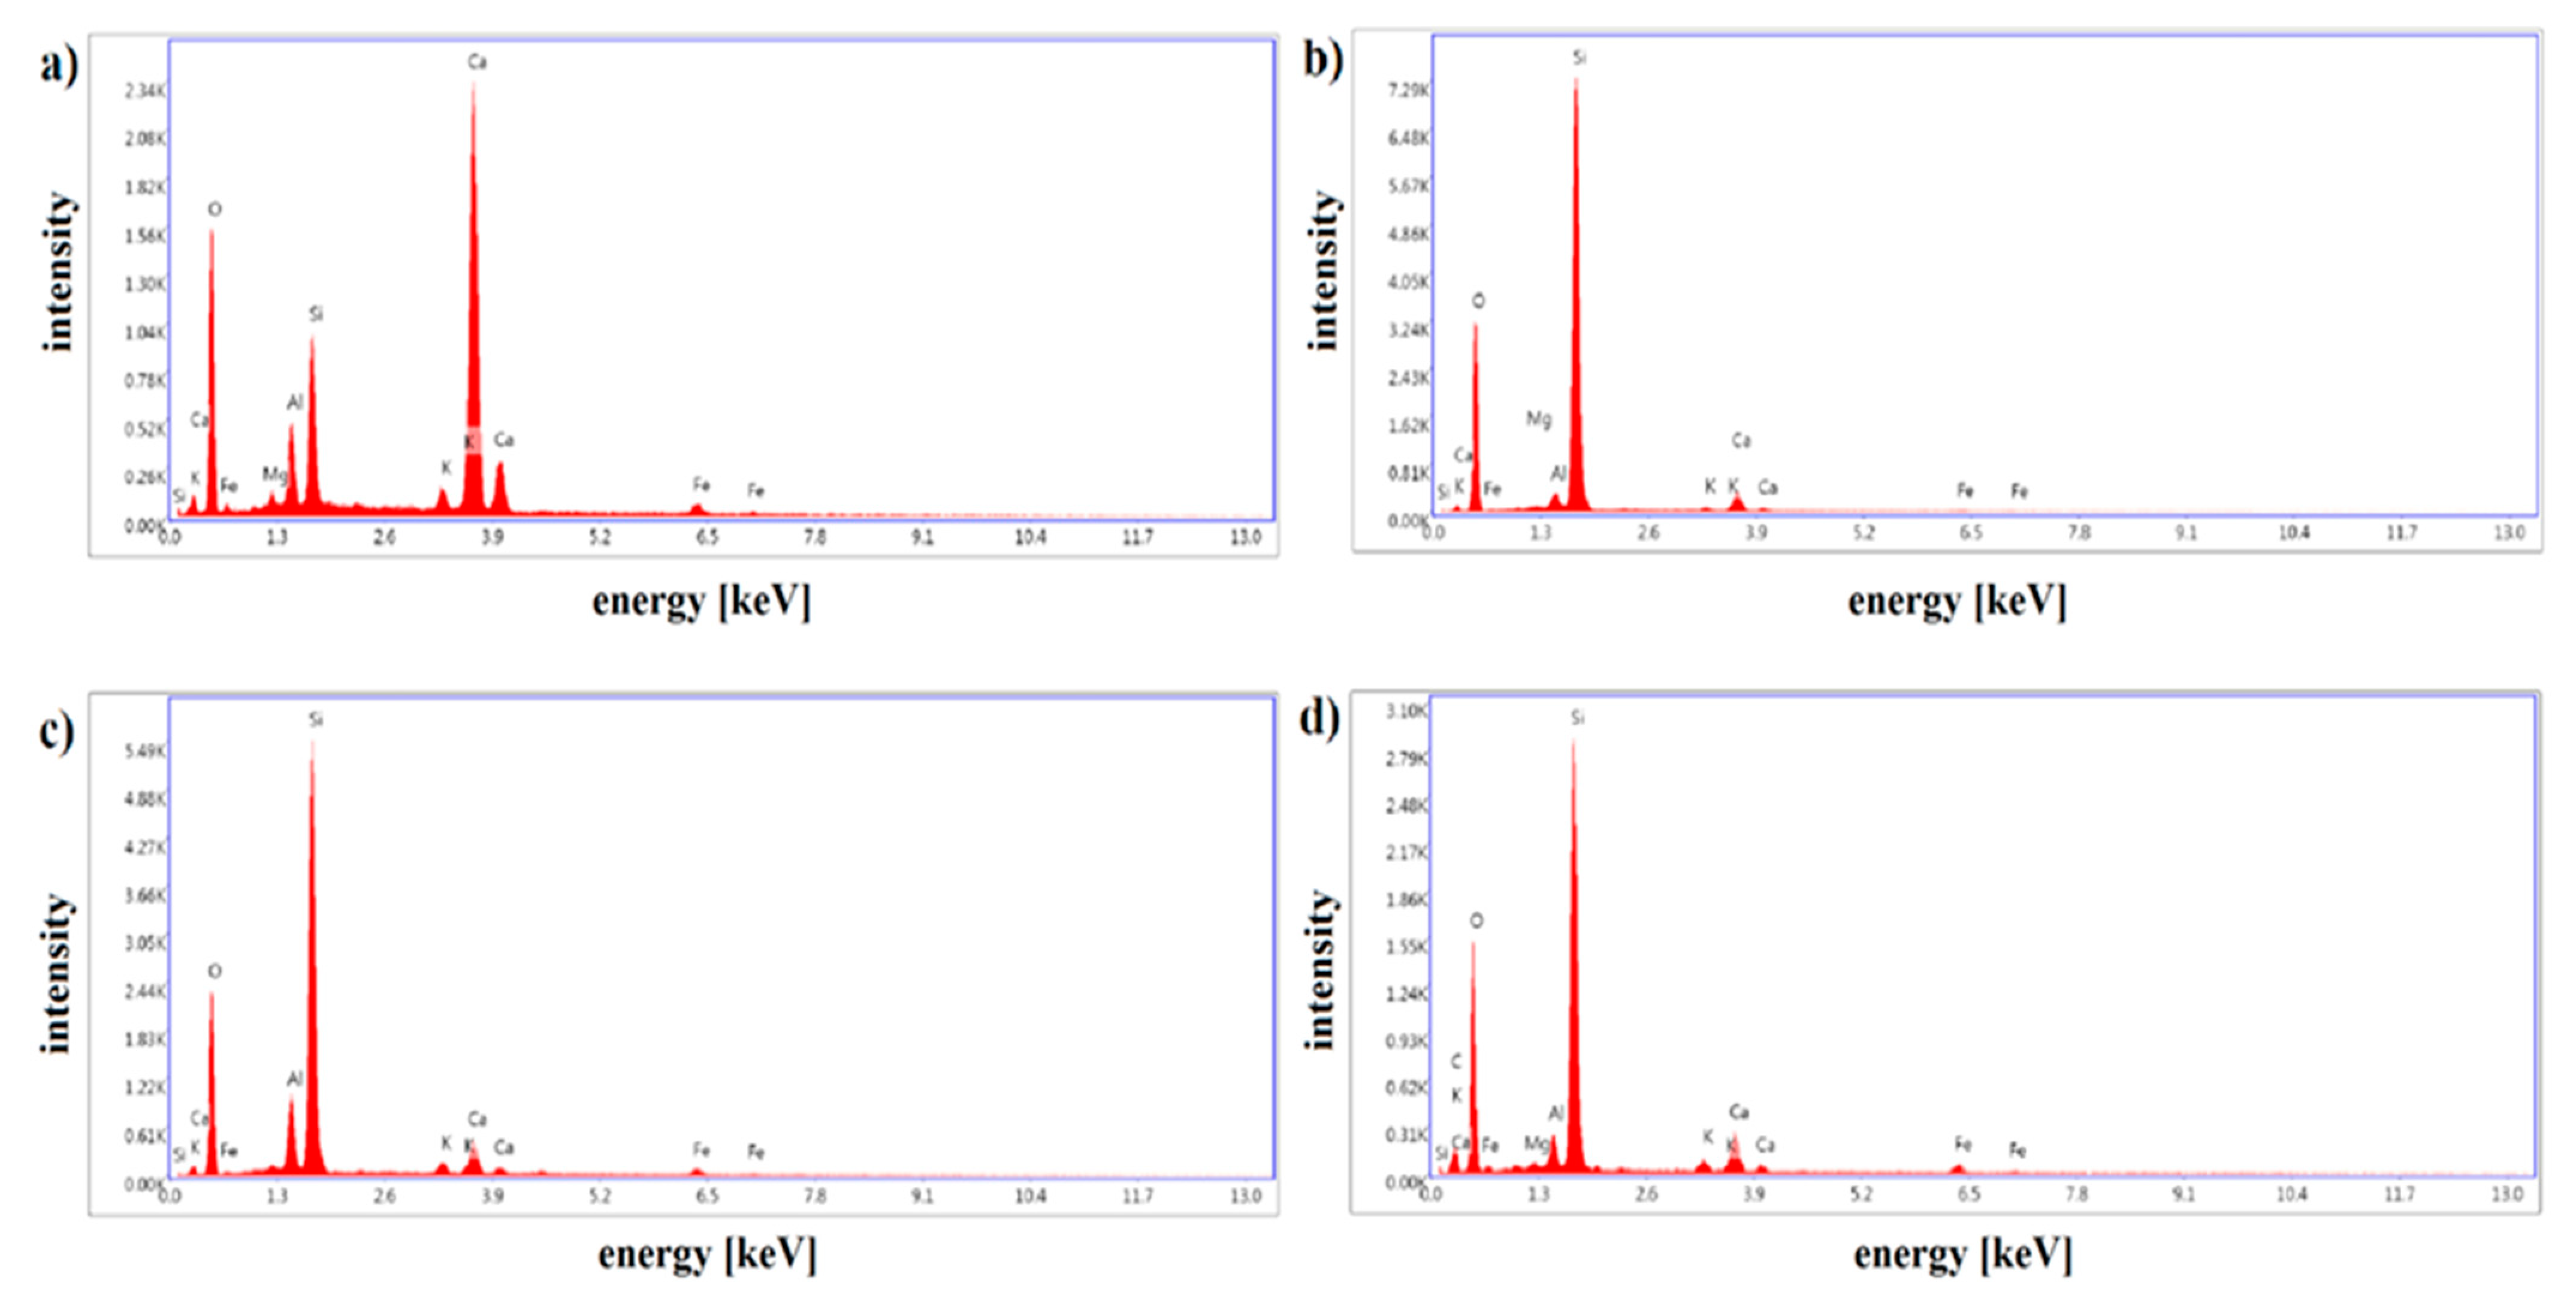
Figure 10 correspond to dusts 3, 4, 5, and 6, respectively. Dust 3 (
Figure 10a) consists mainly of calcium, oxygen, silicon, and aluminum; however, trace elements of potassium, magnesium, and iron were also recorded. An additional peak from carbon comes from carbon tape and is, by no means, a part of this pollutant. The composition of dust 4 (
Figure 10b) is characterized by two distinctive peaks—one with high intensity for silicon and the other with medium intensity for an oxygen peak, surrounded with the marginal presence of calcium, chlorine, potassium, sodium, and sulfur. Dusts 5 (
Figure 10c) and 6 (
Figure 10d) are less differentiated element-wise than other types of pollutants. Their sampling points were in close proximity to the beach, which heavily influenced grain composition. It comprises two explicitly visible peaks, correlating to silicon and oxygen. Dust 6 has a more diversified structure with additional peaks from calcium and potassium. On this basis, it was established that two gathered pollutants—dust 3 and dust 6—might be used for experimental studies concerning artificial soil influence because of a strong convergence in composition with regard to natural pollutants as dusts 1 and 2. Both dusts 3 and 6 contain strong intensity peaks from silicon and oxygen, as well as trace elements of aluminum, calcium, and potassium. A slightly closer fit could be attributed to dust 6 since calcium, potassium, and iron in its EDS spectrum exhibit small intensity peaks. It should be noted that this conclusion is valid for a specific location that is at 54°37′ N 18°62′ E coordinates
4. Conclusions
Reduced conversion efficiency observed for PV modules after dust deposition is a considerable issue as it leads to generated energy reduction and economic viability shrinkage. The rate of contaminant deposition is linked to a number of factors heavily dependent on the PV installation location. It will, therefore, impact some modules much greater than others situated in regions less prone to dust accumulation.
It should be emphasized that the amount of contaminants collected on the surface is not proportionate to the time of exposure. This is related to the significant impact of precipitation and wind. This is why any comparison of average effects should also include analyzing the location in relation to the environment (agricultural crops, deserts, traffic, or industrial activity in the near vicinity) and the pollutant composition.
A comprehensive analysis of both natural and artificial dust was carried out at Gdansk University of Technology through all of 2019. It provided more insight into the hard-shading effect and its consequences for possible power generation. Overall, there was a significant decline in efficiency for the whole year; however, in autumn, it recovered a few percentile points. This effect can be linked to rinsing a part of the accumulated dust off by heavy precipitation occurring frequently in this meteorological season since the modules are located in the temperate, coastal climate in the northern hemisphere.
Additionally, experiments conducted on two different solar modules using artificial dust of varying origin provided data for drawing a linear relationship of efficiency decrease and different surface densities, thus confirming data cited in literature by other research groups. Provided the process of applying artificial pollutants maintains its uniform distribution over the PV module surface, all thee dusts (dust 3, dust 5, and dust 6) could be used for the laboratory analysis of the soiling effect affecting working parameters of PV devices. A significant decrease in the efficiency of photovoltaic modules was observed, caused by the deposition of impurities, depending on the thickness of the dust layer and its morphology, but it is different for the two modules tested. This means that the structure of the glass surface constituting the top layer of the module plays an important role and should not be neglected in such analysis.
Author Contributions
Conceived and designed the analysis, E.K.-R.; Performed the analysis, E.K.-R.; Wrote the paper, E.K.-R. and M.R.: Collected the data, M.R.; Contributed data or analysis tools, M.R. All authors have read and agreed to the published version of the manuscript.
Funding
Subsidy of the Polish Ministry of Science and Higher Education.
Acknowledgments
The authors gratefully acknowledge the contribution of M. Winiarski from the Department of Solid-State Physics, Faculty of Applied Physics and Mathematics, at Gdansk University of Technology for performing SEM and EDS measurements.
Conflicts of Interest
The authors declare no conflict of interest.
References
- Sarver, T.; Al-Qaraghuli, A.; Kazmerski, L.L. A comprehensive review of the impact of dust on the use of solar energy: History, investigations, results, literature and mitigation approaches. Renew. Sustain. Energy Rev. 2013, 22, 698–733. [Google Scholar] [CrossRef]
- Hottel, H.C.; Woertz, B.B. The performance of flat plate solar heat collectors. ASME Trans. 1942, 64, 91–104. [Google Scholar]
- Al-Hasan, A. A new correlation for direct beam solar radiation received by photovoltaic panel with sand dust accumulated on its surface. Sol. Energy 1998, 63, 323–333. [Google Scholar] [CrossRef]
- Beattie, N.S.; Moir, R.S.; Buffoni, G. Understanding the effects of sand and dust accumulation on photovoltaic modules. Renew. Energy 2012, 48, 448–452. [Google Scholar] [CrossRef]
- Häberlin, H.; Graf, J.D. Gradual Reduction of PV Generator Yield due to Pollution. In Proceedings of the 2nd World Conference and Exhibition on Photovoltaic Solar Energy Convention, Vienna, Austria, 6–10 July 1998. [Google Scholar]
- Al-Hasan, A.; Ghoneim, A.A. A new correlation between photovoltaic panels efficiency and amount of sand dust accumulated on their surface. Int. J. Sustain. Energy 2005, 24, 187–197. [Google Scholar] [CrossRef]
- Sulaiman, S.A.; Hussain, H.H.; Leh, N.S.H.N.; Razali, M.S.I. Effects of dust on the performance of PV panels. Int. J. Mech. Mechatron. Eng. 2011, 5, 2028–2033. [Google Scholar]
- Benatiallah, A.; Ali, M.; Abidi, F.; Benatiallah, D.; Harrouz, A.; Mansouri, I. Experimental study of dust effect in mult-crystal PV solar module. IJMSE 2012, 3, 1–4. [Google Scholar]
- Rao, A.; Pillai, R.; Mani, M.; Ramamurthy, P. Influence of dust deposition on photovoltaic panel performance. Energy Procedia 2013, 54, 690–700. [Google Scholar] [CrossRef]
- Sulaiman, S.A.; Singh, A.K.; Mokhtar, M.M.M.; Bou-Rabee, M. Influence of dirt accumulation on performance of PV panels. Energy Procedia 2014, 50, 50–56. [Google Scholar] [CrossRef]
- Gholami, A.; Khazaee, I.; Eslami, S.; Zandi, M.; Akrami, E. Experimental investigation of dust deposition effects on photovoltaic output performance. Sol. Energy 2018, 159, 346–352. [Google Scholar] [CrossRef]
- Gostein, M.; Düster, T.; Thuman, C. Accurately Measuring PV Soiling Losses with Soiling Station Employing Module Power Measurements. In Proceedings of the 42nd IEEE Photovoltaic Specialist Conference (PVSC), New Orleans, LA, USA, 14–19 June 2015. [Google Scholar]
- El-Shobokshy, M.S.; Hussein, F.M. Effect of the dust with different physical properties on the performance of photovoltaic cells. Sol. Energy 1993, 51, 505–511. [Google Scholar] [CrossRef]
- El-Shobokshy, M.S.; Hussein, F.M. Degradation of photovoltaic cell performance due to dust deposition on its surface. Renew. Energy 1993, 3, 585–590. [Google Scholar] [CrossRef]
- Kaldellis, J.K.; Kapsali, P.M. Simulating the dust effect on the energy performance of photovoltaic generators based on experimental measurements. Energy 2011, 36, 5154–5161. [Google Scholar] [CrossRef]
- Kaldellis, J.K.; Fragos, P.; Kapsali, M. Systematic experimental study of the pollution deposition impact on the energy yield of photovoltaic installations. Renew. Energy 2011, 36, 2717–2724. [Google Scholar] [CrossRef]
- Aïssa, B.; Isaifan, R.J.; Madhavan, V.E.; Abdallah, A.A. Structural and physical properties of the dust particles in Qatar and their influence on the PV panel performance. Sci. Rep. 2016, 6, 1–12. [Google Scholar] [CrossRef]
- Styszko, K.; Jaszczur, M.; Teneta, J.; Hassan, Q. An analysis of the dust deposition on solar photovoltaic modules. Environ. Sci. Pollut. Res. 2019, 26, 8393–8401. [Google Scholar] [CrossRef]
- Paudyal, B.R.; Shakya, S.R. Dust accumulation effects on efficiency of solar PV modules for off grid purpose: A case study of Kathmandu. Sol. Energy 2016, 135, 103–110. [Google Scholar] [CrossRef]
- Yadav, S.K.; Bajpai, U. Variation in the performance of solar photovoltaic power plant due to climatic parameters in composite climatic zone. IJETER 2017, 5, 67–72. [Google Scholar]
- Hegazy, A.A. Effect of dust accumulation on solar transmittance through glass covers of plate-type collectors. Renew. Energy 2001, 22, 525–540. [Google Scholar] [CrossRef]
- Appels, R.; Muthirayan, B.; Beerten, A.; Paesen, R.; Driesen, J.; Poortmans, J. The Effect of Dust Deposition on Photovoltaic Modules. In Proceedings of the 2012 38th IEEE Photovoltaic Specialists Conference, Austin, TX, USA, 3–8 June 2012; pp. 001886–001889. [Google Scholar] [CrossRef]
- Elminir, H.K.; Ghitas, A.E.; Hamid, R.H.; El-Hussainy, F.; Beheary, M.M.; Abdel-Moneim, K.M. Effect of dust on the transparent cover of solar collectors. Energy Convers. Manag. 2006, 47, 3192–3203. [Google Scholar] [CrossRef]
- Cabanillas, R.; Munguia, H. Dust accumulation effect on efficiency of Si photovoltaic modules. J. Renew. Sustain. Energy 2011, 3. [Google Scholar] [CrossRef]
- Gandhi, A.T.; Gupta, A.; Vijay, B.S. Investigation of the effects of dust accumulation and performance for mono and poly crystalline silica modules. Int. J. Renew. Energy Res. 2014, 4, 628–634. [Google Scholar]
Figure 1.
Photovoltaic modules chosen for the annual field study: (a) MWG-30, (b) AP-7105, (c) STP-085, (d) CLC010-12P.
Figure 1.
Photovoltaic modules chosen for the annual field study: (a) MWG-30, (b) AP-7105, (c) STP-085, (d) CLC010-12P.
Figure 2.
Scheme of the measuring unit in the laboratory hall.
Figure 2.
Scheme of the measuring unit in the laboratory hall.
Figure 3.
PV modules contaminated with around 13.2 g/m2 dust density on their surface: (a) MWG-20, (b) CLC010-12P.
Figure 3.
PV modules contaminated with around 13.2 g/m2 dust density on their surface: (a) MWG-20, (b) CLC010-12P.
Figure 4.
Average efficiency in year 2019 for different PV modules: (█) MWG-30, (█) AP-7105, (█) STP-085. Standard error of the mean is illustrated as a black bar for each value column.
Figure 4.
Average efficiency in year 2019 for different PV modules: (█) MWG-30, (█) AP-7105, (█) STP-085. Standard error of the mean is illustrated as a black bar for each value column.
Figure 5.
SEM photograph: (a) dust 1 (magnification 43×), (b) dust 2 (magnification 42×).
Figure 5.
SEM photograph: (a) dust 1 (magnification 43×), (b) dust 2 (magnification 42×).
Figure 6.
EDS graph for: (a) dust 1, (b) dust 2.
Figure 6.
EDS graph for: (a) dust 1, (b) dust 2.
Figure 7.
Normalized efficiency η/ηMAX for: (a) dust 3, (b) dust 5, (c) dust 6, covering the surface of two PV modules—(●) MWG-20 and (■) CLC010-12P.
Figure 7.
Normalized efficiency η/ηMAX for: (a) dust 3, (b) dust 5, (c) dust 6, covering the surface of two PV modules—(●) MWG-20 and (■) CLC010-12P.
Figure 8.
Efficiency decrease η/η0 for surface dust density of around 10.4 g/m2 covering PV module: (♦) MWG-20 and (♦) CLC010-12P.
Figure 8.
Efficiency decrease η/η0 for surface dust density of around 10.4 g/m2 covering PV module: (♦) MWG-20 and (♦) CLC010-12P.
Figure 9.
SEM photograph: (a) dust 3 (magnification 26×), (b) dust 4 (magnification 34×), (c) dust 5 (magnification 53×), (d) dust 6 (magnification 49×).
Figure 9.
SEM photograph: (a) dust 3 (magnification 26×), (b) dust 4 (magnification 34×), (c) dust 5 (magnification 53×), (d) dust 6 (magnification 49×).
Figure 10.
EDS graph for: (a) dust 3, (b) dust 4, (c) dust 5, (d) dust 6.
Figure 10.
EDS graph for: (a) dust 3, (b) dust 4, (c) dust 5, (d) dust 6.
Table 1.
Datasheet of photovoltaic (PV) modules tested inside the laboratory hall: MWG-30, AP-7105, and STP-0852.
Table 1.
Datasheet of photovoltaic (PV) modules tested inside the laboratory hall: MWG-30, AP-7105, and STP-0852.
| | MWG-30 | AP-7105 | STP-085 |
|---|
| PMAX [Wpeak] | 30.0 | 75.0 | 85.0 |
| VMAX [V] | 17.5 | 17.0 | 17.1 |
| IMAX [A] | 1.71 | 4.4 | 4.97 |
| VOC [V] | 21.7 | 21.0 | 21.4 |
| ISC [A] | 1.83 | 4.8 | 5.32 |
| Dimensions [mm] | 680 × 353 × 25 | 1210 × 526 × 35 | 1195 × 541 × 30 |
| Weight [kg] | 3.9 | 8.2 | 8.0 |
| Cell type | Polycrystalline | Monocrystalline | Polycrystalline |
Table 2.
Technical data of artificial light source as well as gauging devices used for temperature, irradiance, current, and voltage measurement.
Table 2.
Technical data of artificial light source as well as gauging devices used for temperature, irradiance, current, and voltage measurement.
| Instrument | Producer | Serial Number | Description |
|---|
| Light source | G.U.N.T. Hamburg | HL-313.01 | 8 halogen lamps
power of 1 lamp: 1000 W |
| | G.U.N.T. Hamburg | ET-250 | Voltage measuring range: 0–200 V
Current measuring range: 0–20 A
Irradiance measuring range: 0–3000 W/m2
Tilt angle measuring range: 0–90°
Temperature range: 0–+100 °C |
| Pyranometer | Kipp & Zonen | METEON 07080865 | Measuring accuracy: 0.1%
Operating temperature: −10–+40 °C |
| Pyrometer | Fluke | 62 mini IR Thermometer | Measuring accuracy: ±1.5 °C
Operating temperature: −30–+500 °C
Sensor: laser
Standard measurement distance: 2 m |
Table 3.
Numbering of dust samples collected from photovoltaic modules, laboratory hall, and three various locations in Gdansk.
Table 3.
Numbering of dust samples collected from photovoltaic modules, laboratory hall, and three various locations in Gdansk.
| Number | Description of Dust Sample | Coordinates |
|---|
| 1 | Taken after 2 years of deposition on MWG-30, AP-7105, and STP-085 modules in outdoor conditions | 54°37′ N
18°62′ E |
| 2 | Taken after 1 year of deposition on CL010-12P module in outdoor conditions | 54°37′ N
18°62′ E |
| 3 | Taken from roads near Chemistry C GUT Building | 54°37′ N
18°62′ E |
| 4 | Taken from laboratory hall in Chemistry C GUT Building | 54°37′ N
18°62′ E |
| 5 | Taken from sand beach area near the walking pier in Gdansk | 54°41′ N
18°64′ E |
| 6 | Taken from sand beach area near the tram loop in Gdansk | 54°41′ N
18°62′ E |
Table 4.
Datasheet of PV module MWG-20 and CLC010-12P.
Table 4.
Datasheet of PV module MWG-20 and CLC010-12P.
| | MWG-20 | CLC010-12P |
|---|
| PMAX [Wpeak] | 20.0 | 10.0 |
| VMAX [V] | 17.2 | 17.5 |
| IMAX [A] | 1.17 | 0.57 |
| VOC [V] | 21.8 | 22.0 |
| ISC [A] | 1.23 | 0.63 |
| Dimensions [mm] | 505 × 353 × 28 | 340 × 280 × 17 |
| Weight [kg] | 2.3 | 1.1 |
| Cell type | Polycrystalline | Polycrystalline |
© 2020 by the authors. Licensee MDPI, Basel, Switzerland. This article is an open access article distributed under the terms and conditions of the Creative Commons Attribution (CC BY) license (http://creativecommons.org/licenses/by/4.0/).


