Article

Time-Frequency Analysis Based on Minimum-Norm Spectral Estimation to Detect Induction Motor Faults

by
Tomas A. Garcia-Calva
1,
Daniel Morinigo-Sotelo
2,*,
Oscar Duque-Perez
2,
Arturo Garcia-Perez
1 and
Rene de J. Romero-Troncoso
3
1
HSPdigital-Electronics Department, University of Guanajuato, Salamanca 36700, Mexico
2
HSPdigital-ADIRE, ITAP, University of Valladolid, 47011 Valladolid, Spain
3
HSPdigital-Mechatronics Department, Autonomous University of Querétaro, San Juan del Río 76806, Mexico
*
Author to whom correspondence should be addressed.
Energies 2020, 13(16), 4102; https://doi.org/10.3390/en13164102
Submission received: 13 July 2020 / Revised: 31 July 2020 / Accepted: 4 August 2020 / Published: 7 August 2020
(This article belongs to the Special Issue Future Electrical Machines)

Abstract

:
In this work, a new time-frequency tool based on minimum-norm spectral estimation is introduced for multiple fault detection in induction motors. Several diagnostic techniques are available to identify certain faults in induction machines; however, they generally give acceptable results only for machines operating under stationary conditions. Induction motors rarely operate under stationary conditions as they are constantly affected by load oscillations, speed waves, unbalanced voltages, and other external conditions. To overcome this issue, different time-frequency analysis techniques have been proposed for fault detection in induction motors under non-stationary regimes. However, most of them have low-resolution, low-accuracy or both. The proposed method employs the minimum-norm spectral estimation to provide high frequency resolution and accuracy in the time-frequency domain. This technique exploits the advantages of non-stationary conditions, where mechanical and electrical stresses in the machine are higher than in stationary conditions, improving the detectability of fault components. Numerical simulation and experimental results are provided to validate the effectiveness of the method in starting current analysis of induction motors.

1. Introduction

Condition monitoring has become a critical issue in rotatory machines, and the induction machines are not an exception. Induction motors (IMs) are widely used in industrial systems due to their excellent performance, high robustness and low-cost. However, they are susceptible to many different types of electrical and mechanical faults including, stator winding faults, rotor faults, bearing faults, etc. [1,2,3,4,5]. These faults can result in a wide range of detrimental and sometimes dangerous consequences, such as reduced efficiency of the machine, increased wear on pulleys or belts, excessive energy consumption, increased noise and vibration.
Several approaches based on the analysis of the stator current in a steady-state motor operation have been studied for fault detection in induction machines. However, the monitoring of a steady-state operation can produce false fault alarms due to superposition of different frequency components in the stator current spectrum. To overcome this issue, different time-frequency analysis techniques have been proposed for time-varying spectrum analysis, including Fourier-based schemes [6,7,8,9], application of adaptive windows [10], adaptive scales [11], quadratic time-frequency ( t , f ) distributions such as the Wigner–Ville distribution [12,13,14], the use of ( t , f ) atoms [15], continuous time-frequency tools [16], and parametric methods for power spectrum estimation [17,18,19]. Most of these methods operate adequately only for long transients and at moderate noise levels. The time-frequency representations based on the Fourier transform (FT) suffer from the major problem of poor time-frequency resolution because of some important assumptions (stationarity of the signal, integer digital frequencies, noise-free, and infinite observation data length) made in these methods. The estimated time-varying spectrum results in a very noisy and diffuse version of the actual spectrum [20,21]. ( t , f ) decompositions based on quadratic operations of the observed data, such as the Wigner–Ville distribution, are often able to accomplish a better resolution than FT-based decompositions of approximately a factor of 2 in the ( t , f ) sharpening of the distribution. However, they are not suited for multi-component signals since false “cross-terms” appear between true signal components [22]. The most recent methods of parametric power spectrum estimation are based on statistical properties of the signal. Their resolution is high in frequency and independent of the signal-to-noise ratio (SNR). However, this improvement is achieved in the presence of additional false or “spurious” frequency components in the spectrum that may lead to an inaccurate fault diagnostic of the machine.
In this paper, a time-frequency tool is proposed that can make an accurate and reliable assessment of the presence of specific fault signatures in an induction motor starting current. To avoid spurious signatures and obtain high resolution, the spectral estimator called Minimum Norm (Min-Norm) is proposed to jointly estimate both frequency and magnitude of the time-varying stator current components. Simulation and experimental results show the potentiality of the methodology as a time-frequency decomposition technique that is suited for transient and stationary conditions.

2. Stator-Current Spectral Content

2.1. Induction Motor Faults

Most fault detection methods used in condition monitoring are based on frequency analysis because induction motor’s behaviour is cyclic, and the most common faults encountered in the machine, such as bearing faults, broken rotor bars, and misalignments, produce predictable frequencies in the line current spectrum [23,24,25]. This work focuses on the detection of two of these failures.

2.1.1. Misalignment Fault

An air-gap eccentricity arises in a motor when its shaft and the shaft of the mechanical load do not rotate on a common axis. Like shaft misalignment, belt misalignment results in an air-gap eccentricity. This eccentricity causes a non-uniform distance between the stator and the rotor, giving rise to unbalanced magnetic flux within the air gap. As a consequence, a group of harmonic components arise in the stator current whose frequencies are given by:
f p s h ( n d ) = k R ± n d ( 1 s ) P ± v f s ,
where n d = 0 for static eccentricity, n d = 1 , 2 , 3 the order of the dynamic eccentricity, s is the motor slip, R is the number of rotor slots, k is an integer, P is the number of pole pair, v represents the harmonics present in the power supply, and f s is the fundamental supply frequency [26,27,28]. Shaft misalignment also introduces more spectral components in the low-bandwidth at frequencies:
f l = f s ± k ρ f r , f r = 1 s P f s
where f r is the machine rotating frequency, k is an integer and ρ is a scale factor when a reduction coupling is present in the transmission chain.

2.1.2. Rotor Fault

When a rotor bar is damaged, the rotor asymmetry causes amplitude modulation in the line currents, torque pulsations, and speed oscillations [29,30,31]. The magnetic and electric asymmetries in the rotor machine boosts up side-bands of the fundamental component at
f b b = f s 1 ± 2 s
Therefore, misalignment and broken rotor bars can be detected by monitoring the fault-related frequencies in the stator current.

3. Minimum-Norm

The Min-Norm is an advanced spectrum estimation technique for signal analysis. The method assumes L observed data samples of a signal. At a certain time instant l the sequence can be modeled as:
S s ( l ) = k = 1 K v ( ψ k ) s k ( l ) + e ( l ) ,
where s k ( l ) denotes the k-th component, v ( ψ k ) is the frequency-dependent vector v ( ψ k ) = 1 , e i ψ k , , e i ψ N 1 T , and e ( l ) is observation noise. The vector v ( ψ k ) can be viewed as a uniformly sampled complex sinusoid of angular frequency ψ k = 2 π f / λ s , where λ s is the sampling frequency. The fault detection problem in an IM can be viewed as a power spectral density estimation problem, in which the fault-related frequencies f f and its amplitudes s k ( l ) need to be estimated from the measured one-phase current.
Let A be the NxK Vandermonde matrix [32] and let s ( l ) = s 1 ( l ) , , s K ( l ) T the vector of amplitudes. The signal model (4) can be written as:
S x = V ( ψ ) A s ( l ) + e ( l ) , l = 1 , . . . , L .
in the frequency-domain, the model can be expanded in terms of eigenvalues and eigenvectors of the sample spectral covariance:
S x = V ( ψ ) S V H ( ψ ) + σ w 2 I ,
In practice, the eigenvalues and eigenvectors are not known and must be estimated from the observed data. Then, S ^ x can be expanded as:
S ^ x = i = 1 N λ i Φ ^ i Φ ^ i H ,
U ^ s = Δ Φ ^ 1 , Φ ^ 2 , , Φ ^ D ,
And
U ^ n = Δ Φ ^ D + 1 , Φ ^ D + 2 , , Φ ^ N
where λ i are the eigenvalues and Φ ^ i are the eigenvectors, U ^ n is the noise subspace, and U ^ s the signal subspace. Based on this decomposition, some algorithms were proposed using the signal or the noise subspaces for spectral estimation, i.e., the multiple signal classification (MUSIC) algorithm utilizes all of the noise subspace eigenvectors and a uniform weighting of the norms of the projections of v ( ψ ) onto the estimated eigenvectors.
The Min-Norm spectral estimation technique uses only a single vector d in the noise subspace; the estimate of ψ k will be more accurate and zeros will be less likely to generate spurious sinusoids. For this, the signal subspace is spanned by the columns of V . Defining a vector
d = d 1 d 2 d N T
that has the property that,
v H ( ψ i ) d = 0 , i = 1 , 2 , , D ,
or equivalently,
Φ i H d = 0 , i = 1 , 2 , , D ,
Then, the polynomial,
D ( z ) = k = 1 N d k z ( k 1 ) ,
has zeros at,
z k = exp ( j ψ k ) , i = 1 , 2 , , D ,
v H ( ψ i ) d = 0 , i = 1 , 2 , , D ,
finding d as a liner a combination of the N D , the power spectral density will have zeros at ψ 1 , ψ 2 , . . . , ψ D . It is required that d 1 equal unity and minimize
Q ( ψ ) = k = 1 N | d k | 2 , d 1 = 1 .
Minimizing Q ( ψ ) , the Min-Norm null spectra [33] can be written as
Q ^ M N ( ψ ) = | v H ( ψ ) d | 2 = v H ( ψ ) U ^ n W U ^ n H v ( ψ ) ,
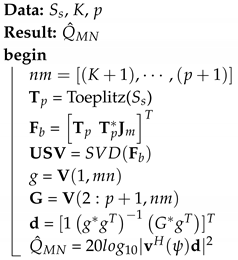
where W = w 1 2 w H 2 and d = U ^ n w 1 2 interpreted as a weighted eigenspace algorithm. A pseudo-code representation for practical implementation is given in Algorithm 1.
Algorithm 1: Min-Norm Spectral Estimation Algorithm
Energies 13 04102 i001
where T p denotes the Toeplitz matrix of p order [32] and J m is a reflection matrix. It is possible to compute the ( t , f ) decomposition of S s ( l ) by sectioning the measured signal into overlapping windows and applying the Min-Norm spectral estimator to each frame.

4. Simulation Results

In this section, simulation experiments will illustrate the performance of the Min-Norm strategy in terms of spectrum estimation accuracy when applied to the analysis of the signature of a motor stator current. Some synthetic signals were created in the time-domain within the bandwidth [ 0 , λ s / 2 ) , to simulate an IM stator current in a constant-speed regime. The sequence contains five sinusoids located at [ f l 1 = 40 Hz, f b b = 54 Hz, f s = 60 Hz, f b b + = 66 Hz, f l 1 + = 80 Hz], with amplitudes of [−26 dB, −31 dB, 0 dB, −31 dB, −26 dB] respectively. The Min-Norm is compared with two benchmark methods, the fast Fourier transform (FFT) and the MUSIC algorithm. The window observation considered has a length of N = 256 , and the noise is modeled as an additive zero-mean white noise with variance σ 2 = 0 . 08 . Figure 1 illustrates the comparison of the true spectrum values and the spectral estimation performance of the FFT algorithm, the MUSIC algorithm, and the Min-Norm method. Spectra have been normalized to 0 dB at its maximum estimation value to facilitate the comparison.
Figure 1 shows that all methods obtain a good estimate of f s since its amplitude is the highest of the time-sequence. However, it is not easy to distinguish in the FFT spectrum additional peaks that would prove the existence of f b b or f b b + . This is explained by the small observation window length that reduces the FFT frequency resolution Δ f = λ s / N , resulting in a poor spectral estimate. On the other hand, the MUSIC method produces a better spectral estimation (its frequency resolution is better than FFT), which allows the observation of spectral peaks located at the sinusoidal frequencies f l 1 , f b b , f s , f b b + , f l 1 + . However, it should be noted that their amplitudes differ significantly from their true values and the noise floor is altered; also, spurious or fake frequencies appear in the spectrum at 4, 48, 73, 95 and 112 Hz. On the contrary, the results reveal that the Min-Norm method achieves not only a high-frequency resolution but also a good estimation accuracy of the amplitudes from relatively small length data. This result confirms that this tool is suitable for the transient analysis of signals from induction motors.

Time-Frequency Analysis of Stator Current

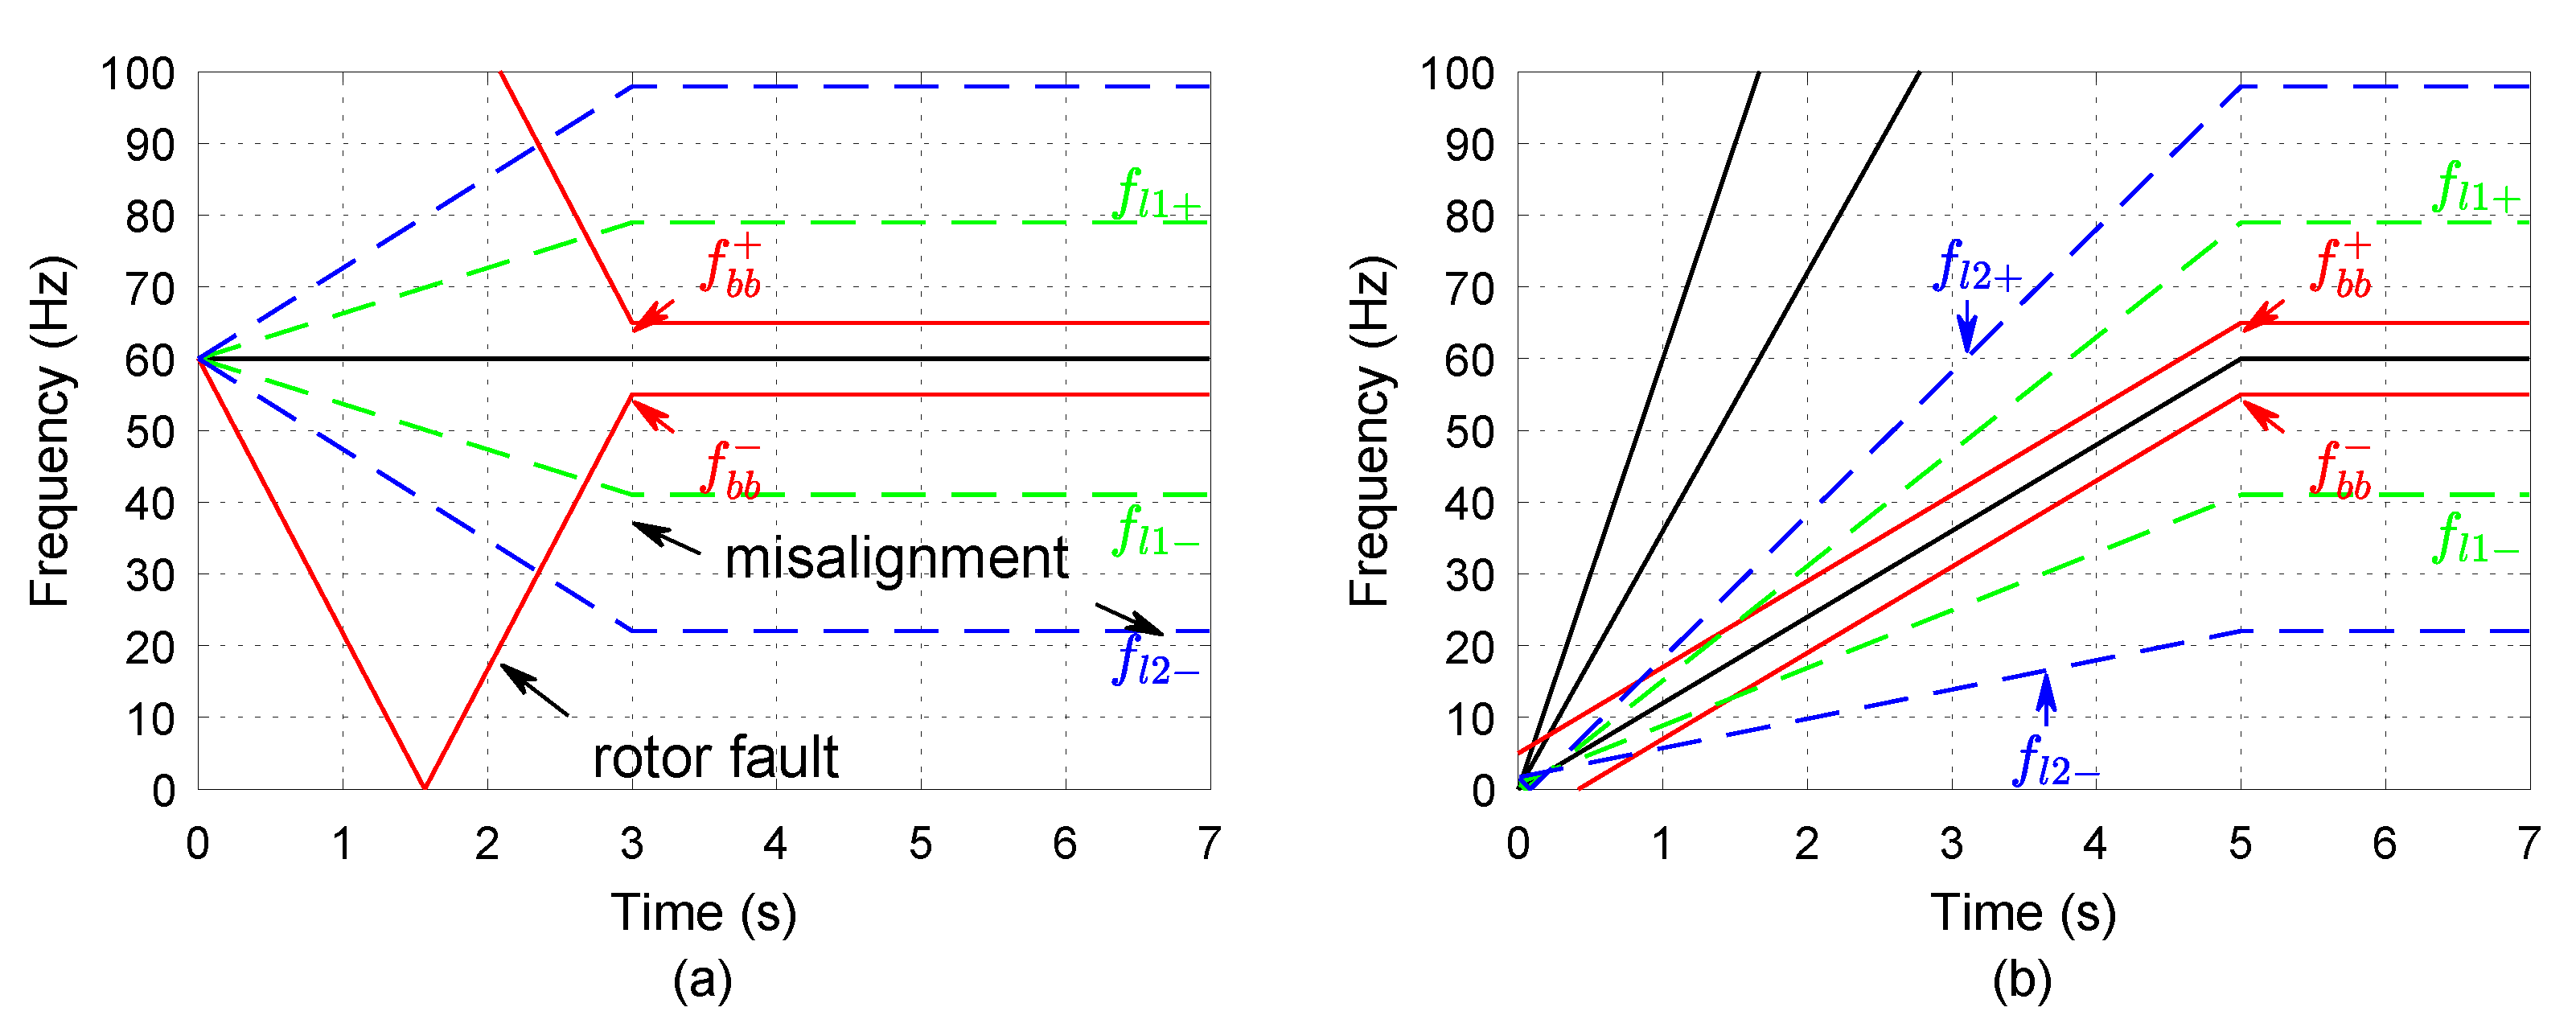
Broken rotor bar and misalignment faults can be detected in IM under stationary conditions by observing the fault components f b b and f l . However, for certain transmission chain configurations, the two frequency components can overlap between them in steady state producing false positive or negative fault alarm because of constructive or destructive superposition of two or more components located at the same frequency. By monitoring the fault components at the startup transient, it is possible to accurate evaluate the fault components before they overlap with another frequency components and avoid false fault alarms. Classical estimation techniques are not adequate to analyze the transient current since its amplitude, frequency, and phase are time-variant. When the induction motor is started, the frequency components that indicate a fault varies as the motor accelerates to its final operation speed. The behavior of motor speed and slip are illustrated in Figure 2a,b for a startup transient with a motor fed from line and by an inverter, respectively. It can be seen that for the inverter-fed IM, the slip reaches smaller values faster than line-fed IM.
Figure 3a shows the trajectories in the time-frequency plane of the main frequency f s and fault-related harmonics during a direct startup. f s is fixed to the line frequency from the beginning, and fault-related harmonics follow paths that separated from f s during the transient.
The case of an IM inverter-started following a linear profile is very different, as it is shown in the ( t , f ) representation of Figure 3b. The trajectories of fault components evolve close to f s and a high- resolution technique is therefore necessary to distinguish the fault components.

5. Experimental Setup

The experimental test bench consists of a squirrel cage induction motor by WEG (136APE48T model) coupled to an alternator as a mechanical load. The experimental tests consist of startup transients of the motor being fed by the grid line, and by an adjustable speed drive (ASD) by WEG (CFW08 model). The ASD was programmed to supply a linear frequency ramp from 0 to a base frequency of 60 Hz with a linear frequency variation. The induction motor and adjustable speed drive specifications are presented in Appendix A and Appendix B, respectively.
One phase current was measured for condition monitoring purposes with a sampling frequency of 12.0 kHz. The tests were recorded for 8 seconds using a half-effect sensor model L08P050D15 from Tamura and a 16-bit analog to digital converter. Three operating conditions of the induction machine were experimented to test the proposed method. The first case of study is the healthy induction motor. For the second case of study, the belt connecting the driver pulley and the driven pulley form a misalignment angle of 10 degrees with respect to a horizontal reference of the aligned case. The latter is when the rotor is damaged, for this case a broken bar is produced artificially by drilling a hole of 7.93 mm of diameter without harming the rotor shaft.

6. Experimental Validation

The short time minimum norm analysis examined the three study cases. To perform the data acquisition and collection, a proprietary FPGA-based data acquisition system (DAS) was used. The acquired measurements were processed by Matlab software in a personal computer with 8 GB RAM memory and a microprocessor Intel (R) Core (TM) i7. All the digital sequences of the stator current were decimated from its original sampling frequency λ s to a new sampling frequency λ s D for selecting the frequency band analysis, and to reduce computational burden. The decimation process was implemented with a cascade multi-stage approach to avoid spectral aliasing at the sample rate conversion stage. The startup transient current of the stator was measured for the line-fed IM and ASD-fed IM as shown in Figure 4. It should be noted that when the IM was started from the line at constant rated frequency, an ovecurrent happens 7 times greater than rated current. However, when the ASD was used, the starting current is limited and slightly higher than the rated current.
The Min-Norm-based ( t , f ) decompositions of the stator current under ASD startup for: healthy, shaft misalignment, and broken rotor bar are shown in Figure 5a–c, respectively. On the other hand, in Figure 6a,c and Figure 4 are presented the ( t , f ) analyses for the stator current when the motor is started directly from the line for the same cases. The proposed methodology is implemented in PC software. Each time-frequency decomposition has a size of 512 × 1155 points and the analyzed bandwidth is [0, 128) Hz by 8 s.

6.1. ASD-Fed Startup Transient Analysis (0 to 60 Hz)

The ( t , f ) analysis for the healthy IM case is shown in Figure 5a, where the principal components inside the stator current spectrum are observed. It can be seen the main harmonic following a linear profile provided by the ASD supply f s , the space-harmonics for the first eccentricity orders k = ± 1 , ± 2 in (2). The Min-Norm-based method also enables the observation of the Principal Slot Harmonics PSHs for v = ± 3 and v = ± 5 in (1). Notice that after the startup transient (next to the second 5), a frequency signature appears parallel and near the f s component, which is a fact that may lead to a false-positive indication of rotor fault if only the steady-state operation is analyzed. Figure 5b shows the ( t , f ) analysis for the induction motor under shaft misalignment condition. It can be observed a significant increase in the magnitude of the PSH components due to the asymmetry induced by the misalignment. Moreover, it can be observed additional spectral lines around the f l for k = ± 2 trajectories.
The rotor bar defect is detected in the ASD-fed IM with the clear identification of the fault harmonic located at f b b , as predicted in Section 2.1.2 by (3). Figure 5c shows the Min-Norm-based decomposition, where the fault-pattern is clearly recognized evolving parallel and close to the f s component. In this case, the ( 1 + 2 s ) f s known as Right side harmonic (RSH) oscillation is not present due to inertia attenuation and its amplitude is so small that is submerged by the measurement noise.

6.2. Line-Fed Startup Transient Analysis

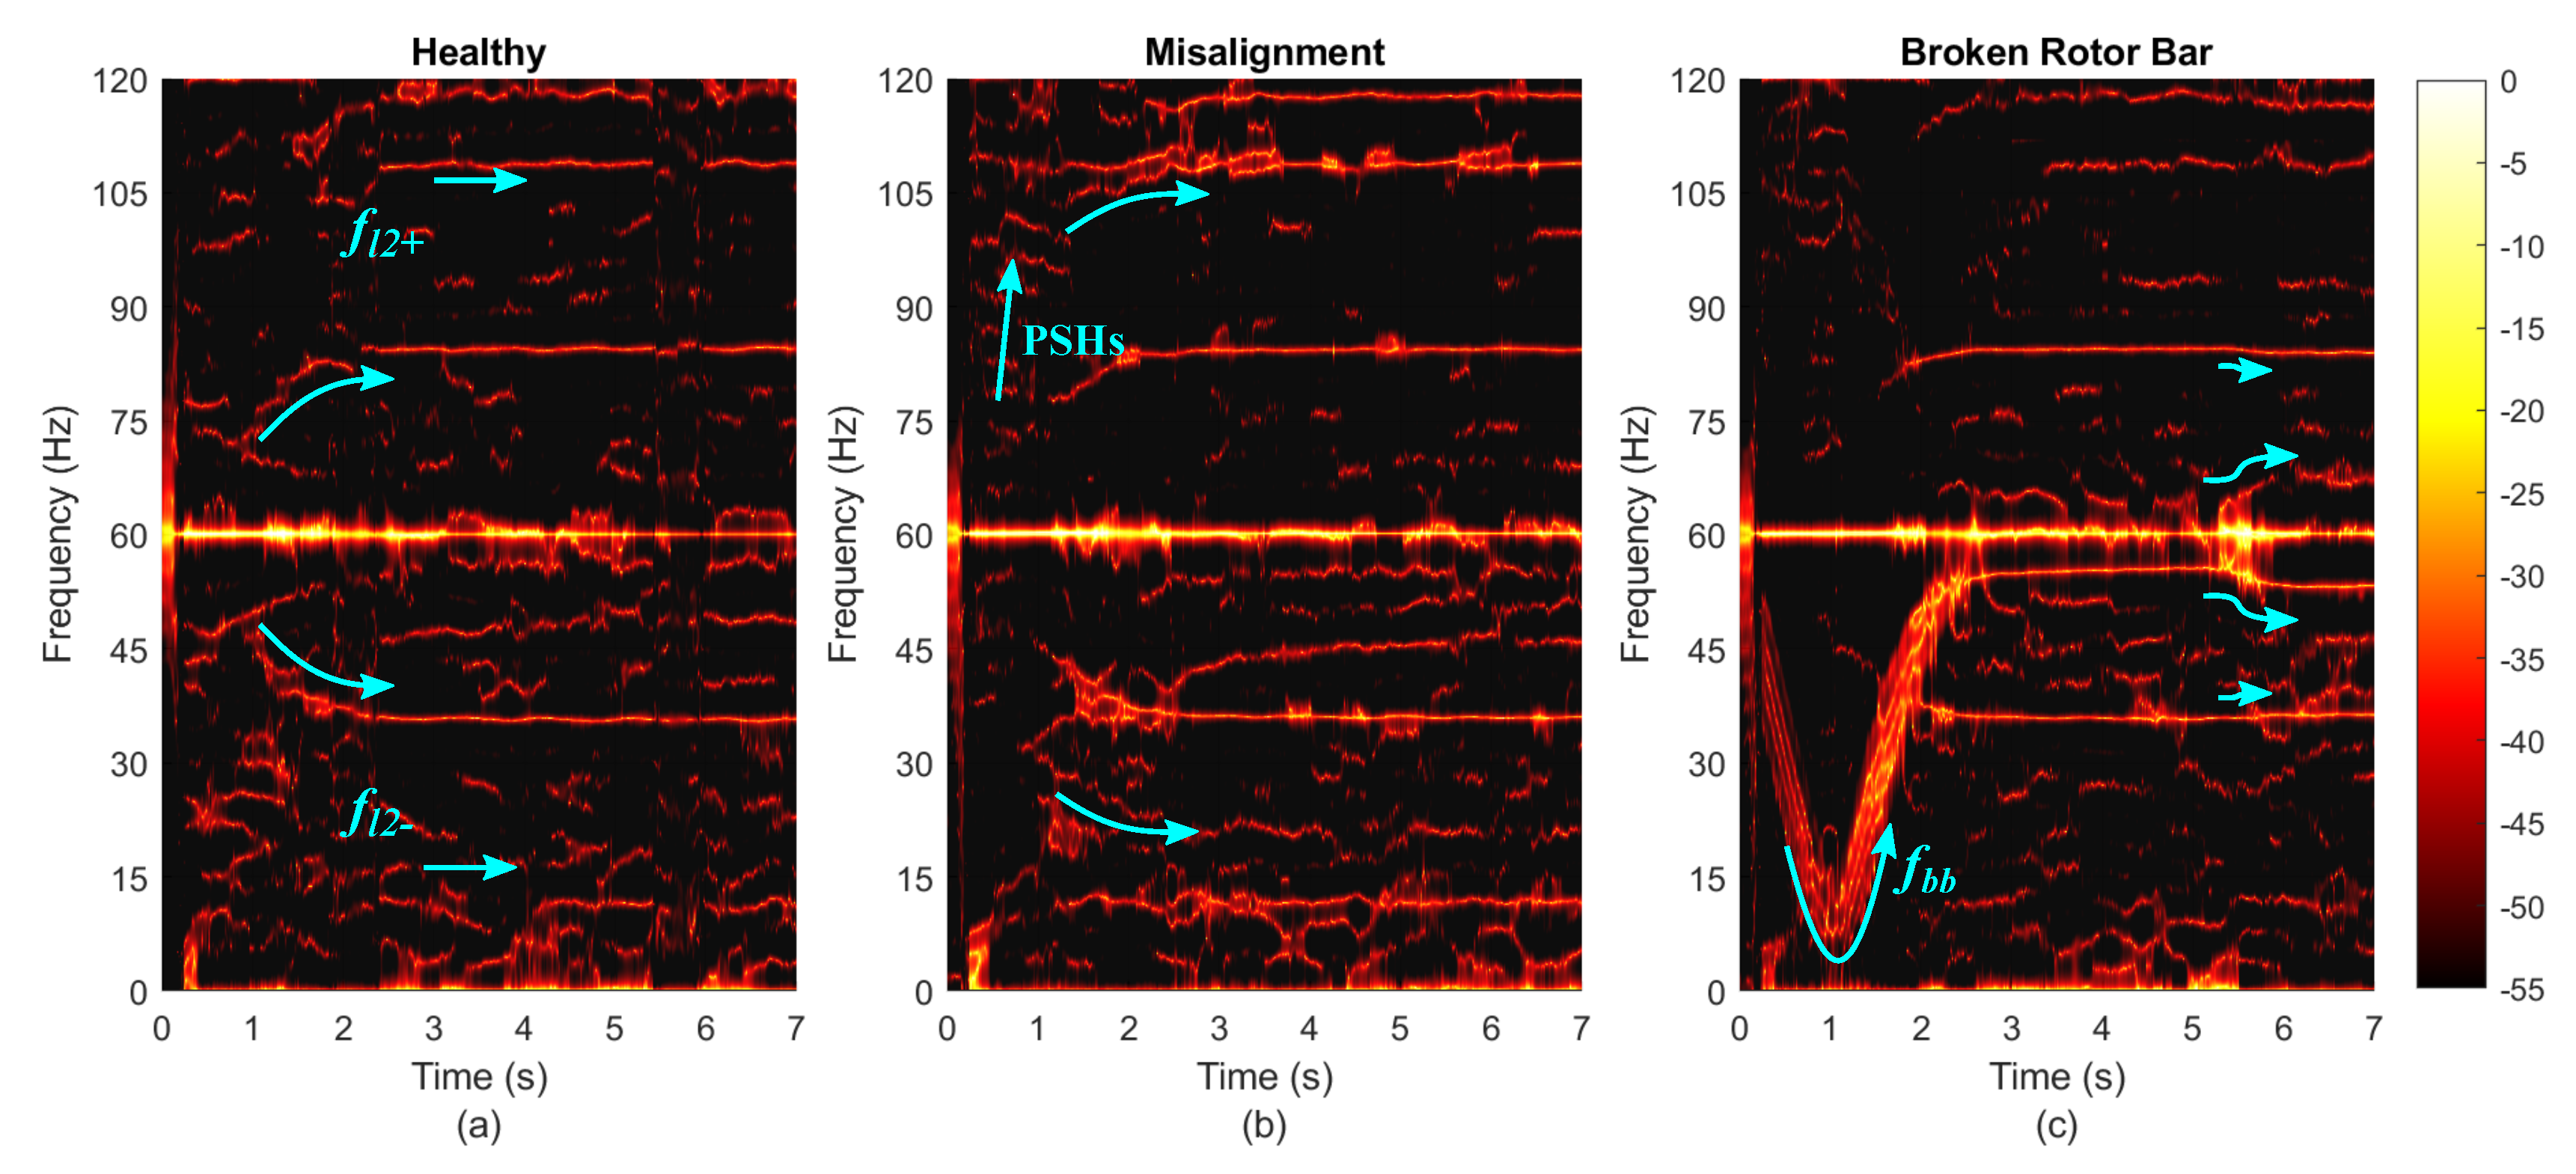
This section shows the ability of the Min-Norm-Based ( t , f ) analysis to detect the presence of fault indicators from short-duration transients, such as when a small motor is started from the line. The results are presented in Figure 6. In these starting current spectra, the dominant component is the power grid frequency, with a constant value of 60 Hz. Figure 6a illustrates the result of Min-Norm analysis of a startup transient of the induction motor under healthy contion.
As a result of the short-time speed transient, all the space harmonics vary rapidly in frequency. The principal slot harmonics reach high-frequency levels in less than a second, being difficult to notice its trajectories. On the other hand, the evolution of the f l components is clearly visible and they are symmetrically located at a distance from the f s , which is equal to ρ k f r . In Figure 6b, it is shown that when the transmission system is misaligned, the asymmetry produces ( t , f ) oscillating components in the vicinity of f l , for k = ± 2 . It is important to note that, during the steady-state IM operation, the spectrum has a frequency component apparently located at ( 1 2 s ) f s , even when the rotor is in perfect health condition.
In contrast with the ( t , f ) analysis of the induction motor under healthy condition in Figure 6a, in Figure 6c the rotor failure is manifested by the clear appearance of a “V” pattern trajectory, which corresponds to ( 1 2 s ) f s in (3). Furthermore, Min-Norm-based ( t , f ) decomposition permits instant detection of a change in the mechanical load during the steady-state at second 5. The high ( t , f ) resolution of the proposed method enables the instant visualization of the sudden change in frequency proportional to the slip variation in the induction motor and exhibits an increment in the amplitude of ( 1 2 s ) f s and in the fundamental component of the stator current.
In all the analyzed stator currents, the mixed eccentricity components f l are present due to the non-absolutely symmetrical construction of the three-phase induction machine. A belt tensioning also affects the transmission system and leads to shaft misalignment signatures.

7. Discussion

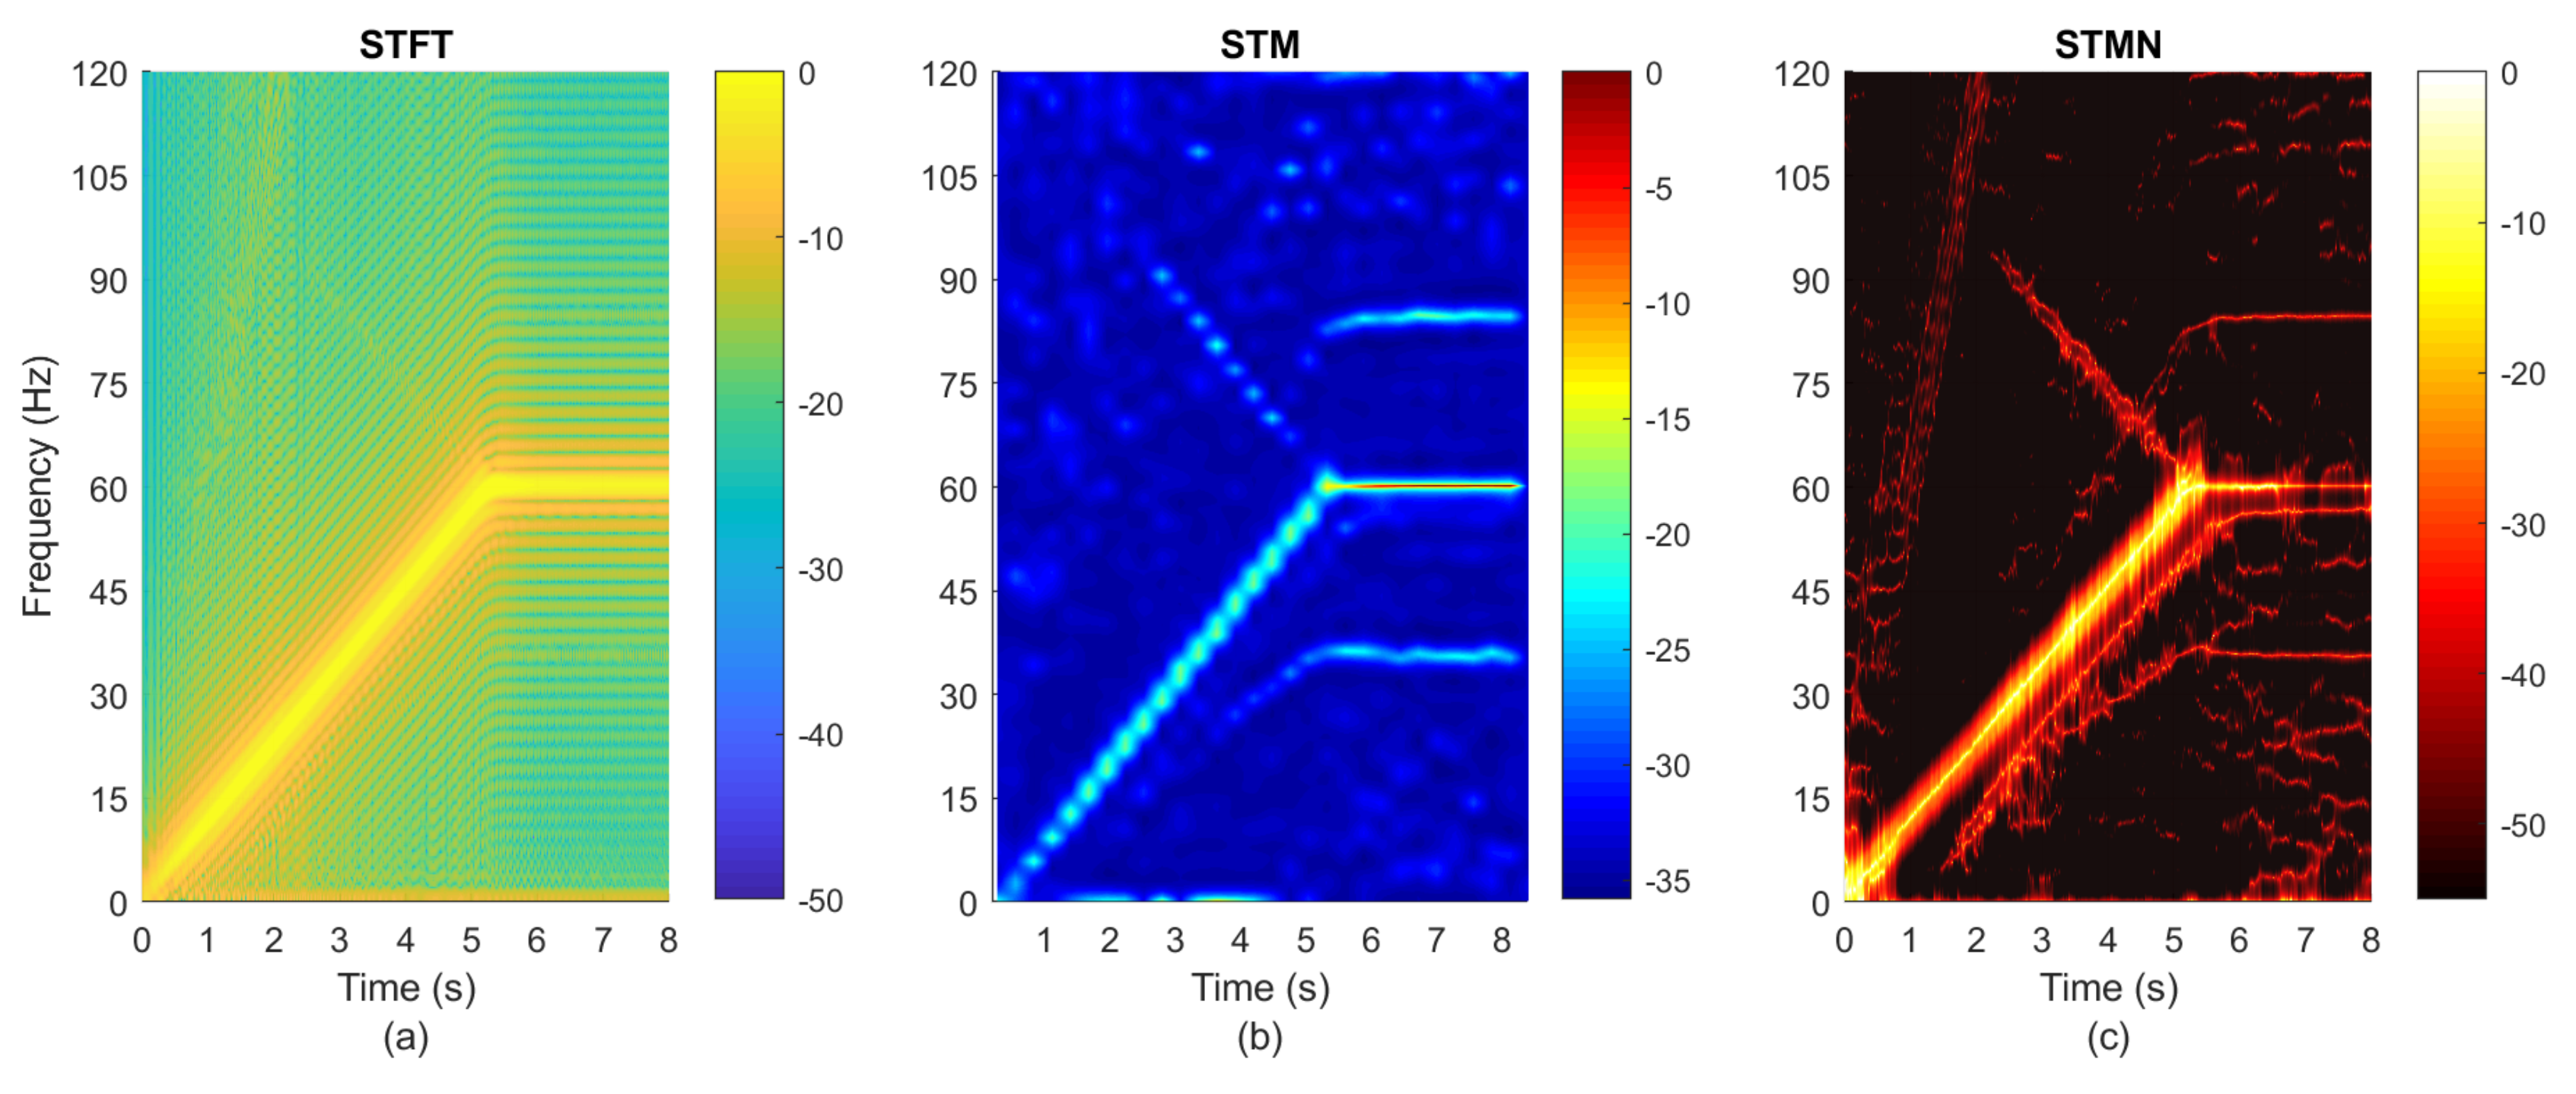
Figure 7 presents a comparison of the stator current analysis via short-time fourier transform (STFT), short-time MUSIC (STM), and finally the proposed short-time Minimum Norm. This figure demonstrates the effectiveness of the Short Time Minimum Norm (STMN) for improving the transient analysis of induction machines, and for enhancing the identification of fault frequency components at time variant conditions. The STFT analysis is presented in Figure 7a, where it can be seen that the ( t , f ) decomposition is not capable of distinguishing the multiple trajectories of the stator current harmonic content. Although STFT is simple to apply in comparison to other ( t , f ) decomposition tools, it has a poor frequency resolution and needs a wide window analysis to improve the spectrum estimation.
The experimental result in Figure 7b illustrates the ( t , f ) decomposition by MUSIC analysis and indicates that STM can detect misalignment components f l 1 and f l 1 + . However, stator current analysis via Min-Norm has the capability to identify the misalignment components and the rotor fault frequency also. The proposed t-f tool provides a high frequency resolution analysis for a robust condition monitoring of induction machines.The STMN tool can be used not only for stator current analysis but also for voltage, magnetic flux, vibrations or another condition monitoring signal.

8. Conclusions

In this paper, a new time-frequency analysis method has been proposed for fault detection in induction motors. The proposed methodology is suited for transient analysis, since it provides an improved sharpness time-frequency decomposition relative to classic methods. The results show that the proposed methodology can precisely decompose the multi-component and time-variant signal of an induction motor starting current, providing high time-frequency accuracy for fault detection purposes.

Author Contributions

Conceptualization, T.A.G.-C., D.M.-S. and R.d.J.R.-T.; data curation, R.d.J.R.-T., A.G.-P.; methodology, T.A.G.-C., D.M.-S.; software, T.A.G.-C., A.G.-P.; validation, A.G.-P. and O.D.-P.; writing—original draft, T.A.G.-C., O.D.-P.; writing—reviewing and editing, D.M.-S. and R.d.J.R.-T. All authors have read and agreed to the published version of the manuscript.

Funding

This research was partially supported by CONACyT scholarship 487058; and in part by the University of Guanajuato, DAIP, under grand 248495/2019.

Conflicts of Interest

The authors declare no conflict of interest.The funders had no role in the design of the study; in the collection, analyses, or interpretation of data; in the writing of the manuscript, or in the decision to publish the results.

Abbreviations

The following abbreviations are used in this manuscript:
ASDAdjustable Speed Drive
f b b Broken Bar frequency
FFTFast Fourier Transform algorithm
f l Load frequency
f r Rotor frequency
f s Fundamental supply frequency
FTFourier Transform
IMInduction Motors
LSHLeft Side Harmonic
Min-NormMinimum Norm
MUSICMultiple Signal Classification
PSHPrincipal Slot Harmonics
ρ Reduction relation
RSHRight Side Harmonic
sMotor slip
SNRSignal to Noise Ratio
STFTShort Time Fourier Transform
STMShort Time MUSIC
STMNShort Time Minimum Norm
( t , f ) time-frequency

Appendix A

Three-phase induction motor rated characteristics: Rated power = 0.74 kW, Rated voltage = 230/460 V, Rated current = 2.9/1.4, Rated speed = 3355 r.p.m., Power factor = 0.87, Efficiency = 75.5%.

Appendix B

Adjustable speed drive characteristics: Rated output voltage: 220/240 V, Rated output current: Start-up mode = Linear ( v / f ), Control mode: pulse width modulation (16 bits).

References

  1. Thomson, W.T.; Fenger, M. Current Signature Analysis to Detect Induction Motor Faults. IEEE Ind. Appl. Mag. 2001, 7, 26–34. [Google Scholar] [CrossRef]
  2. Bazan, G.H.; Scalassara, P.R.; Endo, W.; Goedtel, A.; Palácios, R.H.C.; Godoy, W.F. Stator Short-Circuit Diagnosis in Induction Motors Using Mutual Information and Intelligent Systems. IEEE Trans. Ind. Electron. 2019, 66, 3237–3246. [Google Scholar] [CrossRef]
  3. Duque-Perez, O.; Del Pozo-Gallego, C.; Morinigo-Sotelo, D.; Fontes Godoy, W. Condition Monitoring of Bearing Faults Using the Stator Current and Shrinkage Methods. Energies 2019, 12, 3392. [Google Scholar] [CrossRef] [Green Version]
  4. Gyftakis, K.N.; Platero, C.A.; Zhang, Y.; Bernal, S. Diagnosis of Static Eccentricity in 3-Phase Synchronous Machines using a Pseudo Zero-Sequence Current. Energies 2019, 12, 2476. [Google Scholar] [CrossRef] [Green Version]
  5. Henao, H.; Capolino, G.-A.; Cabanas, M.; Filippetti, F.; Bruzzese, C.; Strangas, E.; Pusca, R.; Estima, J.; Riera-Guasp, M.; Kia, S.H. Trends in Fault Diagnosis for Electrical Machines: A Review of Diagnostic Techniques. IEEE Ind. Electron. Mag. 2014, 8, 31–42. [Google Scholar] [CrossRef]
  6. Morales-Perez, C.; Rangel-Magdaleno, J.; Peregrina-Barreto, H.; Amezquita-Sanchez, J.P.; Valtierra-Rodriguez, M. Incipient Broken Rotor Bar Detection in Induction Motors Using Vibration Signals and the Orthogonal Matching Pursuit Algorithm. IEEE Trans. Instrum. Meas. 2018, 67, 2058–2068. [Google Scholar] [CrossRef]
  7. Yang, C.; Lee, S.B.; Jang, G.; Kim, S.; Jung, G.; Lee, J.; Shim, S.; Lim, Y.K.; Kim, J.; Park, S. Starting Current Analysis in Medium Voltage Induction Motors: Detecting Rotor Faults and Reactor Starting Defects. IEEE Ind. Appl. Mag. 2019, 25, 69–79. [Google Scholar] [CrossRef]
  8. Shi, J.; Du, G.; Ding, R.; Zhu, Z. Time Frequency Representation Enhancement via Frequency Matching Linear Transform for Bearing Condition Monitoring under Variable Speeds. Appl. Sci. 2019, 9, 3828. [Google Scholar] [CrossRef] [Green Version]
  9. Puche-Panadero, R.; Martinez-Roman, J.; Sapena-Bano, A.; Burriel-Valencia, J. Diagnosis of Rotor Asymmetries Faults in Induction Machines Using the Rectified Stator Current. IEEE Trans. Energy Convers. 2020, 35, 213–221. [Google Scholar] [CrossRef]
  10. Zhong, J.; Huang, Y. Time-Frequency Representation Based on an Adaptive Short-Time Fourier Transform. IEEE Trans. Signal Process. 2010, 58, 5118–5128. [Google Scholar] [CrossRef]
  11. Corral-Hernández, J.A.; Antonino-Daviu, J.A. Influence of the Start-up System in the Diagnosis of Faults in the Rotor of Induction Motors using the Discrete Wavelet Transform. Proc. Comput. Sci. 2016, 83, 807–815. [Google Scholar] [CrossRef] [Green Version]
  12. Blodt, M.; Regnier, J.; Faucher, J. Distinguishing Load Torque Oscillations and Eccentricity Faults in Induction Motors Using Stator Current Wigner Distributions. IEEE Trans. Ind. Appl. 2009, 45, 1991–2000. [Google Scholar] [CrossRef]
  13. Chen, X.; Feng, Z. Time-frequency space vector modulus analysis of motor current for planetary gearbox fault diagnosis under variable speed conditions. Mech. Syst. Signal Process. 2019, 121, 636–654. [Google Scholar] [CrossRef]
  14. Puche-Panadero, R.; Martinez-Roman, J.; Sapena-Bano, A.; Burriel-Valencia, J.; Riera-Guasp, M. Fault Diagnosis in the Slip—Frequency Plane of Induction Machines Working in Time-Varying Conditions. Sensors 2020, 20, 3398. [Google Scholar] [CrossRef]
  15. Fernandez-Cavero, V.; Morinigo-Sotelo, D.; Duque-Perez, O.; Pons-Llinares, J. A Comparison of Techniques for Fault Detection in Inverter-Fed Induction Motors in Transient Regime. IEEE Access 2017, 5, 8048–8063. [Google Scholar] [CrossRef]
  16. Pons-Llinares, J.; Antonino-Daviu, J.A.; Riera-Guasp, M.; Bin Lee, S.; Kang, T.; Yang, C. Advanced Induction Motor Rotor Fault Diagnosis Via Continuous and Discrete Time–Frequency Tools. IEEE Trans. Ind. Electron. 2015, 62, 1791–1802. [Google Scholar] [CrossRef]
  17. Garcia-Calva, T.A.; Morinigo-Sotelo, D.; Romero-Troncoso, R.J. Non-Uniform Time Resampling for Diagnosing Broken Rotor Bars in Inverter-Fed Induction Motors. IEEE Trans. Ind. Electron. 2017, 64, 2306–2315. [Google Scholar] [CrossRef]
  18. Morinigo-Sotelo, D.; Romero-Troncoso, R.J.; Panagiotou, P.A.; Antonino-Daviu, J.A.; Gyftakis, K.N. Reliable Detection of Rotor Bars Breakage in Induction Motors via MUSIC and ZSC. IEEE Trans. Ind. Appl. 2018, 54, 1224–1234. [Google Scholar] [CrossRef]
  19. Garcia-Calva, T.A.; Morinigo-Sotelo, D.; Garcia-Perez, A.; Camarena-Martinez, D.; Romero-Troncoso, R.J. Demodulation Technique for Broken Rotor Bar Detection in Inverter-Fed Induction Motor Under Non-Stationary Conditions. IEEE Trans. Energy Convers. 2019, 34, 1496–1503. [Google Scholar] [CrossRef]
  20. Romero-Troncoso, R.J. Multirate Signal Processing to Improve FFT-Based Analysis for Detecting Faults in Induction Motors. IEEE Trans. Ind. Inform. 2017, 13, 1291–1300. [Google Scholar] [CrossRef]
  21. Garcia-Calva, T.A.; Morinigo-Sotelo, D.; Garcia-Perez, A.; Romero-Troncoso, R.J. Rotor Fault Detection in Inverter-Fed Induction Motors Using Speed Analysis of Startup Transient. In Proceedings of the 2019 IEEE 12th International Symposium on Diagnostics for Electrical Machines, Power Electronics and Drives (SDEMPED), Toulouse, France, 27–30 August 2019; pp. 297–302. [Google Scholar] [CrossRef]
  22. Boashhash, B. Time Frequency Signal Analysis and Processing, A Comprehensive Reference, 1st ed.; Elsevier: Oxford, UK, 2003. [Google Scholar]
  23. Singleton, R.K.; Strangas, E.G.; Aviyente, S. The Use of Bearing Currents and Vibrations in Lifetime Estimation of Bearings. IEEE Trans. Ind. Inform. 2017, 13, 1301–1309. [Google Scholar] [CrossRef]
  24. Marzebali, M.H.; Faiz, J.; Capolino, G.; Kia, S.H.; Henao, H. Planetary Gear Fault Detection Based on Mechanical Torque and Stator Current Signatures of a Wound Rotor Induction Generator. IEEE Trans. Energy Convers. 2018, 33, 1072–1085. [Google Scholar] [CrossRef]
  25. Joksimović, G.M.; Riger, J.; Wolbank, T.M.; Perić, N.; Vašak, M. Stator-Current Spectrum Signature of Healthy Cage Rotor Induction Machines. IEEE Trans. Ind. Electron. 2013, 60, 4025–4033. [Google Scholar] [CrossRef]
  26. Mirzaeva, G.; Saad, K.I. Advanced Diagnosis of Stator Turn-to-Turn Faults and Static Eccentricity in Induction Motors Based on Internal Flux Measurement. IEEE Trans. Ind. Appl. 2018, 54, 3961–3970. [Google Scholar] [CrossRef]
  27. Faiz, J.; Ebrahimi, B.M.; Akin, B.; Toliyat, H.A. Comprehensive Eccentricity Fault Diagnosis in Induction Motors Using Finite Element Method. IEEE Trans. Magn. 2009, 45, 1764–1767. [Google Scholar] [CrossRef]
  28. Yahia, K.; Sahraoui, M.; Cardoso, A.J.M.; Ghoggal, A. The Use of a Modified Prony’s Method to Detect the Airgap-Eccentricity Occurrence in Induction Motors. IEEE Trans. Ind. Appl. 2016, 52, 3869–3877. [Google Scholar] [CrossRef]
  29. Asad, B.; Vaimann, T.; Belahcen, A.; Kallaste, A.; Rassõlkin, A.; Iqbal., M.N. Broken rotor bar fault detection of the grid and inverter-fed induction motor by effective attenuation of the fundamental component. IET Electr. Power Appl. 2019, 13, 2005–2014. [Google Scholar] [CrossRef]
  30. Elvira-Ortiz, D.A.; Morinigo-Sotelo, D.; Zorita-Lamadrid, A.L.; Osornio-Rios, R.A.; Romero-Troncoso, R.J. Fundamental Frequency Suppression for the Detection of Broken Bar in Induction Motors at Low Slip and Frequency. Appl. Sci. 2020, 10, 4160. [Google Scholar] [CrossRef]
  31. Khezzar, A.; Kaikaa, M.Y.; Oumaamar, M.E.K.; Boucherma, M.; Razik, H. On the Use of Slot Harmonics as a Potential Indicator of Rotor Bar Breakage in the Induction Machine. IEEE Trans. Ind. Electron. 2009, 56, 4592–4605. [Google Scholar] [CrossRef]
  32. Yang, Z.; Xie, L.; Stoica, P. Vandermonde Decomposition of Multilevel Toeplitz Matrices With Application to Multidimensional Super-Resolution. IEEE Trans. Inf. Theory 2016, 62, 3685–3701. [Google Scholar] [CrossRef] [Green Version]
  33. Van Trees, H.L. Optimum Array Processing Part IV of Detection, Estimation, and Modulation Theory; John Wiley & Sons, Inc.: New York, NY, USA, 2002. [Google Scholar]
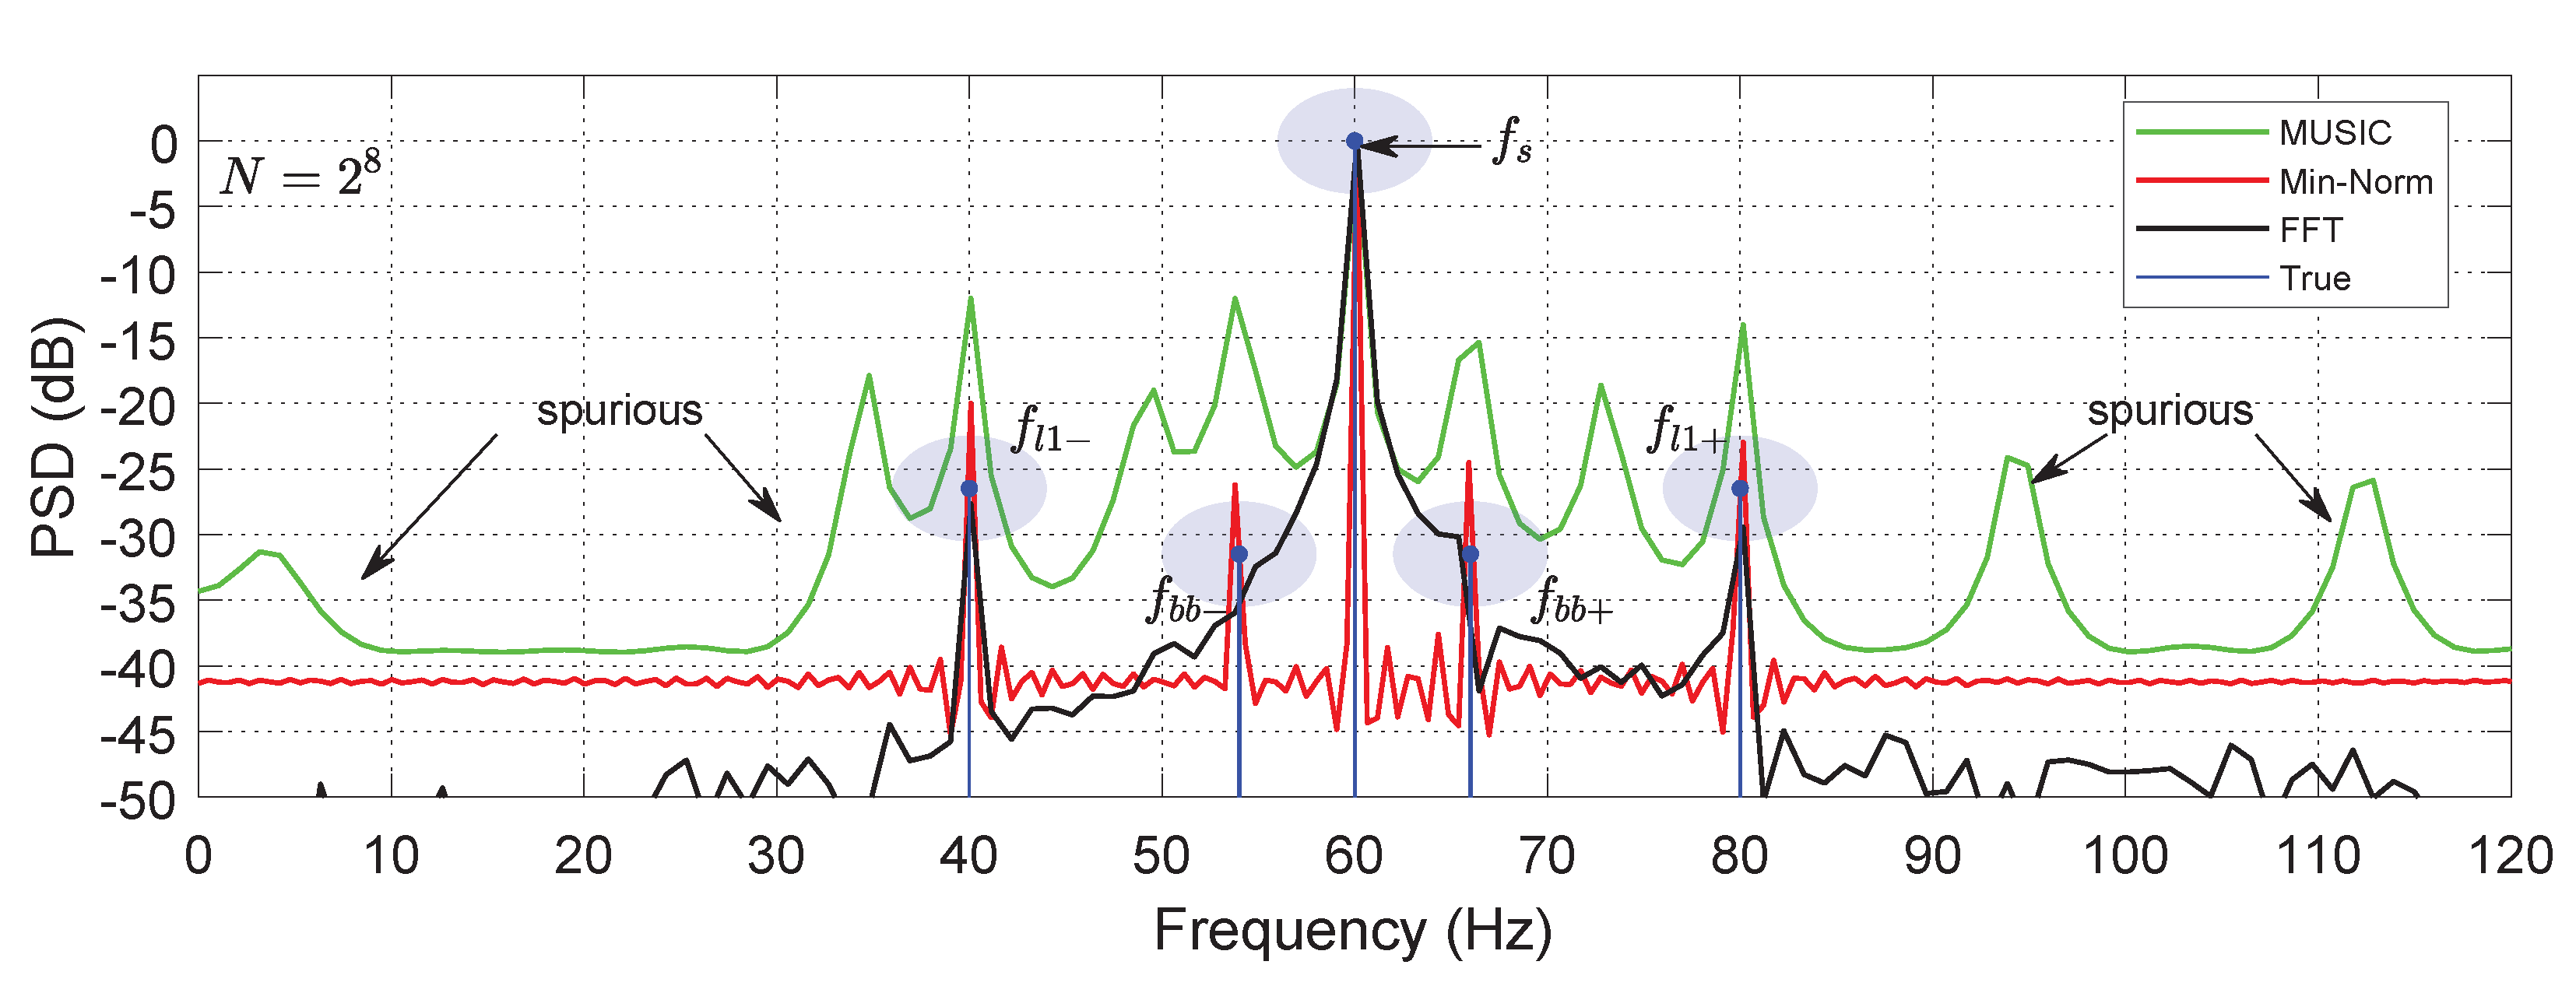
Figure 1. Comparison of spectra obtained from simulated data (IM stator current in white noise data record length of N = 256 ), using: FFT, MUSIC, Min-Norm, and the true values.
Energies 13 04102 g001
Figure 2. Representation of motor speed and slip during a startup transient, when the motor is started by: (a) from the line, and (b) by an adjustable speed drive.
Energies 13 04102 g002
Figure 3. Time-frequency representation of harmonic components during a startup transient of an induction motor fed: (a) from the line, and (b) by an adjustable speed drive.
Energies 13 04102 g003
Figure 4. Stator current experimental waveform during startup transient of induction motor feds by: (a) Power grid. (b) Adjustable speed drive.
Energies 13 04102 g004
Figure 5. Min-Norm ( t , f ) analysis of the starting current with the adjustable speed drive (ASD) induction motor driving a rated load, for the case of: (a) Healthy motor. (b) Mechanical misalignment. (c) Motor with one broken rotor bar.
Energies 13 04102 g005
Figure 6. Min-Norm ( t , f ) analysis of the starting current with the line-fed induction motor driving a rated load, for the case of: (a) Healthy motor. (b) Mechanical misalignment. (c) Motor with one broken rotor bar.
Energies 13 04102 g006
Figure 7. ( t , f ) analysis of the starting current with the ASD-fed induction motor driving a rated load, for the case of rotor fault. Time-frequency analysis by: (a) Short-Time Fourier Transform. (b) Short-Time MUSIC. (c) Short-Time Minimum Norm.
Energies 13 04102 g007