Abstract
In the grid-tied micro-grid context, energy resilience can be defined as the time period that a local energy system can supply the critical loads during an unplanned upstream grid outage. While the role of renewable-based micro-grids in enhancing communities’ energy resilience is well-appreciated, the academic literature on the techno-economic optimisation of community-scale micro-grids lacks a quantitative decision support analysis concerning the inclusion of a minimum resilience constraint in the optimisation process. Utilising a specifically-developed, time-based resilience capacity characterisation method to quantify the sustainability of micro-grids in the face of different levels of extended grid power outages, this paper facilitates stakeholder decision-making on the trade-off between the whole-life cost of a community micro-grid system and its degree of resilience. Furthermore, this paper focuses on energy infrastructure expansion planning, aiming to analyse the importance of micro-grid reinforcement to meet new sources of electricity demand—particularly, transport electrification—in addition to the business-as-usual demand growth. Using quantitative case study evidence from the Totarabank Subdivision in New Zealand, the paper concludes that at the current feed-in-tariff rate (NZ$0.08/kWh), the life cycle profitability of resilience-oriented community micro-grid capacity reinforcement is guaranteed within a New Zealand context, though constrained by capital requirements.
1. Introduction
The past two decades have witnessed a remarkable evolution of micro-grids (MGs) from a nascent concept to a pivotal player in the transition to 100% renewable energy [1,2,3]. The power industry has accordingly seen an ever-increasing penetration of distributed energy resources into utility grids. The key drivers behind the stakeholders’ willingness towards additional, often non-trivial, capital investments for resilience capacity are [4,5,6]: (1) the constantly falling costs of renewable energy technologies, which are transforming the economics of green energy, most notably solar photovoltaic (PV) panels and battery energy storage systems (BESSs), (2) the growing awareness about the inadequacy of current approaches to energy resilience at community-scale, specifically the use of diesel generators to provide backup power during utility grid outages, and (3) the growth of engaged prosumers, who place great value on their energy self-sufficiency for sustainable living.
In the context of on-grid MGs, energy resilience is generally defined as “the amount of time that an MG can sustain critical loads during a grid outage”, and often serves as a synonym for outage survivability [7]. A recent, growing strand of the literature has documented and emphasised the increasingly important role of planning for resilience within the context of grid-tied MGs, which, in turn, improves the resilience of a nation’s entire power grid. For instance, Eskandarpour et al. [8] have formulated a mixed-integer linear programming problem for the optimal sizing and siting of MGs within power systems by considering the cost of unserved energy during utility grid outages as the objective function, while adhering to a limited budget for resilience improvements. In another instance, Barnes et al. [9] have revealed the potentially significant benefits of including energy resilience constraints in the long-term investment planning problem of networked MGs in terms of the prolonged outage survivability and overall cost-efficiency. Furthermore, Anderson et al. [7] have shown the economic and resilience benefits delivered by renewable energy technologies in a hybrid MG. More specifically, they have demonstrated that adding a 845-kW PV system together with a 172-kWh BESS to an existing 305 kW of backup diesel generators extends the time period the MG can sustain crucial loads by 1.8 days, while generating savings of US$104,000 in energy costs over the reinforced MG life-cycle. Table 1 provides an overview of recent studies centred on the optimal capacity expansion planning of grid-tied renewable energy systems. Moreover, Table 2 presents a summary of the previous studies that focused on the long-term, integrated resource and resilience planning in the context of renewable and sustainable energy systems (in addition to the studies reviewed above). The reader is referred to [10] for a more detailed review of the methods and research trends in the MG resilience improvement literature.

Table 1.
Summary of the recent previous work dealing with the cost-optimal capacity expansion planning of renewable energy systems.
Table 2.
Summary of the previous work focused on the integration of resilience constraints into the long-term investment planning processes of renewable energy systems.
As Table 1 and Table 2 indicate, no previous study, as far as can be ascertained, has introduced a systematic method to quantify the cost of insuring grid-tied renewable energy systems against sustained grid outages in the optimal equipment capacity expansion planning processes—to meet some desired minimum level of resilience. Accordingly, this paper bridges the gap between these two streams of literature by proposing a modelling framework to estimate the additional costs incurred to procure energy resilience in the optimal capacity expansion planning processes of grid-connected community MGs. The paper additionally presents a sensitivity analysis to highlight the impact of varying minimum degrees of energy resilience required by stakeholders on the optimal life-cycle costs associated with the capacity reinforcement of grid-connected MGs.
The remainder of this paper is organised as follows. Section 2 describes the overall structure of the test-case, the fundamental assumptions underlying the study, and data requirements for the case study. Section 3 provides the modelling approach, while Section 4 presents the results and examines the robustness of optimal MG capacity configurations. Finally, conclusions are made and potential areas for future work are discussed in Section 5.
2. Test-Case System: Totarabank, New Zealand
The Totarabank Subdivision consists of eight freehold residential lots (ranging in size from 1200 m2 to 2100 m2) and a communal building (on the ninth, common lot) with a large area of around 6 ha held in common ownership [23]. Located in central Wairarapa, New Zealand (GPS coordinates: 41°1′4” S 175°40′0” E), the subdivision adheres to sustainability design criteria to suggest ways for resilience integration. Figure 1 shows the geographical location and description of the case study subdivision Totarabank.
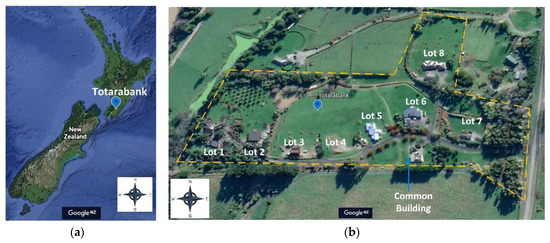
Figure 1.
Satellite photographs of the case study area: (a) location of the subdivision on a New Zealand map; (b) layout of the subdivision showing the lots (image courtesy of Google Earth).
As of May 2020, Totarabank has 14 inhabitants, and an existing installed grid-integrated power generation capacity of 11.4 kW, 100% from solar PV modules, which have an average remaining life span of 19.25 years. Accordingly, the load power demand is met through electricity importing from the main grid at night when the onsite PV system is not delivering, while any surplus electricity is sold back to the grid during the day. However, the primary issue of the current power dispatching strategy is its failure to serve the crucial loads at night if the upstream network fails or requires maintenance. This, together with the anticipated growth in demand (led by the electrification of transport), reveals the necessity for the reinforcement of the current energy system—to improve the site’s energy resilience, self-sufficiency, and security of supply.
2.1. Candidate Technologies
The considered site is richly endowed with renewable energy resources, particularly solar and wind. The candidate technologies included in the model for optimisation are (1) PV modules, (2) wind turbines (WTs), and (3) a BESS. Furthermore, an unreported preliminary techno-economic study suggested that a BESS is the most cost-effective technology for onsite energy storage among feasible options for Totarabank, namely hydrogen storage system (electrolyser, hydrogen reservoir, and fuel cell), batteries, flywheels, and super-capacitors. More specifically, a Li-ion battery system was chosen, as it offers the best combination of energy density, low self-discharge, and manufacturing cost, compared with other mature battery technologies [24]. Accordingly, the selected components were assembled in an AC-coupled configuration to form the grid-connected MG shown in Figure 2.
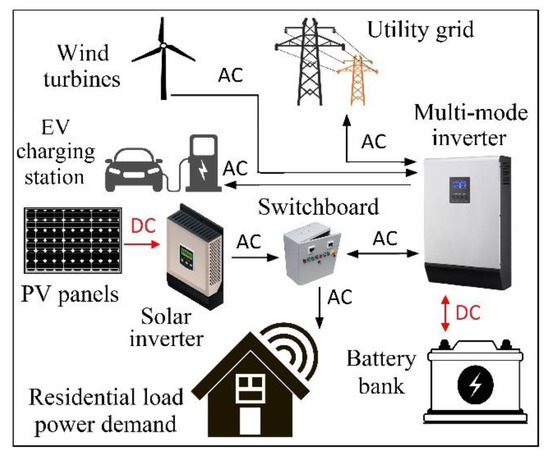
Figure 2.
Schematic of the conceptualised grid-tied, AC-coupled MG system.
2.1.1. PV Modules
The power output from each PV module in time is obtained from Equation (1) as a function of solar irradiance and the module’s temperature, which is estimated from Equation (2) [25].
where , , , , and denote the module’s rated power, efficiency, derating factor, temperature coefficient, and nominal operating cell temperature, respectively; is the global horizontal irradiance in time ; and represent the solar irradiance and temperature at the standard test conditions, respectively; and is the ambient temperature.
2.1.2. Wind Turbines
The power output from each WT is obtained from the manufacturer-provided power curve, shown in Figure 3 [26]. Additionally, the wind speed data is hub height normalised using the power-law, which is expressed in Equation (3) [27].
where represents wind speed measured at the height of in time , and is the wind shear exponent.
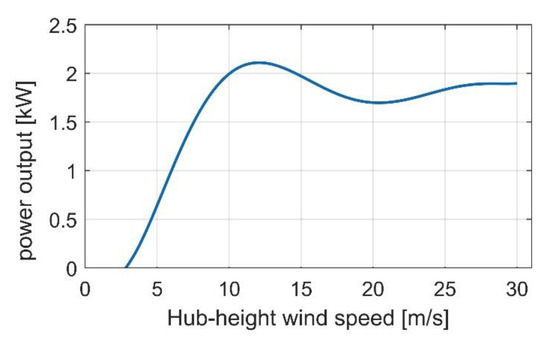
Figure 3.
Power curve of the selected wind turbine. Data source: [26].
2.1.3. Battery Arrays
The energy content of the battery bank, comprising of battery packs connected in parallel, in time can be calculated from Equation (4) [28].
where denotes the operating time increment and is the charging/discharging power of the battery bank in time that can be calculated based on the system-wide supply-demand balance constraint from Equation (5) [29].
where is the power output from WTs in time , is the exchanged power with the utility grid, a positive (negative) value of which represents an imported (exported) power, and is the total residential load power demand. A positive value of represents the charging state, whereas negative values signify the discharging state.
Moreover, the energy stored in each battery pack is constrained to lie within the feasible range of values, [ ].
2.1.4. Hybrid Inverter
A grid-interactive inverter (also called multi-mode battery inverter/charger, or bidirectional dual-mode hybrid inverter) is used in an AC-coupled configuration, which is capable of managing inputs from multiple sources in both on- and off-grid operating modes. The hybrid inverter is modelled by its overall efficiency.
2.1.5. Utility Grid
The cost of importing/exporting electricity from/to the utility grid in time is obtained from Equation (6) [30].
where is the wholesale power price in time and represents a fixed feed-in-tariff.
2.1.6. Electric Vehicle Charging Station
AC level 2 charging, which is the most common home charging solution, is considered in this project [31]. Accordingly, a level 2 electric vehicle supply equipment (EVSE) is employed, which is modelled by its efficiency. It is connected directly to the MG’s hybrid inverter via a dedicated circuit and provides charging through a 240 V AC plug.
2.2. Key Assumptions
The following simplifying assumptions were made:
- The MG capacity expansion planning was carried out from a macro (centralised) perspective. Accordingly, this study does not focus on how to optimally assign the equipment capacity to each lot.
- The costs associated with the replacement and operation and maintenance (O&M) of the existing installed solar inverters were not reflected in the model. The reason lies in the fact that these assets are privately owned, while the new capacity additions were assumed to be shared by the community. That is, accounting for the replacement and O&M costs of the currently privately held solar inverters will require more sophisticated market designs (such as peer-to-peer markets) for the intra-community electricity exchanges to establish a fair playing field—which are currently cleared under a pure flat-rate tariff structure. Note that the rationale behind making this assumption stems from the difference in the service life of PV panels and solar inverters.
- The energy stored in the stationary battery bank is not allowed to be used for electric vehicle (EV) charging purposes—allowed only for critical loads to address the resilience of the community and to improve the service life of the stationary battery bank.
- The case study site’s mobility requirements were assumed to be 40 km/day/lot, while the EVs’ average efficiency was assumed to be 0.12 kWh/km, considering a Nissan Leaf, which is New Zealand’s most popular EV [32,33,34].
- A cooperative energy scheduling strategy (for example the one proposed in [35]), to be materialised in the implementation phase, was assumed to be able to coordinate the flexible charging of EVs, such that the daily periods of time the EV charging infrastructure sits unused is minimised.
- Vehicle-to-grid (V2G) services [36], as well as the effect of load growth due to the eco-village’s population growth, were not taken into consideration. Rather, the system expansion is planned to meet the expectation of growing loads from the existing number of inhabitants.
- The product models were chosen, based on the authors’ judgement of both efficiency and cost-effectiveness, from the options available in the Australia and New Zealand renewable energy markets, while costs are always cited in New Zealand currency.
2.3. Data
The techno-economic specifications of the selected components and the associated sources are summarised in Table 3.
Table 3.
Techno-economic specifications of the components.
Moreover, in view of the study objectives and simplifying assumptions outlined above, the costs associated with the EVSE were exogenously treated. More specifically, they were taken into account through cost premiums imposed on the optimised MG whole-life cost solutions. Specifically, the Delta AC Mini Plus EVSE, was chosen in this analysis to serve the level 2 charging. It has the following techno-economic specifications [49,50]: capital and replacement costs = $2564/unit, O&M cost = $17/unit/year, service life = 25 years, efficiency = 99%, maximum output power = 7.36 kW, and input rating = 230 V AC. Accordingly, the EV charging load was classified as deferrable, the monthly average value of which was assumed to be constant throughout the year, with an average value of 48 kWh/d, and a peak value of (n × 7.36) kW, in compliance with the maximum power output from n EV chargers.
Table 4 presents the data and sources for the parameter settings of the conceptualised MG system.
Table 4.
Conceptualised MG system’s scalars and sources.
Figure 4 shows the average wholesale power price for each hour across the five-year period of 2015 to 2019 [57], which were considered as forecasts of utility power price.
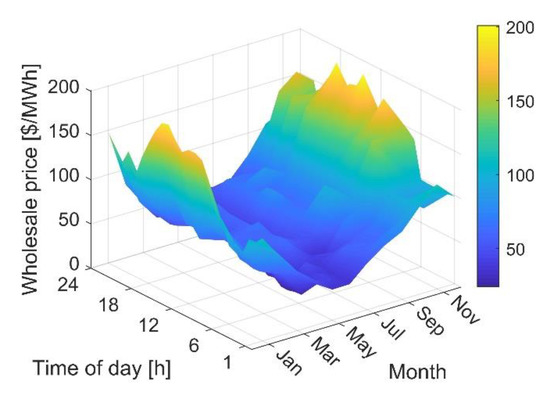
Figure 4.
Forecasted profile for the wholesale electricity price at hourly resolution. The numerical values belonging to this figure are listed in Table S1 in Supplementary Material.
Figure 5 depicts the forecasted residential load power demand profile. The time-series data were synthesised from the GREEN Grid household electricity demand data [58] through downscaling the GREEN Grid study’s sample of dwellings to the Totarabank’s household population according to the proportionate scaling method described in [59].
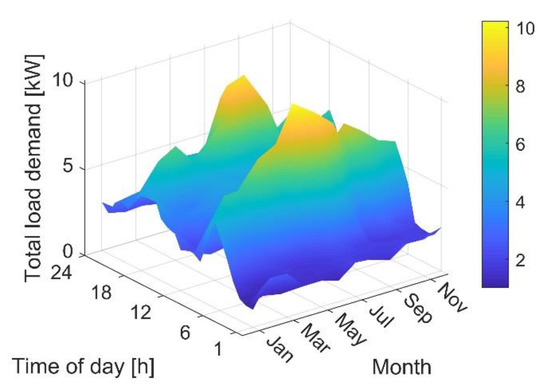
Figure 5.
Forecasted profile for residential loads at hourly resolution. The numerical values belonging to this figure are listed in Table S2 in Supplementary Material.
Forecasts of wind and solar resources were determined using the NASA Surface Meteorology and Solar Energy database [52]. Accordingly, the monthly-averaged wind speed values over a 10-year historical period, and monthly-averaged insolation and air temperature values over a 22-year historical period were retrieved from the database. Monthly mean forecasts of wind speed and solar radiation are shown in Figure 6, while Figure 7 displays monthly mean temperature [52]. In general, an annual average wind speed value of 5 m/s, and an annual insolation value of 4 kWh/m2/d are commonly considered acceptable thresholds for the commercial viability of wind and solar projects, while seasonal variations of resources can also affect the optimal resource combination of a PV/WT renewable energy system [60]. As can be seen from Figure 6, not only is wind energy a more reliable source of power than solar in the considered area, but it also shows a more constant trend than solar energy.
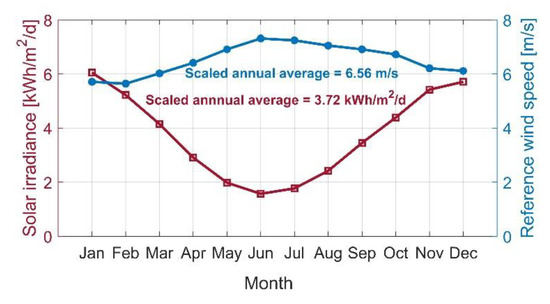
Figure 6.
Forecasted monthly average insolation and wind speed data.
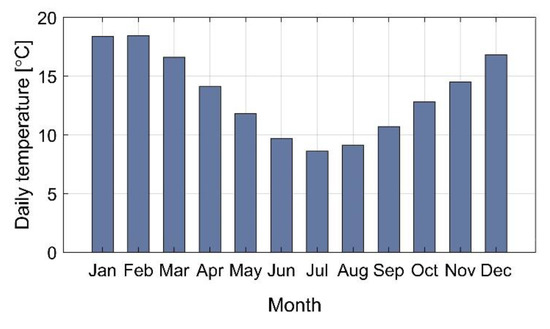
Figure 7.
Forecasted monthly average ambient temperature data.
3. Methodology
This section presents the methodology developed for the resilience-constrained capacity expansion planning of MGs.
3.1. Modelling Approach
The U.S. National Renewable Energy Lab’s Hybrid Optimization of Multiple Energy Resources (HOMER) Pro software (version 3.13.8) [61] was used to minimise the project’s life-cycle cost subject to techno-economic design constraints for different levels of energy resilience. The software features two algorithms to search for the cost-optimal design configuration: (1) an original grid search algorithm that simulates all of the feasible resource combinations that meet the loads, and (2) a new proprietary derivative-free optimisation algorithm, called “HOMER Optimizer”, which frees the user from the need to define the search space. Additionally, the conceptualised MG’s life-cycle cost reflects all of the cost components associated with supplying energy to the considered site in present value, namely, the capital, replacement, and O&M costs of new energy infrastructure, as well as the net cost of energy exchange with the utility grid. At each time-step of the MG operation, an energy dispatch analysis is carried out, whereby the load demand is served by the least-cost combination of dispatchable and non-dispatchable distributed energy generation units, released energy from storage devices, traded energy with the upstream grid, and load shifting. Additionally, deferrable loads are placed in second priority, and supplied using the surplus power (to the needs of primary loads) from non-dispatchable micro-generation units—solar PV and WT technologies—ahead of charging the storage devices. The energy scheduling problem is solved for each time-step of the baseline year and is repeated for the remaining years of the planning horizon, while discounting future cash flows to adjust the results for inflation. HOMER Pro is also equipped with the “Multi-Year” module, which allows for modelling the dynamic characteristics of the economic MG planning problem by running a simulation for each ensuing year of the project lifetime. However, since the HOMER Optimizer does not support multi-year planning, first, the optimal capacity configuration was determined using the HOMER Optimizer without considering the dynamic characteristics of the problem, and then the search space was defined based on the preliminary results obtained, with adequate margins, in size steps of 1 unit. Finally, the model was re-run using the HOMER’s original grid search algorithm—which simulates all of the feasible equipment capacity combinations with respect to the defined design space. This enabled avoiding sub-optimal solutions, while retaining computational tractability. The conceptualised MG system was simulated under both the cycle-charging and load-following energy dispatch strategies in each simulation case, and the strategy that resulted in a lower levelised cost of energy (LCOE) was selected as the optimum solution.
In addition, HOMER employs specifically-developed algorithms to synthesise one-year of hourly time-series insolation, air temperature, and wind speed data from the corresponding monthly average values to reflect the characteristics of real data (of the same level of granularity) in terms of seasonal, daily, and hourly patterns. Accordingly, hourly-basis, year-round profiles for weather data were derived based on the corresponding monthly average data, shown in Figure 6 and Figure 7.
3.2. Characterisation of Energy Resilience
To quantify the resilience capacity of the MG system to prolonged utility grid outages, the simulation was executed multiple times with varying values of grid reliability. Three built-in parameters in HOMER Pro were used to characterise the grid reliability, namely, (1) mean outage frequency, (2) mean repair time, and (3) repair time variability. Each random outage was injected into the model at a pseudo-random time-step throughout the year-long operational period, while the associated failure duration was determined by independent sampling from a normal distribution defined by mean repair time and repair time variability. Accordingly, the mean outage frequency was varied from 1 to 20 in steps of 1, the mean repair time was varied from 1 h to 168 h (2 weeks) in steps of 4 h, while the repair time variability was fixed at 1 h—which adds a stochastic dimension to the model. That is, 840 ((168 h/4 h) × 20 frequencies) independent outage time-series were produced for the optimisation model. Moreover, to improve the cost-efficiency of the optimal MG capacity configuration solutions, the model was designed to sustain only the critical loads during extended utility grid outages.
In this light, the total load on the MG system was partitioned into critical and non-critical loads, and non-critical loads were turned off when the grid was off. To this end, first, the residential load duration curve was derived by sorting the hourly-basis, one-year residential load curve, as illustrated in Figure 8. Accordingly, the average value of intermediate loads was determined and set as the threshold criterion for residential load partitioning. More specifically, the residential load profile was clipped at this point to form the critical residential load profile. The amounts of residual residential demand that was left from the peak being clipped established the profile of time-stamped non-critical residential load demand, which was only active under the normal, grid-connected operation regime. Additionally, in the grid outage events, the deferrable load was limited to as much as the energy needed to fully charge one EV (Nissan Leaf, battery capacity = 30 kWh [34])—to meet the emergency management needs at the site.
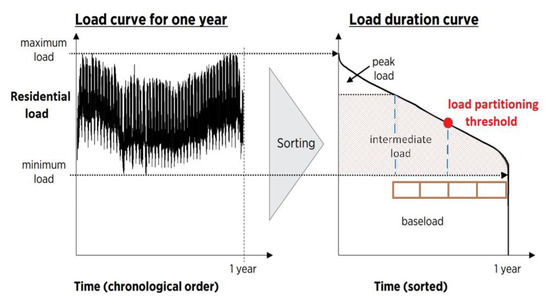
Figure 8.
Illustration of the proposed method to determine the load partitioning threshold on a representative load duration curve presented in [62]. (The load curve was taken from the cited reference, and then adapted to describe the proposed load partitioning process.)
3.3. Model Assumptions and Design Standards
Table 5 lists further input data for the model parameters and their respective sources.
Table 5.
MG capacity expansion planning model’s parameters.
Figure 9 shows a flowchart of the research methodology to include energy resilience criteria in the long-term MG optimisation model implemented in HOMER, which is illustrated by means of the considered case study example. As Figure 9 shows, first, the HOMER model is run for each of the above-described 840 outage time-series for the test-case under investigation and the solutions are recorded. Then, the model results of the numerical case example at each simulation run are aggregated to obtain the sensitivity of the total discounted system costs, energy exchange levels with the national grid, and the optimal MG configuration to the variations of the key grid outage parameters.
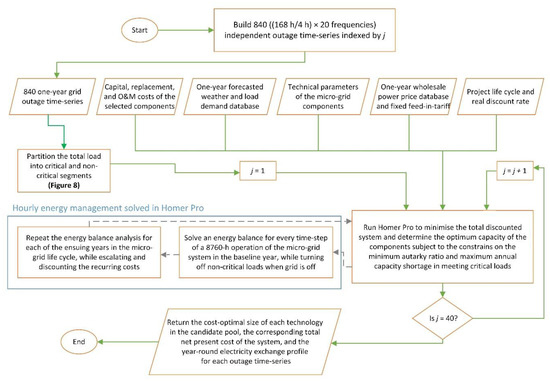
Figure 9.
Flowchart of the research methodology.
4. Results and Discussion
This section presents and discusses the numerical simulation results obtained for the test-case MG laid out in Section 2 by applying the method described in Section 3.
4.1. Feasibility and Optimal Capacity Configuration
The optimum equipment capacity configuration was determined first with the grid reliability level set at 100%. Table 6 presents the optimisation results for this baseline scenario. (It should be noted that all the simulation results are based on the manufacturer-provided equipment specifications and technical data, which represent the performance of the equipment under standard test conditions.) The table demonstrates that a WT is a more economically viable power generation technology than solar PV for generation expansion at the considered site, as it could be expected from the historical meteorological data (see Figure 6). However, given the complementary daily and seasonal cycles of wind speed and insolation, the existing installed capacity of solar PV is still expanded in the cost-optimal solution, albeit by a small margin. This not only validates the viability of the existing PV generation system, but also indicates its sizeable impact on the diversification of the feasible future generation mix for the site.
Table 6.
Optimal capacity additions and corresponding costs for a 100% reliable grid.
The total net present cost (TNPC) of the system is broken down into the main cost components in Figure 10. Three key observations emerge collectively from Table 6 and Figure 10, which can be generalised to any MG capacity reinforcement problem: (1) the system’s low O&M costs helped offset its relatively high capital costs, which were mainly generated by new WT and BESS capacity additions, (2) a comparison of the obtained LCOE with the current average price of domestic electricity in the Wairarapa region, New Zealand, where the site is located ($0.34/kWh [70]) indicates that an optimally planned community-based renewable power generation system even surpasses retail grid parity, and (3) the negative value obtained for the net energy purchased from the utility grid suggests that not only did energy exchange with the utility grid provide power quality benefits and help avoid energy spillage (which was often carried out through a dedicated dump load to balance supply and demand), but it also contributed to the profitability of the project, albeit slightly.
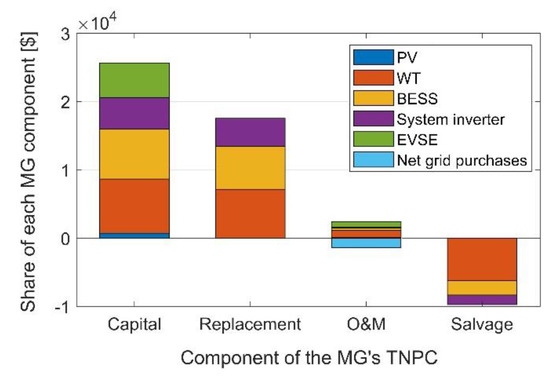
Figure 10.
Breakdown of the MG’s total net present cost ($).
To understand in more detail the active power flow pattern between the MG and the main grid, the year-round profiles for energy purchased from the grid and energy sold to the grid, obtained for the cost-minimal solution under normal, grid-connected conditions, are plotted in Figure 11 and Figure 12, respectively. The trends visible when comparing the figures are revealing. The battery bank in the optimal equipment combination enabled the MG to engage in energy arbitrage, by charging when utility rates were low and discharging during more remunerative times of day, (The buy-back rate is fixed at NZ$0.08/kWh. However, given the availability of long-term data forecasts, the optimisation protocol incorporates some degree of forward-looking behaviour into the energy exchange decision-making process with respect to the load on the MG in the medium to longer term—identifying the more profitable time-steps for feeding power back into the grid. That is, the profitability is measured independently of the single rate feed-in tariff.) and/or by shifting the excess power from non-dispatchable renewables for sale at more valuable times of day. This, additionally, helped reduce peak demand charges.
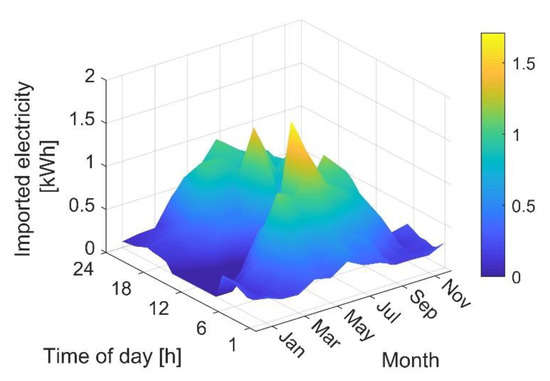
Figure 11.
Year-round profile for energy purchased from the grid (kWh). The numerical values belonging to this figure are listed in Table S3 in Supplementary Material.
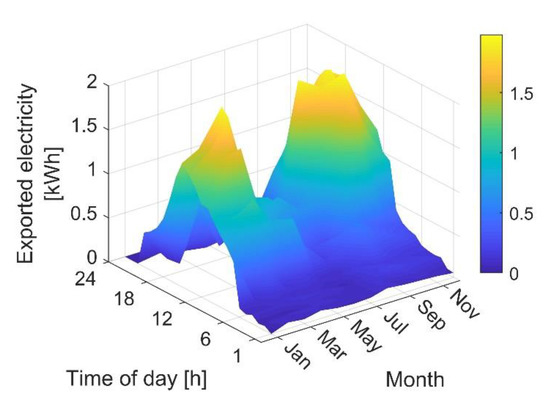
Figure 12.
Year-round profile for energy sold to the grid (kWh). The numerical values belonging to this figure are listed in Table S4 in Supplementary Material.
4.2. The Cost of Energy Resilience
Using the methodology described in Section 3 for the planning for energy resilience, the optimal MG capacity expansion problem was solved independently to global optimality for a series of different scenarios defined by mean grid outage frequency and mean grid repair time. As an example, Figure 13 shows the one-year outage database (with hourly intervals) built stochastically for the middle-case scenario, with a grid outage frequency of 10 per year and a mean repair time of 84 h. Accordingly, Figure 14 and Figure 15 respectively depict the resulting TNPC and the corresponding LCOE of the MG expansion under varying degrees of grid reliability characterised by the above two parameters. Moreover, the total annual amount of electricity sold to the grid [kWh] and the total annual amount of electricity purchased from the grid (kWh) at different grid reliability levels are displayed in Figure 16 and Figure 17, respectively. Note that all of the results presented in this sub-section are adjusted for the EVSE costs, which were determined outside the model by matching the charging station’s capacity to the peak EV charging demand of the site subject to the cooperative use of the charging infrastructure. Such cooperative behaviour within the community is expected to uphold the installation of only two EV chargers at the site (as indicated in Table 6) to fit for the considered multi-family community’s energy demand for mobility.
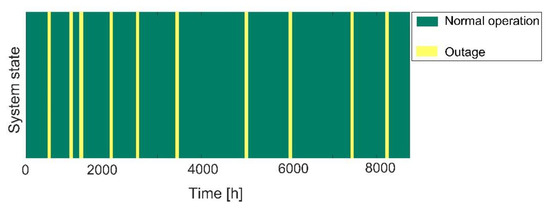
Figure 13.
Micro-grid system state (normal/outage) for the middle-case outage scenario.
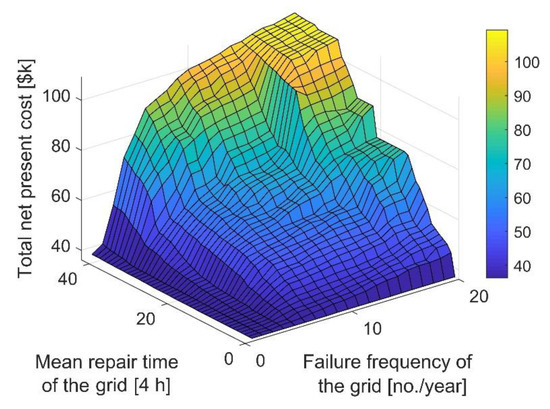
Figure 14.
Sensitivity of the MG’s TNPC to variations in grid reliability parameters. The numerical values belonging to this figure are listed in Table S5 in Supplementary Material.
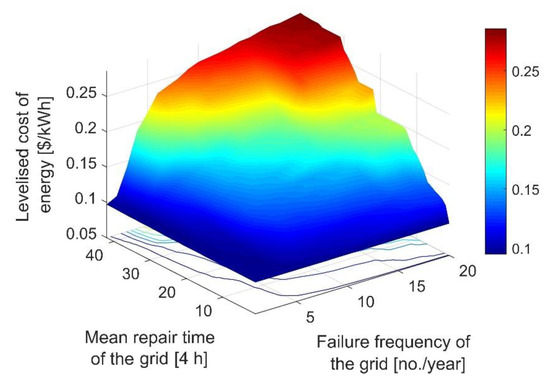
Figure 15.
Sensitivity of the MG’s LCOE to variations in grid reliability parameters. The numerical values belonging to this figure are listed in Table S6 in Supplementary Material.
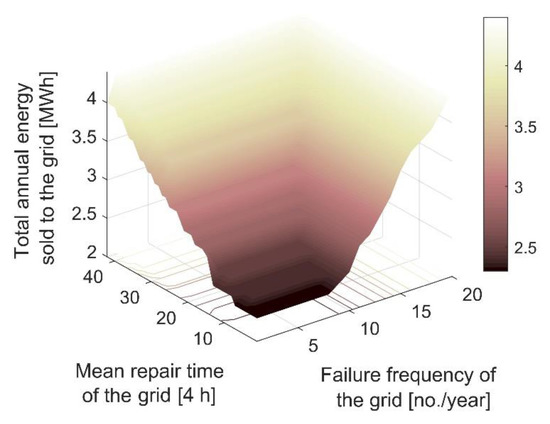
Figure 16.
Sensitivity of the total annual energy exports to variations in grid reliability parameters. The numerical values belonging to this figure are listed in Table S7 in Supplementary Material.
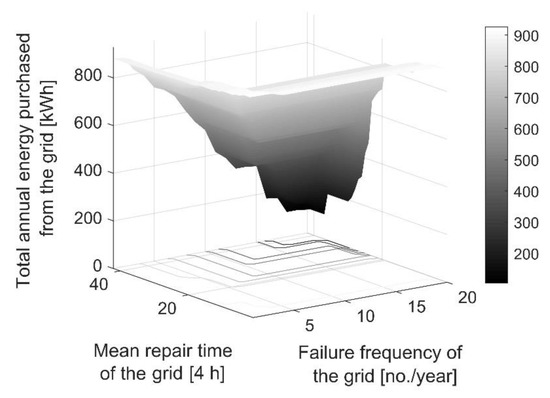
Figure 17.
Sensitivity of the total annual energy imports to variations in grid reliability parameters. The numerical values belonging to this figure are listed in Table S8 in Supplementary Material.
The two-way sensitivity analyses, shown in Figure 14, Figure 15, Figure 16 and Figure 17, are revealing in the following ways:
- The values of total annual energy imports and exports indicate that the MG’s net purchased electricity from the grid was approximately a monotonically decreasing function of the grid unreliability. That is, as the failure frequency of the grid and/or its mean repair time increased, the total power sold back to (purchased from) the grid increased (decreases) or remained constant. The underlying reason responsible for this model behaviour is the increase in the excess non-dispatchable power generation capacity of the MG during normal, grid-connected operations, as the grid reliability decreases. However, the increase in revenues generated from trading with the grid, as the MG’s resilience to grid outages improved, only partially offset the additional costs incurred. This emphasises the necessity to include a minimum acceptable limit for the target community’s energy resilience—to be derived from specifically-developed surveys to estimate the value of lost load—in the resilience-oriented MG capacity expansion planning processes to improve the accuracy of results.
- Non-surprisingly, increasing the unreliability level of the grid through dedicated parameters, increased the TNPC of the MG capacity expansion, which, in turn, increased the LCOE associated with the cost-minimal system.
- The failure frequency of the grid and its mean repair time show almost the same degree of negative effect on the system’s life-cycle cost when normalised to the same scale (e.g., in the range of (0 to 1)). Additionally, there seems to exist a front of solutions with respect to the grid reliability parameters, beyond which the whole-life cost of the system grows exponentially. For example, in the middle case scenario, where the grid’s mean repair time and failure frequency were respectively considered to be 84 h and 10 per year, the system’s TNPC was increased only by about 48%. However, a further 10% increase of either of the above two parameters raised the MG’s TNPC by a further 26%. This observation can be rationalised by the change in the MG architecture when the grid unreliability level reaches a critical point, which is discussed in the next sub-section.
4.2.1. Optimal MG System Type
Figure 18 provides the resulting optimal system architecture for different levels of the failure frequency of the grid and the associated mean repair time. As this figure shows, the MG design space is divided approximately equally across two grid-connected system structures, namely, (1) existing PV/added PV/added WT/added BESS, and (2) existing PV/added WT/added BESS. Notably, the figure indicates that it is cost-optimal to add new PV generation capacity for a system resilient to relatively low-frequency, long-duration outages, or high-frequency, short-duration outages, or any combination in between. However, for grid outage scenarios that lie inside the region enclosed by the upper pseudo-triangle shown in Figure 18, the optimally reinforced MG structure excludes additional PV panels. This can be explained by the increase in the probability of occurrence of sustained outages during the night-time hours, where solar panels produce no electricity. Thus, it is more economical to only add WT and BESS capacity, in view of the lower diurnal variations of wind speed and dispatchability of the BESS. It is also worth noting that while the considered bounds for the two-dimensional sensitivity analyses might far exceed the local utility grid’s reliability (especially the scenarios that lie in the region enclosed by the upper pseudo-trainable in Figure 18), the results of such sensitivity analyses are important in evaluating the robustness of the baseline system costs and architecture. Accordingly, Figure 18 demonstrates that the obtained grid-connected MG configuration of existing PV/added PV/added WT/added battery in the baseline scenario (100% reliable grid) is highly robust to variations in grid reliability.
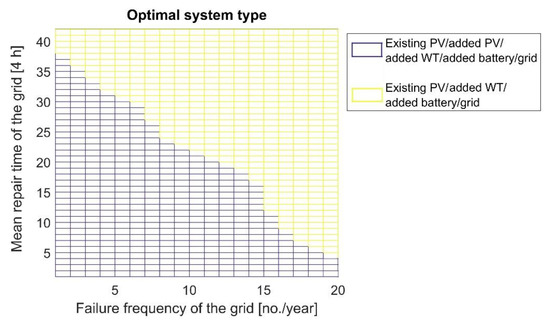
Figure 18.
Optimal MG configuration at different grid reliability levels. The numerical values belonging to this figure are listed in Table S9 in Supplementary Material.
4.2.2. Indicative Resilient System Optimisation Analysis
According to the results presented in Figure 14, addressing energy resilience is possible at comparably small total discounted cost increases of about 16% for a sufficiently resilient system (within a New Zealand context), tolerable of two sustained outages per year with each duration of the outage lasting up to four days (or, nearly equally, tolerable of four outages per year each with a maximum outage duration of up to two days), while optimally planning the capacity additions for the site under study. To indicate the effect of planning for energy resilience on the added MG equipment capacity, and in turn, the MG’s life-cycle cost, this sub-section details the results obtained for the MG system resilient to two extended outages per year each with a maximum outage duration of up to four days. Moreover, all the analyses presented hereafter are based on this scenario. Table 7 details the capacity expansion planning results obtained for the case considered in this paper under the grid unreliability scenario outlined above. The table demonstrates that the only change in the optimal capacity configuration of the MG with respect to the baseline case (refer to Table 6) is the addition of one more battery module to cater for the prolonged grid outages, which will need to be replaced in year 15 of the project.
Table 7.
Optimal capacity additions for the system resilient to 2 extended outages per year each with a maximum duration of up to 4 h.
4.3. Capital Budgeting Metrics
This section measures the profitability of the investigated MG capacity expansion project based on three key investment appraisal metrics, namely the return on investment (ROI), internal rate of return (IRR), and discounted payback period (DPP). HOMER calculates theses economic sustainability metrics with reference to a base case, which is normally the system with the lowest capital cost that can meet the load demand on the MG. Accordingly, given the presence of the utility grid at the considered site, the base case in this analysis is the existing PV/grid architecture, which incurs no capital costs in view of the presence of a 50 kVA transformer at the site.
4.3.1. Return on Investment
The ROI is defined as the yearly cost savings an investment project generates for the injection of the financial capital, which can be calculated from Equation (7) [71,72,73]:
where and represent the capital cost of the suggested system and the reference system, respectively; and denote the nominal cash flow for the proposed system and the reference system in year ; and represents the project lifetime.
4.3.2. Internal Rate of Return
Considering the base case defined above, the IRR is defined as the discount rate at which the net present value of all cash flows from the proposed investment equals to that of the base case. Accordingly, the IRR can be calculated as follows [71,72]:
where is the real discount rate, and the term ) indicates the present value of the difference of the two net cash inflow sequences (for the proposed project and the base case) during the period , while the net cash inflow represents the system’s income from selling electricity to the grid and assets’ salvage value minus the components’ capital, replacement, and O&M costs, and the costs associated with the purchase of electricity from the grid.
4.3.3. Discounted Payback Period
The DPP refers to the time required to recover the difference in the discounted cash flow difference between the proposed system and the base case system, which can be expressed mathematically as [71,72,74]
where represents the natural logarithm.
4.3.4. Resulting Cash Flow Metrics
Table 8 lists the obtained cash flow metrics for the proposed MG capacity expansion programme with reference to the case where any shortfalls in meeting the growing residential load power demand and EV charging loads—arising from the shortage in the existing PV generation capacity—is drawn from the utility grid.
Table 8.
Calculated capital budgeting metrics for the proposed resilience-oriented, community-scale renewable energy development project.
Table 8 demonstrates that the project yields relatively high ROI and IRR values through cost savings realised by building an at least 80% energy self-reliant community energy system, which is able to exploit the differences between the feed-in-tariff rate and wholesale power prices during off-peak periods of energy-use—by making effective use of a battery bank. The table also shows that the conceptualised resilient community MG for critical services would pay for itself in as little as 4.74 years, which provides further support for the financial sustainability of the proposed development plan. Finally, the results of this cost-benefit analysis collectively indicate that not only is the proposed capital project economically feasible without any subsidies delivered as tax incentives (e.g., renewable energy investment tax credits or production tax credits), but it also represents an attractive investment opportunity, which is capable of generating moderate to substantial savings in the community’s energy bills in the medium to long run.
5. Conclusions
Radial electricity distribution networks have historically been designed to reduce unplanned, equipment failure-induced outages. However, the combination of multi-day outages as a result of many of the recent extreme weather events, and the improved cost-efficiency of distributed energy resources—including renewable energy generation and storage technologies—have stimulated considerable interest in deploying community-led sustainable energy systems that are capable of meeting critical loads if the upstream network fails. This study developed the first grid-connected community MG equipment capacity expansion planning method that integrates energy resilience constraints without creating redundant capacity. The proposed method yields robust decision-making support by evaluating the trade-off between life-cycle costs and the resilience of energy supply. Specifically, to quantify the resilience of the proposed MG, a time-series of random outages throughout the year were generated for a range of outage frequencies of certain durations and incorporated into the HOMER Pro model.
The numerical simulation results obtained from the application of the model to the case example of Totarabank eco-village, New Zealand, have provided several novel insights:
- Over the 25-year project life-cycle (planning horizon), the optimally expanded MG system can gain resilience against two outages per year, each up to four days in length, at relatively small discounted cost increases of 16% (equating to NZ$5892). This lends support to the idea that at current costs of renewable energy technologies, it is financially feasible for a community-level site to achieve a sufficient degree of survivability against sustained grid outages.
- The optimal architecture (component type combination), namely grid-connected existing PV/added PV/added WT/added BESS MG system, determined for the case with a 100% reliable grid, seems to be highly robust against a wide range of grid unreliability values. Much of the reason for this lies in the fact that solar resource tends to complement wind resource at the site. However, the evidence from this study shows that in high wind, low solar regions it is not cost-optimal to add PV capacity when the degree of grid unreliability passes certain limits. This can mainly be attributed to the lower capacity factor of the PV plant.
- With an IRR of about 55%, the initial investment required for the capacity expansion of the site’s energy infrastructure to meet the projected energy consumption growth (driven primarily by the decarbonisation of the transport), can be recouped in less than five years, while additionally ensuring backup power supply to critical loads for two outages per year, each up to four days in length. This, together with the capital affordability of the project, suggests that it can be financed completely by the local community. Moreover, given the demonstrated evidence of the cost-efficiency of such programmes, it is expected to be attractive to many third-party investors.
Although this paper has focused particularly on the capacity expansion planning of grid-tied community MGs, the proposed framework of planning for resilience can be generalised to handle various types of sustainable energy systems of different scales. Moreover, the area of application of the proposed framework is not restricted to the expansion planning problems. It can be easily extended for application to the general renewable energy system capacity planning problem of greenfield sites having access to the national grid.
The study has a number of limitations, namely:
- All the estimates were based on defining energy resilience in terms of sustained grid outages. That is, the study has not accounted for the impact of extreme weather episodes on the operability of the considered site’s renewable energy generation assets.
- The proposed method does not account for the planned extended power outages related to grid capacity additions or equipment maintenance and repair.
- The study did not include any inputs from the site on the value the community places on the unserved energy during non-grid-connected operations. It is not implausible that the average annual loads that are deemed critical by end-consumers be different from the adjusted threshold criterion for load partitioning in this study.
- While the integration of unidirectional EV charging infrastructure is shown to be both technically feasible and economically viable, no attempt is made in this study to investigate the role that bidirectional charging (powered by V2G technology) can play in improving the profitability of the project.
Future Work
To address the limitations outlined above, future work needs to develop a more detailed resilient-oriented MG capacity expansion planning modelling framework that: (1) takes into account the local extreme weather impact on the MG’s own onsite renewable energy generation equipment and expands the proposed resilience quantification method to include the hours of the autonomy of the storage bank; (2) integrates scheduled outages into the resilience-oriented MG capacity planning processes by combining them with those of the random unplanned outages to generate an integrated outage time-series to be fed into the optimisation problem; (3) considers the true value of lost load perceived by end-consumers that can be derived from specifically-developed surveys, whilst additionally reflecting the seasonal differences in the elasticity of non-critical loads; and (4) harnesses the potential of EV batteries in facilitating the integration of renewable energy sources, which may provide the opportunity to reduce the total discounted system costs and improve the cost-efficiency of planning for resilience, security, and autonomy of community energy systems.
Supplementary Materials
The following are available online at https://www.mdpi.com/1996-1073/13/15/3970/s1, Table S1: numerical values underlying Figure 4; Table S2: numerical values underlying Figure 5; Table S3: numerical values underlying Figure 11; Table S4: numerical values underlying Figure 12; Table S5: numerical values underlying Figure 14; Table S6: numerical values underlying Figure 15; Table S7: numerical values underlying Figure 16; Table S8: numerical values underlying Figure 17; and Table S9: numerical values underlying Figure 18.
Author Contributions
Conceptualization, S.M.; methodology, S.M.; software, S.M.; validation, S.M., A.C.B., and D.B.; formal analysis, S.M., A.C.B., and D.B.; investigation, S.M.; resources, S.M., A.C.B., and D.B.; data curation, S.M.; writing—original draft preparation, S.M.; writing—review and editing, A.C.B. and D.B.; visualization, S.M.; supervision, A.C.B. and D.B.; and project administration, A.C.B. All authors have read and agreed to the published version of the manuscript.
Funding
This research received no external funding.
Acknowledgments
The authors would like to gratefully acknowledge suggestions and contextual input provided by the Totarabank Subdivision developer Andy Duncan.
Conflicts of Interest
The authors declare no conflict of interest.
Nomenclature
| Acronyms | |
| BESS | Battery energy storage system |
| DPP | Discounted payback period |
| EV | Electric vehicle |
| EVSE | Electric vehicle supply equipment |
| HOMER | Hybrid Optimization of Multiple Energy Resources |
| IRR | Internal rate of return |
| LCOE | Levelised cost of energy |
| MG | Micro-grid |
| O&M | Operation and maintenance |
| PV | Photovoltaic |
| ROI | Return on investment |
| TNPC | Total net present cost |
| V2G | Vehicle-to-grid |
| WT | Wind turbine |
| Indices | |
| Index of year | |
| Scalars | |
| Length of time-step in hours | |
| PV module’s efficiency | |
| Wind shear exponent | |
| Real discount rate | |
| Depth of discharge | |
| Minimum/maximum usable capacity of each battery module | |
| PV module’s derating factor | |
| Solar irradiance at standard test conditions | |
| Hub height of the wind turbine | |
| Reference height of wind speed records | |
| PV module’s temperature coefficient | |
| Nominal operating cell temperature | |
| PV module’s rated power | |
| Project lifetime | |
| Cell temperature at standard test conditions | |
| Parameters | |
| Total load power demand on the micro-grid in time | |
| Power output from the PV system in time | |
| Power output from the wind turbine system in time | |
| Wholesale electricity price in time | |
| Feed-in-tariff | |
| PV module’s temperature in time | |
| Global horizontal irradiance in time | |
| Ambient temperature in time | |
| Hub-height wind speed in time | |
| Variables | |
| Cost of power exchange with the main grid | |
| Capital cost of the suggested micro-grid/reference system in year | |
| Energy content of the battery bank in time | |
| Net cash inflow sequence of the proposed micro-grid/baseline case in year | |
| Charging/discharging power of the battery bank in time | |
| Imported/exported power from/to the national grid in time | |
| Functions | |
| Present value function | |
References
- Warneryd, M.; Håkansson, M.; Karltorp, K. Unpacking the complexity of community microgrids: A review of institutions’ roles for development of microgrids. Renew. Sustain. Energy Rev. 2020, 121, 109690. [Google Scholar] [CrossRef]
- Hirsch, A.; Parag, Y.; Guerrero, J. Microgrids: A review of technologies, key drivers, and outstanding issues. Renew. Sustain. Energy Rev. 2018, 90, 402–411. [Google Scholar] [CrossRef]
- Mohseni, S.; Brent, A.C. Smart Grid and Zero-Emissions Energy Systems: The Need for a Multi-Dimensional Investment Planning Perspective. IEEE Smart Grid eNewsl. 2018. Special Issue on the Paris Climate Agreement and the Role of the Smart Grid. [Google Scholar] [CrossRef]
- Achiluzzi, E.; Kobikrishna, K.; Sivabalan, A.; Sabillon, C.; Venkatesh, B. Optimal Asset Planning for Prosumers Considering Energy Storage and Photovoltaic (PV) Units: A Stochastic Approach. Energies 2020, 13, 1813. [Google Scholar] [CrossRef]
- Chen, T.; Alsafasfeh, Q.; Pourbabak, H.; Su, W. The next-generation US retail electricity market with customers and prosumers—A bibliographical survey. Energies 2018, 11, 8. [Google Scholar] [CrossRef]
- Mohseni, S.; Brent, A.C.; Burmester, D. The Role of Artificial Intelligence in the Transition from Conventional Power Systems to Modernized Smart Grids. IEEE Smart Grid eNewsl. 2019. Special Issue on Grid Modernization. [Google Scholar] [CrossRef]
- Anderson, K.H.; DiOrio, N.A.; Cutler, D.S.; Butt, R.S. Increasing resiliency through renewable energy microgrids. J. Energy Manag. 2017, 2, 2. [Google Scholar]
- Eskandarpour, R.; Lotfi, H.; Khodaei, A. Optimal microgrid placement for enhancing power system resilience in response to weather events. In Proceedings of the 2016 North American Power Symposium (NAPS), Denver, CO, USA, 18–20 September 2016; pp. 1–6. [Google Scholar]
- Barnes, A.; Nagarajan, H.; Yamangil, E.; Bent, R.; Backhaus, S. Tools for improving resilience of electric distribution systems with networked microgrids. arXiv 2017, arXiv:1705.08229. [Google Scholar]
- Hussain, A.; Bui, V.-H.; Kim, H.-M. Microgrids as a resilience resource and strategies used by microgrids for enhancing resilience. Appl. Energy 2019, 240, 56–72. [Google Scholar] [CrossRef]
- Boloukat, M.H.S.; Foroud, A.A. Stochastic-based resource expansion planning for a grid-connected microgrid using interval linear programming. Energy 2016, 113, 776–787. [Google Scholar] [CrossRef]
- Waqar, A.; Wang, S.; Dawoud, S.M.; Tao, T.; Wang, Y. Optimal capacity expansion-planning of distributed generation in microgrids considering uncertainties. In Proceedings of the 2015 5th International Conference on Electric Utility Deregulation and Restructuring and Power Technologies (DRPT), Changsha, China, 26–29 November 2015; pp. 437–442. [Google Scholar]
- Motie, S.; Keynia, F.; Ranjbar, M.R.; Maleki, A. Generation expansion planning by considering energy-efficiency programs in a competitive environment. Int. J. Electr. Power Energy Syst. 2016, 80, 109–118. [Google Scholar] [CrossRef]
- Hemmati, R.; Saboori, H.; Siano, P. Coordinated short-term scheduling and long-term expansion planning in microgrids incorporating renewable energy resources and energy storage systems. Energy 2017, 134, 699–708. [Google Scholar] [CrossRef]
- He, Y.; Sharma, R. Microgrid generation expansion planning using agent-based simulation. In Proceedings of the 2013 IEEE PES Innovative Smart Grid Technologies Conference (ISGT), Washington, DC, USA, 24–27 February 2013; pp. 1–6. [Google Scholar]
- Salimi, M.; Nasr, M.-A.; Hosseinian, S.H.; Gharehpetian, G.B.; Shahidehpour, M. Information Gap Decision Theory-Based Active Distribution System Planning for Resilience Enhancement. IEEE Trans. Smart Grid 2020, (accepted; in press). [Google Scholar] [CrossRef]
- Ibanez, E.; Lavrenz, S.; Gkritza, K.; Mejía, D.; Krishnan, V.; McCalley, J.; Somani, A.K. Resilience and robustness in long-term planning of the national energy and transportation system. Int. J. Crit. Infrastruct. 2016, 12, 82. [Google Scholar] [CrossRef]
- Shao, C.; Shahidehpour, M.; Wang, X.; Wang, X.; Wang, B. Integrated planning of electricity and natural gas transportation systems for enhancing the power grid resilience. IEEE Trans. Power Syst. 2017, 32, 4418–4429. [Google Scholar] [CrossRef]
- Celtic Energy. Resilient Microgrids for Rhode Island Critical Services; Celtic Energy: Caerphilly, UK, 2017. [Google Scholar]
- Yuan, W.; Wang, J.; Qiu, F.; Chen, C.; Kang, C.; Zeng, B. Robust optimization-based resilient distribution network planning against natural disasters. IEEE Trans. Smart Grid 2016, 7, 2817–2826. [Google Scholar] [CrossRef]
- Wu, X.; Wang, Z.; Ding, T.; Wang, X.; Li, Z.; Li, F. Microgrid planning considering the resilience against contingencies. IET Gener. Transm. Distrib. 2019, 13, 3534–3548. [Google Scholar] [CrossRef]
- Dong, J.; Zhu, L.; Su, Y.; Ma, Y.; Liu, Y.; Wang, F.; Tolbert, L.M.; Glass, J.; Bruce, L. Battery and backup generator sizing for a resilient microgrid under stochastic extreme events. IET Gener. Transm. Distrib. 2018, 12, 4443–4450. [Google Scholar] [CrossRef]
- Totarabank–Sustainable Rural Living. Available online: https://totarabank.weebly.com/ (accessed on 25 May 2020).
- Battery Systems. Available online: https://www.nexeon.co.uk/technology/ (accessed on 25 May 2020).
- Prasad, D.; Snow, M. Designing with Solar Power: A Source Book for Building Integrated Photovoltaics (BIPV); Routledge: Abingdon-on-Thames, UK, 2014; ISBN 1134032501. [Google Scholar]
- The X2000L Wind Turbine System. Available online: http://www.solazone.com.au/1kw-2kw-wind-turbines/ (accessed on 25 May 2020).
- Gipe, P. Wind power. Wind Eng. 2004, 28, 629–631. [Google Scholar] [CrossRef]
- Mohseni, S.; Brent, A.; Burmester, D.; Chatterjee, A. Optimal Sizing of an Islanded Micro-Grid Using Meta-Heuristic Optimization Algorithms Considering Demand-Side Management. In Proceedings of the 2018 Australasian Universities Power Engineering Conference (AUPEC), 2018, Auckland, New Zealand, 27–30 November 2018; pp. 1–6. [Google Scholar] [CrossRef]
- Moghaddas-Tafreshi, S.M.; Jafari, M.; Mohseni, S.; Kelly, S. Optimal operation of an energy hub considering the uncertainty associated with the power consumption of plug-in hybrid electric vehicles using information gap decision theory. Int. J. Electr. Power Energy Syst. 2019, 112, 92–108. [Google Scholar] [CrossRef]
- Moghaddas-Tafreshi, S.M.; Mohseni, S.; Karami, M.E.; Kelly, S. Optimal energy management of a grid-connected multiple energy carrier micro-grid. Appl. Therm. Eng. 2019, 152, 796–806. [Google Scholar] [CrossRef]
- Yilmaz, M.; Krein, P.T. Review of battery charger topologies, charging power levels, and infrastructure for plug-in electric and hybrid vehicles. IEEE Trans. Power Electron. 2012, 28, 2151–2169. [Google Scholar] [CrossRef]
- 2014 Nissan Leaf. Available online: https://www.thecarconnection.com/overview/nissan_leaf_2014/ (accessed on 25 May 2020).
- Ode to the Nissan Leaf. Available online: http://evtalk.co.nz/ode-to-the-nissan-leaf/ (accessed on 25 May 2020).
- 2014 Nissan Leaf review: Electric car landmark. Available online: https://uk.motor1.com/reviews/139275/2014-nissan-leaf/ (accessed on 25 May 2020).
- Mohseni, S.; Moghaddas-Tafreshi, S.M. A multi-agent system for optimal sizing of a cooperative self-sustainable multi-carrier microgrid. Sustain. Cities Soc. 2018, 38, 452–465. [Google Scholar] [CrossRef]
- Kempton, W.; Tomić, J. Vehicle-to-grid power fundamentals: Calculating capacity and net revenue. J. Power Sources 2005, 144, 268–279. [Google Scholar] [CrossRef]
- Trina Datasheet. Available online: https://static.trinasolar.com/sites/default/files/EN_TSM_PD05_datasheet_B_2017_web.pdf (accessed on 25 May 2020).
- Renew. Solar Panels. Available online: https://renew.org.au/wp-content/uploads/2019/12/150_solar_systems_guide_table.pdf (accessed on 25 May 2020).
- RESU: Residential Energy Storage Unit for Photovoltaic Systems. Available online: https://solarjuice.com.au/wp-content/uploads/2016/11/RESU-48V_installation_manual_R2_eng_2016-10-21-1.pdf (accessed on 25 May 2020).
- Change Your Energy Charge Your Life. Available online: https://solarjuice.com.au/wp-content/uploads/2016/10/160712_New-RESU-leaflet_Global-small.pdf (accessed on 25 May 2020).
- Battery Energy Storage Systems. Prices for the LG Chem RESU 3.3 kWh. Available online: http://www.batteryenergystoragesystems.com.au/ (accessed on 25 May 2020).
- SP PRO AU Series –Selectronic. Available online: http://www.selectronic.com.au/brochure/BR0007_09%20SP%20PRO%20Series%20II%20Data%20Sheet%20Web.pdf (accessed on 25 May 2020).
- Marshall Solar & Energy. Available online: https://marshallsolarandenergy.com.au/product/selectronic-sp-pro-inverter-charger-3-0-kw-24v-spmc240-au/ (accessed on 25 May 2020).
- Mohseni, S.; Brent, A.C.; Burmester, D. A demand response-centred approach to the long-term equipment capacity planning of grid-independent micro-grids optimized by the moth-flame optimization algorithm. Energy Convers. Manag. 2019, 200, 112105. [Google Scholar] [CrossRef]
- Mohseni, S.; Brent, A.C.; Burmester, D. A comparison of metaheuristics for the optimal capacity planning of an isolated, battery-less, hydrogen-based micro-grid. Appl. Energy 2020, 259, 114224. [Google Scholar] [CrossRef]
- Mohseni, S.; Brent, A.C. Economic viability assessment of sustainable hydrogen production, storage, and utilisation technologies integrated into on-and off-grid micro-grids: A performance comparison of different meta-heuristics. Int. J. Hydrogen Energy 2019, (accepted; in press). [Google Scholar] [CrossRef]
- Nikolaus, R.; Paul, T.J. Feasibility Study of Small and Micro Wind Turbines for Residential Use in New Zealand: An Analysis of Technical Implementation, Spatial Planning Processes and of Economic Viability of Small and Micro Scale Wind Energy Generation Systems for Residential Use in New Zealand. Available online: https://researcharchive.lincoln.ac.nz/handle/10182/4141 (accessed on 25 May 2020).
- Mohseni, S.; Brent, A.C.; Burmester, D. A Sustainable Energy Investment Planning Model Based on the Micro-Grid Concept Using Recent Metaheuristic Optimization Algorithms. In Proceedings of the 2019 IEEE Congress on Evolutionary Computation (CEC), Wellington, New Zealand, 10–13 June 2019; pp. 219–226. [Google Scholar] [CrossRef]
- Chargers Direct. Delta Mini AC Electric Vehicle Charge Point-Networked 3G. Available online: https://www.chargersdirect.com.au/product/delta-ac-mini-plus/ (accessed on 25 May 2020).
- Delta AC Mini Plus EV Charger. Available online: https://yhipower.co.nz/catalog/ac-mini-plus-104892.htmx (accessed on 25 May 2020).
- Elkadeem, M.R.; Wang, S.; Azmy, A.M.; Atiya, E.G.; Ullah, Z.; Sharshir, S.W. A systematic decision-making approach for planning and assessment of hybrid renewable energy-based microgrid with techno-economic optimization: A case study on an urban community in Egypt. Sustain. Cities Soc. 2020, 54, 102013. [Google Scholar] [CrossRef]
- NASA Surface Meteorology and Solar Energy database. Available online: https://eosweb.larc.nasa.gov/ (accessed on 25 May 2020).
- Solar Power Buy-Back Rates. Available online: https://www.mysolarquotes.co.nz/about-solar-power/residential/solar-power-buy-back-rates-nz/ (accessed on 25 May 2020).
- Bücher, K. Site dependence of the energy collection of PV modules. Sol. Energy Mater. Sol. Cells 1997, 47, 85–94. [Google Scholar] [CrossRef]
- Mohseni, S.; Brent, A.C.; Burmester, D.; Chatterjee, A. Stochastic Optimal Sizing of Micro-Grids Using the Moth-Flame Optimization Algorithm. In Proceedings of the 2019 IEEE Power & Energy Society General Meeting (PESGM), Atlanta, GA, USA, 4–8 August 2019; pp. 1–5. [Google Scholar] [CrossRef]
- Wind Shear. Available online: https://www.engineeringtoolbox.com/wind-shear-d_1215.html/ (accessed on 25 May 2020).
- The Electricity Market Information: The New Zealand Electricity Authority’s Wholesale Database. Available online: https://www.emi.ea.govt.nz/Wholesale/Reports/ (accessed on 25 May 2020).
- Anderson, B.; Eyers, D.; Ford, R.; Ocampo, D.G.; Peniamina, R.; Stephenson, J.; Suomalainen, K.; Wilcocks, L.; Jack, M. New Zealand GREEN Grid Household Electricity Demand Study 2014–2018; UK Data Service: Colchester, UK, 2018. [Google Scholar] [CrossRef]
- Anderson, B. NZ GREEN Grid Household Electricity Demand Data: EECA Data Analysis (Part. C) Upscaling Advice Report v1.0; University of Otago: Dunedin, New Zealand, 2019. [Google Scholar]
- Twidell, J.; Weir, T. Renewable Energy Resources; Routledge: Abingdon-on-Thames, UK, 2015; ISBN 1317660374. [Google Scholar]
- HOMER Pro; HOMER Energy LLC: Boulder, CO, USA, 2020.
- Ueckerdt, F.; Kempener, R. From Baseload to Peak: Renewables Provide a Reliable Solution; International Renewable Energy Agency (IRENA): Abu Dhabi, UAE, 2015. [Google Scholar]
- Discount Rates and CPI Assumptions for Accounting Valuation Purposes. Available online: https://treasury.govt.nz/information-and-services/state-sector-leadership/guidance/financial-reporting-policies-and-guidance/discount-rates/discount-rates-and-cpi-assumptions-accounting-valuation-purposes/ (accessed on 25 May 2020).
- New Zealand Inflation Rate. Available online: https://tradingeconomics.com/new-zealand/inflation-cpi/ (accessed on 25 May 2020).
- New Zealand’s Energy Outlook: Electricity Insight. Available online: https://www.mbie.govt.nz/building-and-energy/energy-and-natural-resources/energy-statistics-and-modelling/energy-modelling/new-zealands-energy-outlook/new-zealands-energy-outlook-electricity-insight/ (accessed on 25 May 2020).
- Wanitschke, A.; Pieniak, N.; Schaller, F. Economic and environmental cost of self-sufficiency-analysis of an urban micro grid. Energy Procedia 2017, 135, 445–451. [Google Scholar] [CrossRef]
- Mohseni, S.; Brent, A.C.; Burmester, D. A Reliability-Oriented Cost Optimisation Method for Capacity Planning of a Multi-Carrier Micro-Grid: A Case Study of Stewart Island, New Zealand. arXiv 2019, arXiv:1906.09544. [Google Scholar]
- Mohseni, S.; Moghaddas-Tafreshi, S.M. Development of a multi-agent system for optimal sizing of a commercial complex microgrid. arXiv 2018, arXiv:1811.12553. [Google Scholar]
- Mohseni, S.; Moghaddas-Tafreshi, S.M. A multi-agent approach to optimal sizing of a combined heating and power microgrid. arXiv 2018, arXiv:1812.11076. [Google Scholar]
- Electricity Cost and Price Monitoring. Available online: https://www.mbie.govt.nz/building-and-energy/energy-and-natural-resources/energy-statistics-and-modelling/energy-statistics/energy-prices/electricity-cost-and-price-monitoring/ (accessed on 25 May 2020).
- Seitz, N.; Ellison, M. Capital Budgeting and Long-Term Financing Decisions; Harcourt Brace College Publishers: New York, NY, USA, 1995; ISBN 0030754771. [Google Scholar]
- Compare Economics—HOMER Energy. Available online: https://www.homerenergy.com/products/pro/docs/latest/compare_economics.html/ (accessed on 25 May 2020).
- Return on Investment—HOMER Energy. Available online: https://www.homerenergy.com/products/pro/docs/latest/return_on_investment.html/ (accessed on 25 May 2020).
- Fisher, I. The theory of Interest, as Determined by Impatience to Spend Income and Opportunity to Invest It; Macmillan: New York, NY, USA, 1930. [Google Scholar]


© 2020 by the authors. Licensee MDPI, Basel, Switzerland. This article is an open access article distributed under the terms and conditions of the Creative Commons Attribution (CC BY) license (http://creativecommons.org/licenses/by/4.0/).