1. Introduction
At present, we are seeing increasing pressure from society on the ecology and economy. A heat pump is a means of enabling the economically and environmentally justified use of a dissipated part of thermal energy for a usable purpose of heating/preparation of hot water and the like [
1]. On the other hand, PCM/ice storage [
2] allows the use of the potential of latent heat to store thermal energy, thanks to the combination of both principles, respectively, equipment [
3]. The ice storage system is the way to store and use thermal energy [
4].
The ice storage system uses water/ice in a tank solar absorber or PV panels, and heat pump. As the heat exchanger is used, the air/water type is antifreeze [
5]. This technology can be used for new or existing buildings [
6]. In general, it allows using the low-potential heat [
7] from sources such as earth, water, air. PCM storage (ice tank) is the main part of this system [
8].
The big advantage is that in addition to the classic solar thermal circuit (heat from the air and solar radiation), this system also has another circuit with the ice tank. Thanks to this, it is possible to store part of the thermal energy from renewable sources [
9,
10] in the ice tank for future usage. Using renewable energy sources potential is another good reason why to choose this kind of ice storage heating system [
11]. The system, therefore, appears to be a potential [
12,
13] with low running costs, high efficiency, without adverse environmental impacts [
14,
15,
16].
Water has many advantages as large heat capacity, low cost, and very common applications in the engineering field, especially in the field of heating systems, water is very beneficial. The tank is usually filled with service water, which is easy and cheap [
17]. Moreover, the water behaves like PCM in the temperatures applicable in the winter and heating season [
18]. PCM can gain and store thermal energy under certain circumstances. Thermal energy can be stored in three main forms, the sensible heat, latent heat, and thermo-chemical energy. The PCM offers a space how to use latent and sensible heat [
19,
20,
21]. The latent heat is especially one of the most useable energy forms in the field of this type system.
Thanks to the specific heat capacity of water, it is possible to store part of the thermal energy from the sun into the tank (the ice storage) [
22]. The phase change from liquid water to solid ice at 0 °C releases as much latent heat as is necessary to heat the same amount of water from 0 to 80 °C. This represents a huge amount of energy [
23]. Phase transformations and the ability to extend as much as possible the time when storage behaves like PCM are a very important part of the system [
24]. The specific enthalpy [
25] of the phase transformation is thus relatively high compared to the specific heat capacity. For water, the fusion enthalpy is 334 kJ/kg and the specific heat capacity is 4.19 kJ/kg [
26]. The result is that the energy density is considerably higher compared to hot water tanks. If one liter of water is cooled by 1 K, the 1.163 kW of energy is released [
27]. While the temperature remains constant at 0 °C during icing, the additional crystallization energy (93 Wh/kg) is released, which can be used by the heat pump [
28]. It follows that storing the ice into a tank has enormous energy importance. Phase conversion makes this system more efficient [
29]. Energy can be extracted from the ice. As the storage volume increases, so does the stored energy capacity and the PCM phase time [
30]. The results showed that the thermal storage system [
31] is a highly effective system that increases the coefficient of performance (COP) heating factor [
32,
33].
Heat pumps efficiency is expressed in a dimensionless number as the coefficient of performance (COP). The COP is the current efficiency of the work and it could be influenced by temperature conditions during the heat pumps working cycle. The seasonal performance factor SCOP is a more valuable coefficient especially for the customer’s point of view. The SCOP is evaluated at the end of the heating season and counts the amount of received and transferred energy. In general, is the SCOP lower than the COP, therefore, it is more important to pay attention to the SCOP.
The study of the solar-air source heat pump heating system in China in this work [
34] showed the average COP of 1.95. Another simulated performance of a borehole-coupled heat pump seasonal solar thermal storage system for space heating in cold climate [
35] showed the highest COP of 5.8.
These results show that the real efficiency and coefficient of performance depends on various factors, such as the locality, temperatures, conditions, working time of heat pump, and so on.
In Slovak conditions, the ice storage system has probably not yet been installed before. This is the first well-known research that deals with the real installation and analysis of the ice storage heating system with a special solar absorber, well known as the header pipes (HDP), in the east of Slovakia. Moreover, the system was installed in an older house. Identifying specificities and thorough mapping is a prerequisite where it will be possible to efficiently adapt technical solutions based on conventional systems and optimize them for the new desired function. This undoubtedly lies in the importance of this work for the further development of science and practice.
Heating Systems Comparison
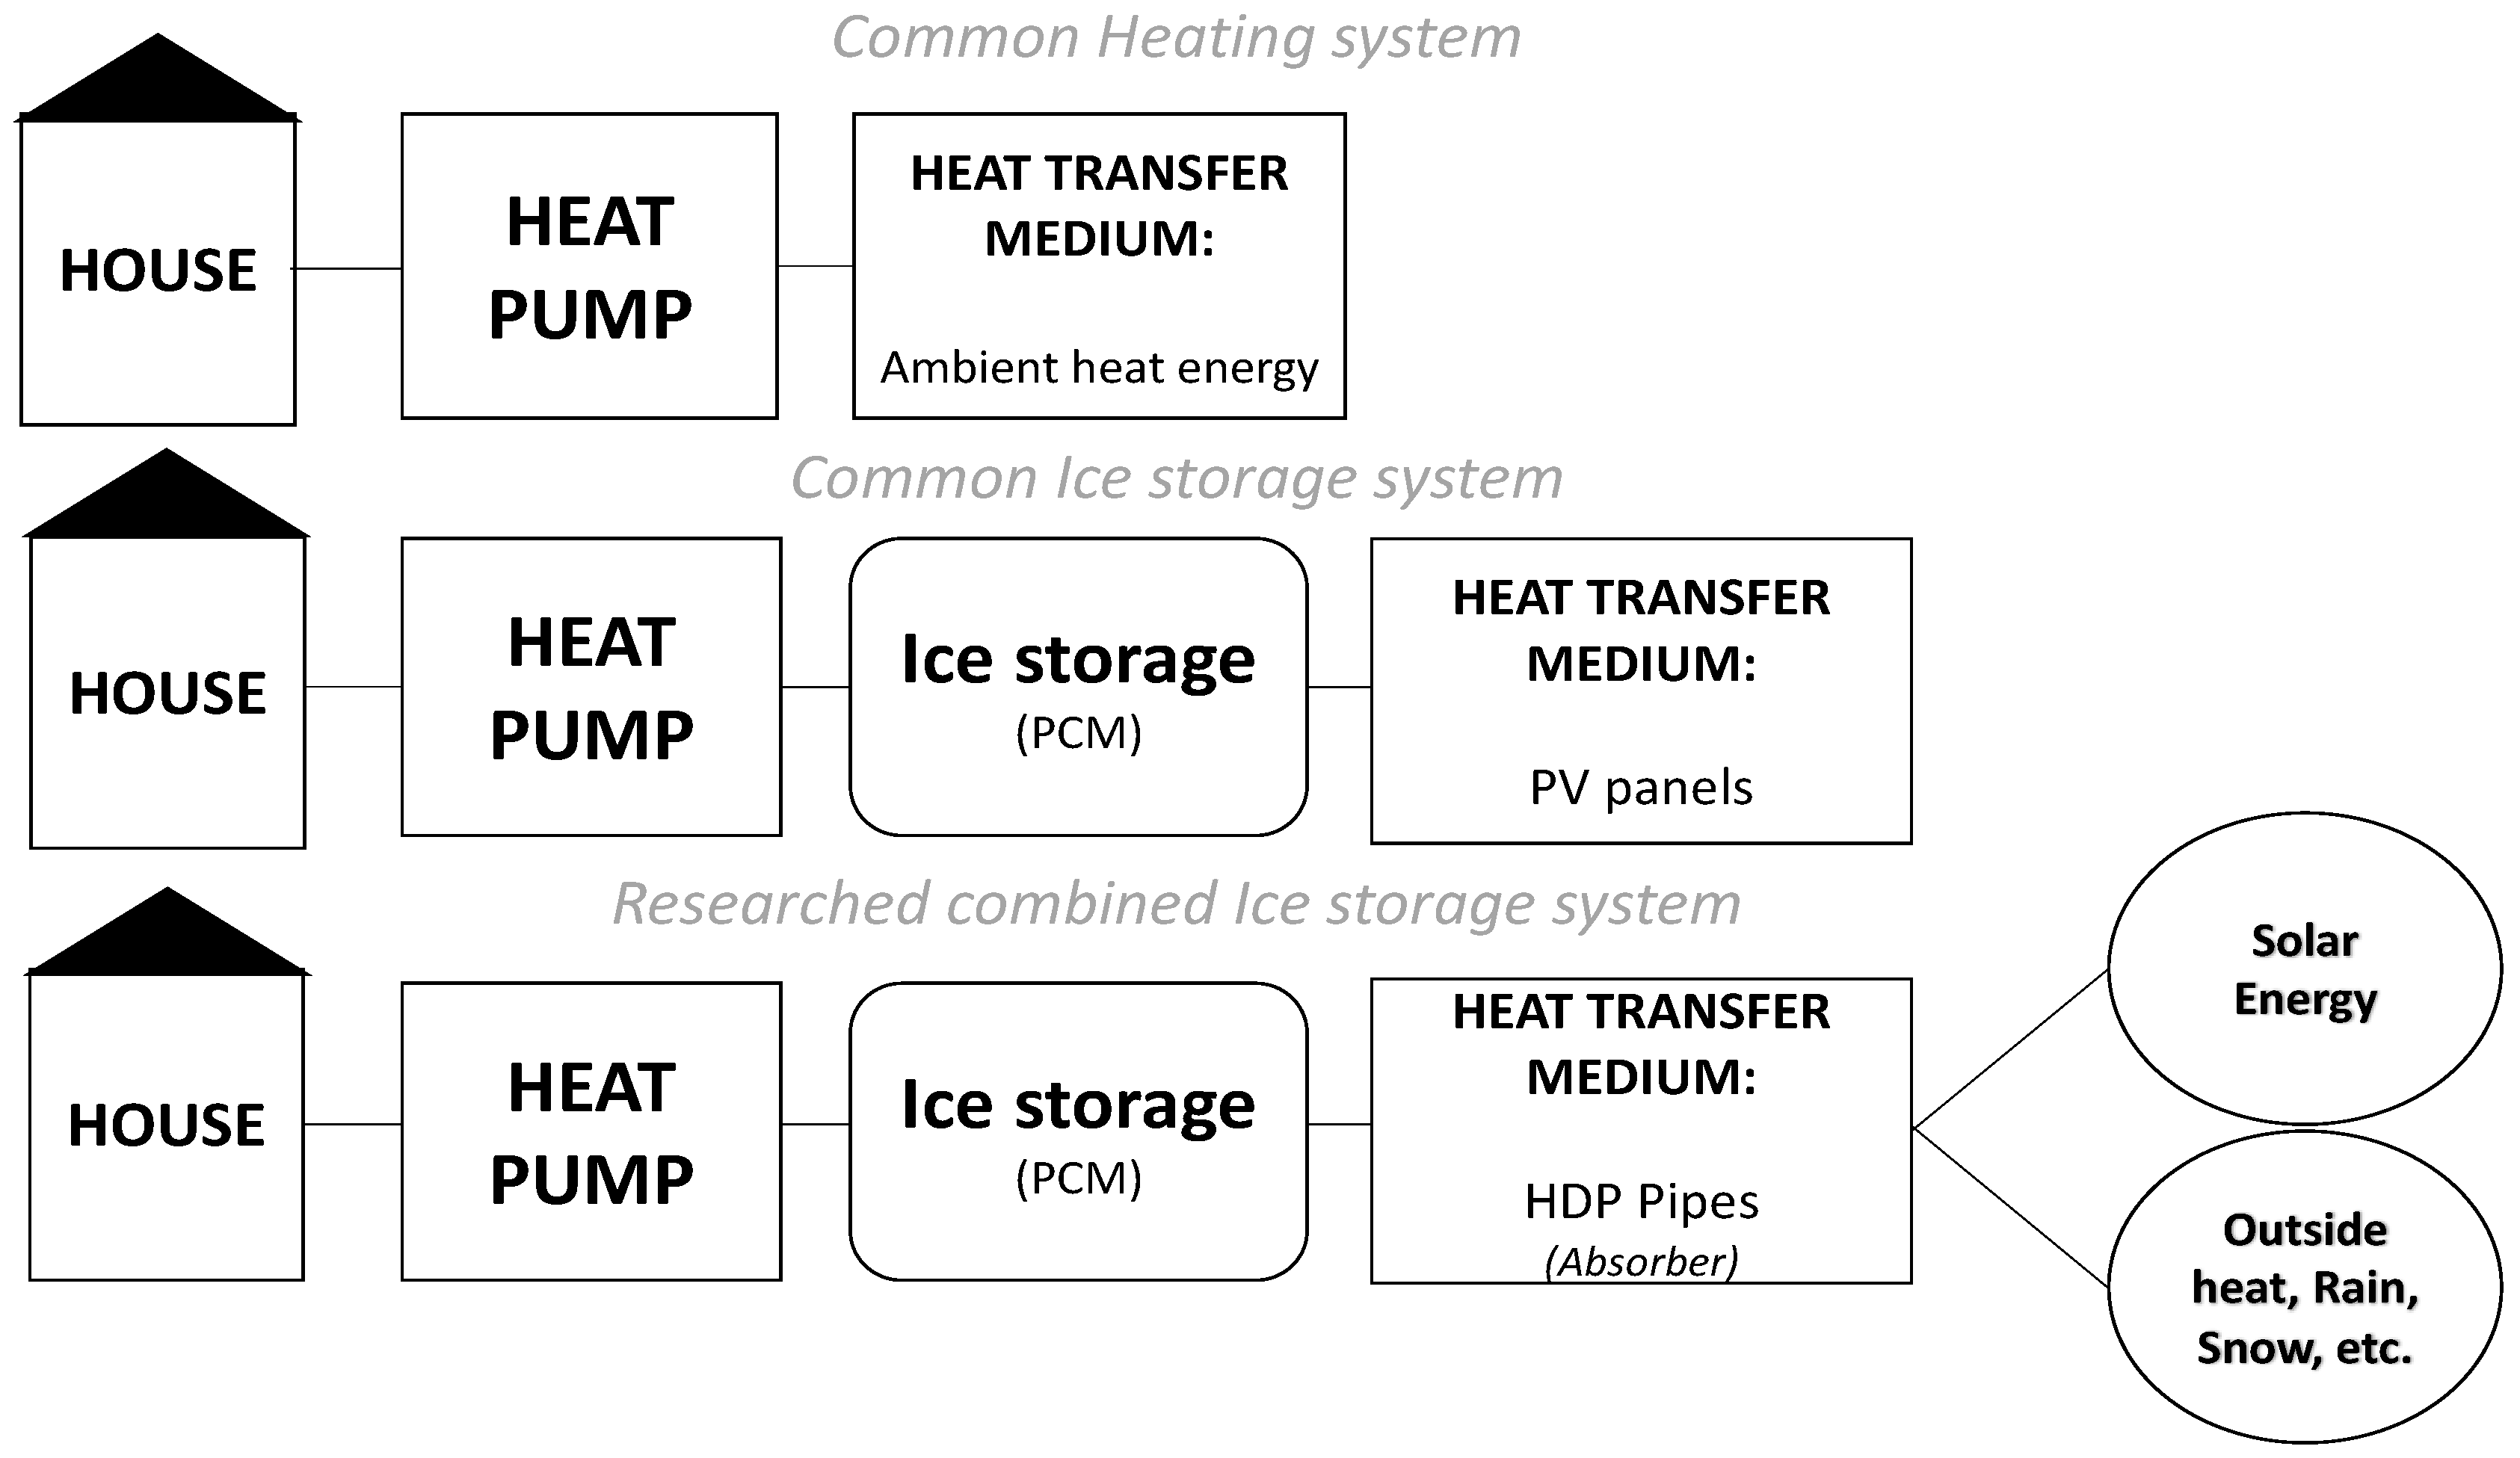
In
Figure 1, common heating systems are compared, including the ice storage system. A common heat pump uses only ambient thermal energy. The common ice storage system uses also ambient thermal energy through the PV panels or solar absorber as the heat transfer medium. The ice storage tank (PCM) serves as a type of additional energy source in which part of the thermal energy obtained by the sun can be stored for future usage. In this case, it is possible to transfer part of the thermal energy to the water/ice.
The combined ice storage system in this work also uses the ice storage tank (PCM) and HDP pipes as the heat transfer medium. This kind of absorber is very specific and can absorb the thermal energy not only from the sun like the PV panels/solar absorber but also from outside—by one technical device. The main difference is that HDP pipes, unlike the PV panels and solar absorber, have no thermal insulation. The rain or snow conditions also influence the thermal energy transfer.
2. Materials and Methods
The analysis of the researched combined ice storage system is based on data from real operations. The recording of data starts from 30th September 2018 at 0:00, till 5th October 2018 where data 1 data per minute were obtained. From 5th October 2018 until the end of the analysis 9th April 2019 18:00, 1 data per 3 min were obtained. The data were obtained thanks to the sensors located in the individual system components, especially the ice storage tank, HDP absorber, and environment temperature conditions. Each sensor was connected to a network for receiving and sending the data in real time. Amit Automation ViewDet (Version: 1.3.0.3, AMiT, spol. s r. o., Prague, Czech Republic). was used to capture data. The temperature conditions and the operating states of the heat pump were especially analyzed. Together, we captured 1,163,244 data of which 775,496 data were analyzed. Data were averaged. One hour was average by 60 data till 5th October 2018 and from 5th October 2018 by 20 data. One day then represented 24 values, each for 1 h on a specific day. The data obtained from 1 h working cycle had a small deviation. The total analyzed time was 192 days.
Together, we investigated a total of 5 temperatures from sensors and 3 types of heat pump operating modes represent only by value 1—turn on, and 0—turn off. The data were recorded in graphical and numerical outputs. The freezing, melting processes, and various anomalies related to the water properties were observed in Viewdet and demonstrated through graphical progress.
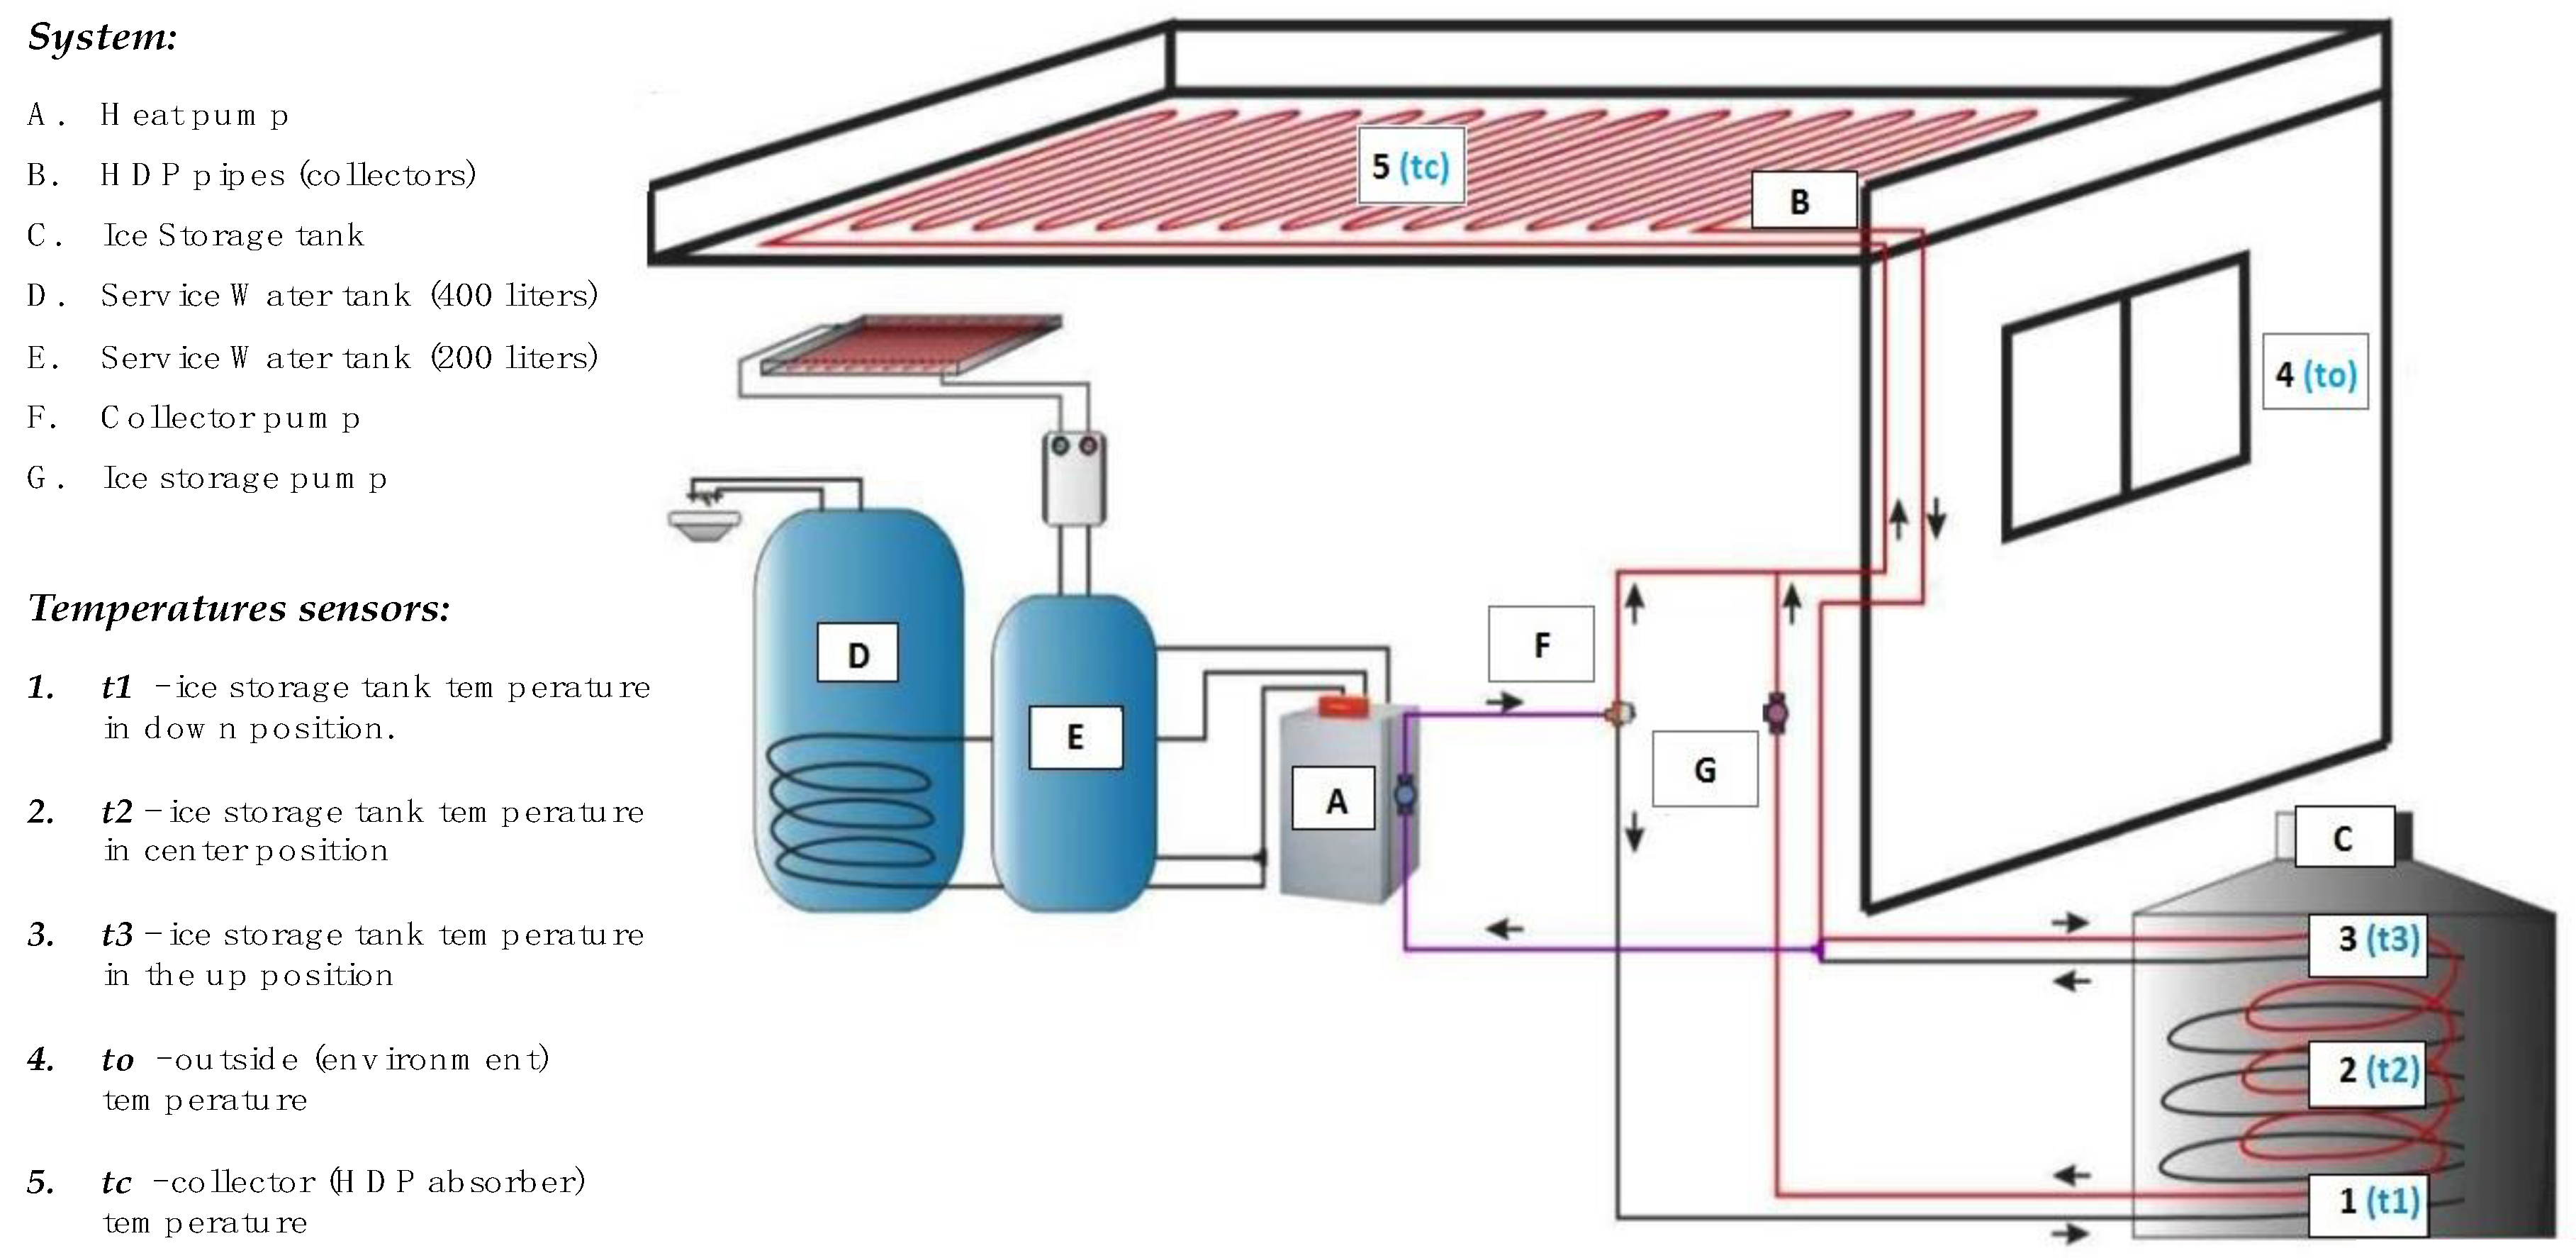
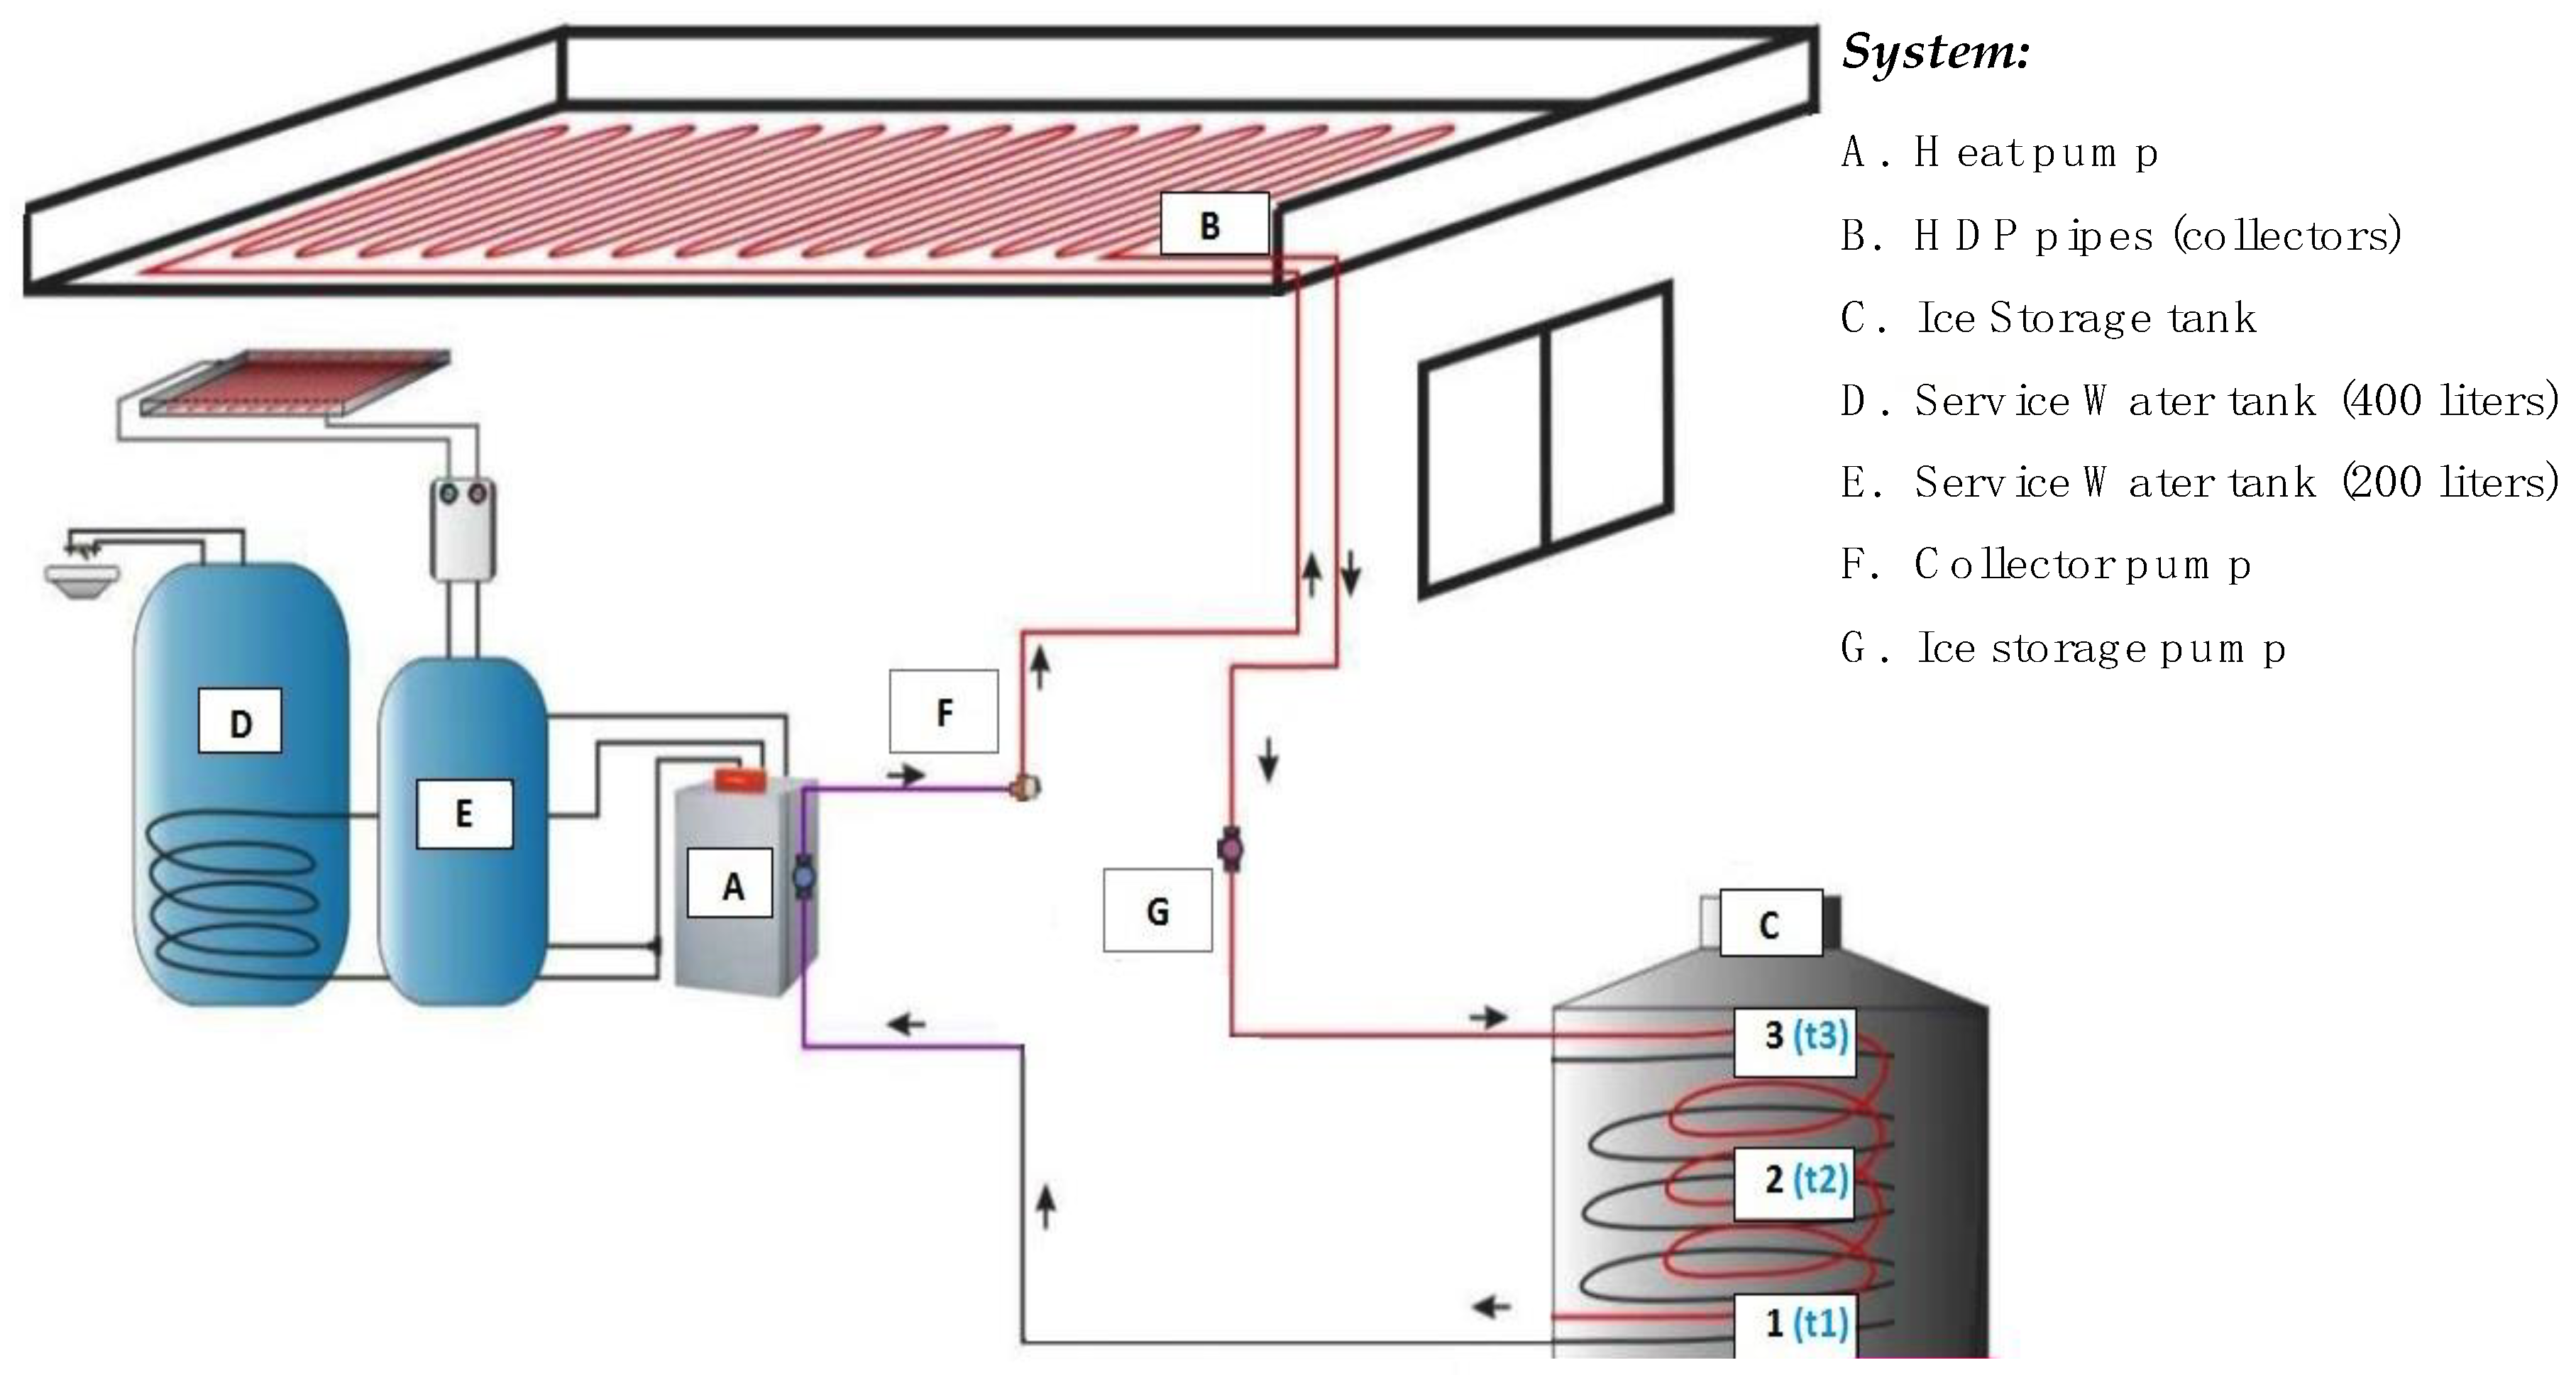
The main parts of this system are heat pump, solar absorber, and the ice storage tank. The entire installed heating system scheme of data capturing in Viewdet including the ice storage illustration is illustrated in
Figure 2.
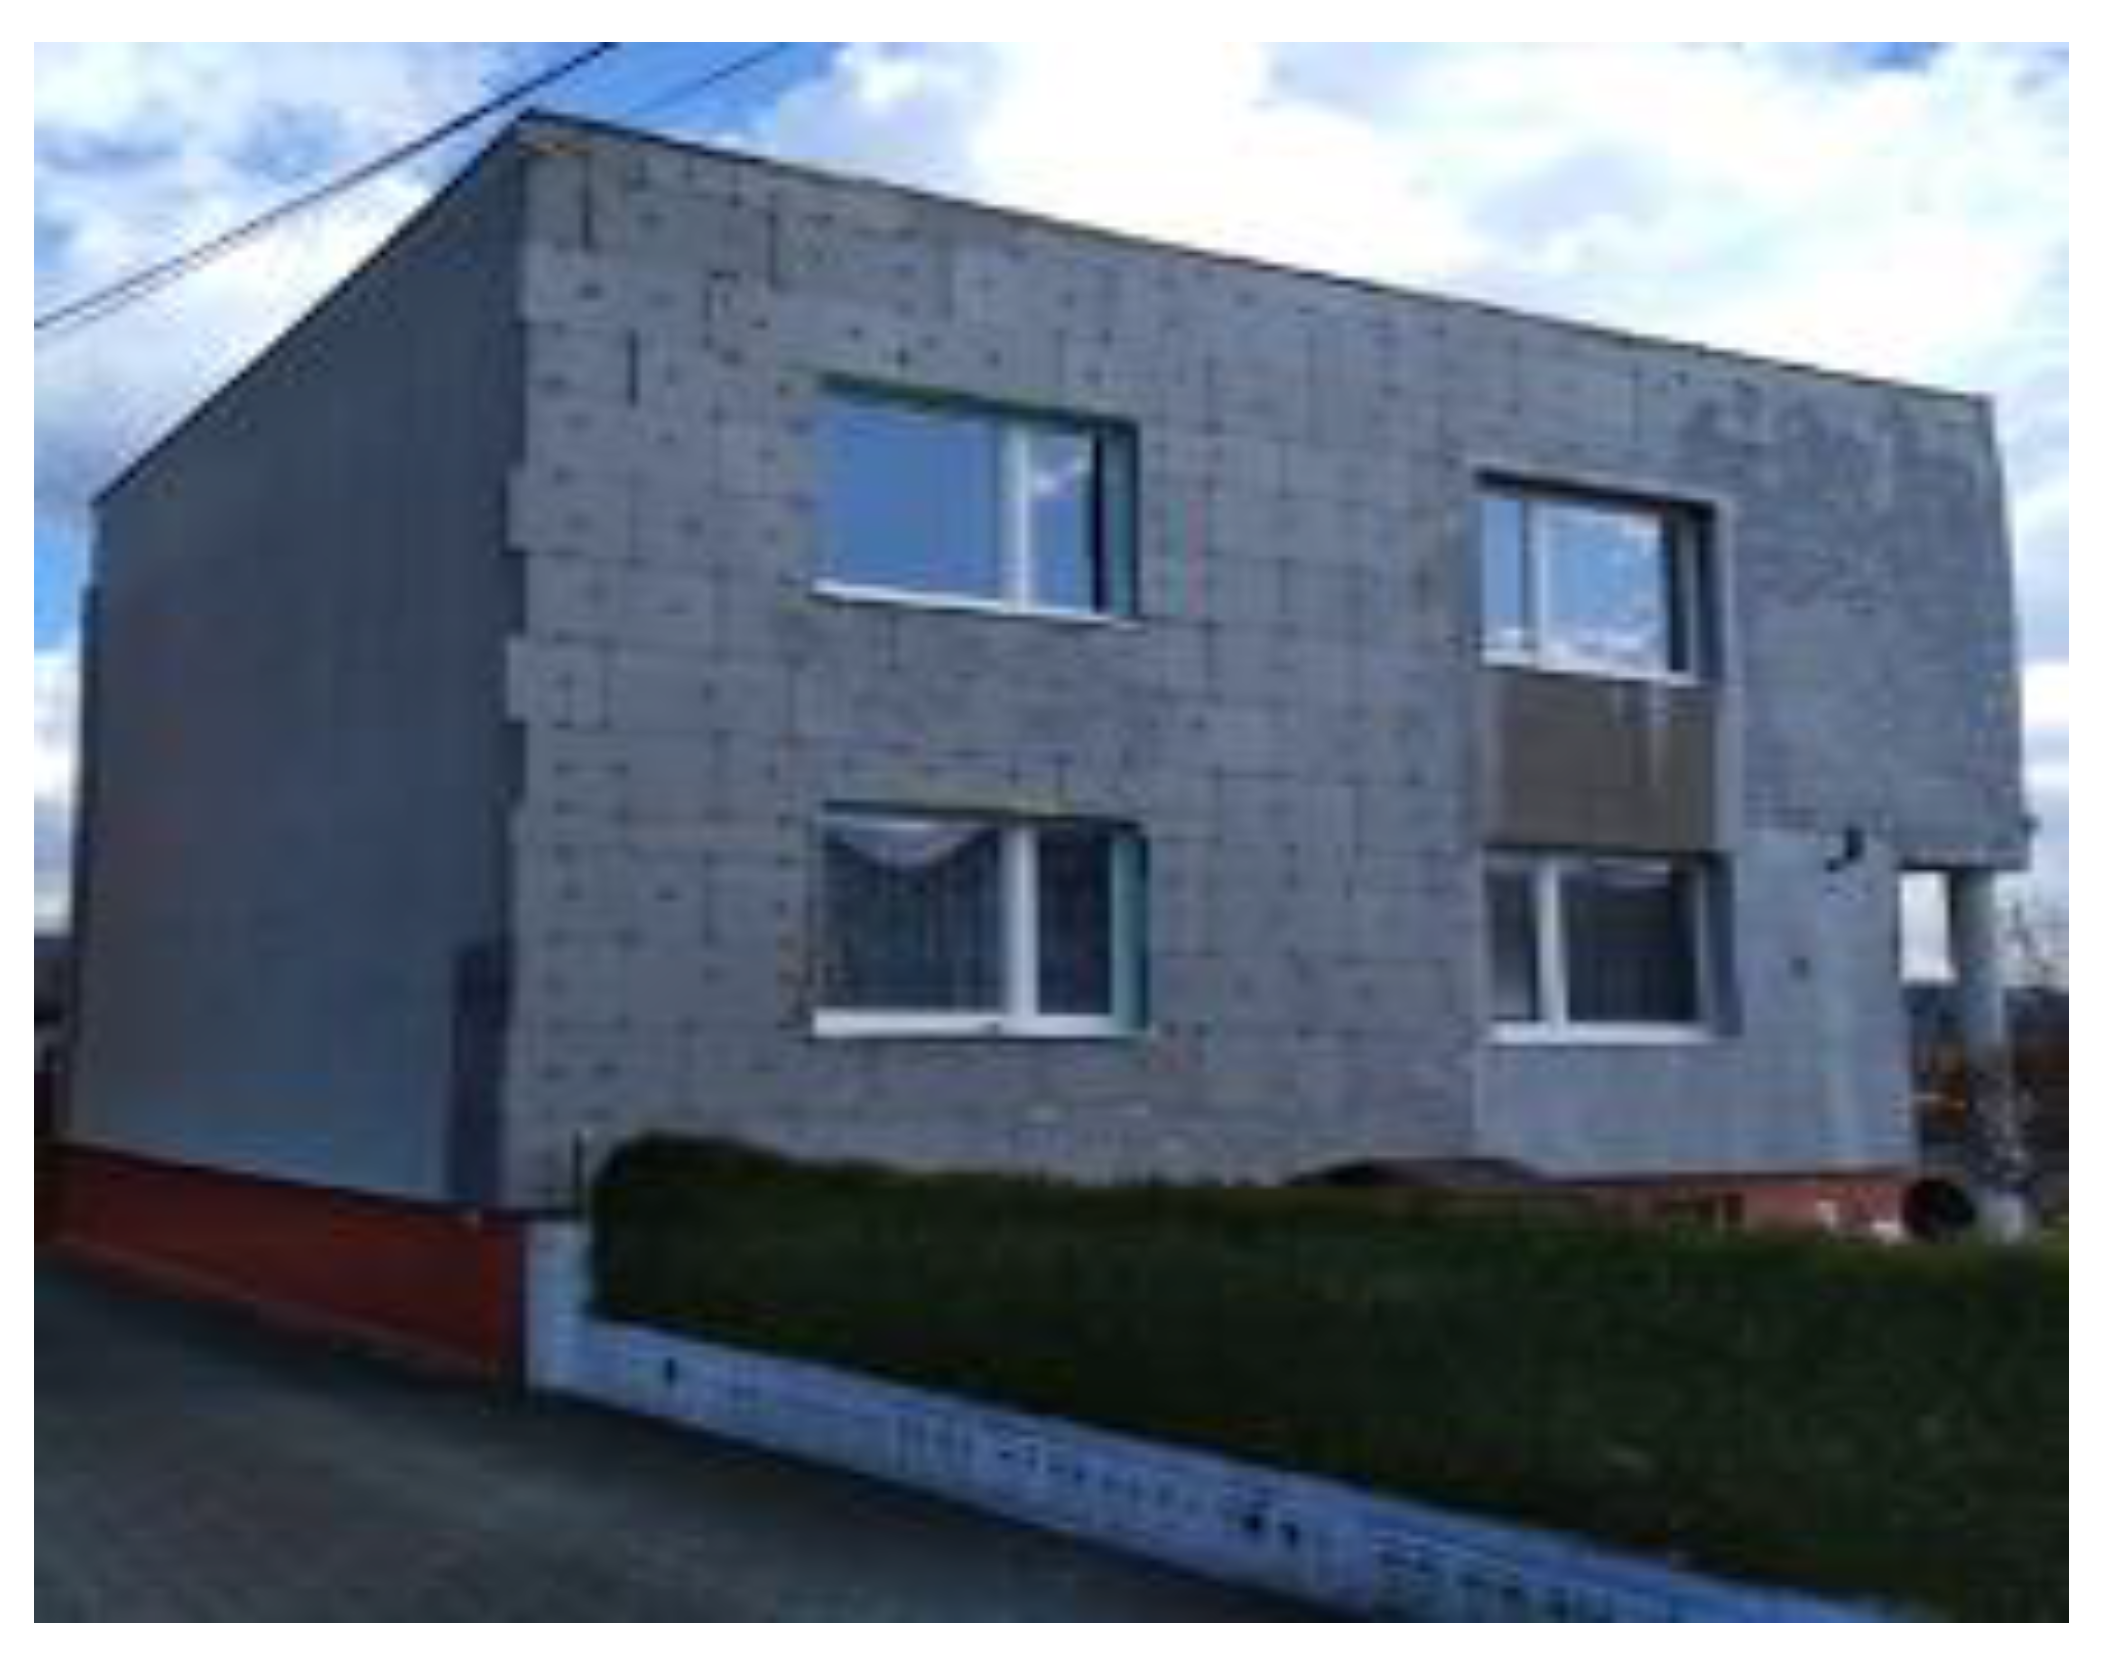
The house with the ice storage system installation has approximately 40 years and is shown in
Appendix A. The installation of this system was provided by one Slovak company and it was the first installation. The reason why this system was installed in an older house was to ensure and demonstrate the usability of the ice storage system. The reason was also the possible reduction of fees with new technology for homeowners.
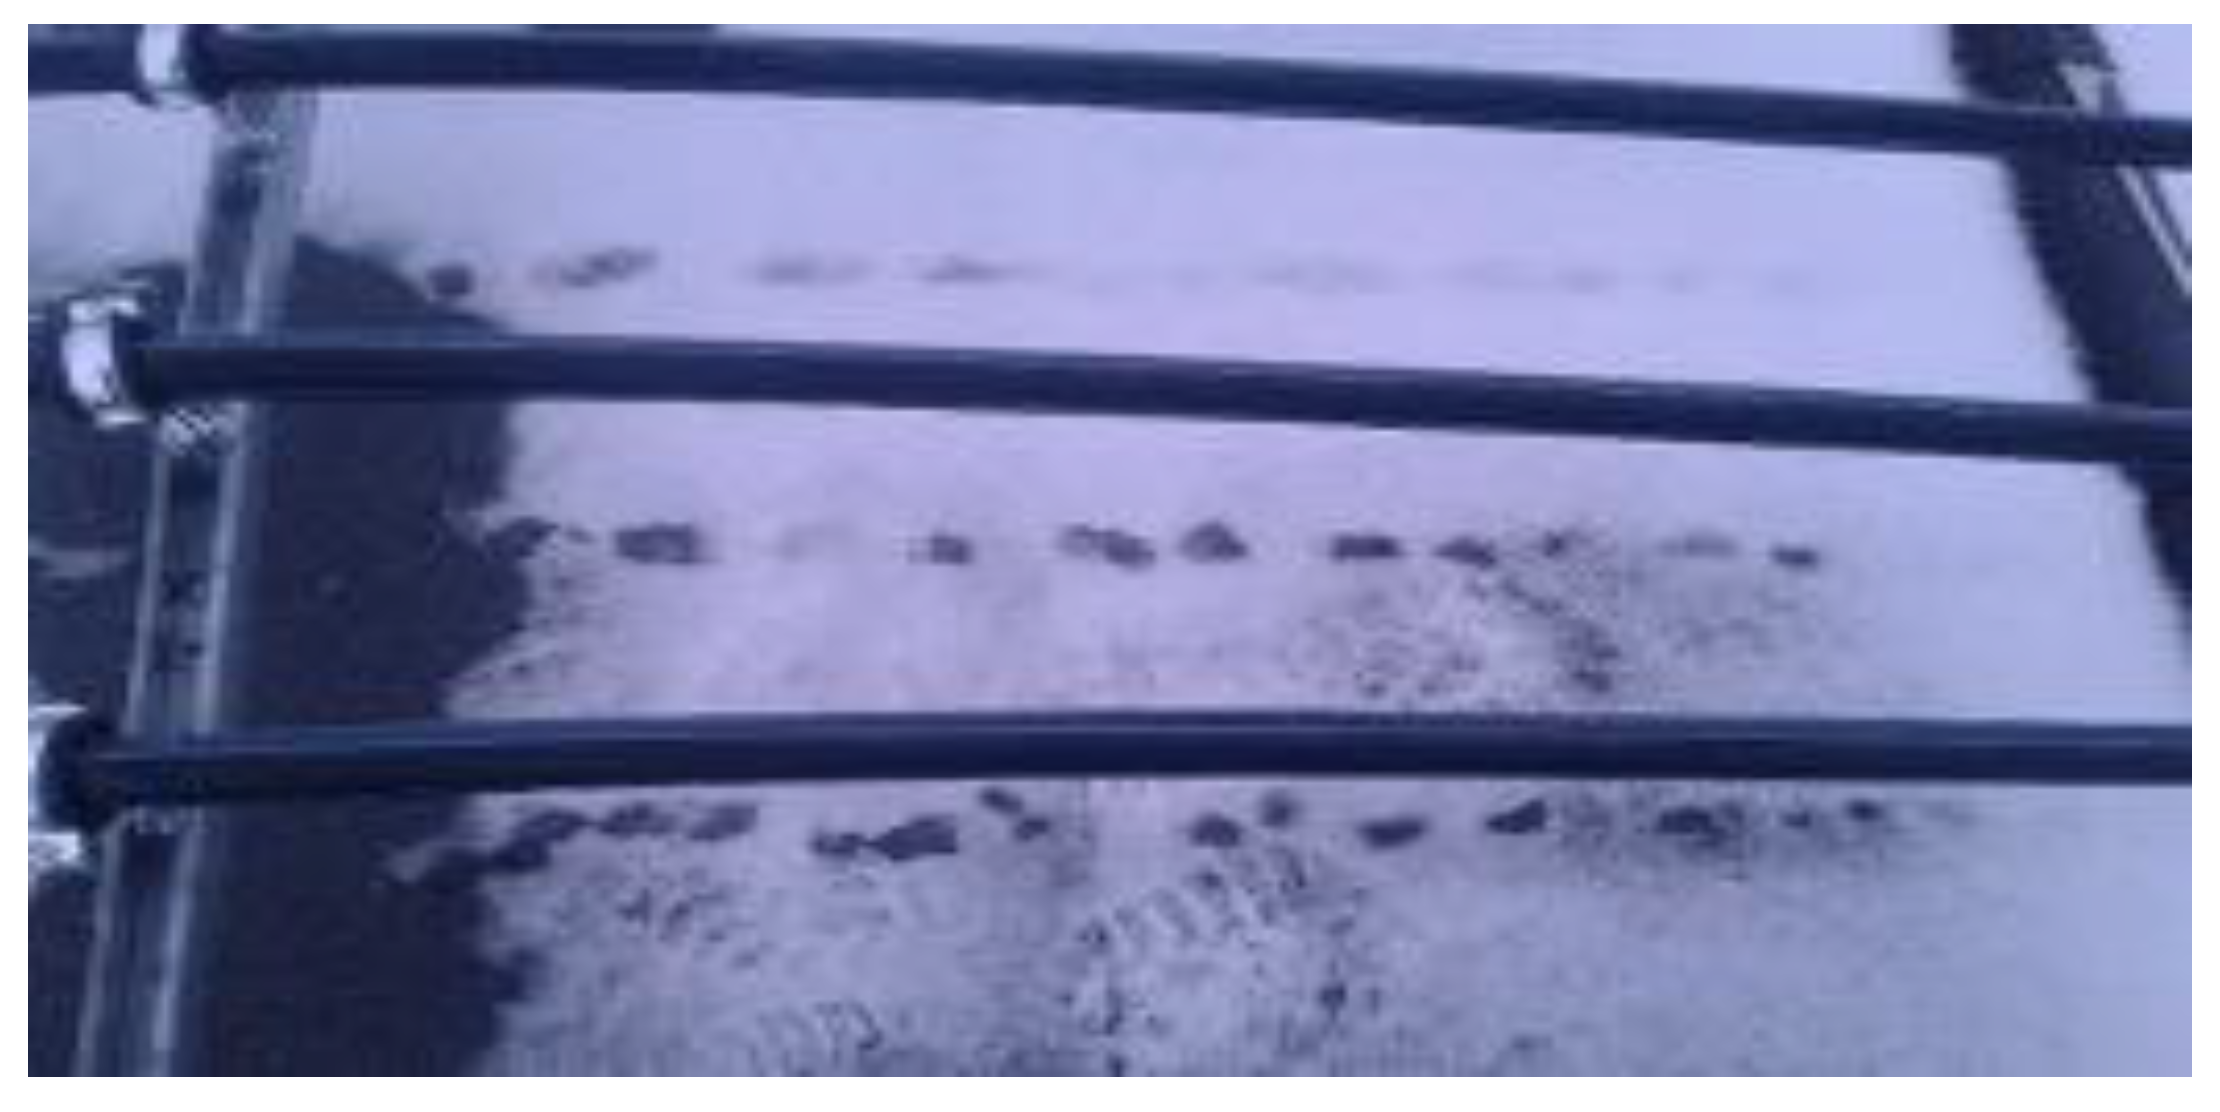
2.1. HDP Pipes—Solar Absorber
The special kind of solar absorber–HDP (header pipes) is located on the cube-shaped roof—
Figure 3. The total length of the pipes is 400 m with diameter 32 mm. This absorber can receive heat not only from the sun but also from the environment. The rain or snow weather conditions also affect the thermal flowing. There may occur situations when the rain or snow could receive or transfer thermal energy from/to HDP pipes and influence the heat transfer in the system. The working substance in the circuits is a mixture of liquids (brine/water). In
Figure 2, it is marked as tc—the collector (HDP absorber) temperature sensor for data capturing. Originally there were common PV panels on the roof, but before the analysis, the PV panels were exchanged for the HDP.
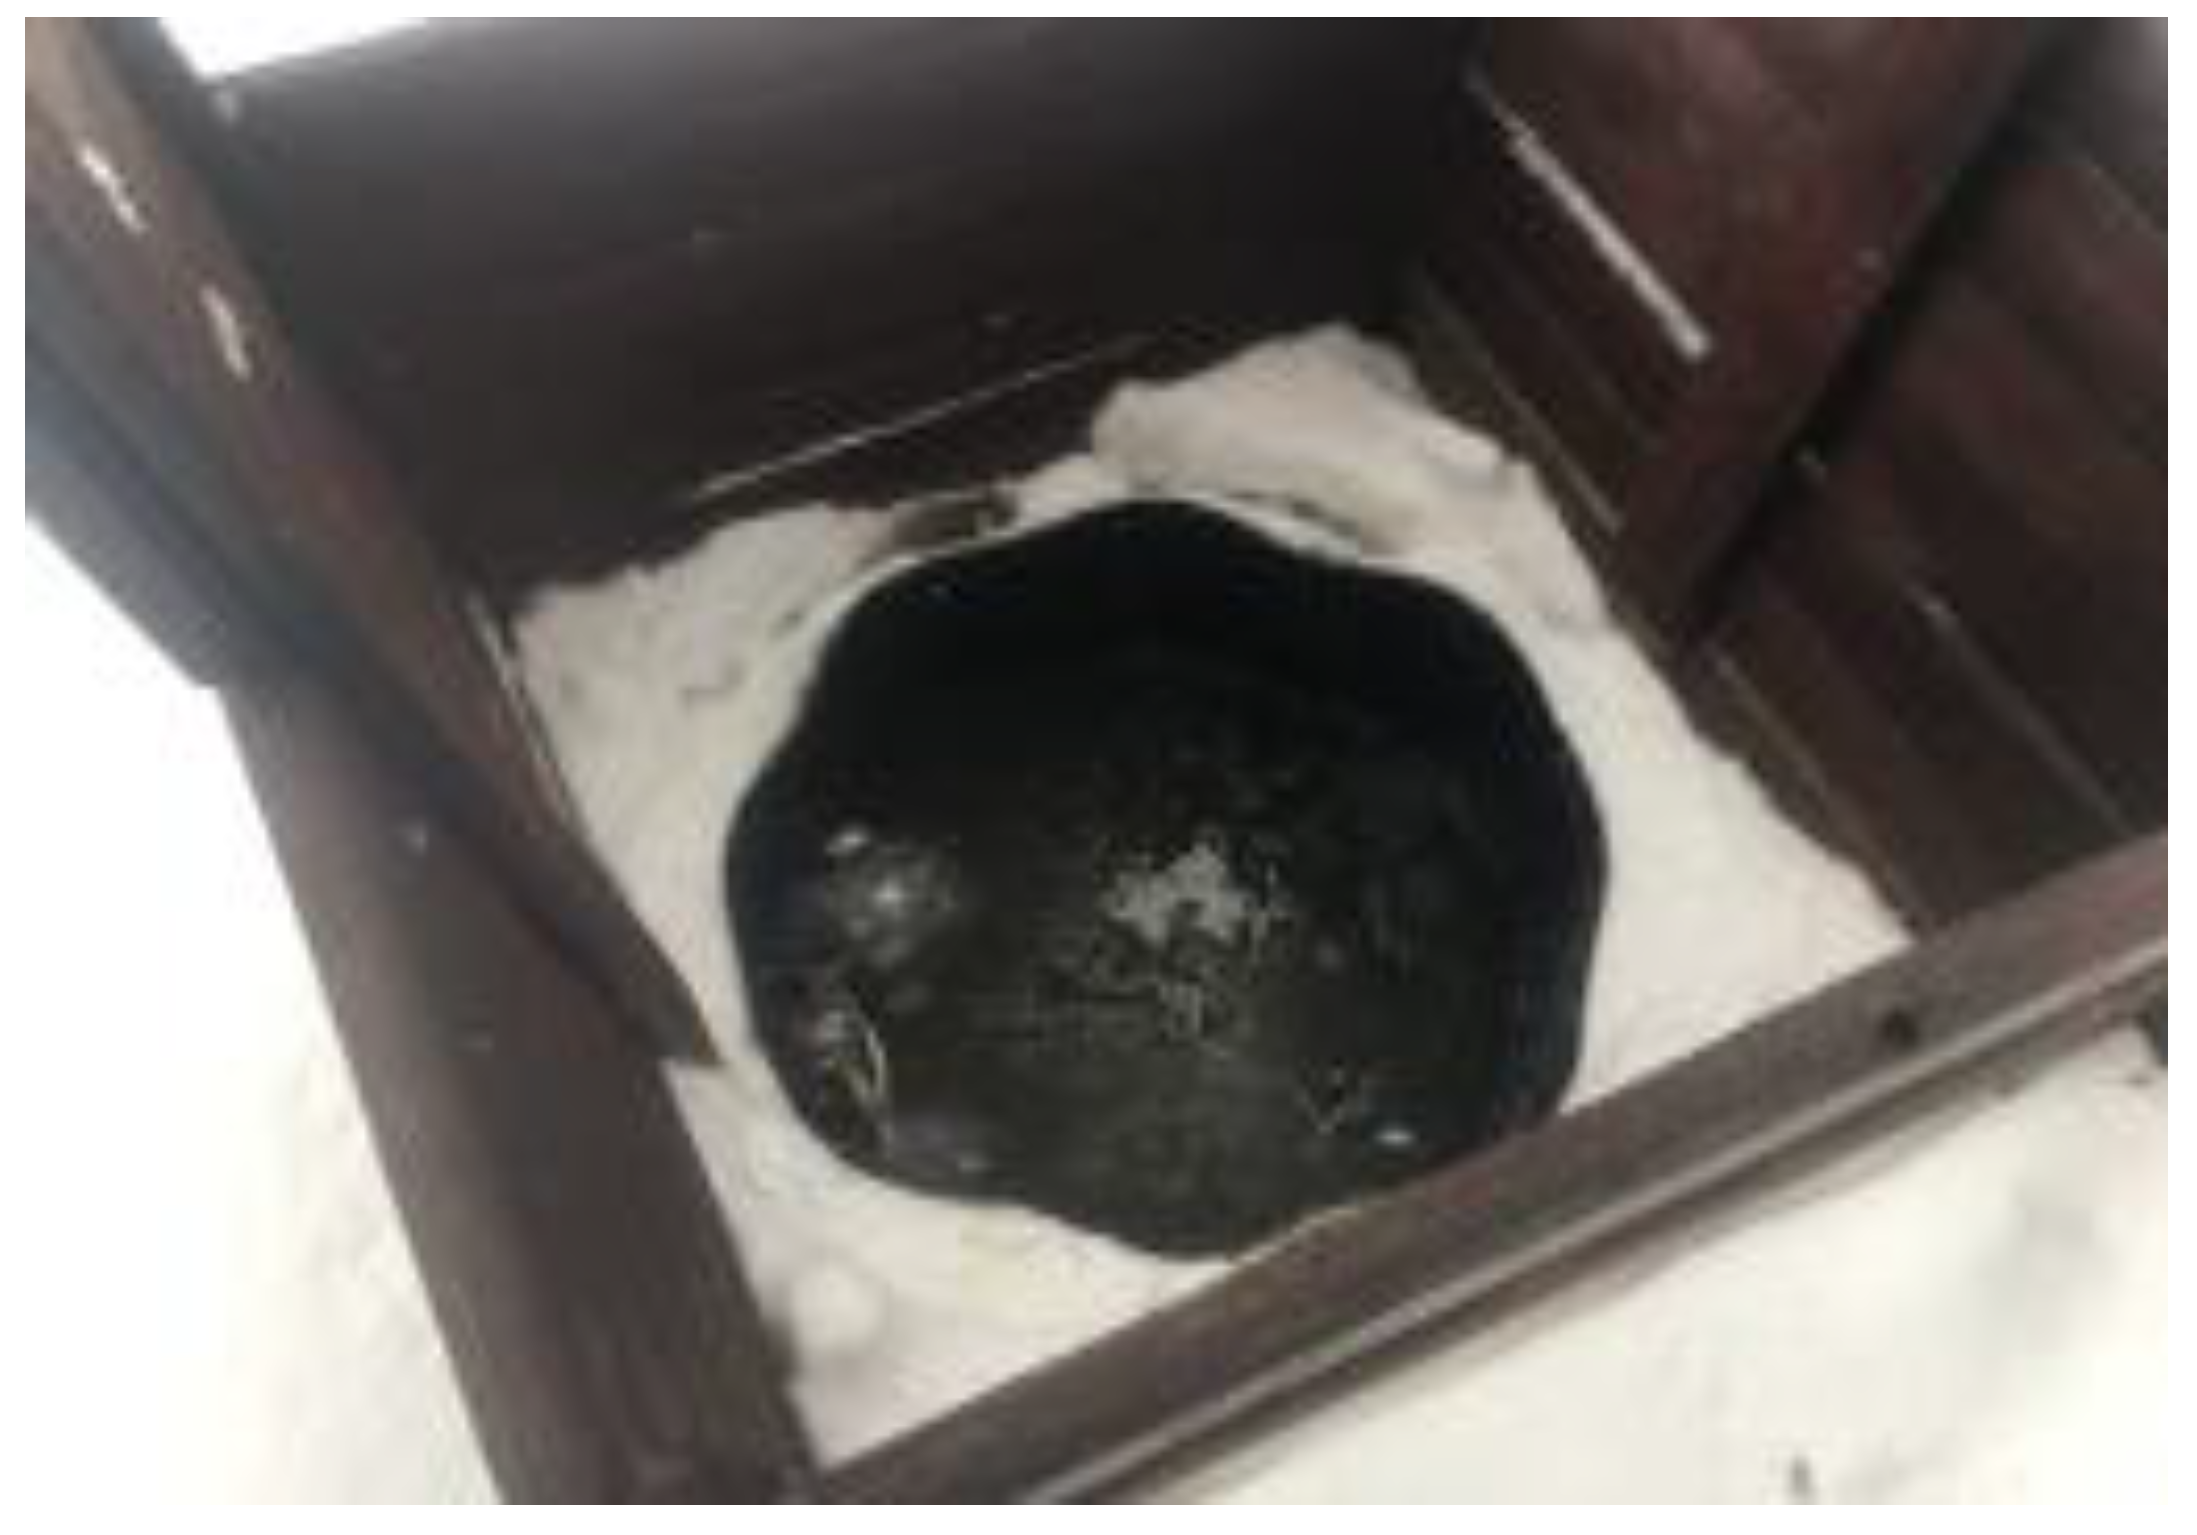
2.2. The Ice Storage Tank
The ice storage tank has 10 m
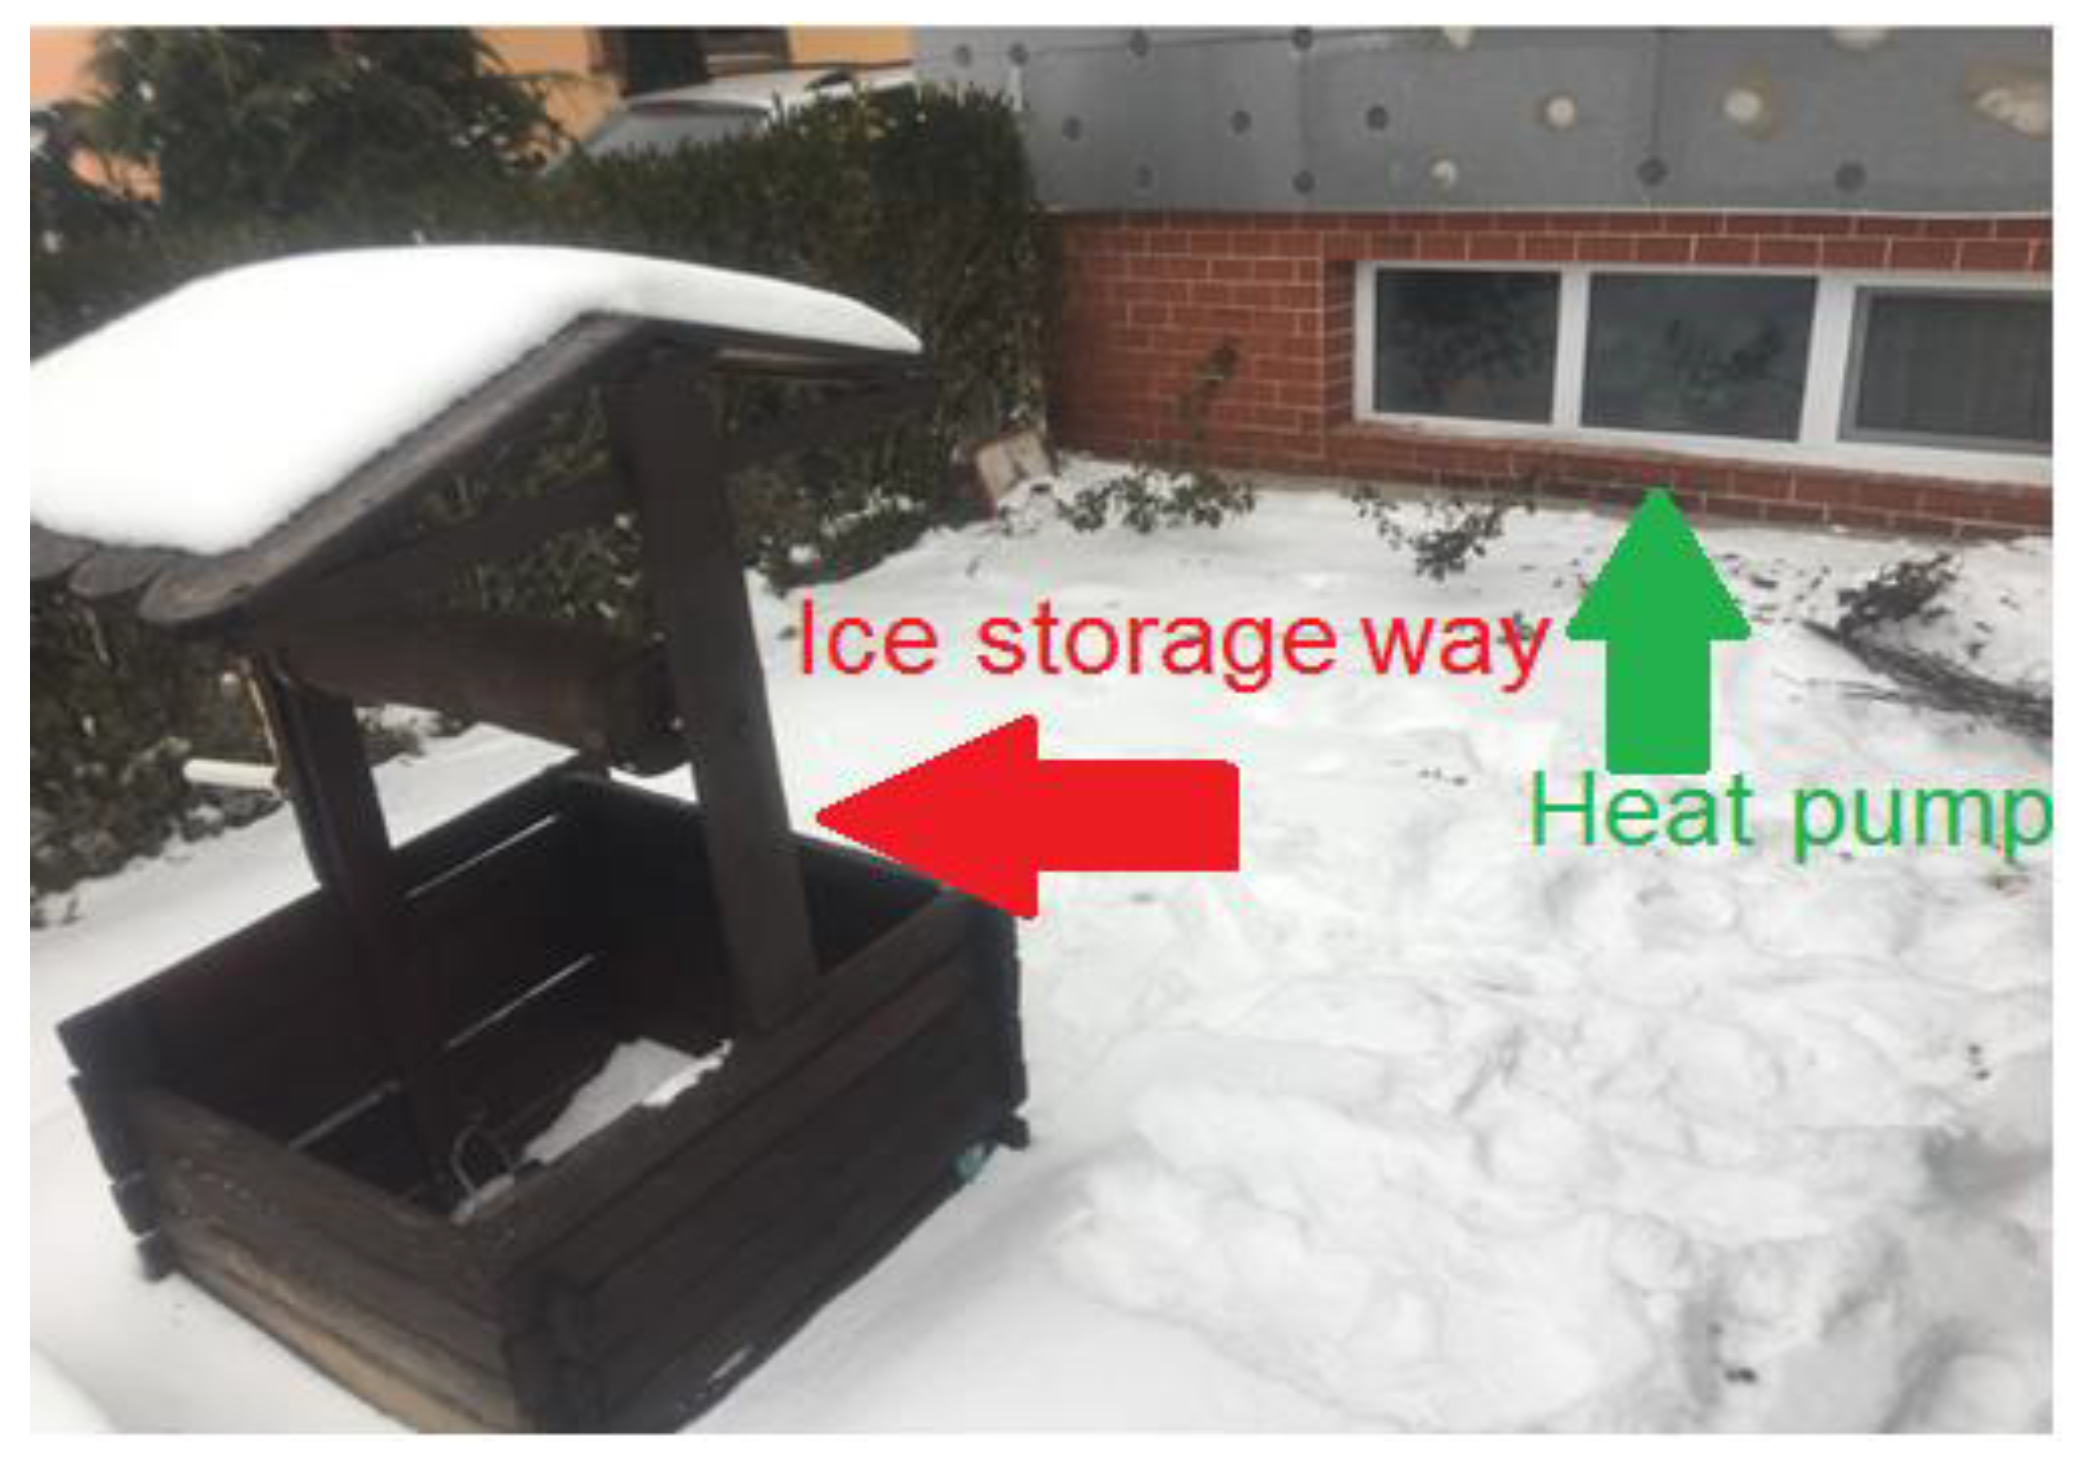
3 (10,000 L) volume with a cylinder shape. This volume is standard for family houses and can be extended. Extension of ice storage tanks volume can bring a longer duration of PCM phases which could have a beneficial influence on the system efficiency increment. Its location is in the garden in the place where originally the well was—in
Figure 4 The tank was made to measure from a metal material. The tank was filled with service water.
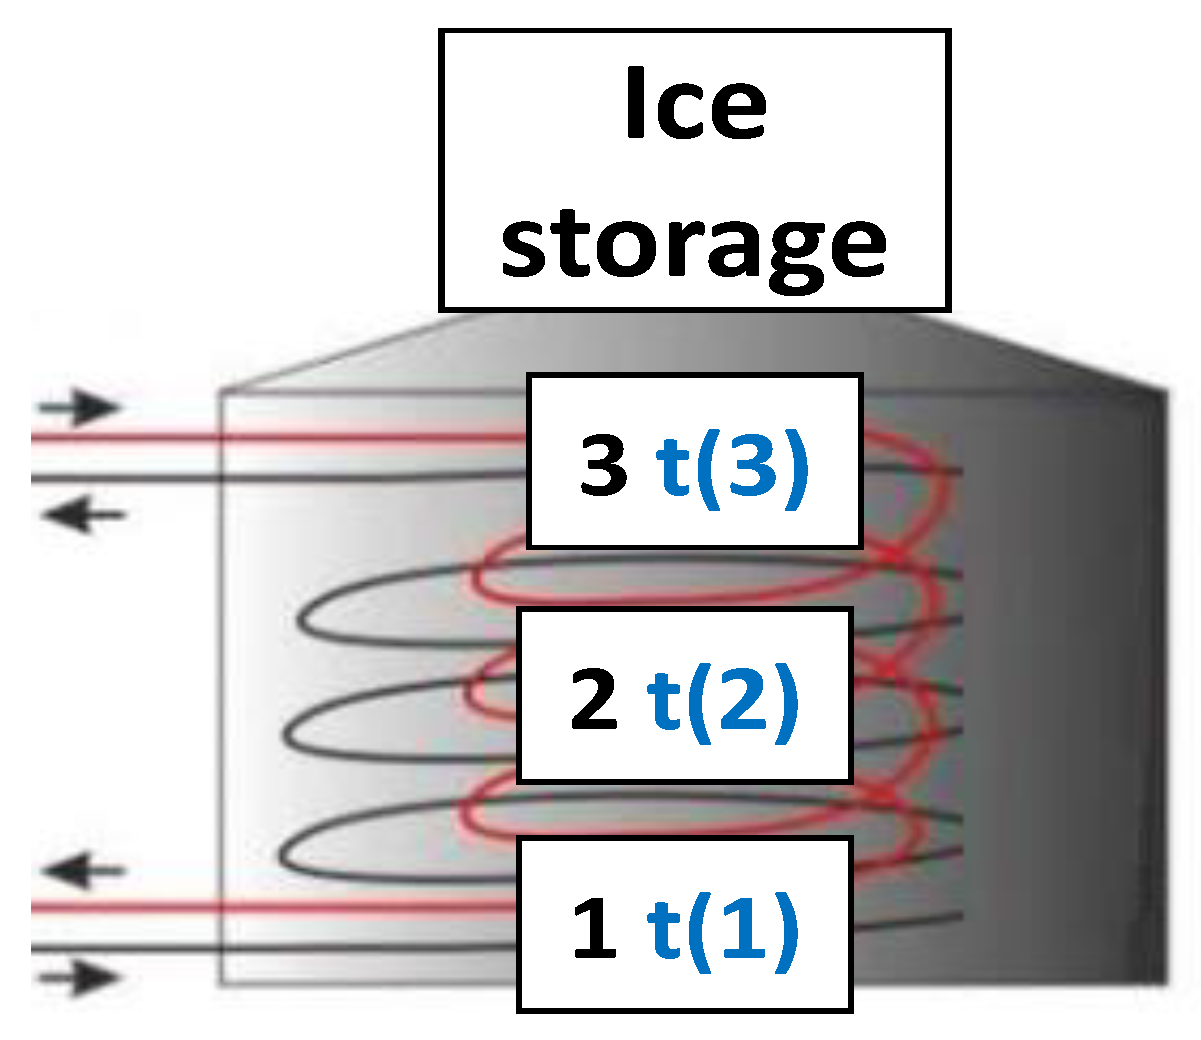
The tank temperatures originally contained 9 temperatures from which 3 sensors of temperatures were on the left edge and another 3 sensors on the right edge of the tank. Unfortunately, these sensors showed very large variations. Therefore, we evaluated only 3 temperatures from sensors located in the middle side of the tank. Temperatures and positions of the ice storage tank (t1-t3) are illustrated in
Figure 2 and
Figure 5.
2.3. Temperatures
We captured 9 temperatures through the analysis from which we evaluated only 5 important temperatures for our research. Captured temperatures data included the outside environment temperature, absorber temperature, service water temperature, and ice storage tank temperature. We focused mainly on the ice storage tank itself.
Analyzed 5 types of temperatures were matched as:
t1—ice storage tank temperature in the down position.
t2—ice storage tank temperature in the center position.
t3—ice storage tank temperature in the up position.
to—outside (environment) temperature.
tc—collector (HDP absorber) temperature.
2.4. Operating Modes/States of Heat Pump
During the analysis, 3 working modes of the system occurred. The heat pump controlled the operation of each condition based on temperature conditions. The operating mode controls the behavior of the system. The value of three operating modes showed only: State 1—turn on, or state 0—turn off.
Status—Solar absorber circuit: The refrigerant from the solar collectors circulates directly into the heat pump without transferring part of the thermal energy inside the ice tank. This circuit behaves like any other common heat pump without the ice storage tank. The illustration is shown in
Figure 6.
Status—Charging process (Solar absorber circuit with ice tank recharging): Turns on, when the temperature difference between the tank and HDP absorber is greater than 4.25 °C. The coolant starts to transfer and store part of thermal energy from the HDP absorber into the ice tank. Thanks to that the ice/water inside the tank being heated, thermal energy is stored from the collectors for future usage. This condition turns off when the temperature difference between the HDP absorber and the ice tank drops by 3.75 °C. Status 1 and status 2 work together at the same time, but only in the case if the temperature difference between the HDP absorber and ice storage tank is greater than 4.25 °C. The illustration of this status is in
Figure 7.
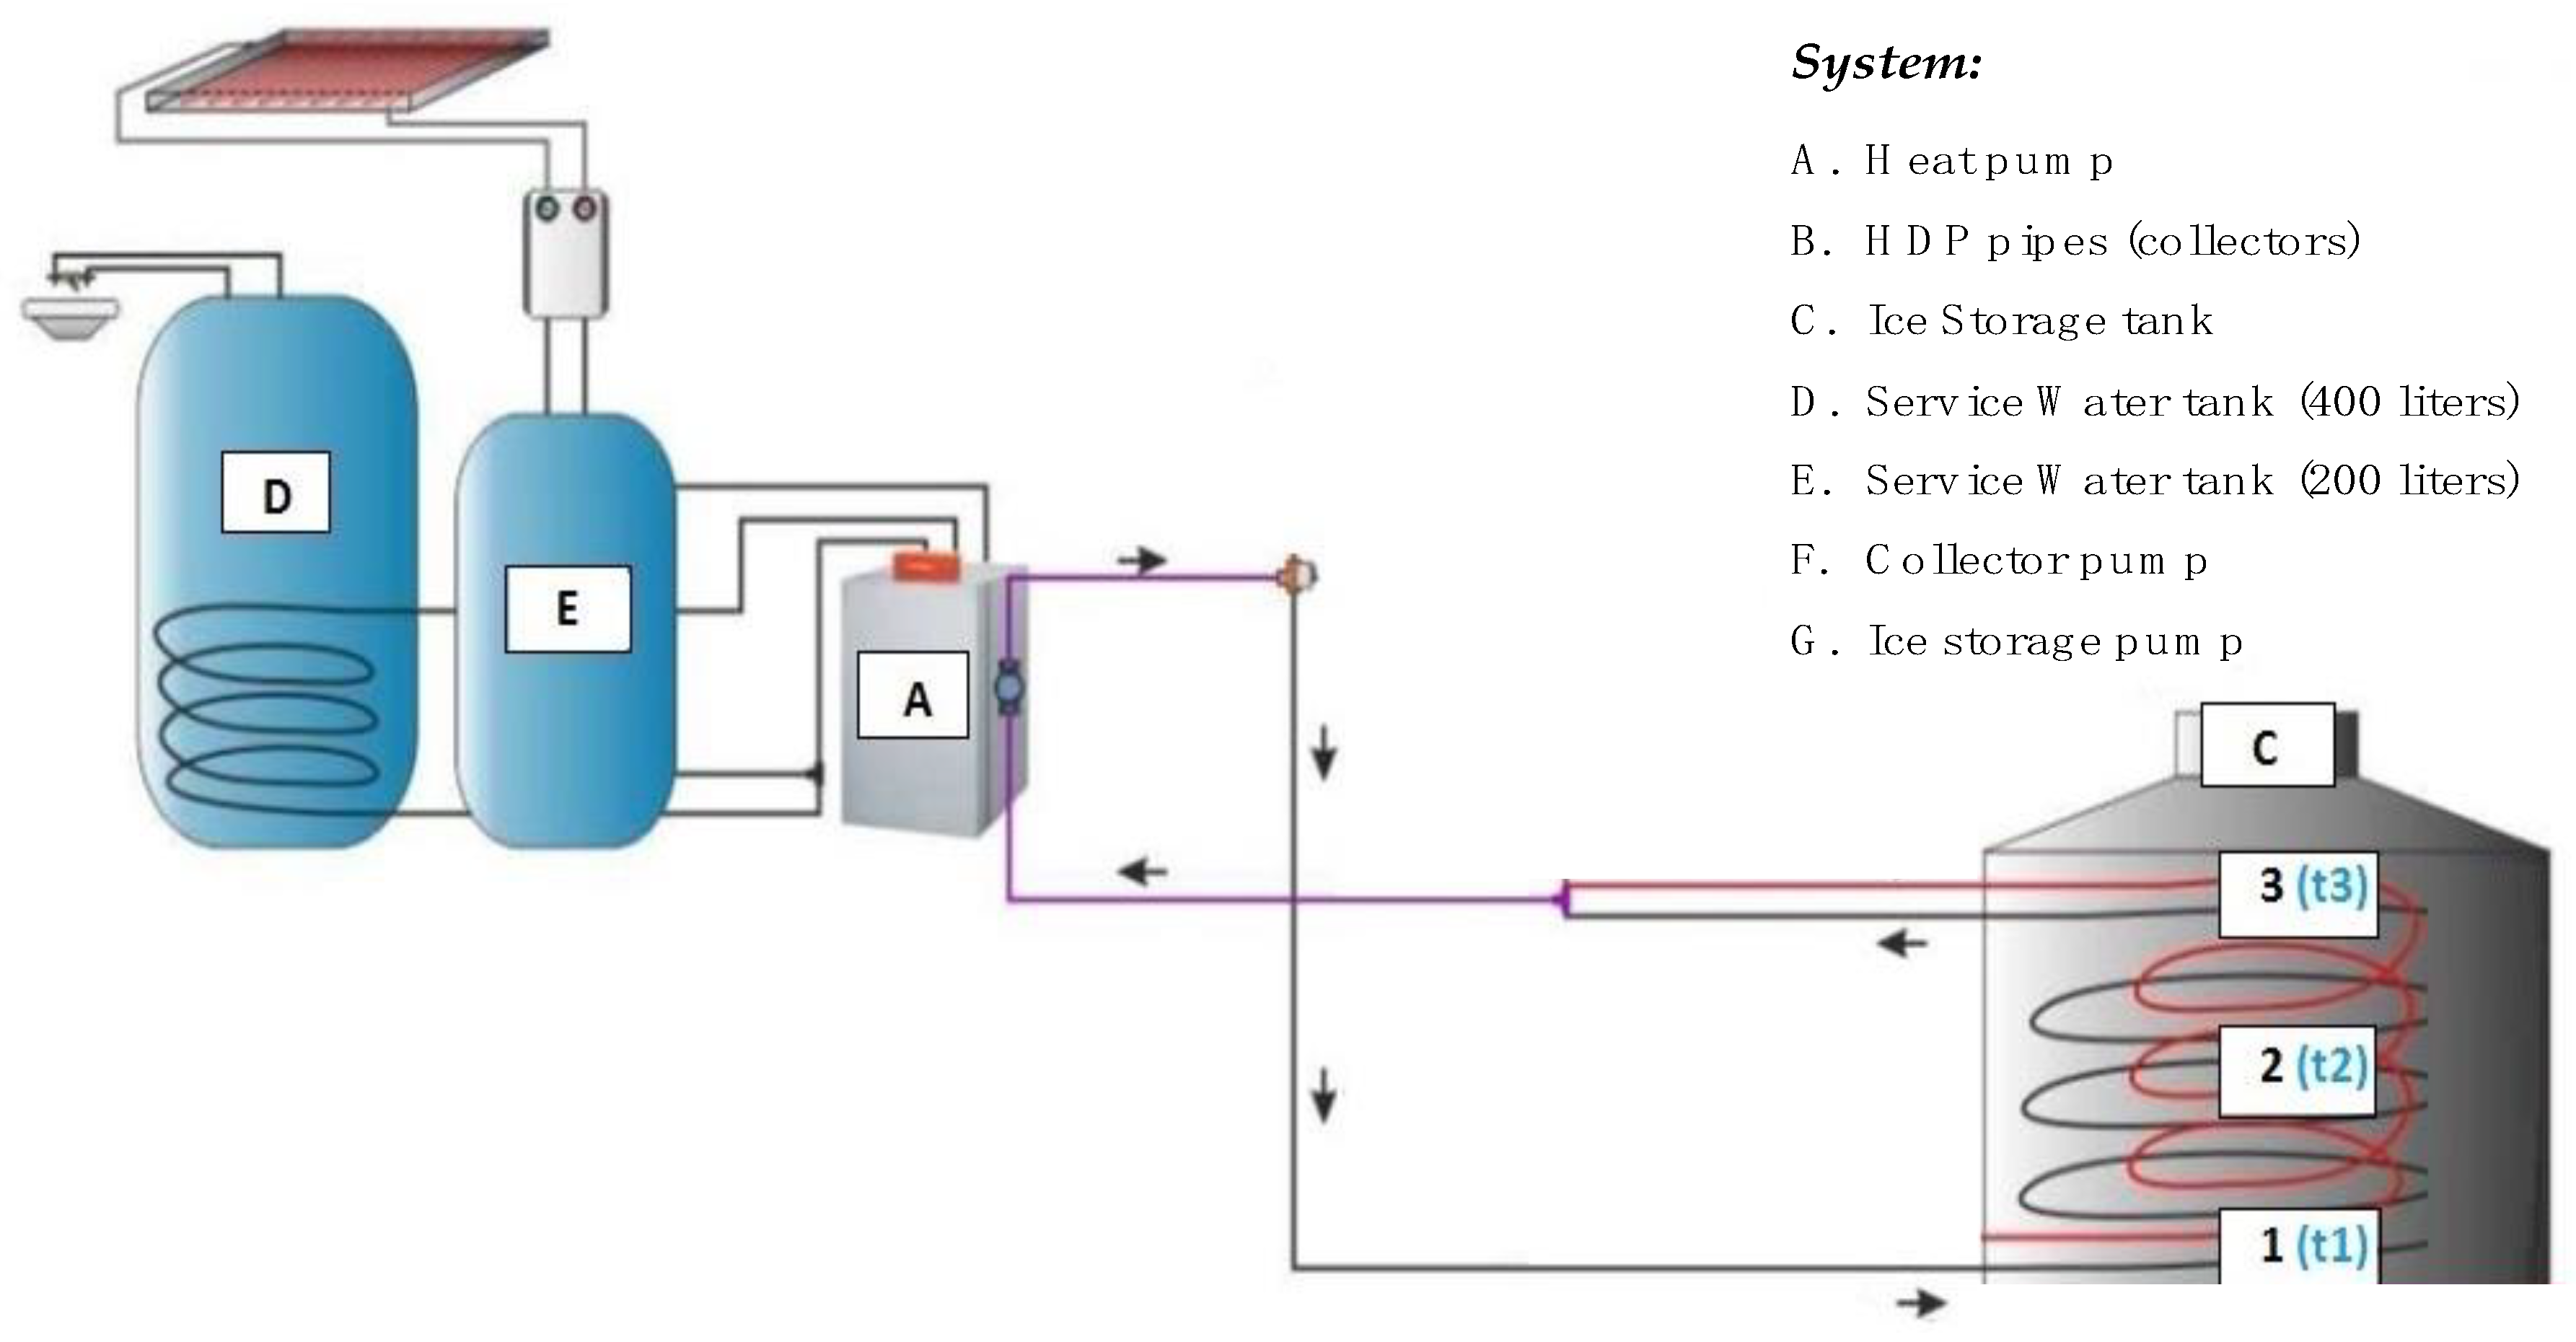
Status—Discharging process (Ice tank temperature circuit): Turns on, when the ice storage tank has the higher temperature than the HDP absorber. The ice storage becomes the warmest and also the primary energy source of the system. The collector pump turns off and thanks to the three-way valve, the fluid circulated only from the heat pump to the ice storage tank. We use stored thermal energy in the water/ice. This status represents the ice storage usage and turns off when the temperature of the HDP absorber is higher than the ice storage tank temperature. The illustration is shown in
Figure 8.
2.5. Efficiency
The heat pump itself calculates the flows of received and transferred energy. The total efficiency—seasonal coefficient of performance (SCOP) of this system was evaluated by the heat pump controller at the end of the analysis. It is necessary to note, that coefficient of performance (COP) is the current efficiency of the heating system. The seasonal coefficient of performance (SCOP) is efficiency from all seasons (working time), which is more valuable especially from the customer’s point of view. The COP and SCOP were calculated by the heat pump at the same time. Our analysis aims to better understand how this system works, better describe the relationships between graphical/numerical input and real conditions. The goal was also to bring a detailed description of the heat transfers medium behavior at various phases of storing and using thermal energy in the vertical ice storage tank profile to increase efficiency.
2.6. Ice Storage Phases
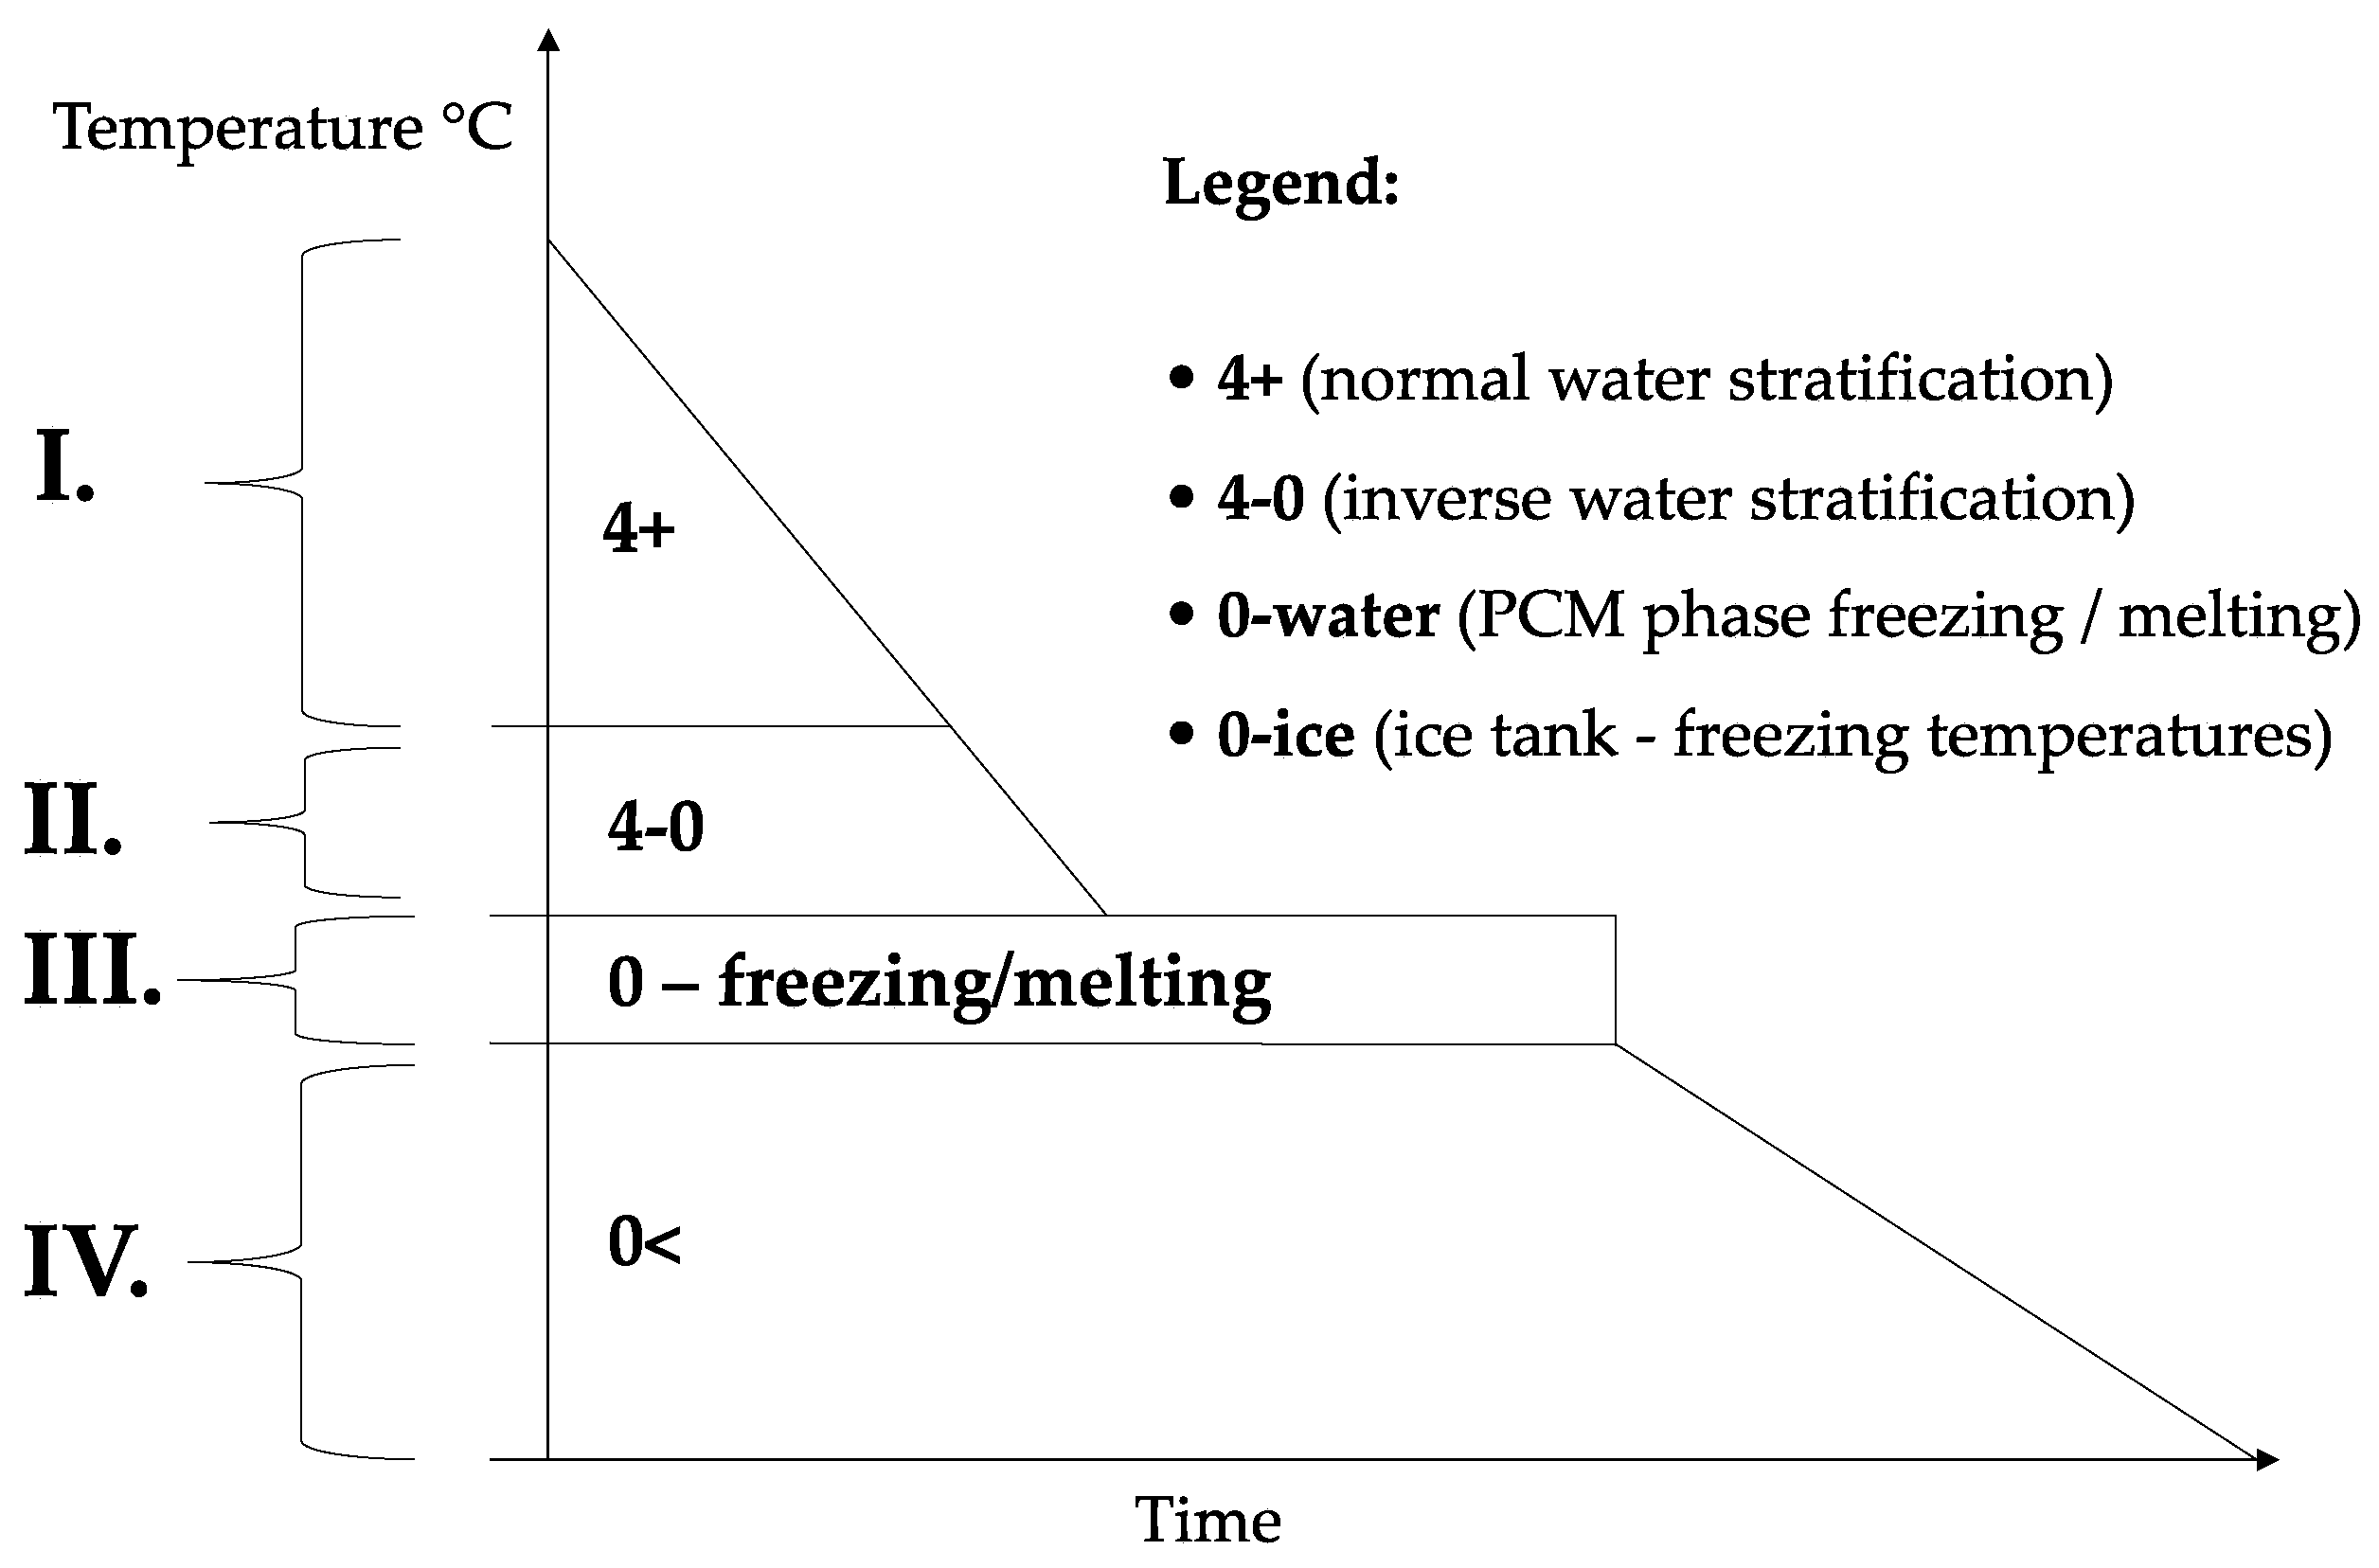
Before the analysis, we suggested that the expected phases of the ice tank are based on the theoretical knowledge of water. In
Figure 9, we can see the expected phases of ice storage. Depending on temperatures, we supposed 4 phases of the ice storage tank. The water has many anomalies, especially in the temperature range from 0 to 4 °C when behavior is opposite than would we expected. The most interesting phase is the third PCM phase, which is also the most significant for the analysis. All these phases need to be taken into account for analysis.
During the analysis, some unpredictable and interesting moments occurred, which are better described and illustrated in the results. These moments are important for a better understanding of the whole working process of the system, especially the states and properties of ice storage itself.
3. Results and Discussion
In this research, 775,496 data were analyzed. The total analysis time was 192 days, including the key part of the heating season. During that time, all expected phases of the ice storage tank occurred. In the results, are provided all ice storage phases, temperature courses, anomalies, and other interesting moments occurred during the analysis.
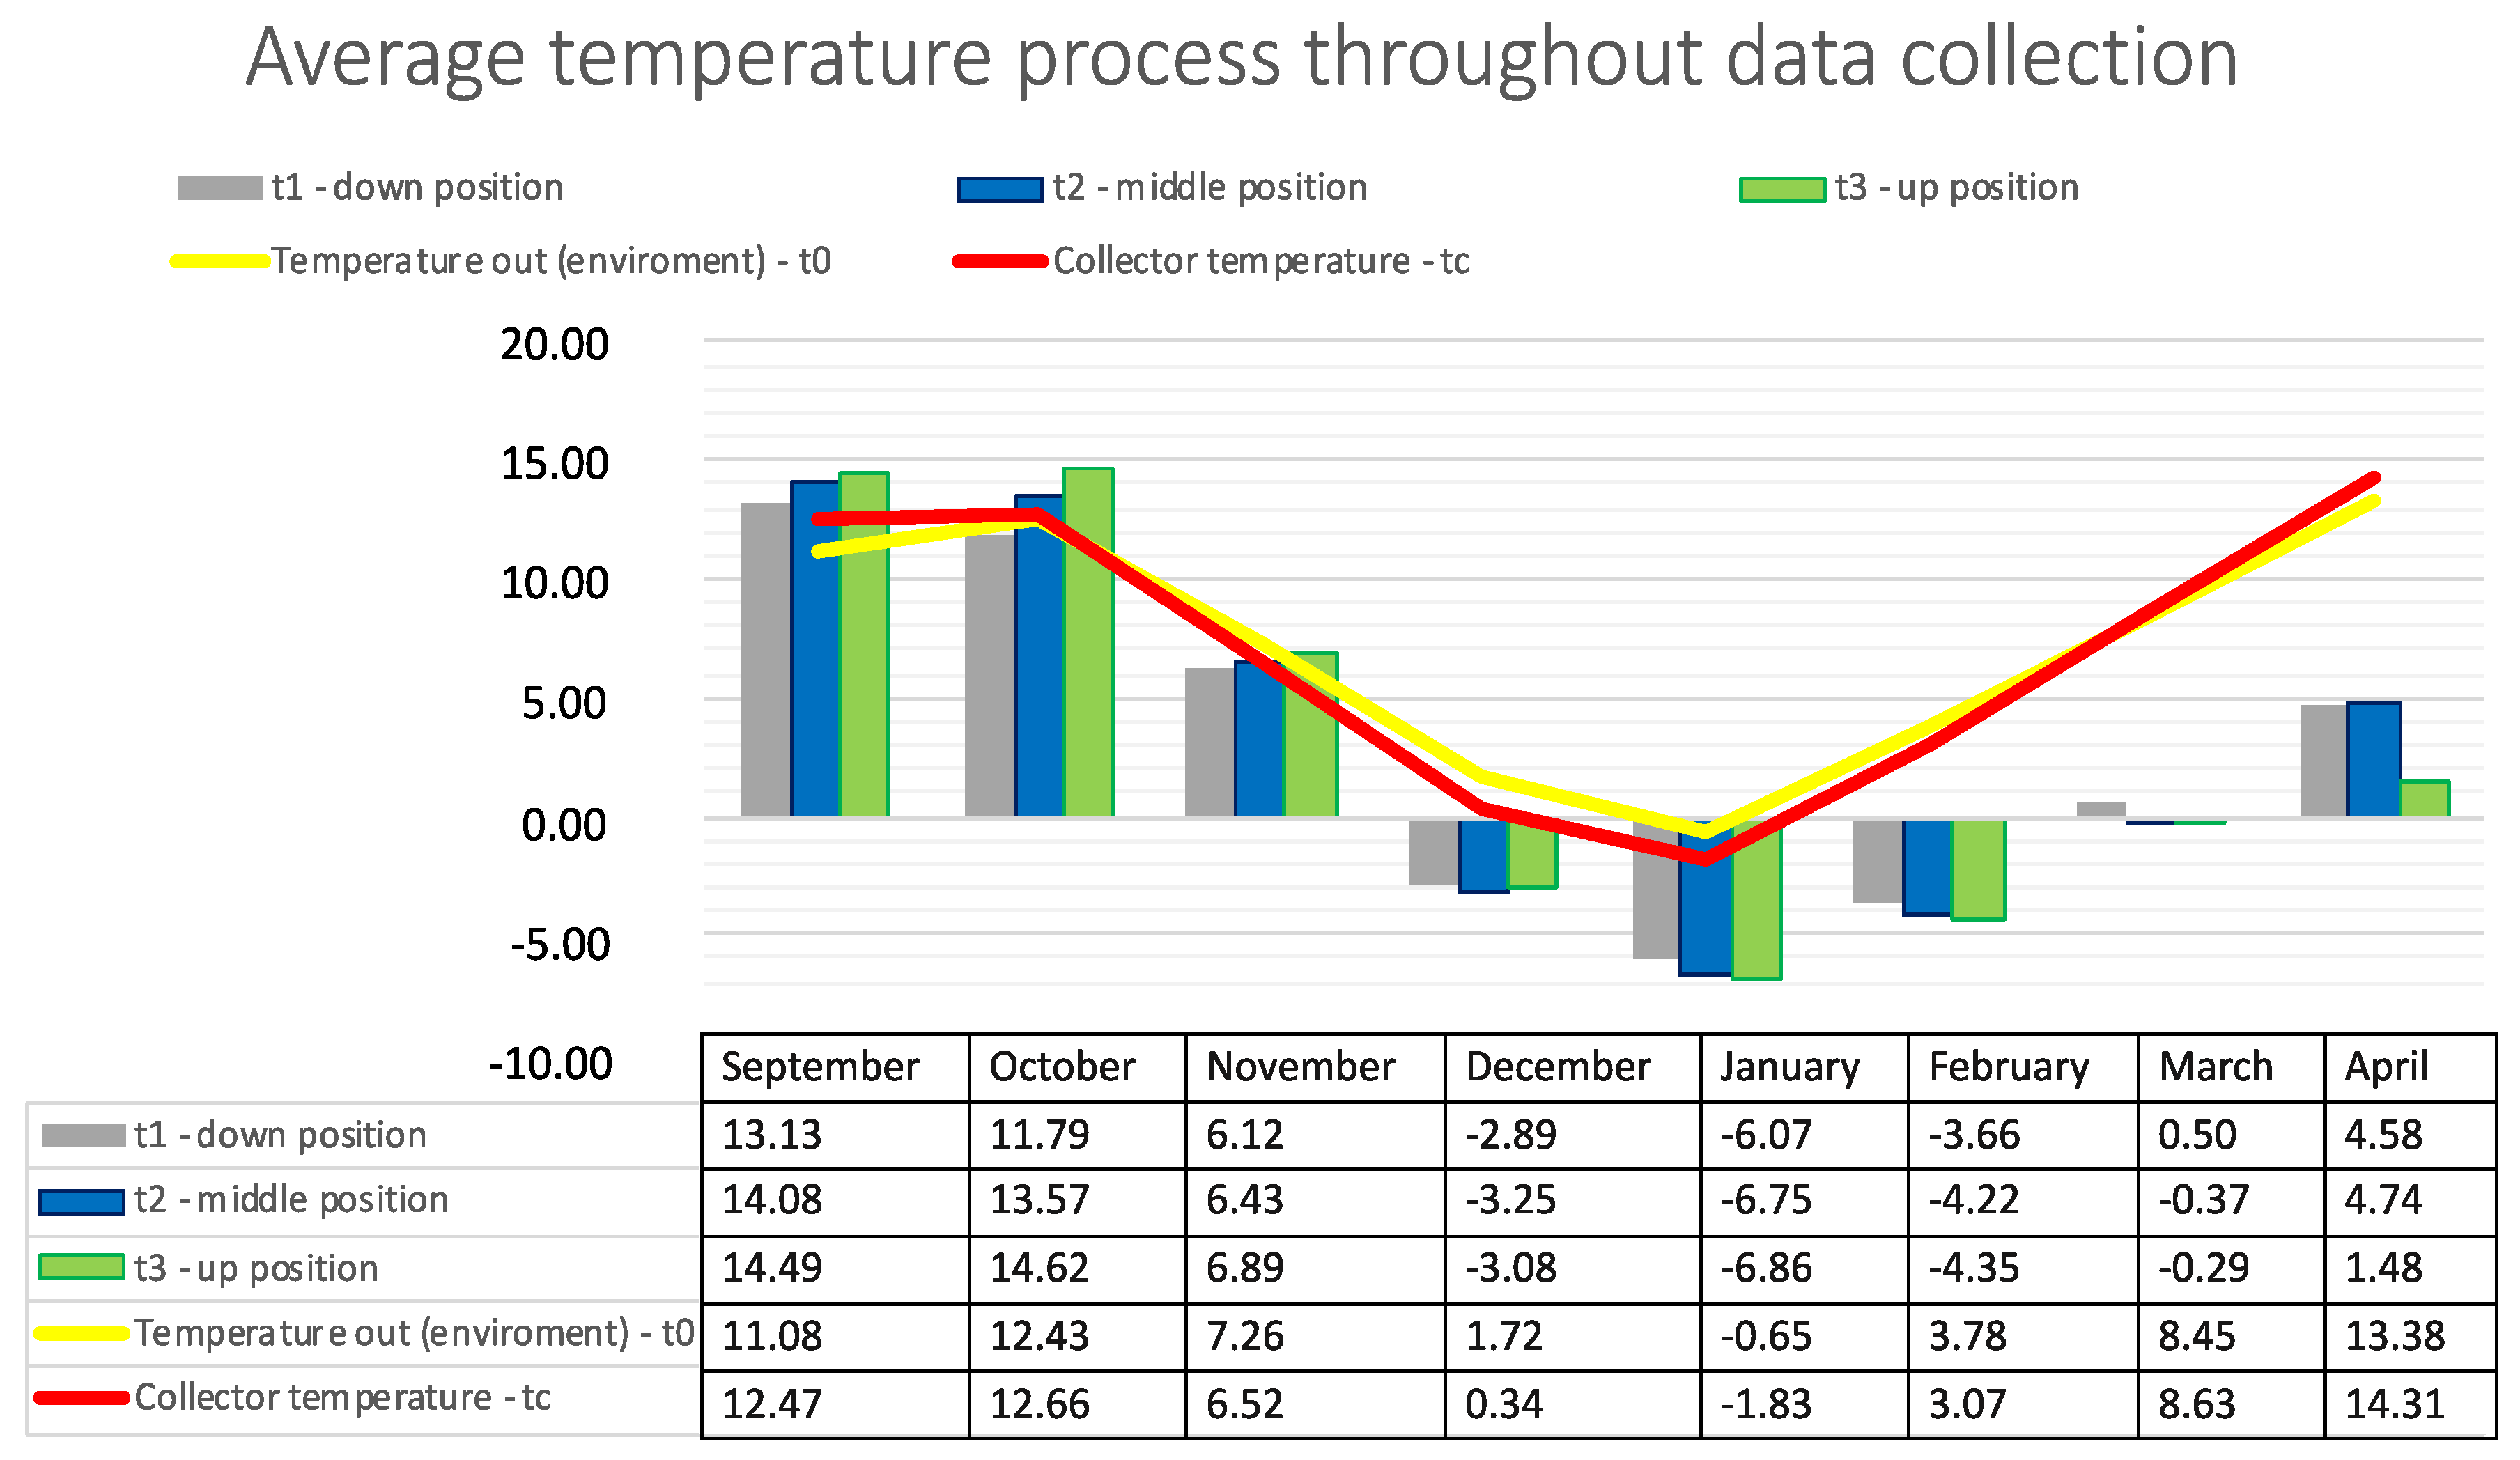
3.1. Temperature Process throughout Data Collection
Figure 10 shows the temperature profile of all temperatures investigated throughout the data collection. The graphical sequence corresponds to the temperatures to and tc. It can be said that the temperature conditions varied depending on the season and temperatures of particular days and months. It is certainly worth mentioning the period of freezing water and melting ice. The freezing occurred in December and ice melting in March and continued until April 2019.
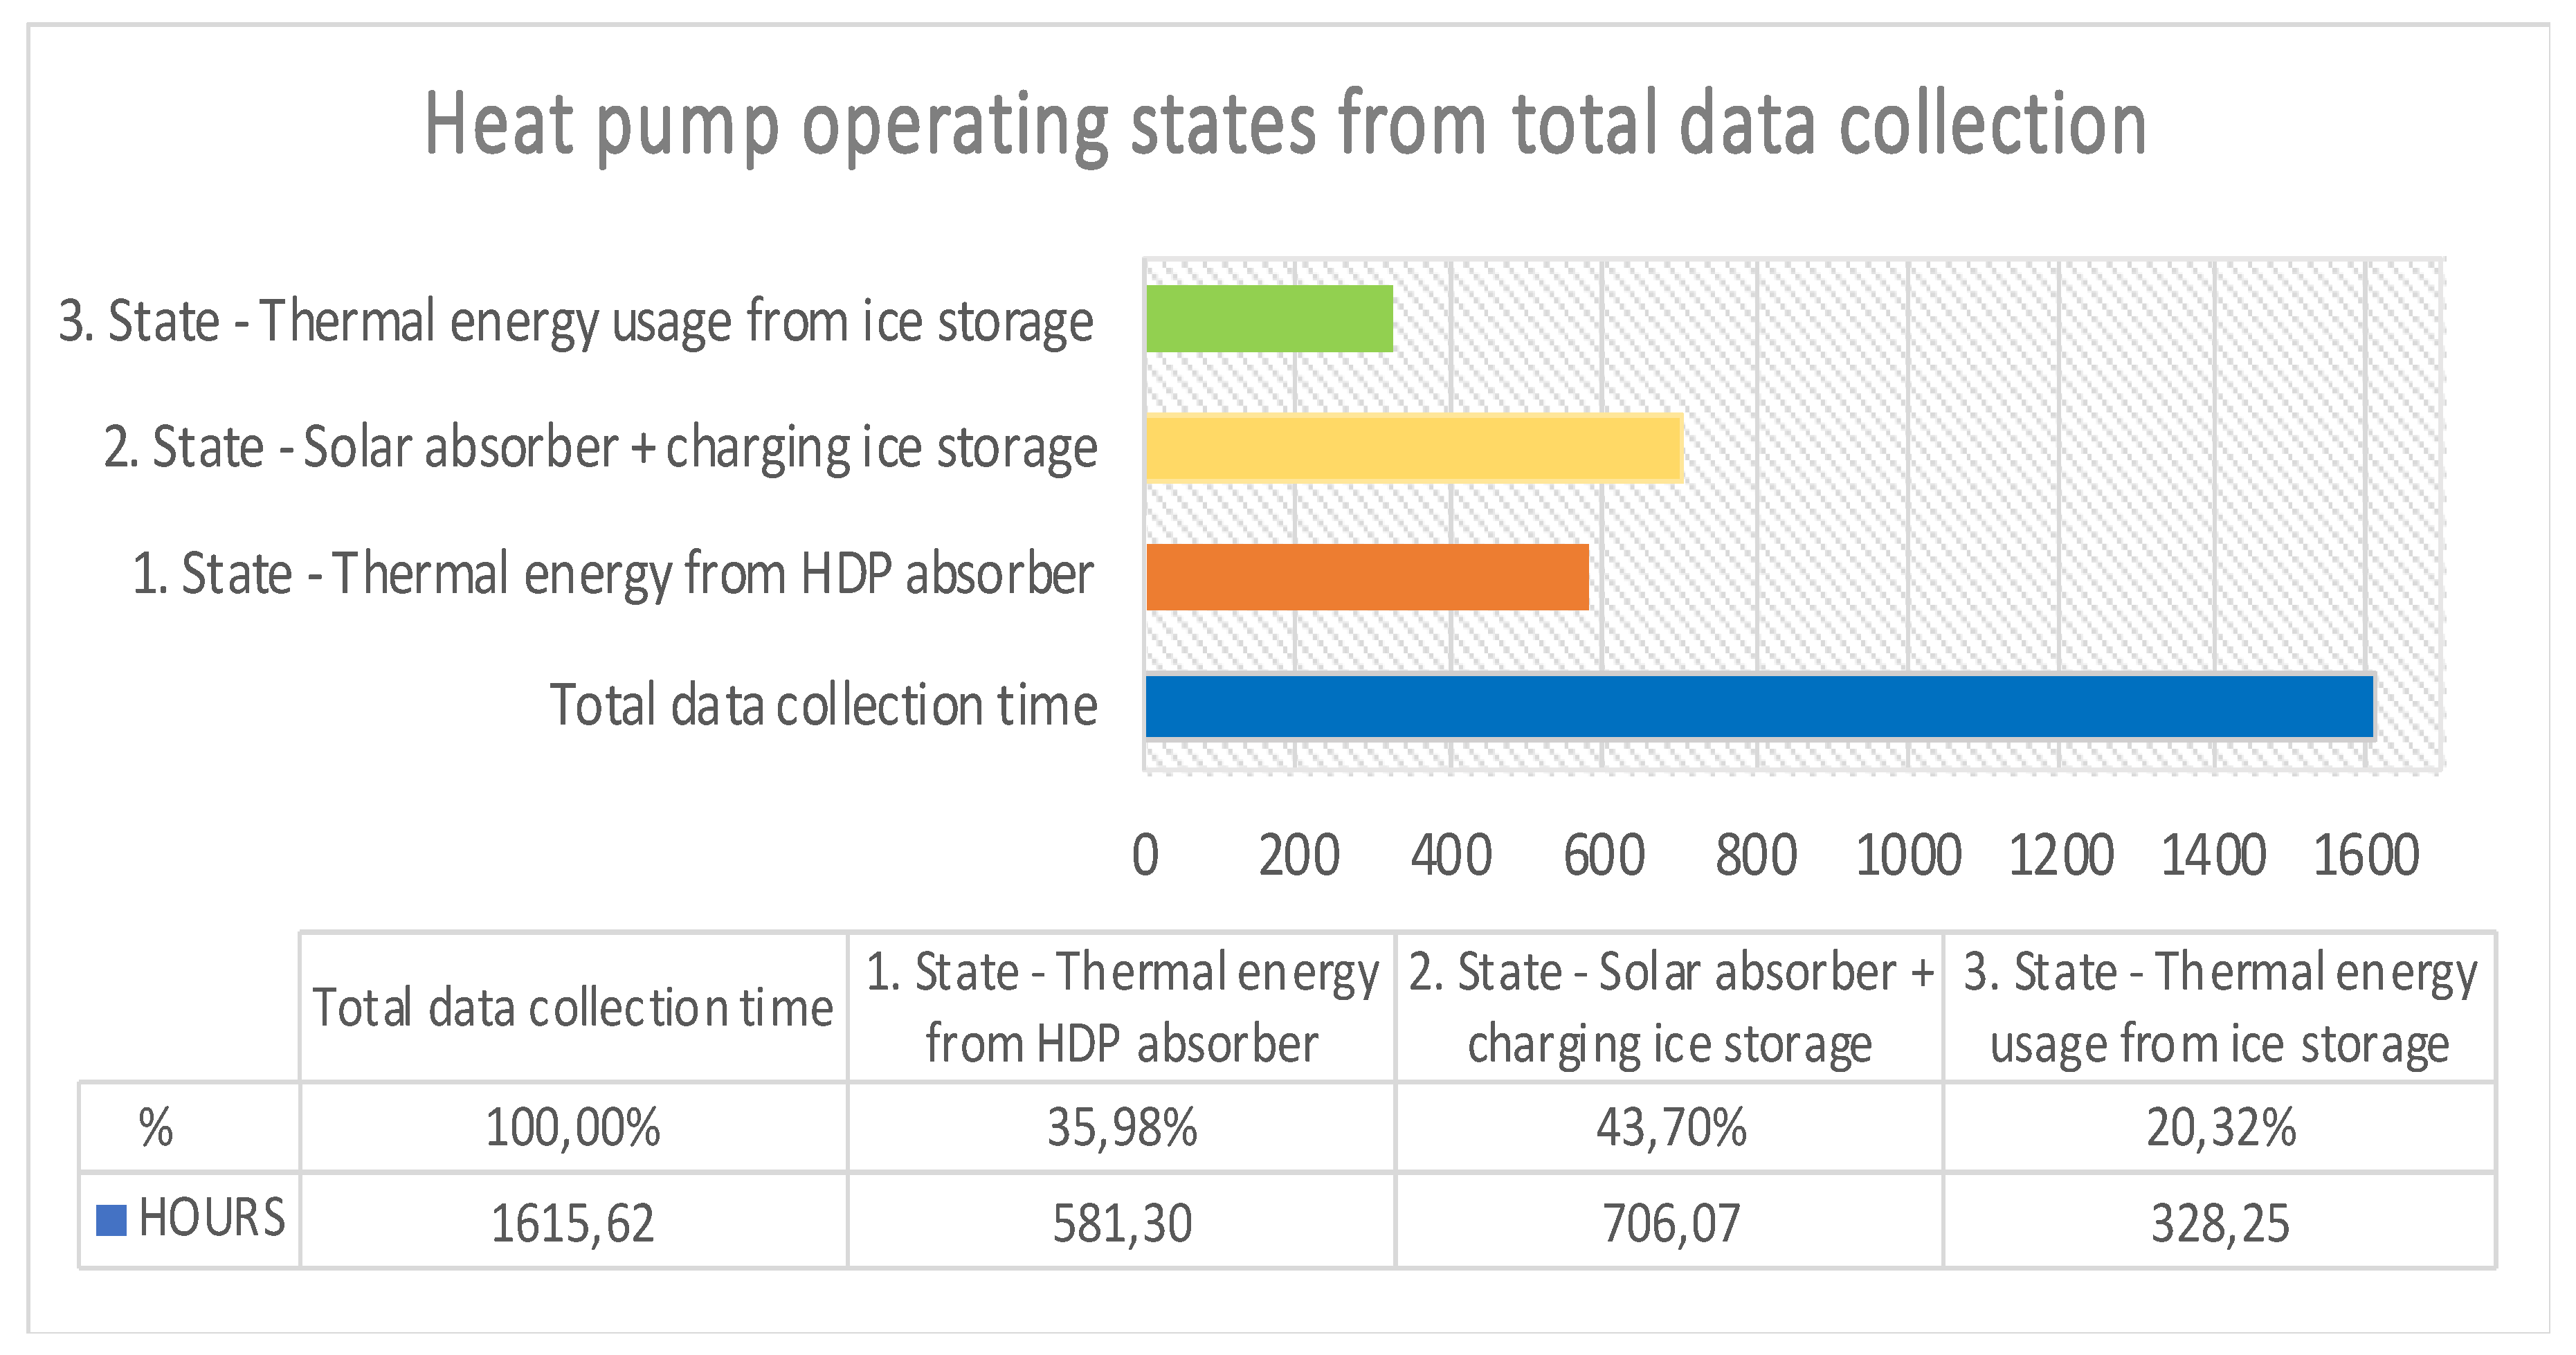
3.2. Heating System Processes Overview
The course of heat pump operation for the entire data collection period is shown in
Figure 11. The most common was state 2—solar absorber circuit + ice charging, up to 43.7% and 706.07 h of data collection, respectively. The usage of thermal energy from the ice storage (state 3) was 20.32% and 328.25 h, which represents one-fifth of the total time of data collection.
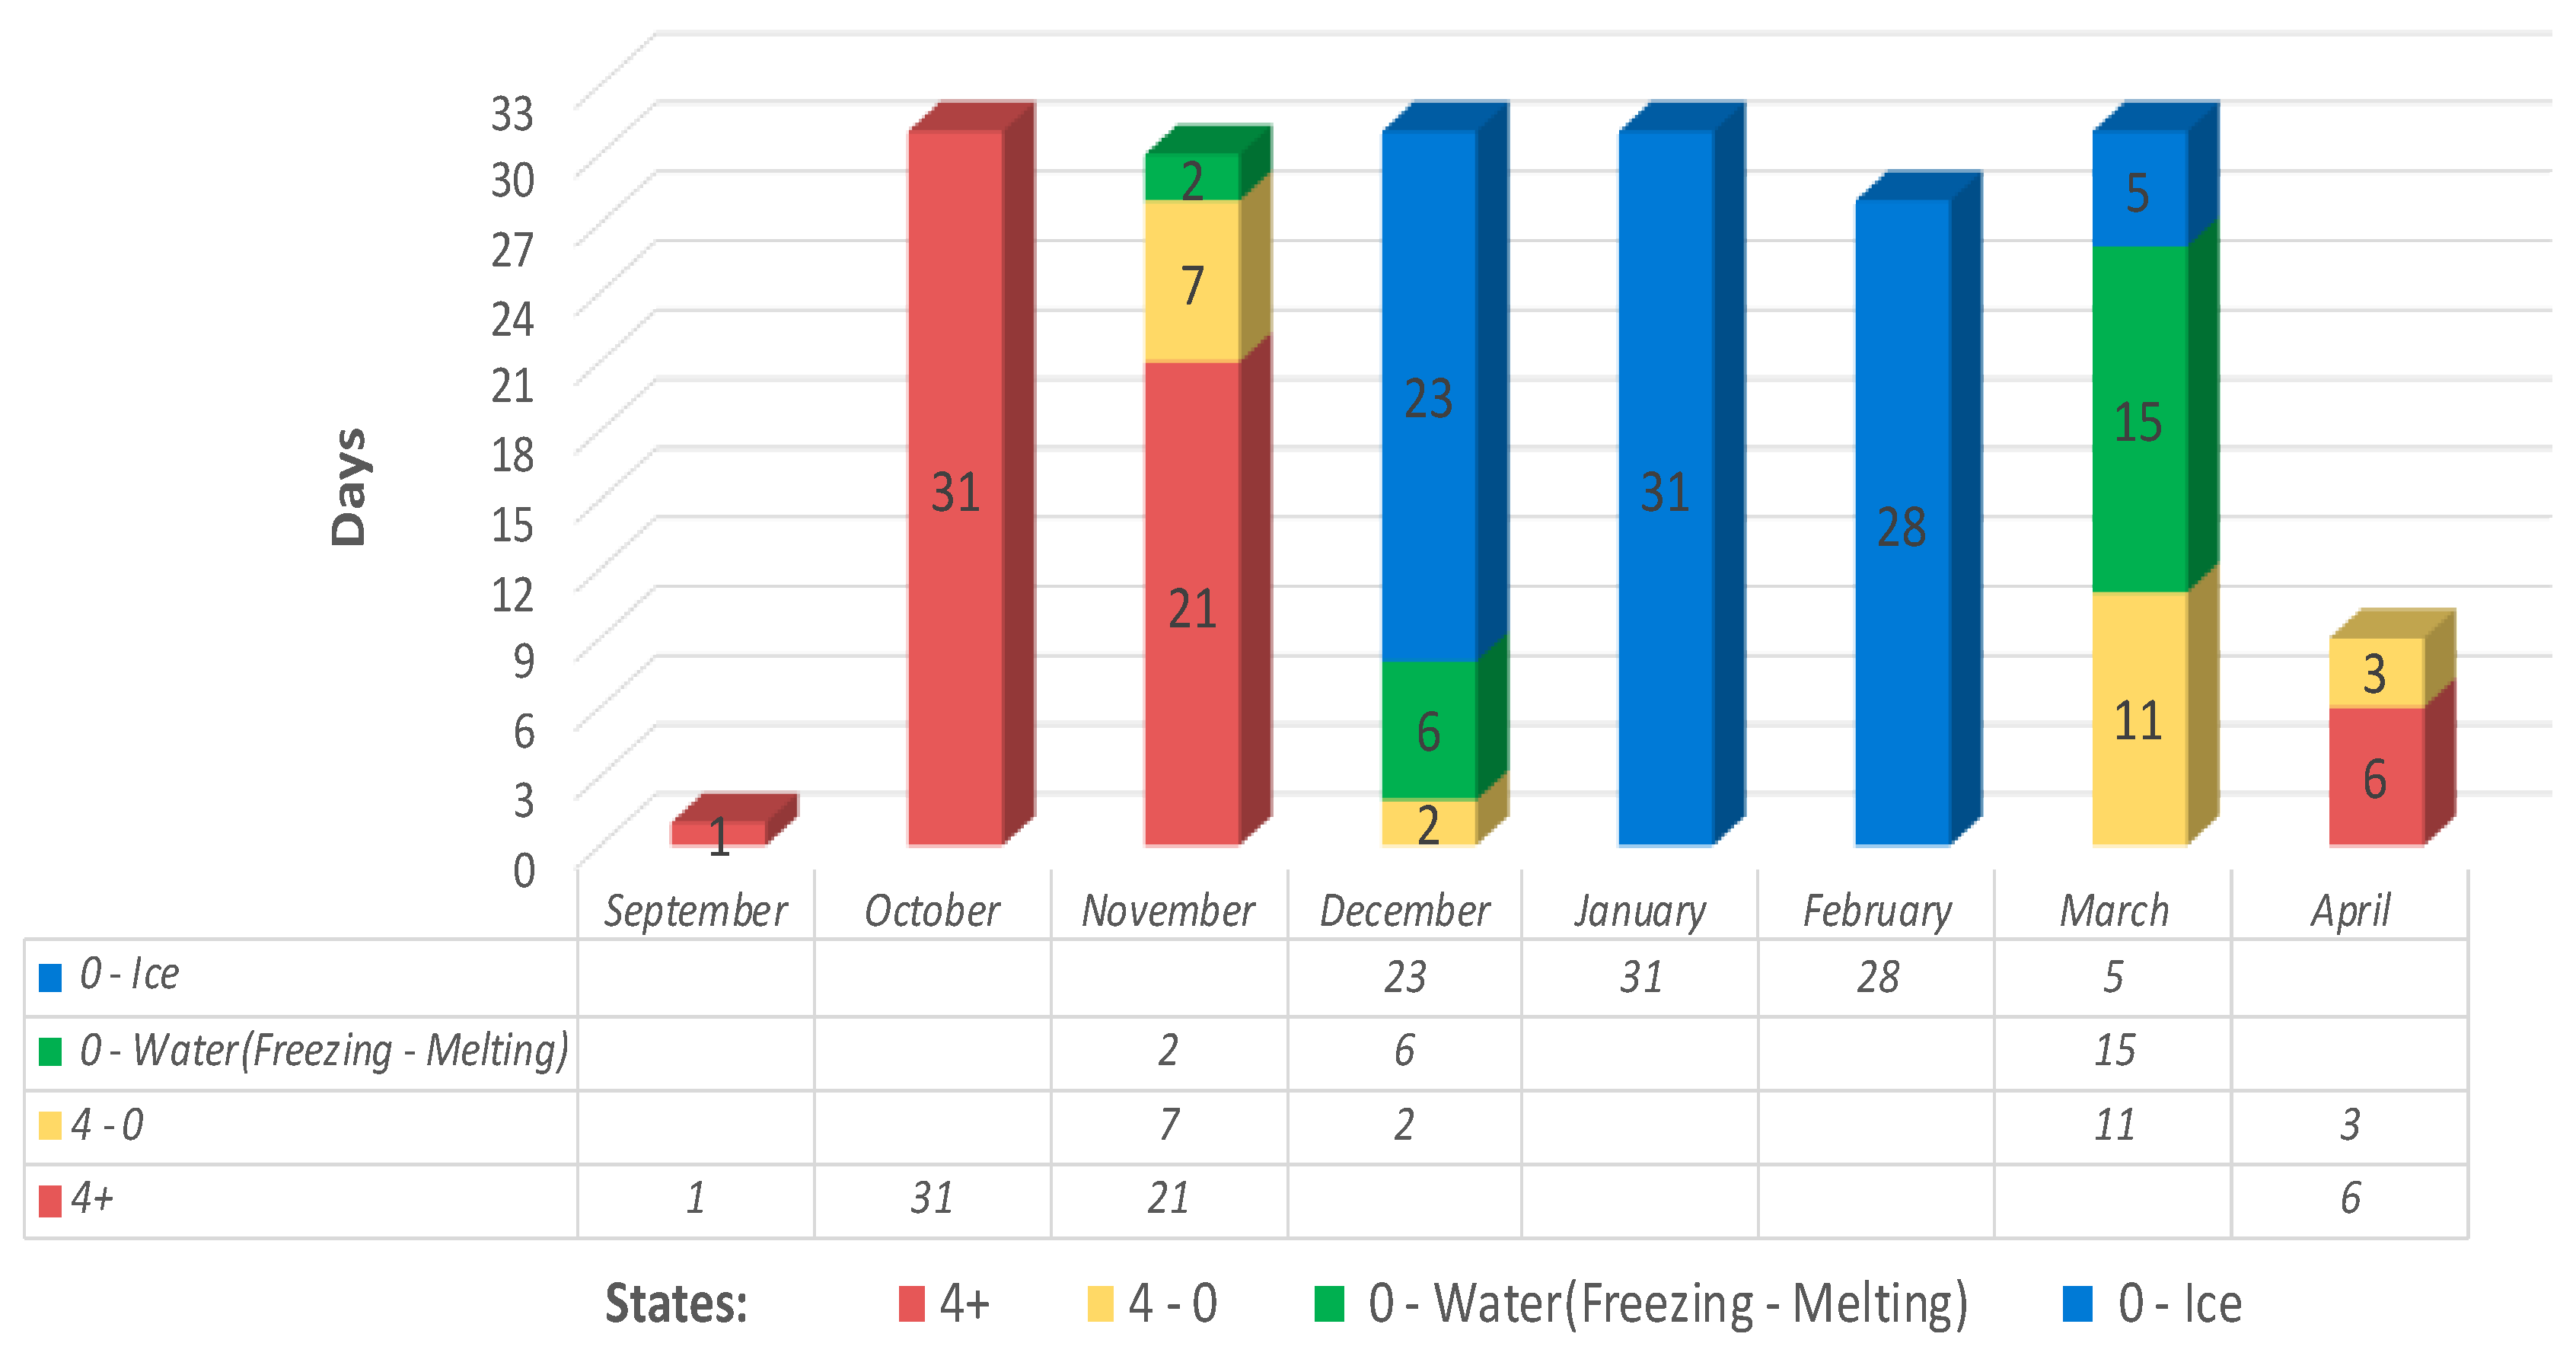
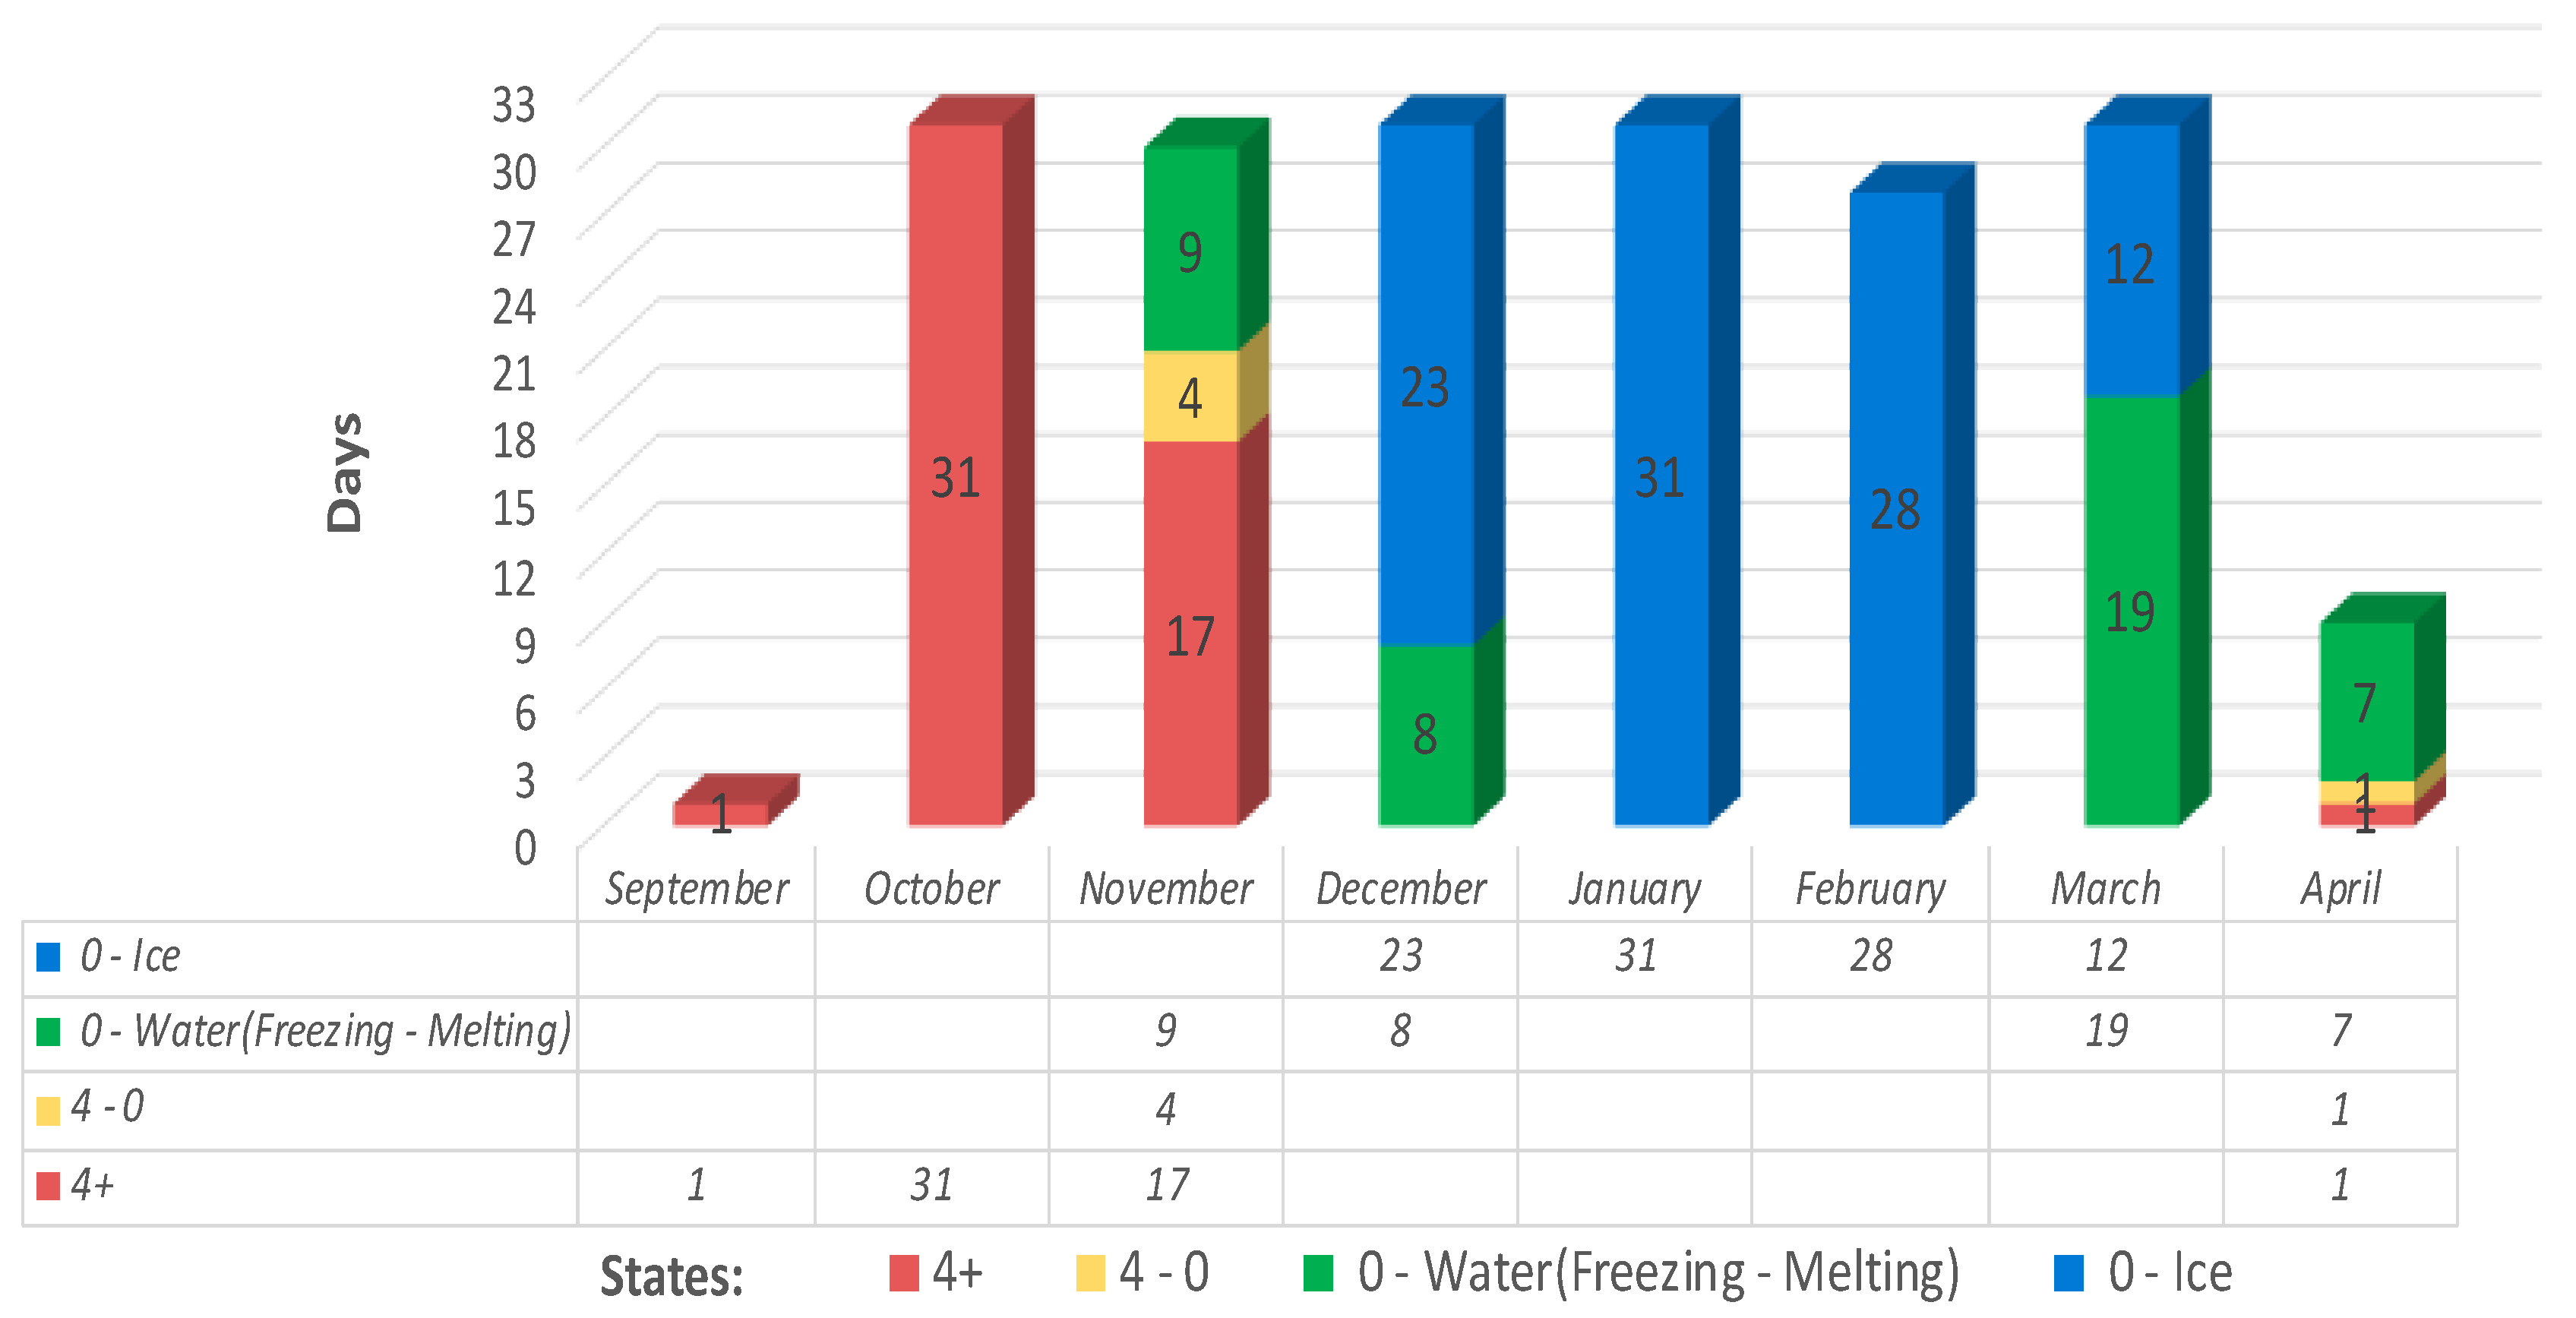
3.3. Ice Storage States
The tank has been divided into 3 positions based on sensors and as we can see, the results are not uniform. The tank states and their time depends on the position. Individual states are shown in
Figure 12,
Figure 13 and
Figure 14. We can say that most often there was ice in the tank. The second most common condition was 4+ when the water was in a normal stratification state.
3.3.1. Down Position t1:
Ice storage states in down position are shown in
Figure 12.
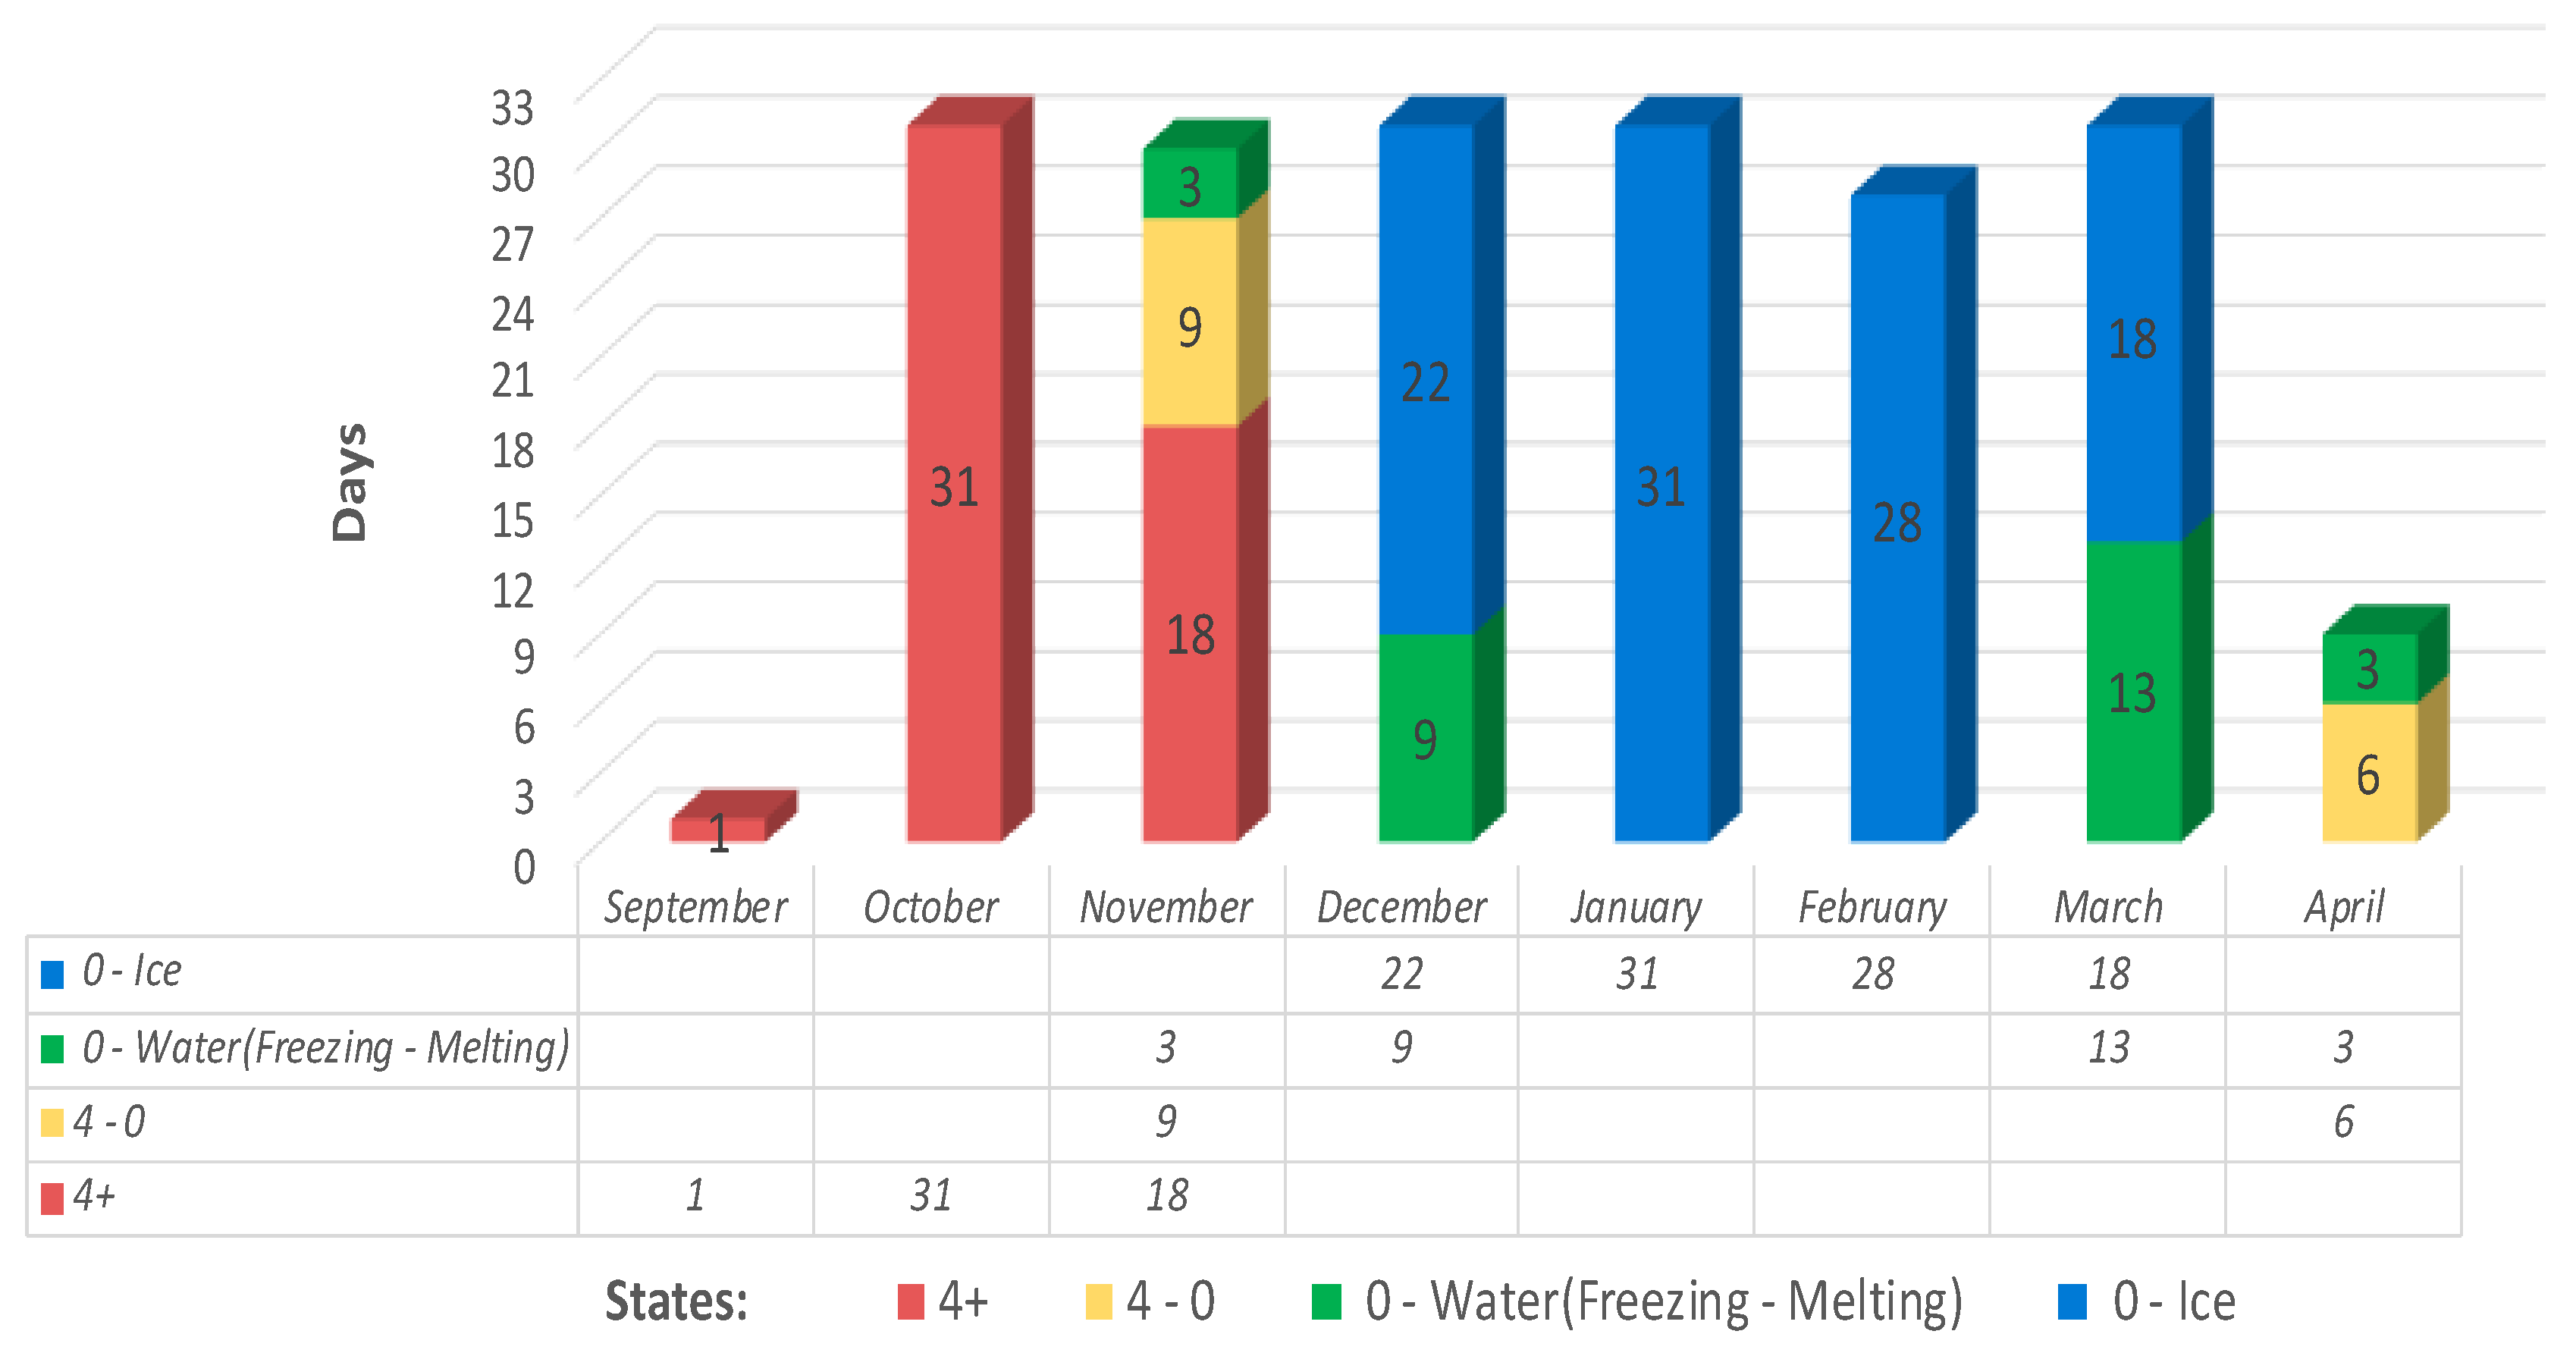
3.3.2. Middle Position t2:
Ice storage states in middle position are shown in
Figure 13.
3.3.3. Upper Position t3:
Ice storage states in upper position are shown in
Figure 14.
According to
Figure 12,
Figure 13 and
Figure 14, the upper position—t3 temperature first began to freeze. The second was t2 temperature in the middle position and the last was the t1 in the down position.
The melting process shows the opposite results. The first one melted was the t1—down position. The second was the middle position t2 and finally the last was the up position t3.
It is interesting that the water behaves in the opposite way that would we expect in common fluids. In the same way, these graphs in
Figure 12,
Figure 13 and
Figure 14 show that our assumption of phase separation based on water properties was correct.
3.4. Overall View of Temperatures
The graphical output of all analyzed temperatures from the whole research period is shown in
Figure 15.
Together we examine 5 temperatures from the temperature sensors of the combined heating system. We can see how temperatures dropped down depending on the season and vice versa, their increment in warmer months. The temperature also affects the heat pumps efficiency and its operating states. Based on
Figure 15, we can see that the temperature of ice storage depends on the HDP temperature and the HDP temperature at the same way depends on the outside temperature.
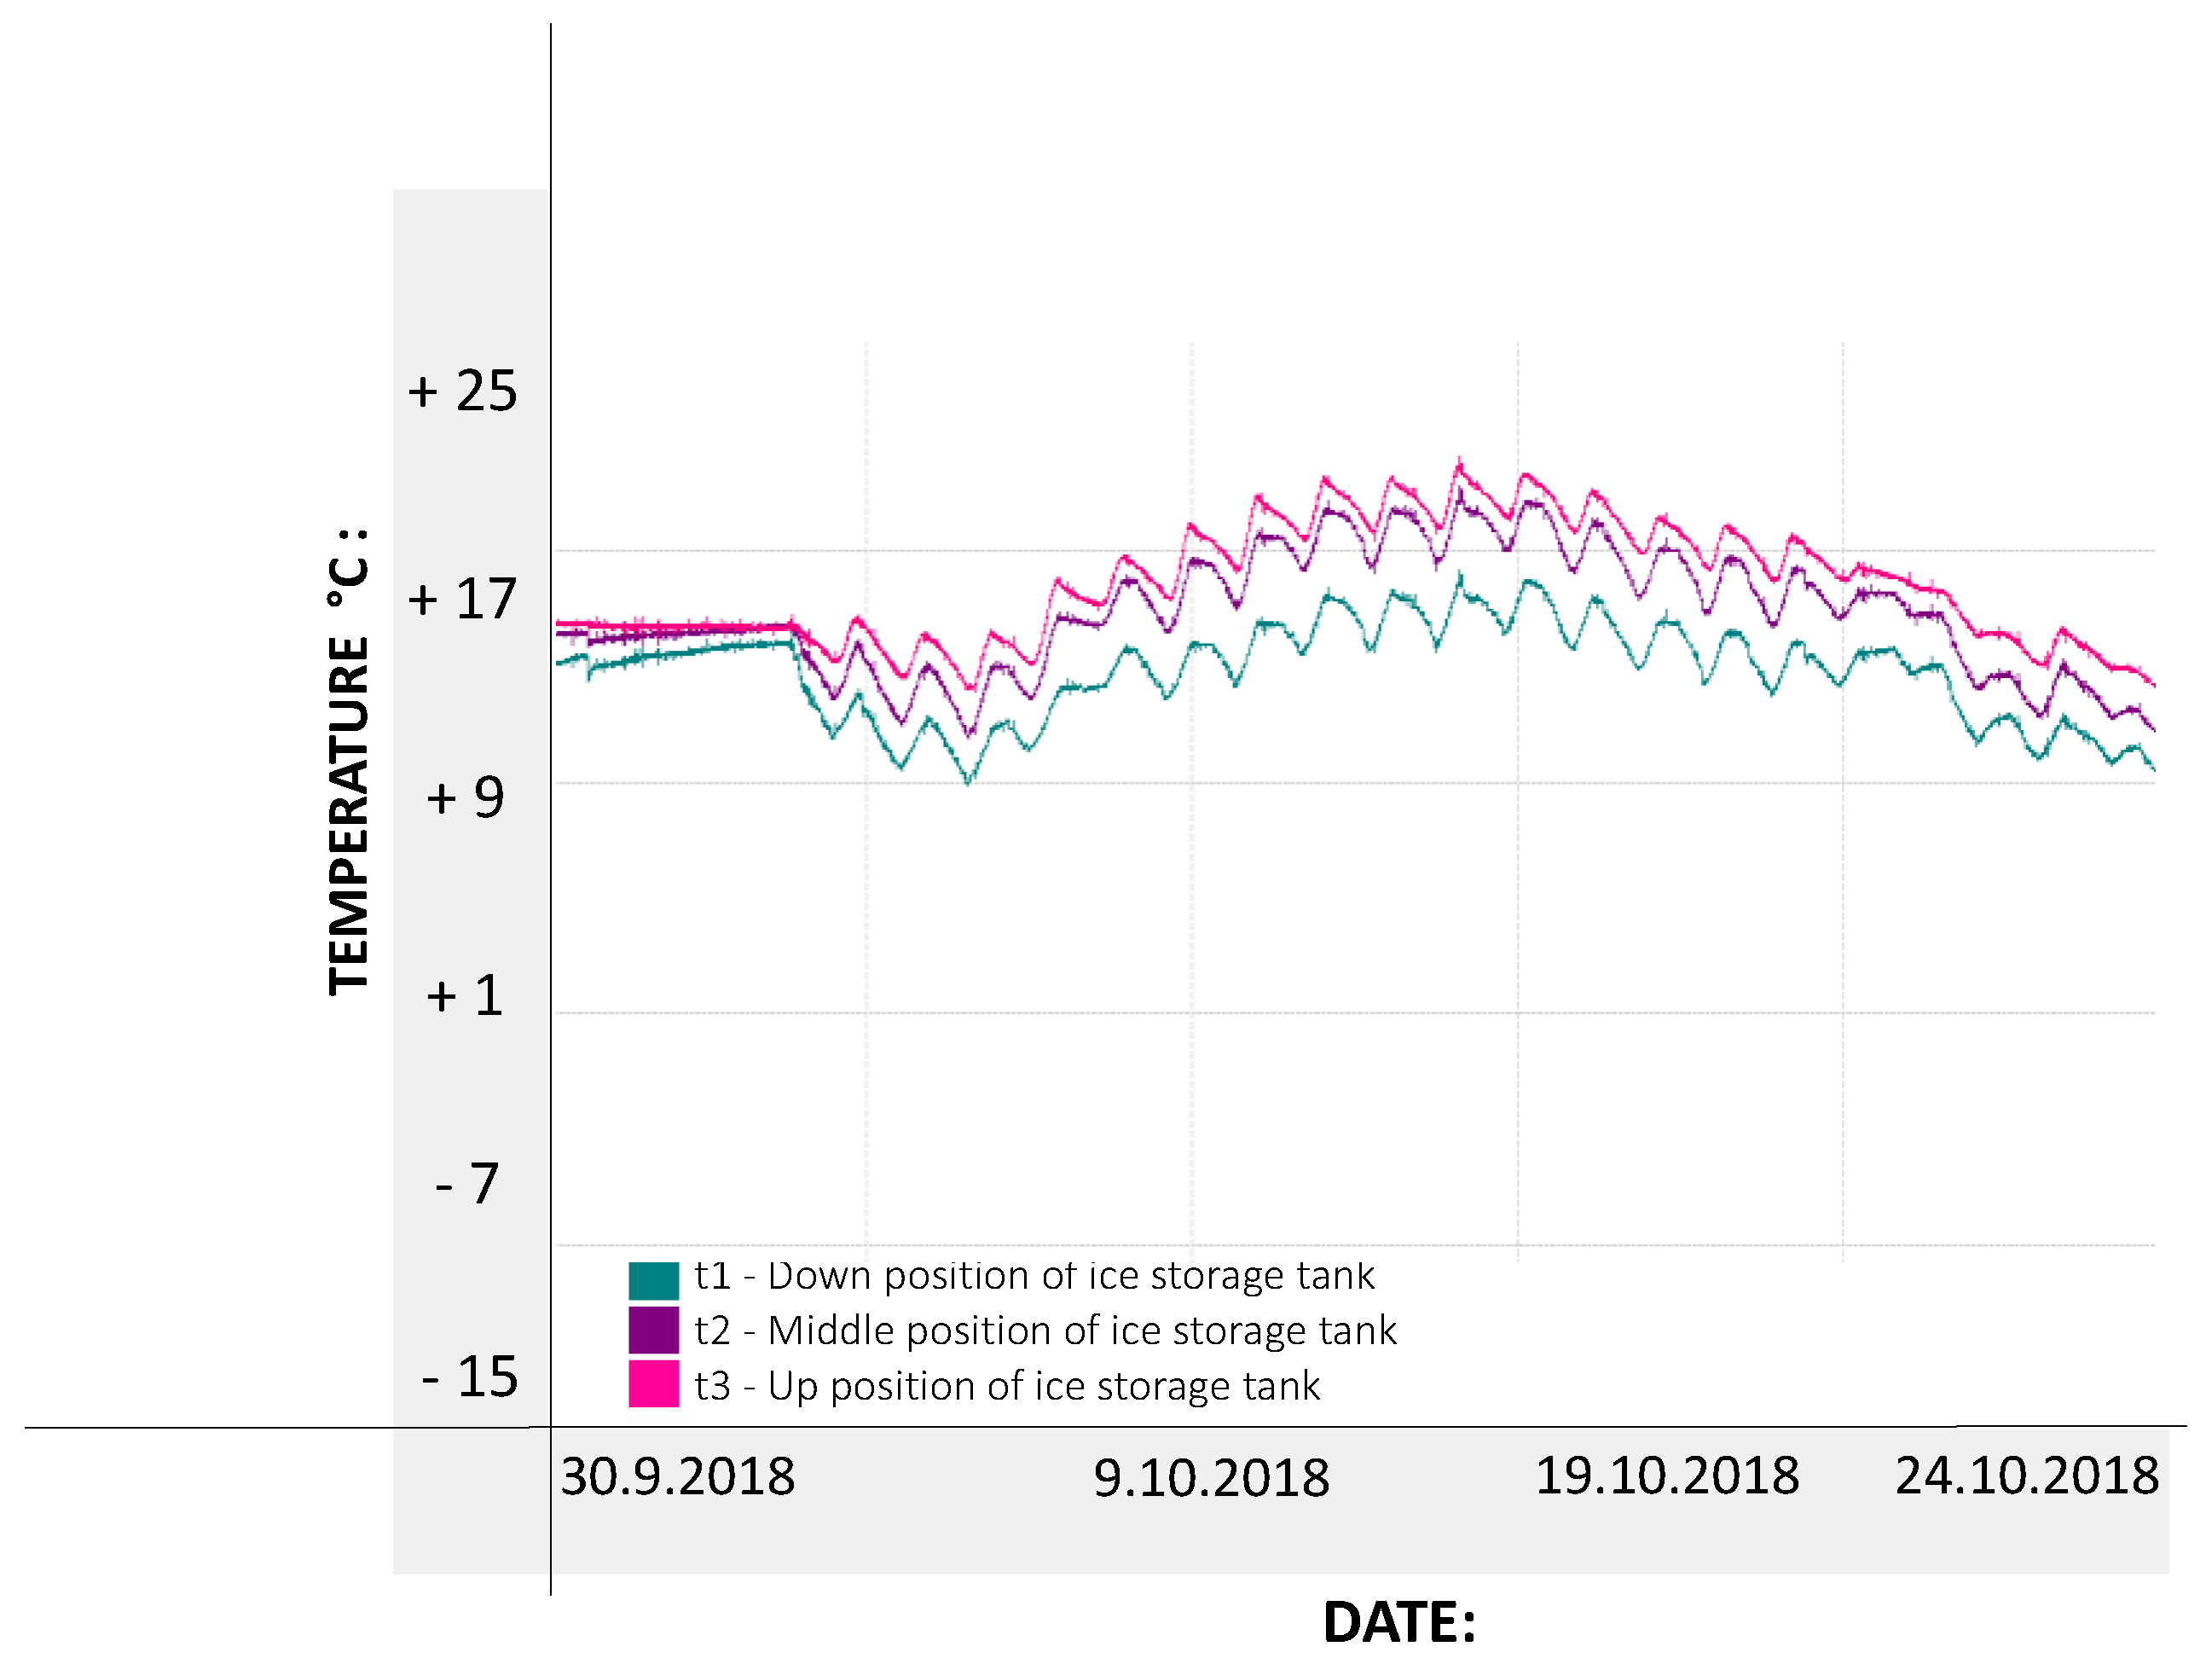
3.4.1. First Phase—Normal Water Stratification
Figure 16 shows the first phase of the ice storage tank.
This phase in normal water stratification behaves like any other conventional fluid. The fluctuations shown in
Figure 16 are typical for charging and using the ice storage during days and nights when it behaves as the primary thermal energy source.
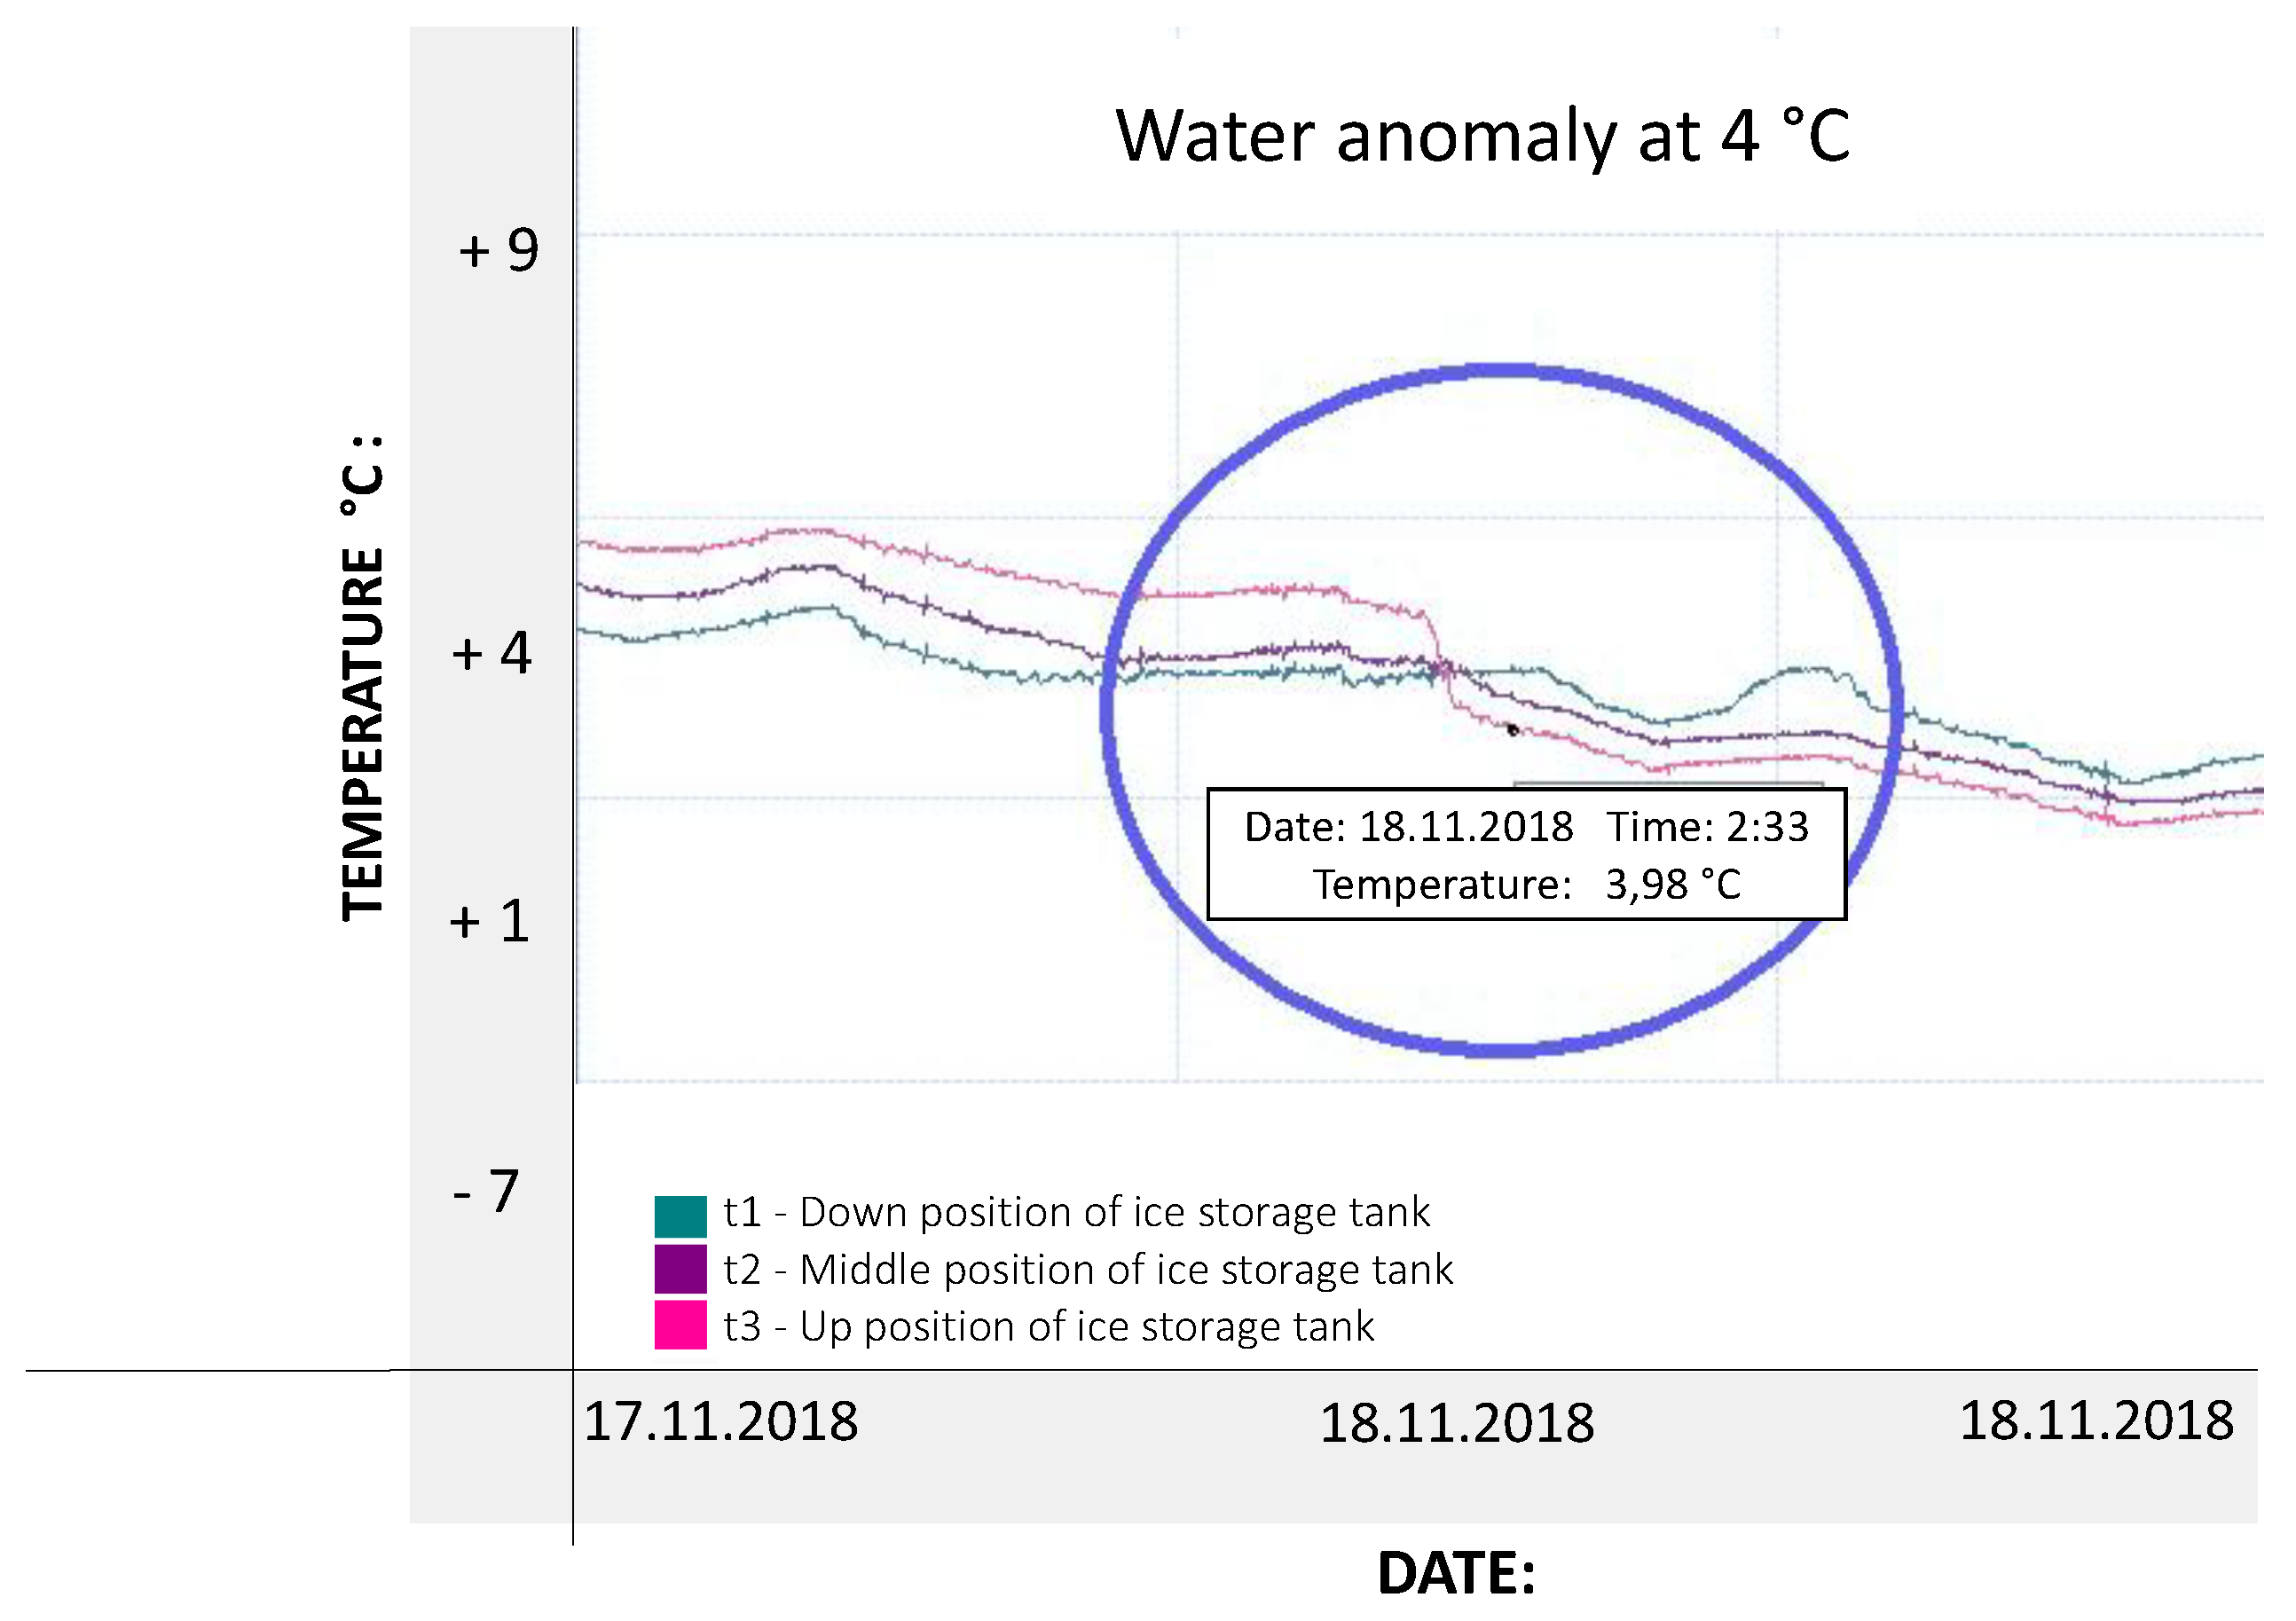
3.4.2. Second Phase—Inverse Water Stratification (Water Anomaly)
The graph in
Figure 17 shows an anomaly caused by the properties of the water, indicated in the blue circle.
As soon as the water temperature reaches 4 °C (more accurate, it is 3.98 °C), the water starts to behave oppositely than would we expect in common fluids. This phenomenon is caused by the changing of water density. Based on the graph, we can see that the lines turned in the opposite direction. From this point, the warmer water stays located at the bottom. This anomaly is very important not just for our analysis but also for everyday life. The fact that water starts to freeze on the top, and the bottom is still liquid and warm, is, for example, vital for the aquatic animals in nature. Without this anomaly, aquatic animals would not be able to survive in water.
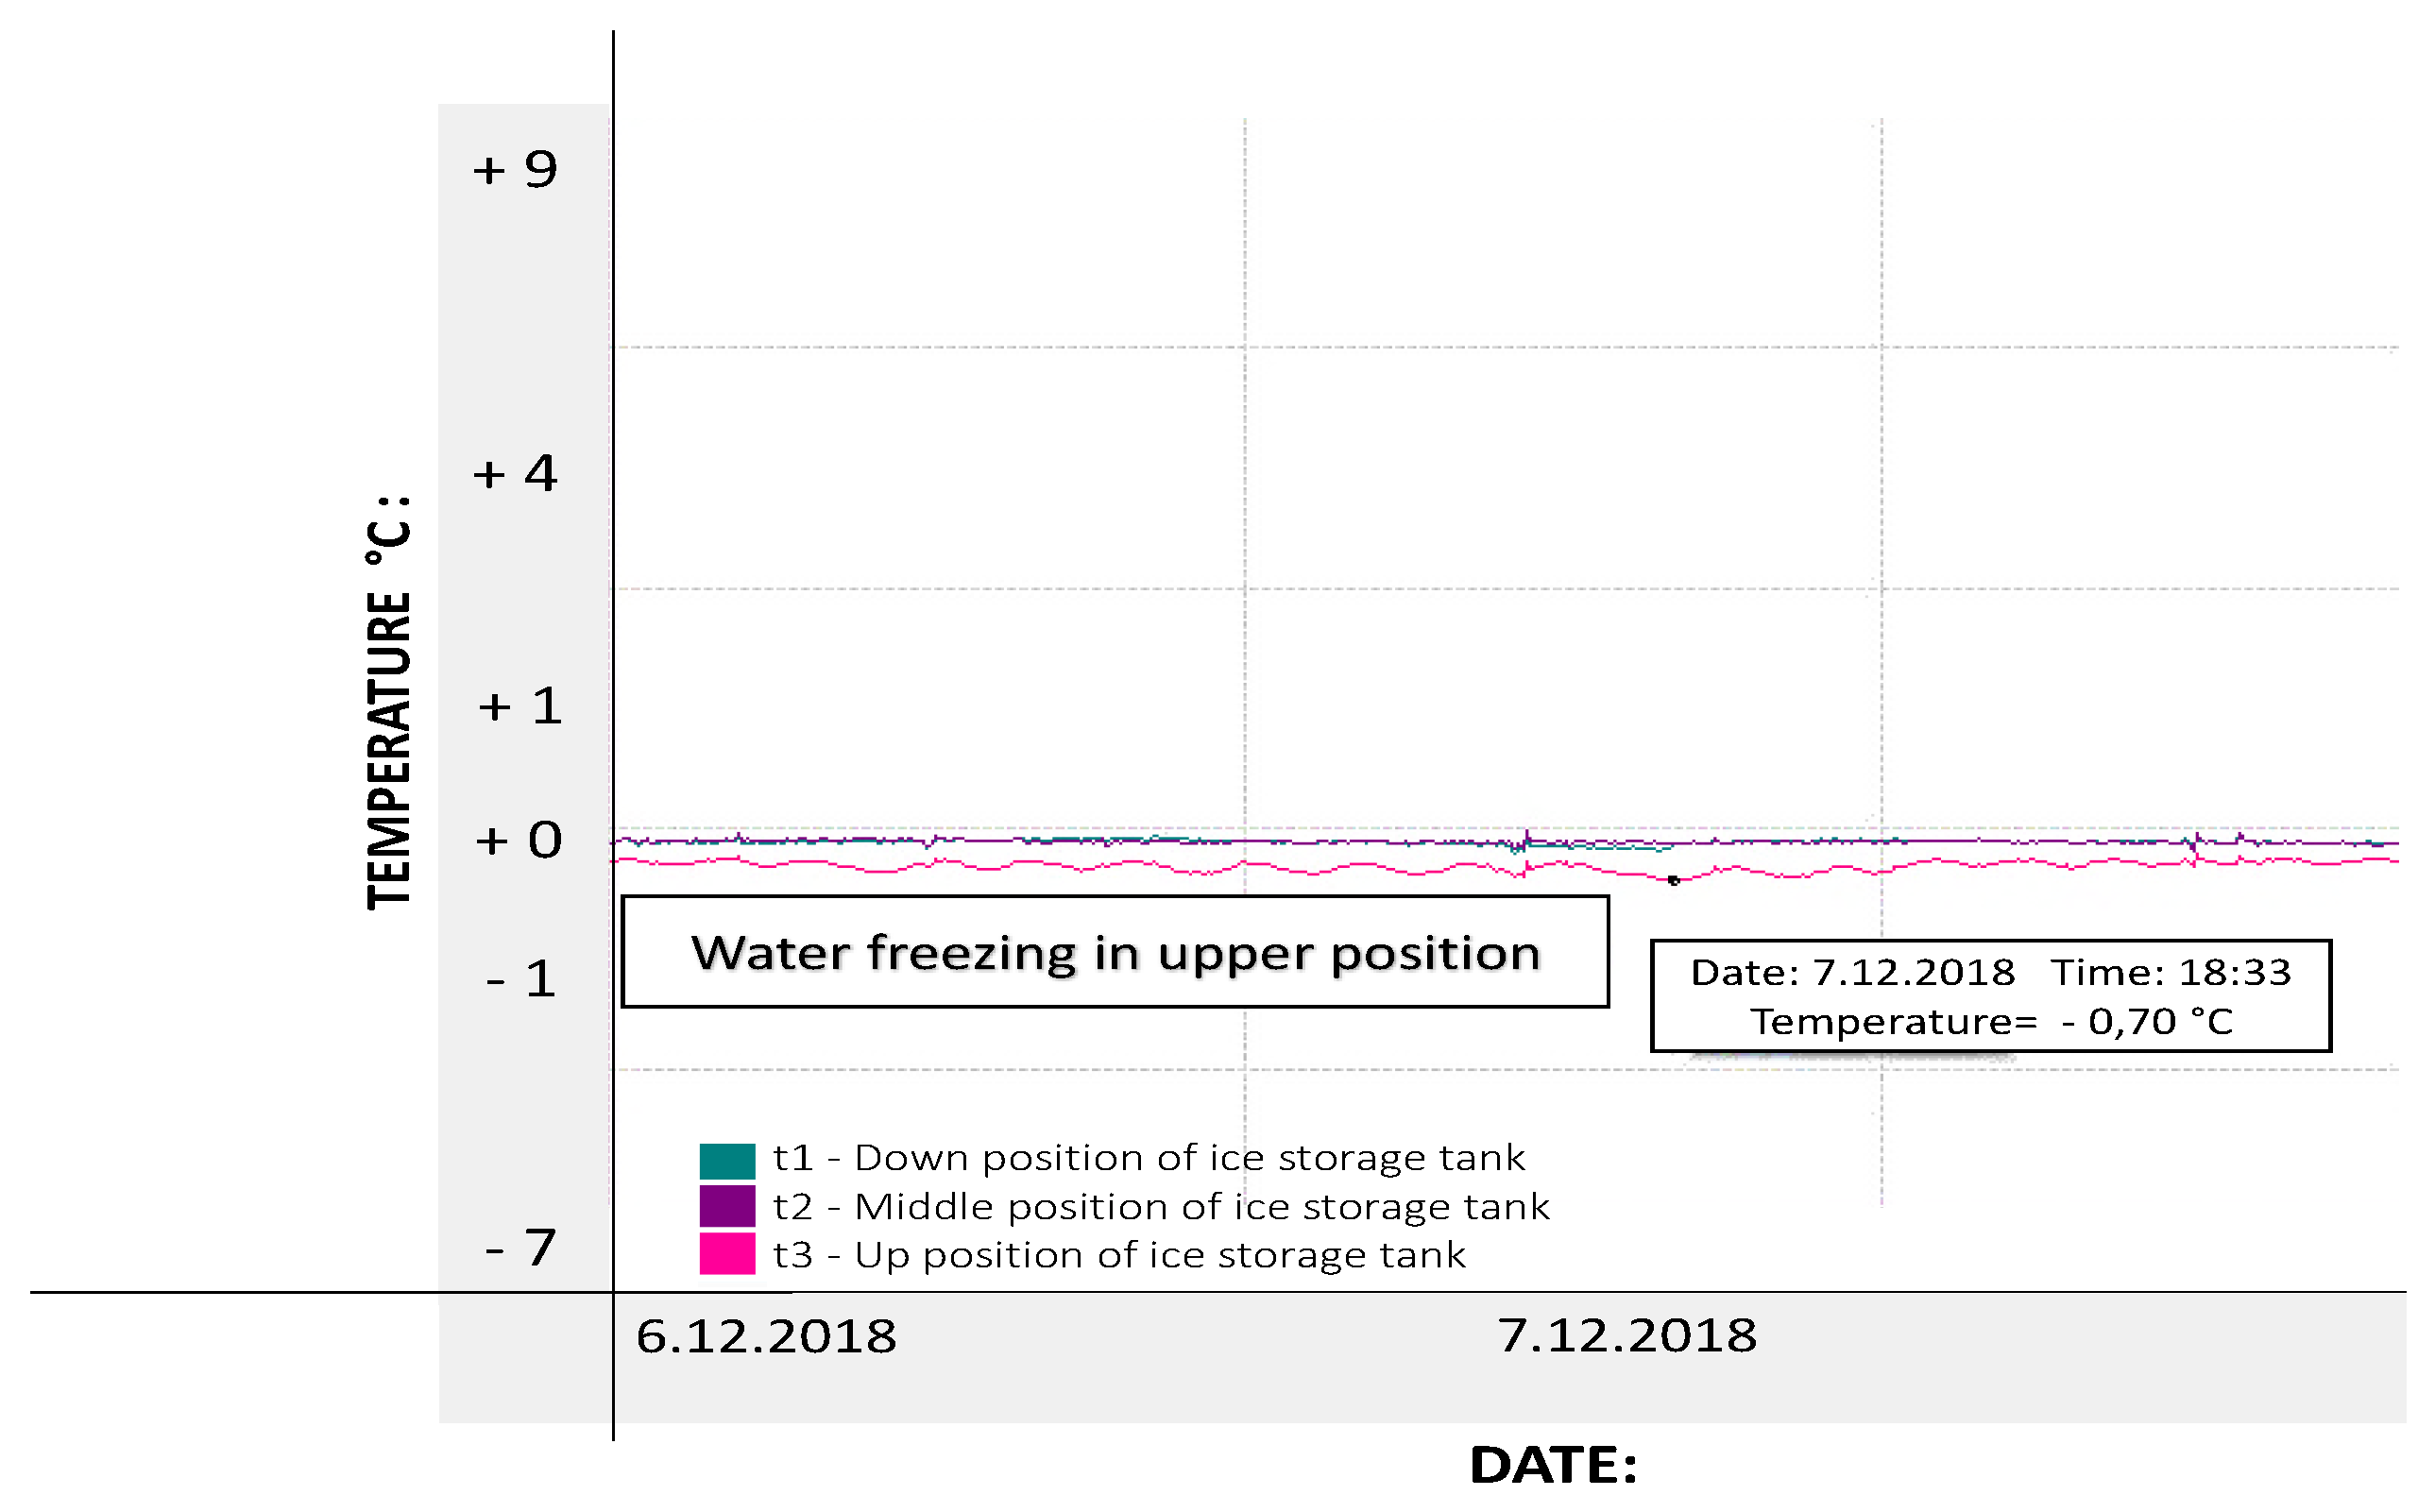
3.4.3. Third Phase—Freezing in Upper Position
The graph in
Figure 18 show freezing in the upper position t3.
From 7 December 2018, shows the freezing at the t3 position (the lowest red line), indicating with a minus temperature. This is the most important phase for our research. This phase is releasing the energy which is better known as the latent heat with value 334 kJ/kg. If we think about the volume 10 m3 (10,000 L water) in the ice storage tank, we can say that is a huge amount of energy-releasing. If we would take into account that 1 L of water equals approximately 1 kg in our computation, then approximately 3,340,000 kJ will be released.
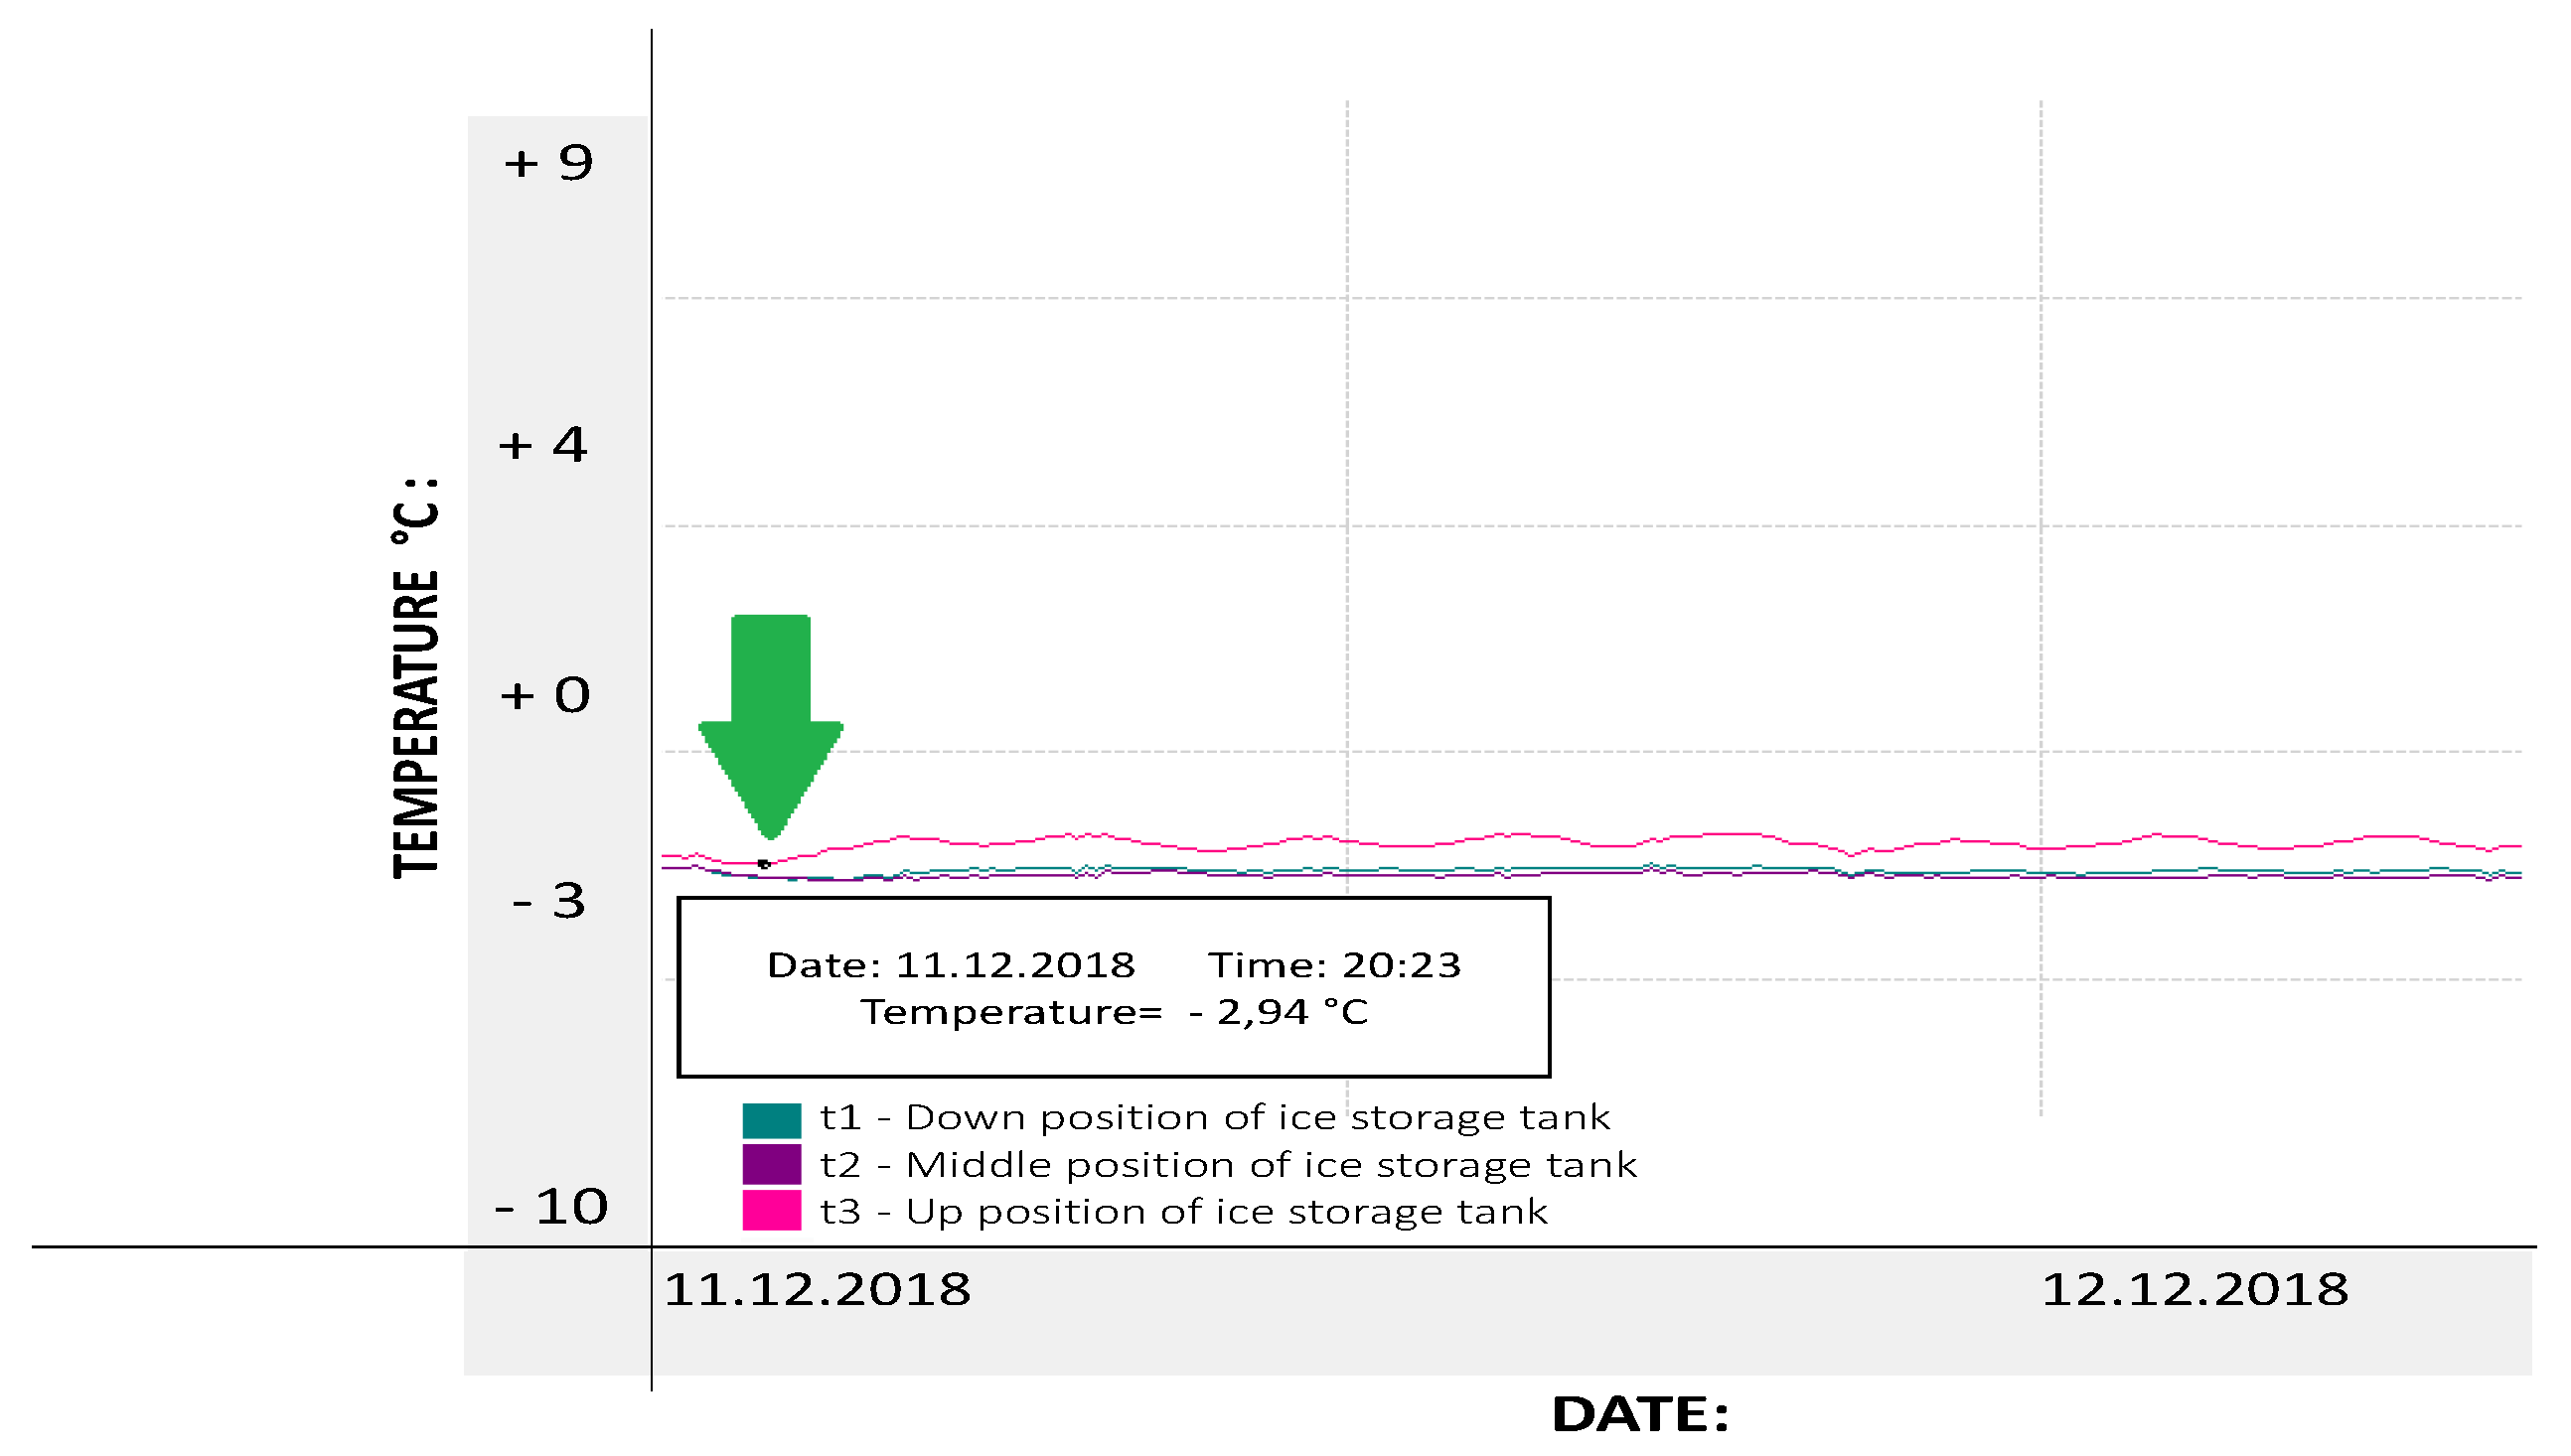
3.4.4. Fourth Phase: Solid-State
The temperatures t1–t3 dropped below freezing. Temperature t3 in the up position showed the highest temperature of approximately−2.94 °C from 11 December 2018. Based on results, it is clear that the tank has since this date entered the solid state (ice). Moreover, there are some other changes. The specific heat capacity of the working substance is now lower. The specific heat capacity of ice is approximately 2.1 kJ/kg, which is half compared to water 4.2 kJ/kg. The transfer of thermal energy has also changed from flowing to conduction.
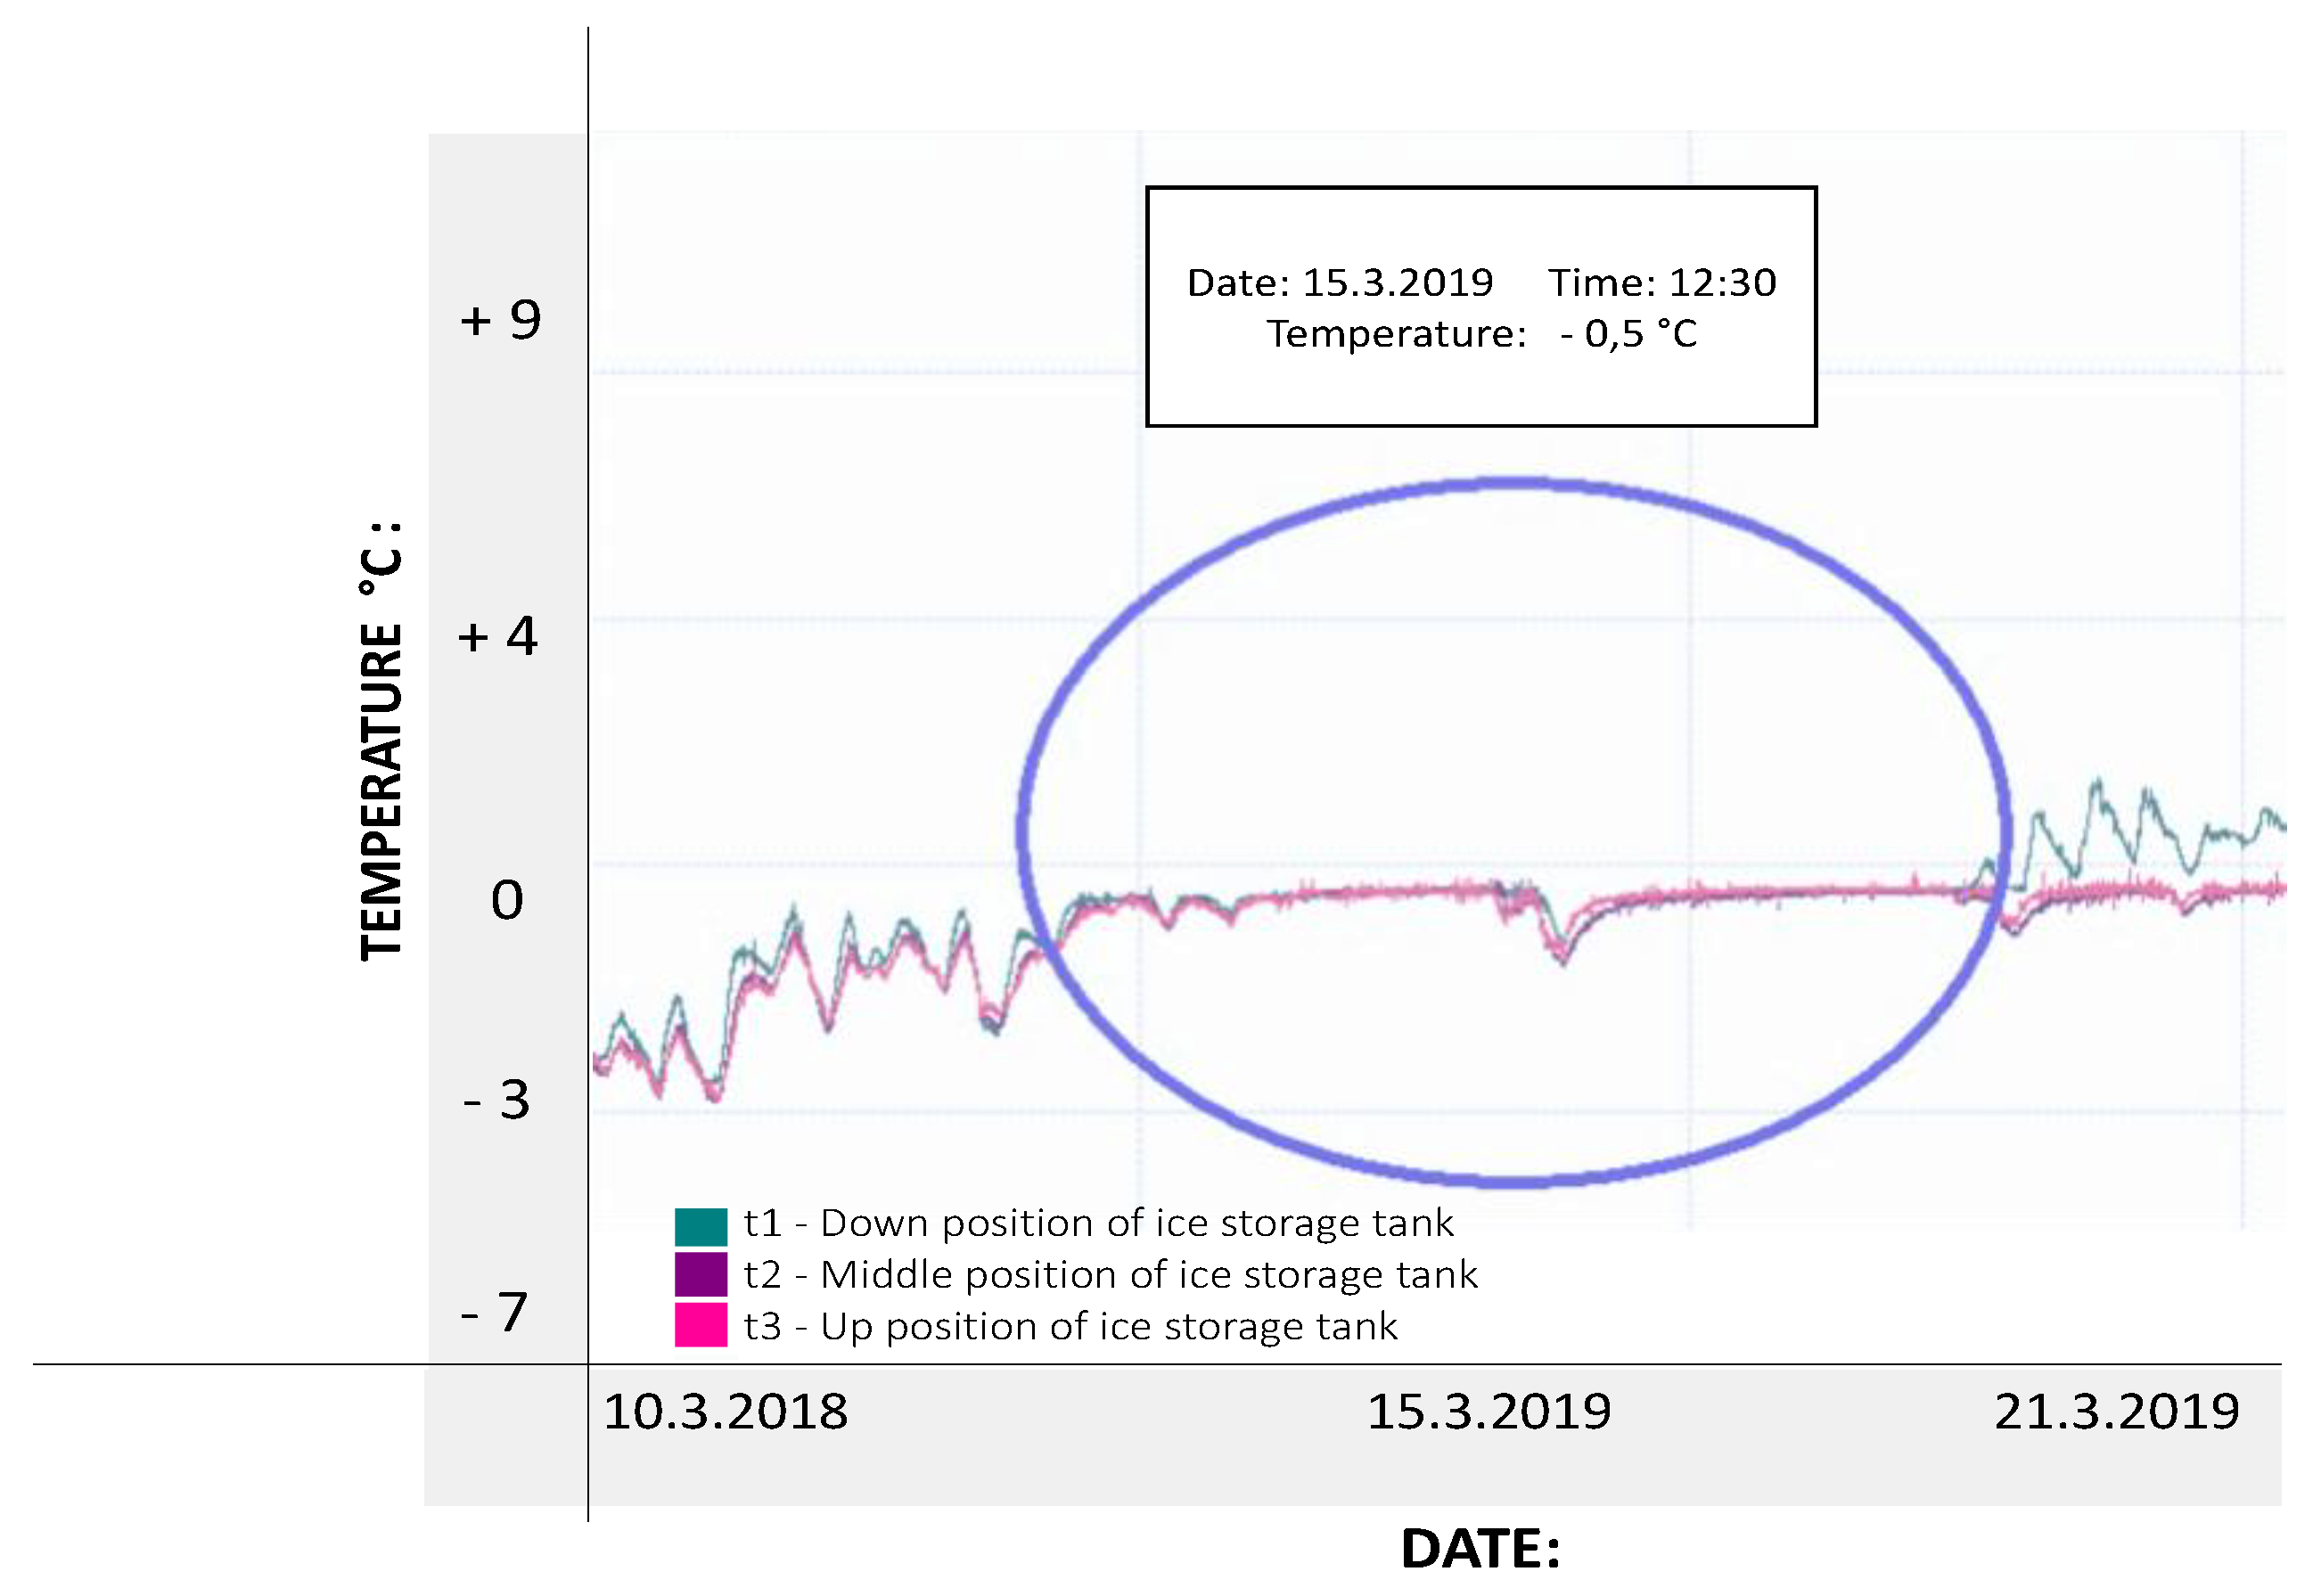
3.4.5. Third Phase—Melting Process
Figure 20 represents the long-term graph of the melting process in the solid phase of the tank. During this phase, one interesting moment occurred, when the temperatures drop down so rapidly, the melting process stopped for a short time and began to freeze back (indicated in the circle).
This phase is a little bit complicated compared to freezing because the ice inside the tank now must receive latent heat for melting.
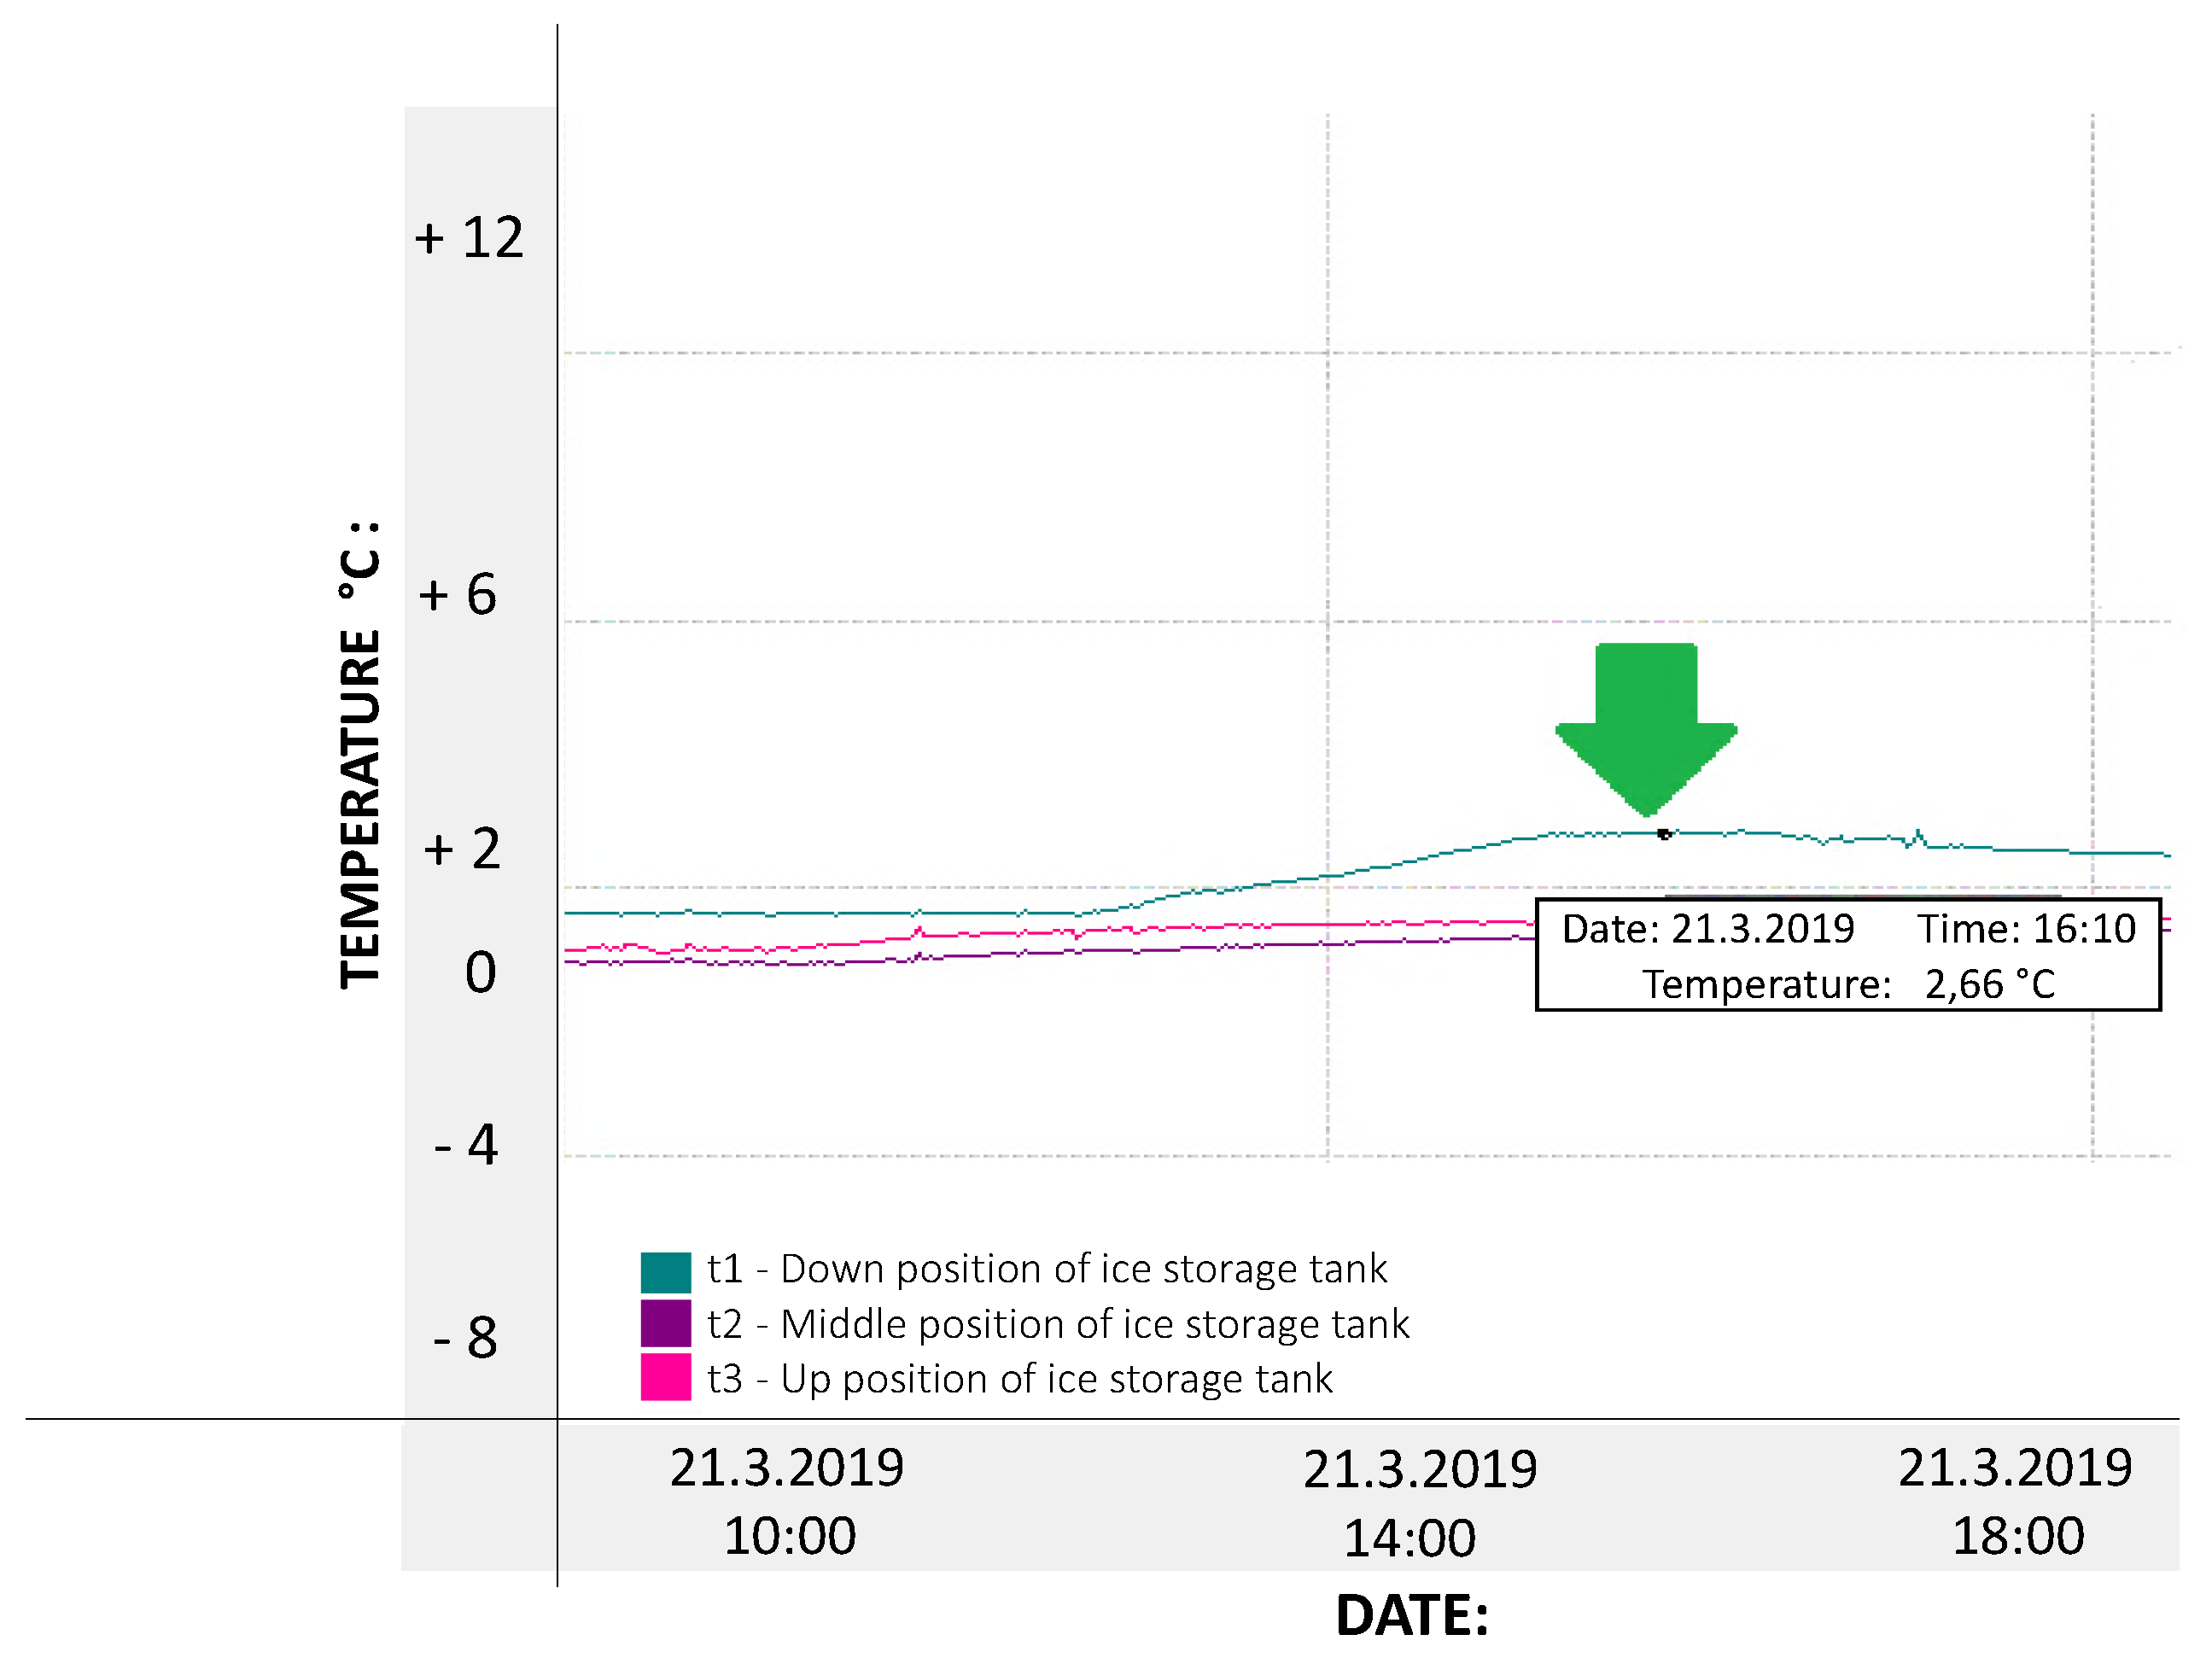
3.4.6. Third Phase—Melting in Down (t1) Position
The graph in
Figure 21 describes the first ice melting of temperature t1 in the down position. The melting occurred on March 21st, 2019 at approximately 16:10 and showed a temperature t1 of approximately 2.6 °C, and the ice turned to water. The ice melted first in the down position, which we also assumed based on the water’s properties, as the temperature during melting should have the highest temperature in the down position.
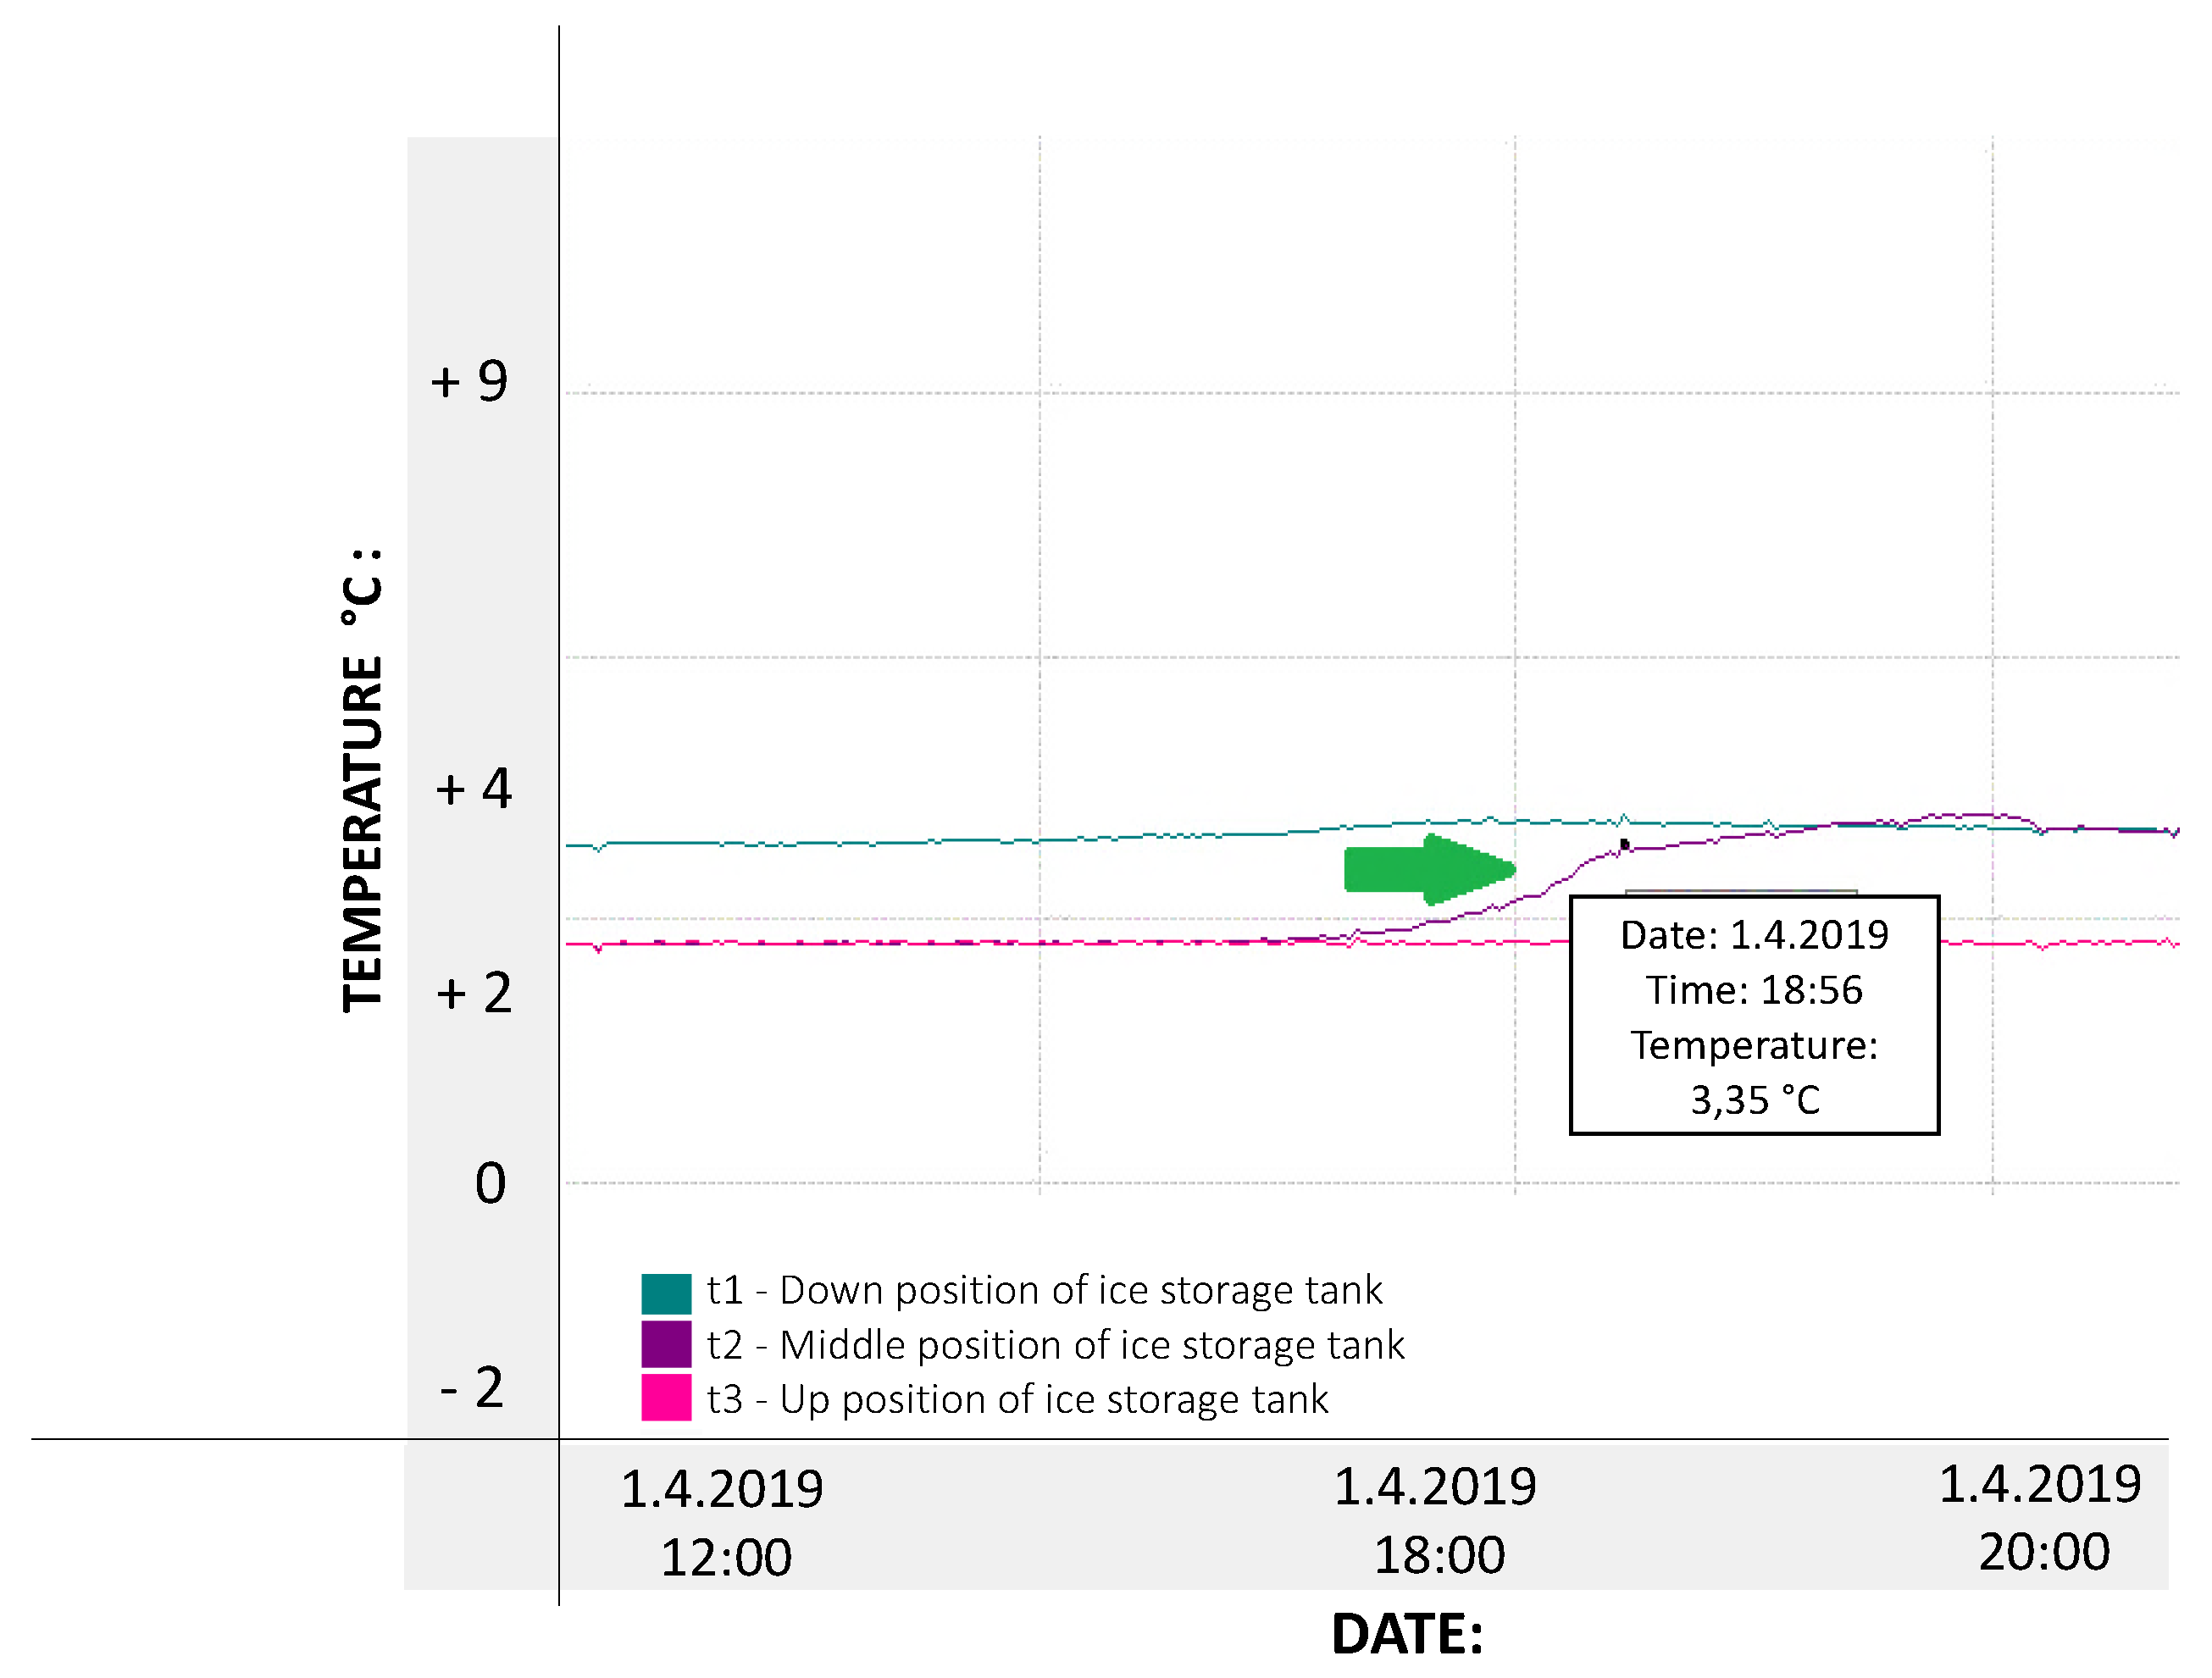
3.4.7. Third Phase—Melting in Middle (t2) Position
Melting in the middle position—t2 occurred in
Figure 22, on 1 April 2019.
3.4.8. Third Phase—Melting in Upper (t3) Position
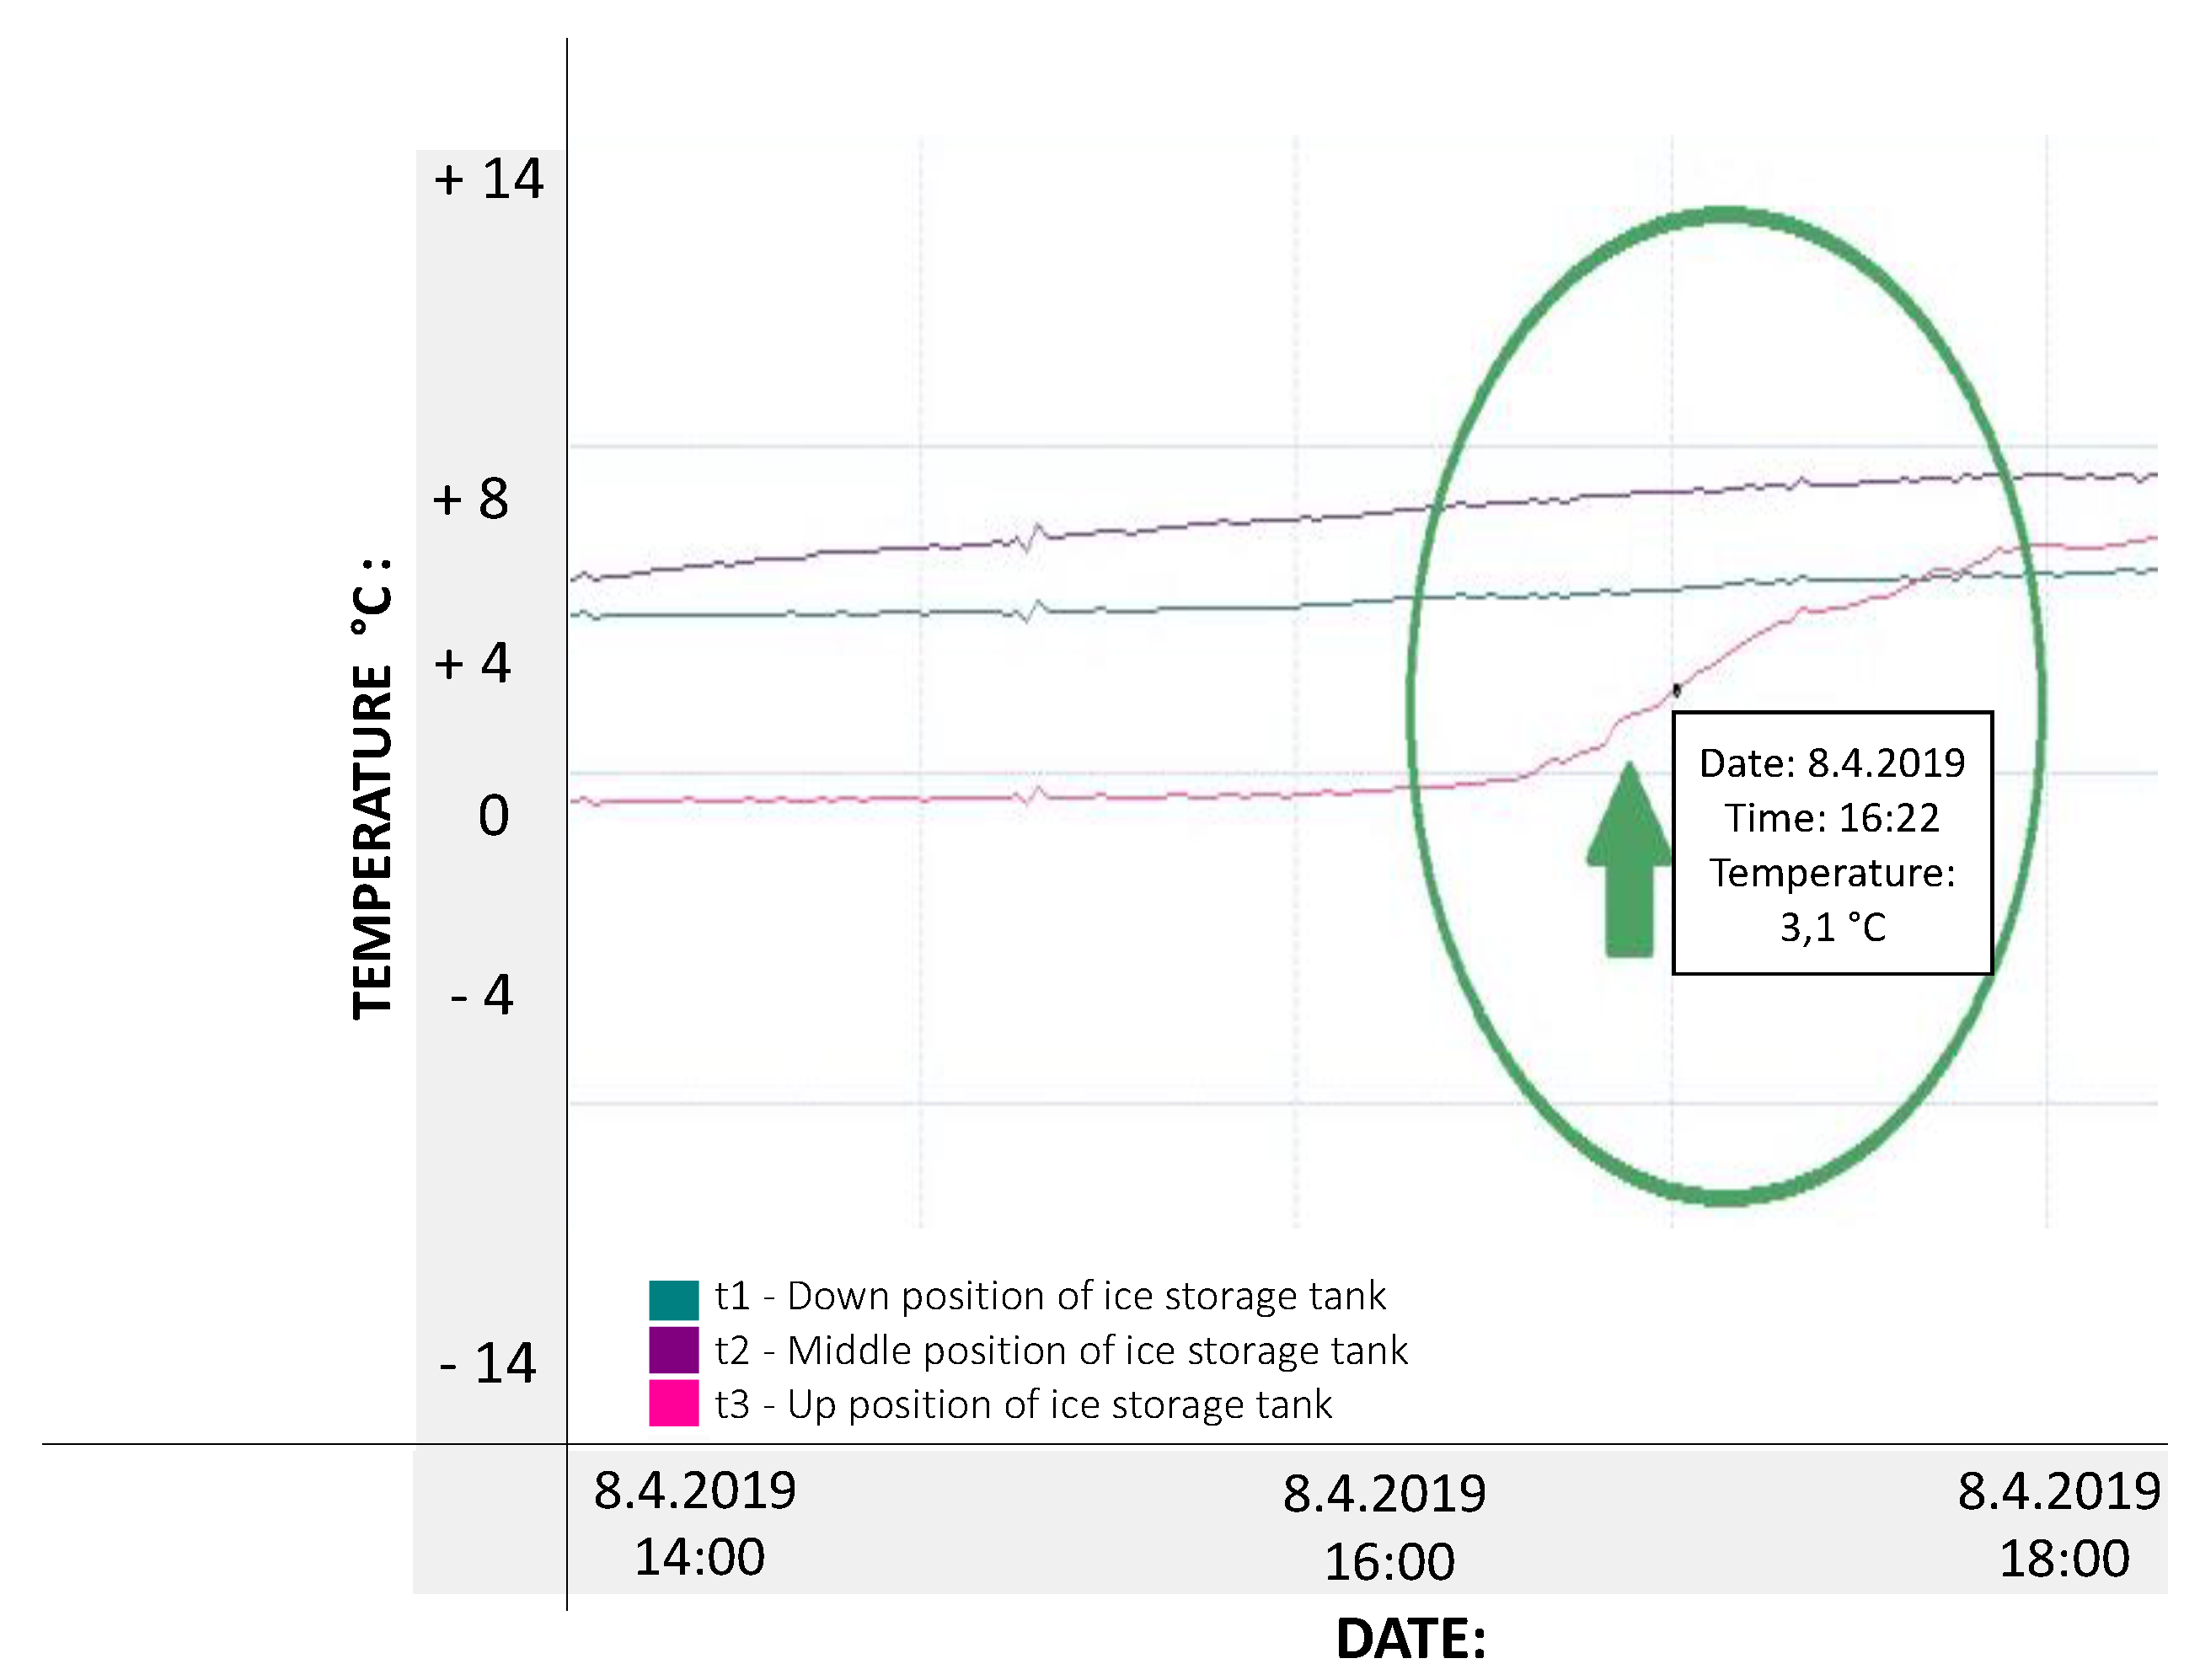
On 8 April 2019, melting of the ice in the last up position occurred—t3 which is graphically shown in
Figure 23 (the green circle). From 8 April 2019, the ice melted to water and the entire tank went back into the first phase 4+. As we can see in
Figure 23, the temperature rising is so fast, that we jumped from 3rd phases back to the 1st phase in a very short time. Temperatures from that time showed positive temperatures and the ice storage tank was back in a normal stratification state.
3.4.9. First Phase—Normal Water Stratification 4+
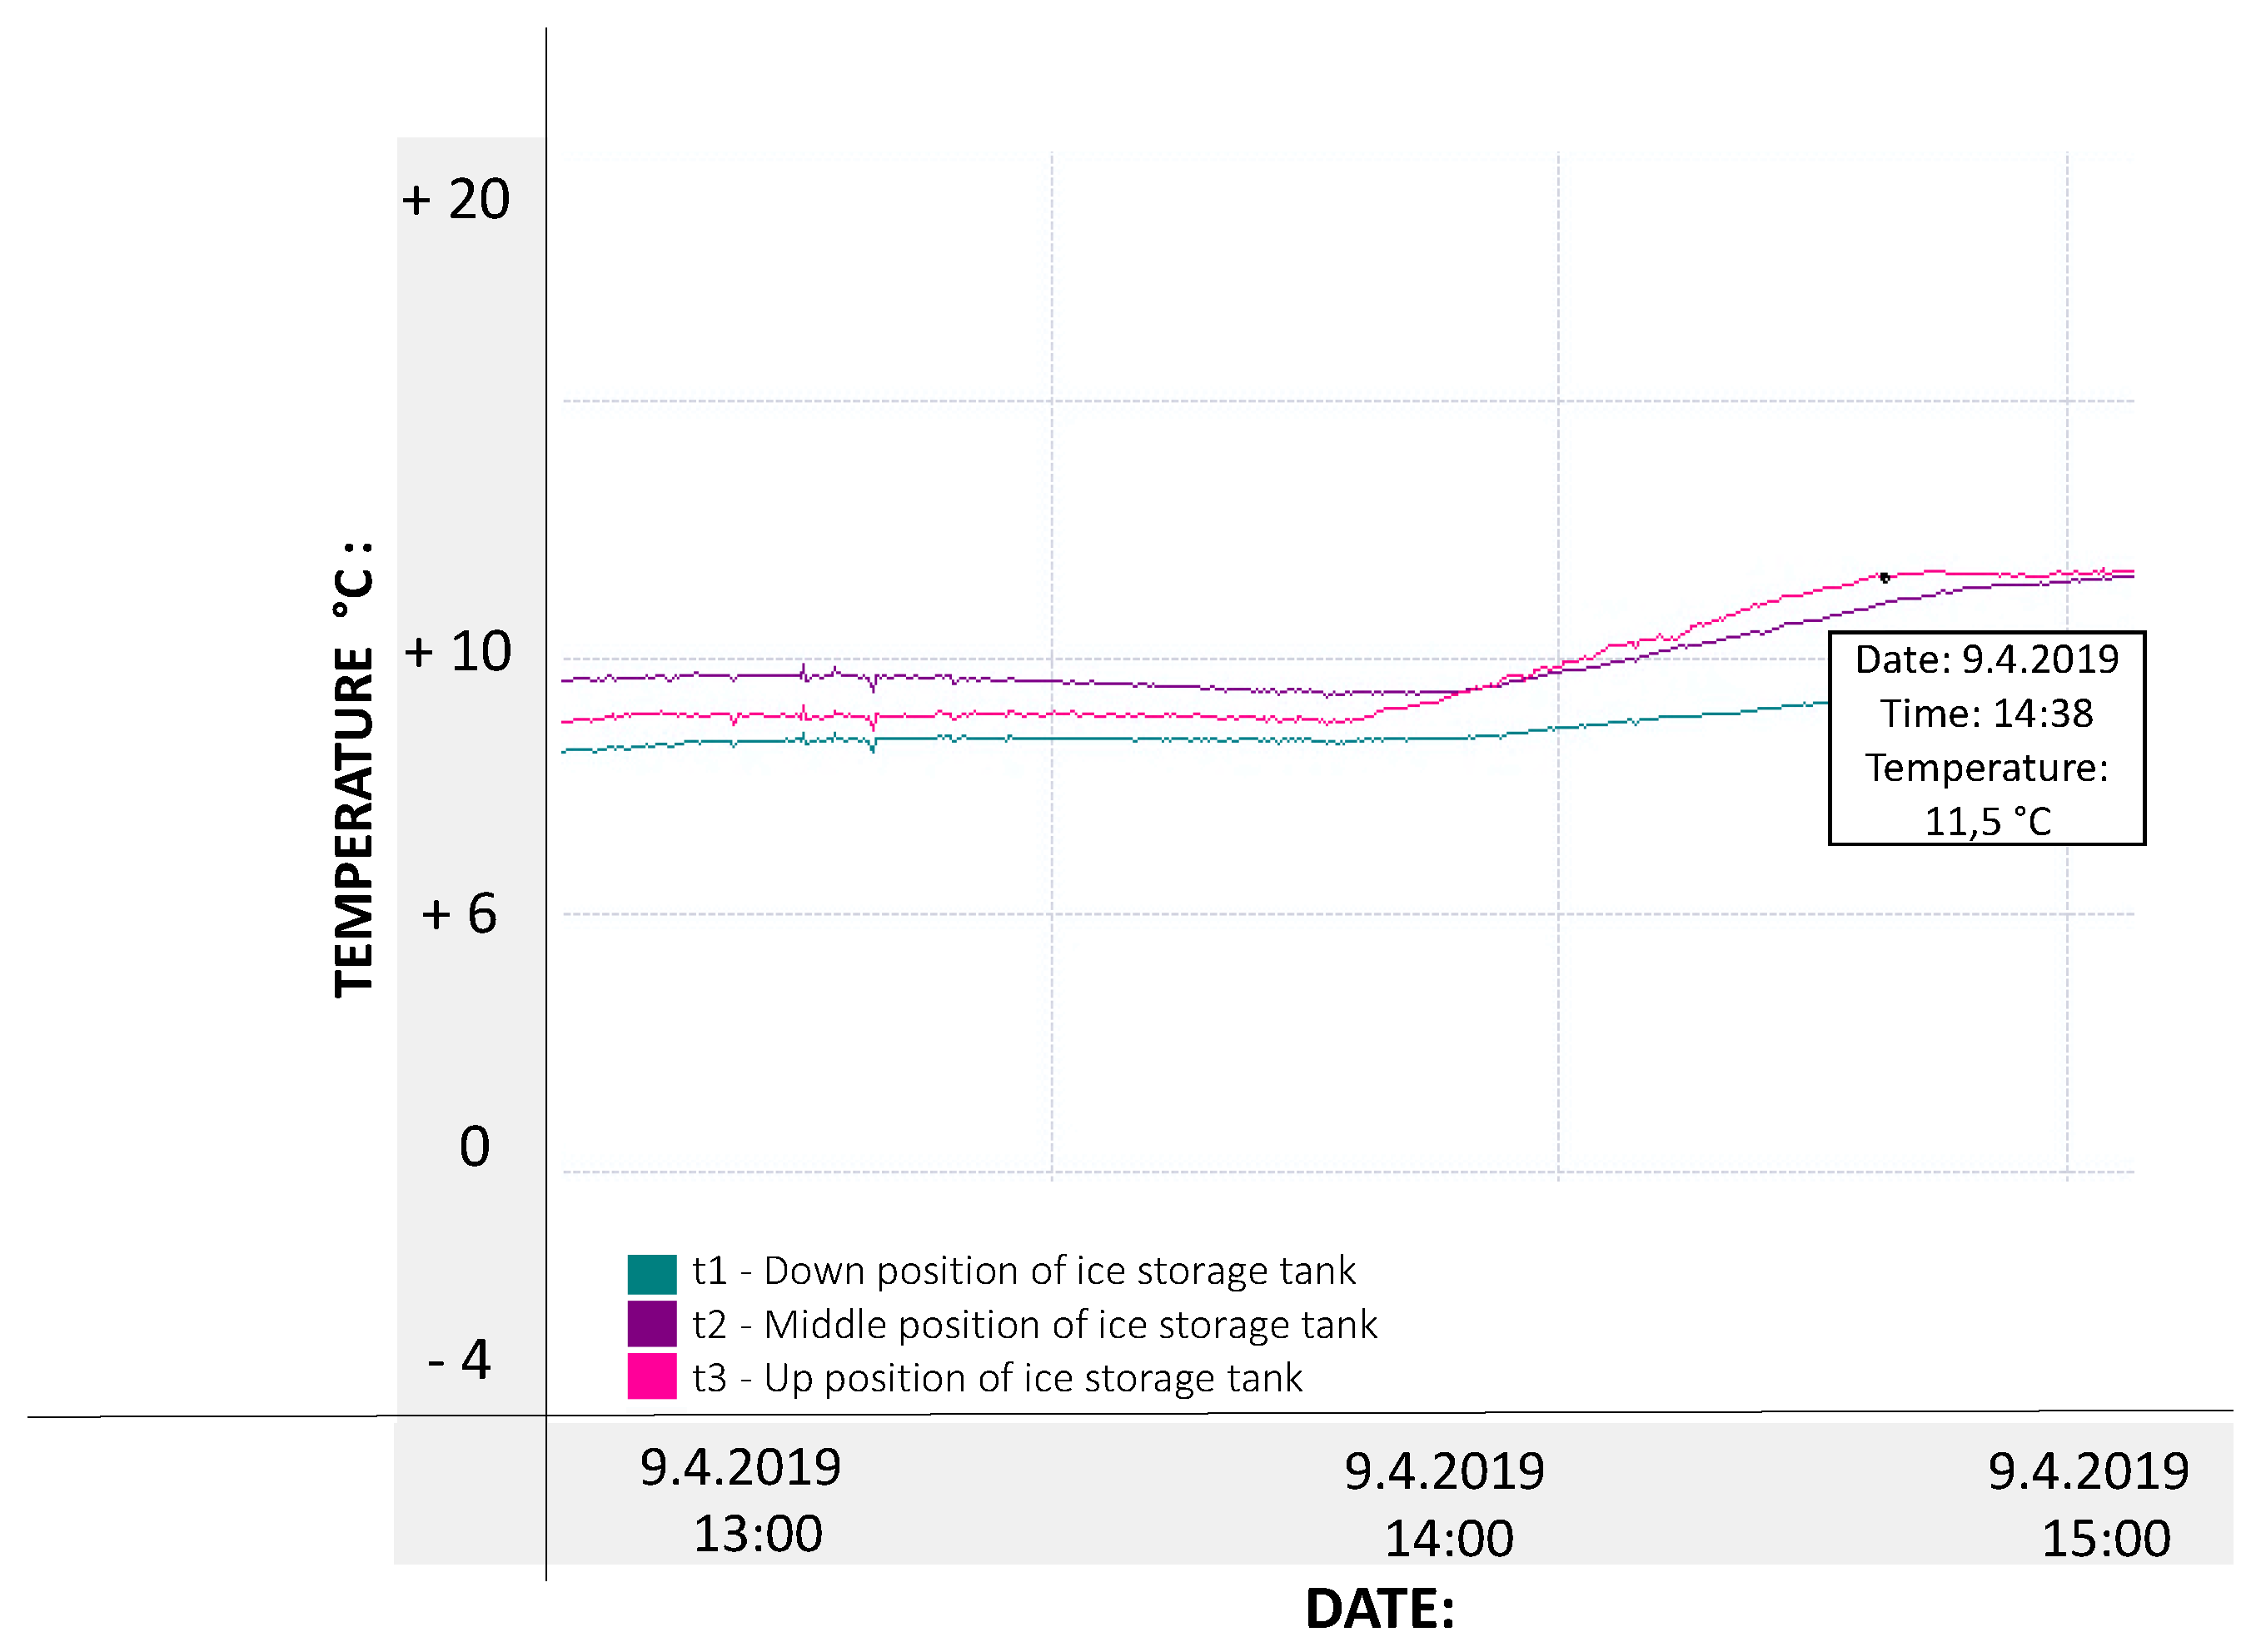
Figure 24 shows the ice storage tank with positive temperatures approximately 11 °C. We can also see that the t3 (up position) is now the highest and the t1 (down position) is again the lowest. The usage of the ice storage tank does not end. From that moment, the tank could be used for cooling if the analyzed house was modified for this purpose.
As we can see in
Figure 24, the temperatures were already in the range from 4 °C and higher (normal stratification). But according to Viewdet graphical output, the t3 (up position) began to show the highest temperature later than would we expected. It was on April 9, 2019, approximately between 14:00–15:00. These phenomena could be explained by water flowing. The warmer water flows through sensors from down to up position. This could affect the sensors and obtained data.
4. Conclusions
The beginning of data recording started on 30 September 2018, at 00:00. The end of the data recording was on 9 April 2019, at 18:00. The total number of data obtained was 1,163,244, of which 775,496 data were analyzed. The total time of analysis was 192 days. The freezing time lasted for 14 days. The melting process lasted for 32 days, which means that the melting itself is more complicated. The total time of PCM behavior was 46 days.
The results point to the fact, that the transformation of the ice tank itself plays an important role. It has been shown that this tank is characterized by good thermal insulation against environmental and collector temperature changes. On the other hand, it needs to be taken into consideration that the water in the tank is a fluid with different movements. During different ice storage phases, the temperature sensors could be influenced by water flowing. In other words, in freezing phase (temperatures from 4 °C to 0 °C), the warmer water flows down and the cooler water vice versa up. These movements could have affected the measurement and temperature rising or falling in sensors located in the down (t1), middle (t2, and up position (t3). The same situation could influence the sensors during the melting phase. Measured data and measurement results can also be affected in this way. This consideration is also supported by the fact that the freezing/melting did not appear in the ice tank at the same time and in the same position. This is also the reason why we divided the tank into 3 positions and why we anticipated it. Taking into account the volume of the tank 10 m3 (10, 000 L), it should be noted that it would be appropriate to examine these unpredictable phenomena in more detail. For example, the most likely solution would be to use a camera system in the tank to capture these facts and better identify them.
The main benefit of this research for theory is real captured data analysis. Benefit for praxis is that we can better understand how this ice storage system with HDP pipes works, especially at the various phases of storing and using thermal energy in the vertical profile of the ice tank for energy efficiency increment. At the same time, research creates space for further continuation of this issue. It would be beneficial to analyze this combined heating system with the ice storage tank for at least one year of operation, possibly over a longer period. The system could also be used as an air conditioner. To do this, it would be necessary to switch off the charging circuit (2nd operating state) and leave only the ice tank circuit on (3rd operating state). This could potentially be another research. The other idea could be the comparison of this system with the ice storage and HDP solar absorber between this older house and a new low-energy type house or building. A suitable alternative would also be to map the operating fluid flows in real time. In this way, we would also record the amount of energy received and transferred to the system. It would be also beneficial to compare operating costs of house before and after installation.
The overall efficiency—the seasonal coefficient of performance (SCOP) of the heating work was determined by the heat pump with value 4.4. The average SCOP of heating systems is approximately 3.0 which represents the average efficiency increase in favor of the ice storage system with HDP solar absorber by 46.6%.
However, it should be noted that during winter, the current COP at that time ranged from 7–8, which makes this system more profound and interesting. The COP of heating systems ranges from 3–5.5, which is up to 145–233% more beneficial compared to conventional heating systems efficiency. The results therefore showed that this system has the highest efficiency during winter with minus temperatures.
We must say, that probably the final SCOP coefficient 4.4 would be probably higher, but our system, and especially heat pump, was working all 192 days without a break. The reason why is because the system was set up to store thermal energy from the environment for ice storage, whenever the temperature conditions allowed it. In our case, it was the temperature difference higher than 4.25 °C between the HDP absorber and ice tank. Of course, when the heat pump was working, it also consumed part of the energy. If we customized the heat pump better and better adjusted the 2nd operating state of storing thermal energy in the ice tank, the system would probably be more efficient. This also could be the idea for the next research. Taken into account all of this, we can consider the ice storage system installation with special kinds of the solar absorber (HDP pipes) in the 40-year-old house as beneficial. Moreover, if this ice storage system with HDP solar absorber could effective work in an older house, it definitely must work much more effective in new low-energy houses.
Author Contributions
Conceptualization, P.S., R.R., F.B.; methodology, M.B., S.Z., Z.Š.; validation, P.S., P.T., R.R., M.B., Z.Š., F.B., J.Č.; writing—original draft preparation, P.S., P.T., R.R., M.B., Z.Š., S.Z.; writing review and editing, P.S. and J.Č.; visualization. All authors have read and agreed to the published version of the manuscript.
Funding
This research received no external funding.
Acknowledgments
Contribution is partial result of projects solving VEGA MŠVVaŠ SR 1/0515/18 „The decision-making model of process of evaluating raw material policy of regions”.
Conflicts of Interest
The authors declare no conflict of interest.
Appendix A
Figure A1.
House with ice storage system installation.
Figure A1.
House with ice storage system installation.
Figure A2.
Location of system components.
Figure A2.
Location of system components.
References
- Jung, W.; Kim, D.; Kang, B.; Chang, Y. Investigation of heat pump operation strategies with thermal storage in heating conditions. Energies 2017, 10, 2020. [Google Scholar] [CrossRef]
- Yang, X.; Xiong, T.; Dong, J.L.; Li, W.X.; Wang, Y. Investigation of the dynamic melting process in a thermal energy storage unit using a helical coil heat exchanger. Energies 2017, 10, 1129. [Google Scholar] [CrossRef]
- Carbonell, D.; Philippen, D.; Haller, M.Y.; Frank, E. Development and validation of a mathematical model for ice storages with heat exchangers that can be de-iced. Energy Procedia 2014, 57, 2342–2351. [Google Scholar] [CrossRef]
- Zheng, Z.H.; Ji, C.; Wang, W. Numerical simulation of internal melt ice-on-coil thermal storage system. Energy Procedia 2011, 12, 1042–1048. [Google Scholar] [CrossRef]
- Lee, D. Numerical analysis and experimental study on the performance optimization of cold storage heat exchanger integrated with evaporator. Int. J. Automot. Technol. 2017, 18, 377–385. [Google Scholar] [CrossRef]
- Chen, H.J.; Wang, W.P.; Chen, S.L. Optimization of an ice-storage air conditioning system using dynamic programming method. Appl. Eng. 2005, 25, 461–472. [Google Scholar] [CrossRef]
- Wang, Z.; Zhao, J.; Li, M. Analysis and optimization of carbon trading mechanism for renewable energy application in buildings. Renew. Sustain. Energy Rev. 2017, 73, 435–451. [Google Scholar] [CrossRef]
- Heier, J.; Bales, C.; Martin, V. Combining thermal energy storage with buildings—A review. Renew. Sustain. Energy Rev. 2015, 42, 1305–1325. [Google Scholar] [CrossRef]
- Csikosova, A.; Senova, A.; Culkova, K.; Antosova, M. Using of RES Potential in the Chosen Region of EU. Aasri Procedia 2012, 2, 180–185. [Google Scholar]
- Moretti, E.; Bonamente, E.; Buratti, C.; Cotana, F. Development of innovative heating and cooling systems using renewable energy sources for non-residential buildings. Energies 2013, 6, 5114–5129. [Google Scholar] [CrossRef]
- Heidari, M.D.; Mathis, D.; Blanchet, P.; Amor, B. Streamlined Life Cycle Assessment of an Innovative Bio-Based Material in Construction: A Case Study of a Phase Change Material Panel. Forests 2019, 10, 160. [Google Scholar] [CrossRef]
- Kudelas, D.; Tausová, M.; Taus, P.; Gabaniova, L.; Kosco, J. Investigation of Operating Parameters and Degradation of Photovoltaic Panels in a Photovoltaic Power Plant. Energies 2019, 12, 3631. [Google Scholar] [CrossRef]
- Csikosova, A.; Culkova, K.; Tausova, M. Marketing of renewable energy sources in the region Košická Kotlina. In Proceedings of the SGEM 2014: 14th International Multidiscilinary Scientific Geoconference: GeoConference on Energy and Clean Technologies: Conference Proceedings, STEF92 Technology, Albena, Bulgaria, 17–26 June 2014; pp. 339–346, ISBN 978-619-7105-15-5. [Google Scholar]
- Pavolova, H.; Bakalar, T.; Bugel, M. The use of renewable sources of energy in the development process of a Slovak municipality. Sustainable cities development and environment. Appl. Mech. Mater. 2012, 209–211, 1715–1718. [Google Scholar] [CrossRef]
- Straka, M.; Khouri, S.; Paška, M.; Buša, M.; Puškaš, D. Environmental Assessment of Waste Total Recycling Based on Principles of Logistics and Computer Simulation Design. Pol. J. Environ. Stud. 2019, 28, 1367–1375. [Google Scholar] [CrossRef]
- Vegsoova, O.; Straka, M.; Rosova, A. Protecting and Securing an Environment Affected by Industrial Activity for Future Utilization. Rocz. Ochr. Srodowiska 2016, 21, 98–111. [Google Scholar]
- Bonamente, E.; Aquino, A.; Cotana, F. A PCM Thermal Storage for Ground-source Heat Pumps: Simulating he System Performance via CFD Approach. Energy Procedia 2016, 101, 1079–1086. [Google Scholar] [CrossRef]
- Zhu, N.; Hu, P.; Lei, Y.; Jiang, Z.; Lei, F. Numerical study on ground source heat pump integrated with phase change material cooling storage system in office building. Appl. Eng. 2015, 87, 615–623. [Google Scholar] [CrossRef]
- Chopra, K.; Tyagi, V.V.; Pathak, A.K.; Pandey, A.K.; Saride, A. Experimental performance evaluation of a novel designed phase change material integrated manifold heat pipe evacuated tube solar collector system. Energy Convers. Manag. 2019, 198, 1–13. [Google Scholar] [CrossRef]
- Rybar, R.; Beer, M.; Cehlar, M. Thermal power measurement of the novel evacuated tube solar collector and conventional solar collector during simultaneous operation. Measurement 2016, 88, 153–164. [Google Scholar] [CrossRef]
- Beer, M.; Rybar, R.; Kalavsky, M. Development of heat storage unit based on the phase change materials for mining machinery with combustion engines. Acta Montan. Slovaca 2016, 21, 280–286. [Google Scholar]
- Guo, L.; Ye, H. Numerical and Experimental Study on a High-Power Cold Achieving Process of a Coil-Plate Ice-Storage System. Energies 2019, 12, 4085. [Google Scholar] [CrossRef]
- Carbonell, D.; Haller, M.Y.; Philippen, D.; Frank, E. Simulations of combined solar thermal and heat pump systems for domestic hot water and space heating. Energy Procedia 2014, 48, 524–534. [Google Scholar] [CrossRef]
- Pavlov, G.K.; Olesen, B.W. Thermal energy storage—A review of concepts and systems for heating and cooling applications in buildings: Part 1—Seasonal storage in the ground. HvacR Res. 2012, 18, 515–538. [Google Scholar]
- Ko, M.J. Analysis and optimization design of a solar water heating system based on life cycle cost using a genetic algorithm. Energies 2015, 8, 11380–11403. [Google Scholar] [CrossRef]
- Wang, X.; Zheng, M.; Zhang, W.; Zhang, S.; Yang, T. Experimental study of a solar assisted ground-coupled heat pump system with solar seasonal thermal storage in severe cold areas. Energy Build. 2010, 42, 2104–2110. [Google Scholar] [CrossRef]
- Wang, C.; He, Z.; Li, H.; Wennerstern, R.; Sun, Q. Evaluation on performance of a phase change material based cold storage house. In Proceedings of the 8th International Conference on Applied Energy, Beijing, China, 8–11 October 2016. [Google Scholar]
- Philippen, D.; Haller, M.Y.; Logie, W.; Thalmann, M.; Brunold, S.; Frank, E. Development of a heat exchanger that can be de-iced for the use in ice stores in solar thermal heat pump systems. In Proceedings of the EuroSun, Rijeka, Croatia, 18–20 September 2012; International Solar Energy Society (ISES): Rijeka, Croatia, 2012. [Google Scholar]
- Bonamente, E.; Aquino, A. Life-Cycle Assessment of an Innovative Ground-Source Heat Pump System with Upstream Thermal Storage. Energies 2017, 10, 1854. [Google Scholar] [CrossRef]
- Terziotti, L.T.; Sweet, M.L.; McLeskey, J.T., Jr. Modeling seasonal solar thermal energy storage in a large urban residential building using TRNSYS 16. Energy Build. 2012, 45, 28–31. [Google Scholar] [CrossRef]
- Kenisarin, M.; Mahkamov, K. Passive thermal control in residential buildings using phase change materials. Renew. Sustain. Energy Rev. 2016, 55, 371–398. [Google Scholar] [CrossRef]
- Elavarasan, R.M.; Velmurugan, K.; Subramaniam, U.; Kumar, A.R.; Almakhles, D. Experimental Investigations Conducted for the Characteristic Study of OM29 Phase Change Material and Its Incorporation in Photovoltaic Panel. Energies 2020, 13, 897. [Google Scholar] [CrossRef]
- Zarei, M.J.; Bazai, H.; Sharifpur, M.; Mahian, O.; Shabani, B. The Effects of Fin Parameters on the Solidification of PCMs in a Fin-Enhanced Thermal Energy Storage System. Energies 2020, 13, 198. [Google Scholar] [CrossRef]
- Long, T.; Qiao, Z.; Wang, M.; Li, Y.; Lu, J.; Li, W.; Huang, S. Performance analysis and optimization of a solar-air source heat pump heating system in Tibet, China. Energy Build. 2020, 220, 110084. [Google Scholar] [CrossRef]
- Mostafavi, A.; Parhizi, M.; Jain, A. Semi-analytical thermal modeling of transverse and longitudinal fins in a cylindrical phase change energy storage system. Int. J. Therm. Sci. 2020, 153, 106352. [Google Scholar] [CrossRef]
Figure 1.
Heating systems comparison.
Figure 1.
Heating systems comparison.
Figure 2.
Combined ice storage system scheme.
Figure 2.
Combined ice storage system scheme.
Figure 3.
HDP pipes (collectors) on the roof in winter.
Figure 3.
HDP pipes (collectors) on the roof in winter.
Figure 4.
Ice storage tank location.
Figure 4.
Ice storage tank location.
Figure 5.
Ice storage tank.
Figure 5.
Ice storage tank.
Figure 6.
The first status of the heat pump.
Figure 6.
The first status of the heat pump.
Figure 7.
The second status of the heat pump.
Figure 7.
The second status of the heat pump.
Figure 8.
The third status of the heat pump.
Figure 8.
The third status of the heat pump.
Figure 9.
Expected phases of the ice storage tank.
Figure 9.
Expected phases of the ice storage tank.
Figure 10.
Temperature average throughout the collected time.
Figure 10.
Temperature average throughout the collected time.
Figure 11.
Heat pump processes overview.
Figure 11.
Heat pump processes overview.
Figure 12.
Ice storage states of t1—down position.
Figure 12.
Ice storage states of t1—down position.
Figure 13.
Ice storage states of t2—middle position.
Figure 13.
Ice storage states of t2—middle position.
Figure 14.
Ice storage states of t3—upper position.
Figure 14.
Ice storage states of t3—upper position.
Figure 15.
Overall view of temperatures.
Figure 15.
Overall view of temperatures.
Figure 16.
I. Phase—Normal waster stratification.
Figure 16.
I. Phase—Normal waster stratification.
Figure 17.
II. Phase—Inverse waster stratification.
Figure 17.
II. Phase—Inverse waster stratification.
Figure 18.
III. Phase: 0—Freezing in upper position t3.
Figure 18.
III. Phase: 0—Freezing in upper position t3.
Figure 19.
IV. Phase: 0—Solid state.
Figure 19.
IV. Phase: 0—Solid state.
Figure 20.
III. Phase—Melting process.
Figure 20.
III. Phase—Melting process.
Figure 21.
III. Phase—Melting ice t1.
Figure 21.
III. Phase—Melting ice t1.
Figure 22.
III. Phase—Melting ice t2.
Figure 22.
III. Phase—Melting ice t2.
Figure 23.
III. Phase—Melting ice t3.
Figure 23.
III. Phase—Melting ice t3.
© 2020 by the authors. Licensee MDPI, Basel, Switzerland. This article is an open access article distributed under the terms and conditions of the Creative Commons Attribution (CC BY) license (http://creativecommons.org/licenses/by/4.0/).


 ,
, 


