1. Introduction
Metal foams are a specific group of porous materials that replicate natural principles and materials such as bone or wood. This mimicking of natural principles gives metal foams several specific properties that can be used in a wide range of technical applications that are predominantly in heat engineering and power engineering [
1,
2,
3]. Other application options include, for example, impact energy absorbers, sound insulation, catalysts, mixers, electrodes, EMI protection, etc. [
4,
5,
6]
The properties of the metal foams are influenced not only by the base metal but also by the openness of their structure. Based on this criterion metal foams are divided into metal foams with open or closed cells. The authors will further deal only with open-cell metal foams. In the case of open-cell metal foam, the structure is composed of interconnected metal ligaments that are joined at the nodal points and form pores and cells of the metal foam. One of the noteworthy advantages of the metal foam is the ability to use recycled metal material, which helps to reduce ecological footprint of manufacturing process [
7].
Figure 1 depicts a detailed view of the inner structure of a sample of metal foam. From the geometric point of view, the arrangement of the pores and cells can be interpreted in various methods. At present, the scientific community generally accepts three methods, which differ only by the purpose of their use or the technical complexity of their further processing (e.g., calculation time in Computational Fluid Dynamics analysis or Computer-aided design modeling). The first involves the model from tetrakaidecahedron, respectively so-called Kelvin cell, which schematically consists of six square and eight hexagonal faces.
The second method is based on Weaire–Phelan structure [
8]. It is a complex three-dimensional structure, representing ideal foam composed of two types of a cell with equal volume, dodecahedron with pentagonal faces and tetrakaidecahedron with two hexagonal faces and twelve pentagonal faces. The basic idea of these methods is to fill space as effectively as possible with periodically repeating three-dimensional geometrical shapes. Another method of geometric reconstruction of the metal foams uses tessellation method based on the Poisson–Voronoi algorithm [
9,
10,
11].
In the process of metal foam application, scientists and researches use a variety of techniques to obtain their basic geometric characteristics or dimensions. Raj and Kerr [
12] assessed the impact of selected parameters on the metal foams relative densities. Geometric features were assessed with a digital optical microscope equipped with a long depth of focus lens with magnification from 100× to 5000×. Chen et al. [
13] conducted fatigue experiments on copper metal foams with various pore sizes. The microstructures of failed copper foam were detected by optical microscope and scanning electron microscopy. Wu et al. [
14] use a scanning electron microscope to qualitatively evaluate the method of laser separation of the metal foam block. Authors did not describe specific aspects of apparatus, but in their research, they used magnifications ranging from 35× to 2000×.
The use of high-resolution X-ray microtomography brings a significant change in quality, as well as expands the possibilities of research, mainly thanks to their ability to penetrate the structure of the metal foam and thus give a better idea of its geometrical parameters. Caravalho et al. [
15] investigated pressure drop behavior across open-cell metal foams. The high-resolution X-ray microtomography was used in the process of determination of porosity, specific surface and mean pore size directly from the tomographic datasets. Li et al. [
16] numerically evaluated spectral reflection behaviors of high-porosity metal foam sheets. A set of realistic nickel foams was scanned with a voxel size of 20 μm to obtain their 3-D digital cellular network. Cardona et al. [
17] verified the pore distribution and uniformity in aluminum alloy metal foam manufactured by casting—dissolution process, using a nondestructive high-resolution X-ray micro-CT analysis. Vicente et al. [
18] developed special tools build on X-ray tomography with intent to characterize pore space and solid matrix. Skibinski et al. [
19] evaluated the influence of pore diameter on the effective thermal conductivity of metal foam. Reference virtual models were based on X-ray scans.
The above literature review shows that the correct understanding of metal foam geometry is in many cases the basis of further investigation or even the outcome of the study itself. The quality and detail of the outputs are directly proportional to the used methods, which mainly include the use of optical microscopes, scanning electron microscope and high-resolution X-ray microtomography. Unfortunately, the availability of these methods varies. This is due to the different funding of the research activities or institutes. As is reported by United Nations Educational, Scientific and Cultural Organization in [
20], global spending on research and development has reached almost US
$1.7 trillion, but only ten countries account for 80% of that spending. The underfunding is also closely related to the selection of suppliers of the metal foams. Based on the authors own experience as well as on the information from other authors, it is possible to define a relatively frequently occurring phenomenon regarding significant inaccuracies of the information supplied by the manufacturer (porosity and pore density) or the absence of essential parameters in the technical data sheet (pore diameter and ligament diameter). This is caused mainly due to the selection of cheaper manufacturers of metal foam, which rather represents the heavy industry, and in many ways cannot provide full compliance with required parameters. These inaccuracies, respectively, and the absence of data result in the necessity of determining the basic geometric characteristics or dimensions directly by the scientists who are considering working with the metal foam. In terms of the application of metal foams, the key parameters for calculations and design can be narrowed to the pore and cell diameter, respectively length, and thickness of ligament. Described parameters are the basis of the calculation of pressure drop, or the specific surface area, which quantifies the metal foams in terms of their further use. In particular, the size of the specific surface area per bulk volume is often the most important parameter for the design and correct determination of specific dimensions and shapes of the developed application or technology. The various methods of calculating the specific surface area of the metal foam are summarized in
Table 1 according to published and most cited papers.
The present paper is focused on the proposal of an economical non-destructive method with the use of universally available and usable instrumentation. An important part of the presented work is not only the design of the proposed method but also the calculation of the uncertainty and comparison of the results with the conventional high-resolution X-ray microtomography.
2. Materials and Methods
The basic principle of the proposed method lies in the images capture of metal foam and their subsequent analysis in image analysis software. The proposed method was developed and later evaluated when working with an open-cell copper metal foam sample that was produced by the electrophoretic deposition process. The metal foam samples are characterized by a pore density of 10 pores per inch (PPI) and were manufactured by SHANGHAI CMIC. The shape and dimensions of the four used samples result from the purpose of their further use as a prototype of the heat accumulator in shape of the annulus cylinder with height 100 mm, the inner diameter of 12 mm and the outer diameter of 50 mm. Other samples have shape of block with dimensions of 70 × 80 × 25 mm. Samples were created by electric discharge machining from a single block of the base material, this machining method is considered appropriate due to the low rate of ligament damage by cutting beam [
26]. The number of samples of the same metal foam was determined based on the need to capture a larger area of samples on which the required number of geometric parameters could be identified.
The proposed method consists of three consecutive steps. The first step can be characterized by the preparation of the sample and its location, the second by capturing images and the third by the image analysis. Since quantitative evaluation of the basic geometric characteristics or dimensions require an accuracy of tenths of a millimeter a high level of details is not necessary (compared to metal defectoscopy or metallography) and therefore it is possible to use standard photography equipment.
2.1. Sample Placement and Used Devices
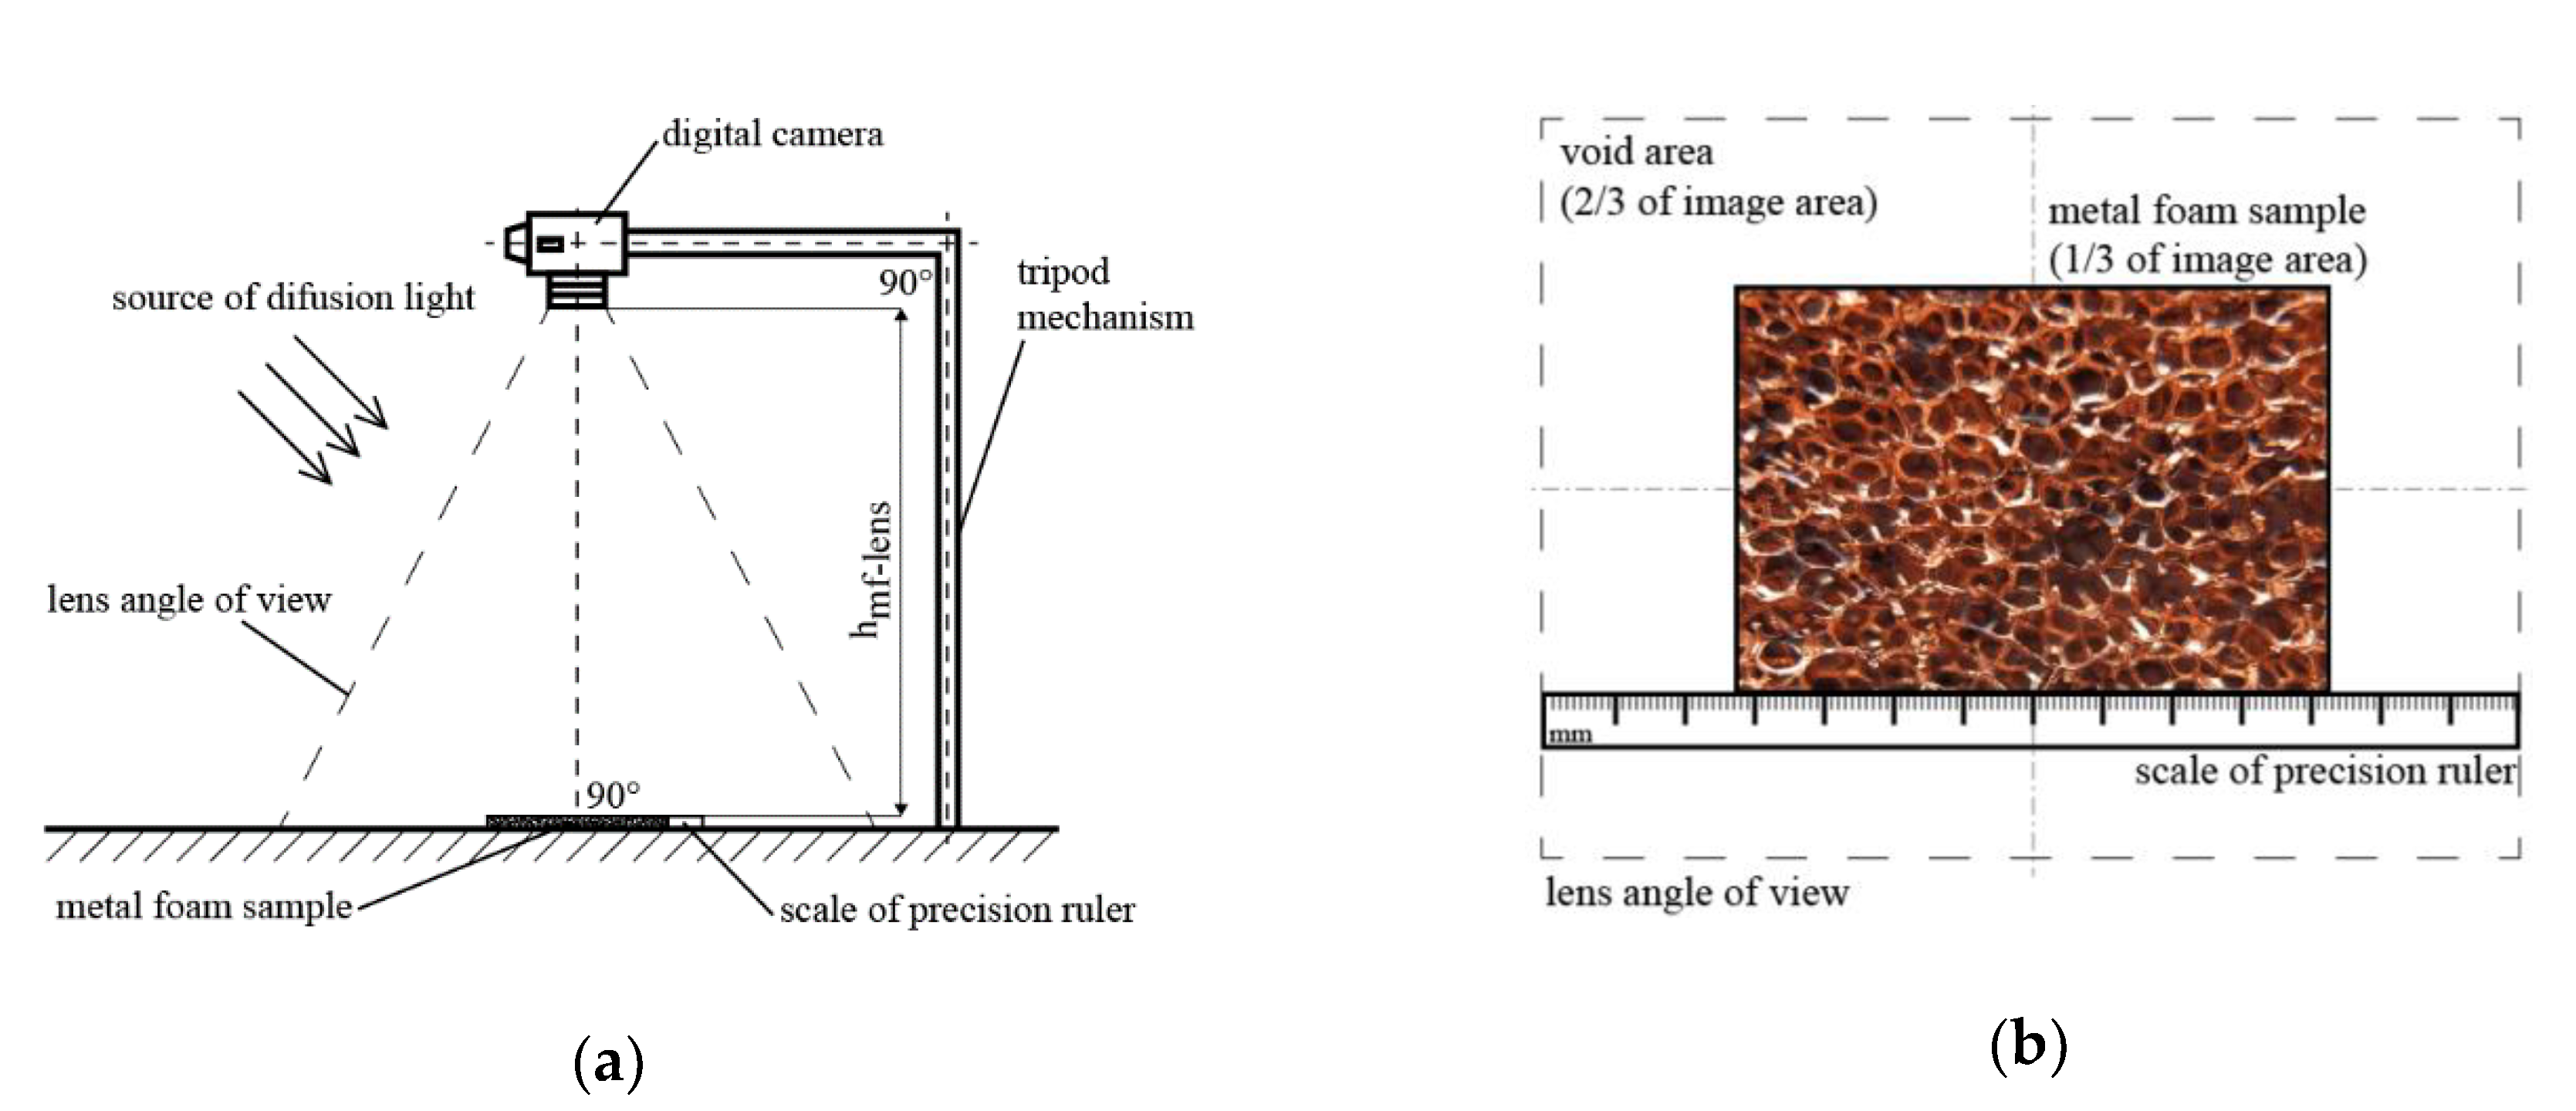
Required images were captured by a macro lens combined with the mirror camera body, which can be characterized by an APS-C Complementary Metal Oxide Semiconductor (CMOS) sensor with 32.5 Mpx. The camera captured images in an uncompressed RAW format with a resolution of 6900 × 4640 px. The photographic set was endowed with a macro lens, with a rigid 100 mm focal length, aperture 2.8, minimum focusing distance 0.31 m, and magnification factor 1. The photography procedure itself is a relatively simple sequence of operations. The first step was to place the sample on a horizontal, non-reflective surface in a way that the axis of the objective was perpendicular to the top plane of the metal foam sample. Next to the metal foam sample was placed Shinwa Precision Ruler with 0.05 mm accuracy with a readable scale that serves as a benchmark for subsequent image processing. In this step, it is important to maintain identical distances between the top plane of metal foam, respectively top plane of the precision ruler and the last lens optical element to avoid distortion due to perspective change. Even the highest quality lenses have optical imperfections that are manifested by distortion, loss of contrast or sharpness. These imperfections have lower influence in the center of the displayed area, greater at the edges. In an effort to avoid affecting the resulting image of the metal foam, sample was placed in a way that it would fill only 1/3 of the image. From this assumption is derived the distance between camera lens and the metal foam sample, as is shown in
Figure 2. The distance between sample and lens h
mf-lens is then proportional to the used lens and its magnification factor, in the present case it was 0.35 m. The schematic diagram of the placement of the camera, sample and precision ruler as well as described lens height is depicted in
Figure 2.
2.2. Image Capture
The exposure setting of camera was based on the used equipment and lighting conditions. In the process of image capture was not used an artificial lighting of the scene, and therefore the lighting conditions were partially limited. The camera was set to ISO100 for low noise level and aperture 2.8, which provided a good compromise between image distortion and the ability to take pictures under limited lighting. Due to the use of a tripod, the shooting time was set to the automatic value specified by the camera software. This part of the proposed method resulted in a series of images capturing a top plane of the metal foam, from which the necessary parameters were measured in image processing and analysis software.
2.3. Image Analysis
In the presented work, image analysis software ImageJ was used. Software is based on Java architecture and it is freely available, multithreaded, platform independent, open source image analysis, and processing program developed at the National Institutes of Health, USA [
27]. Before analysis, captured images were adjusted in terms of contrast and white balance and converted from .RAW file format to .PNG format, which is suitable for the used software. In ImageJ software, two functions were used—Scale and Measurement. The scale function gives the ratio of the displayed pixel to the unit of length, in our case it was px/mm. The measurement function allows determining the length, perimeter, or area of any object in the analyzed image. The first step of analysis in ImageJ software was setting scale, it is necessary to configure the relationship between the displayed pixels and the scale of the precision ruler. In the presented study was this scale set to 30 px/1 mm.
The image analysis itself places demands on the operator, who can introduce a certain degree of inaccuracy into the result. It follows that the use of the method requires extensive expertise in the field of foam metals, the use of basic graphics programs as well as the ability of spatial imagination.
In the process of image analysis is necessary to find pores that are suitable for recording their dimensions. The first parameter that these pores must meet is their parallelism with the upper plane of the sample (and therefore with the camera lens). The second prerequisite for selection is their shape, which must be pentagonal or hexagonal (based on geometric representation described in introduction part). Any deviation from the desired shape indicates that the pore is not in the desired plane and is therefore not suitable for the measurement. This task may seem challenging in terms of spatial perception or time. However, its complexity does not deviate from the commonly used techniques in metallurgy. For example, one of them is the qualitative evaluation of metallurgical processes using image analysis of the size or shape of the metal grain. Even in this case, the researcher must independently identify the object under consideration. The identified suitable pores were in ImageJ bounded by a closed curve that forms the pore area. Since the metal foam is not formed by pores of the same sizes, in determining the pore diameter, it was contemplated to measure the inner surface area of pentagonal and hexagonal pores. The calculation of the pore diameter was based on a simplification, which considers the conversion of the pore area to diameter using the equation for calculating the area of the circle. This procedure presupposes the simplification of the hexagonal shape to a circular one, as is mentioned in [
28].
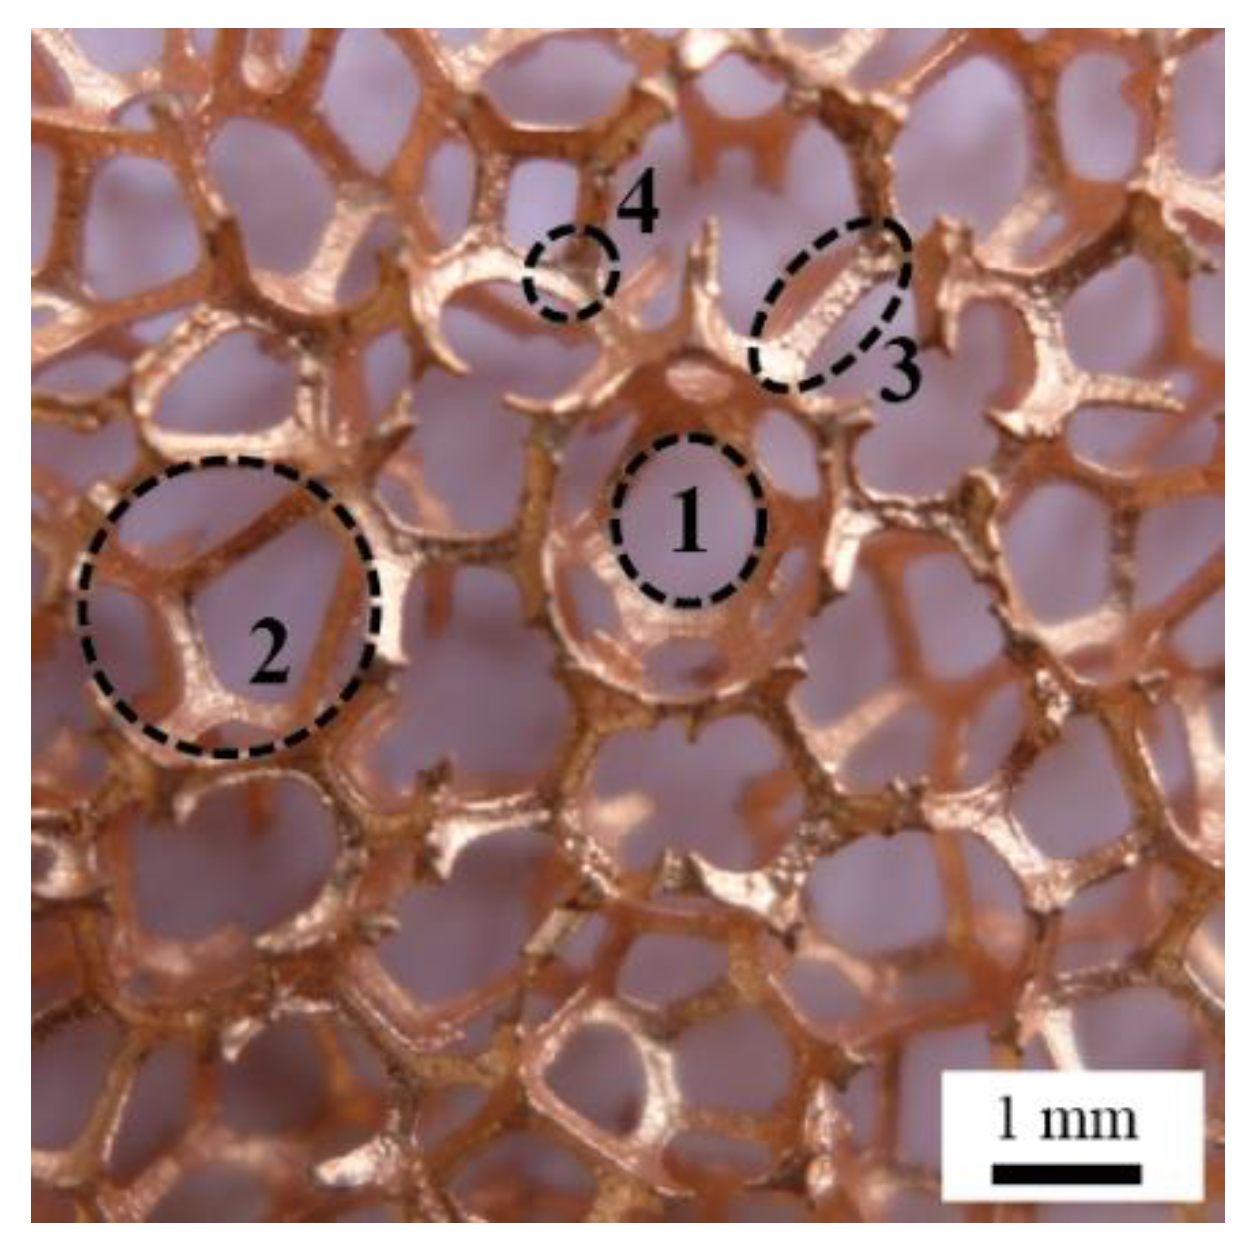
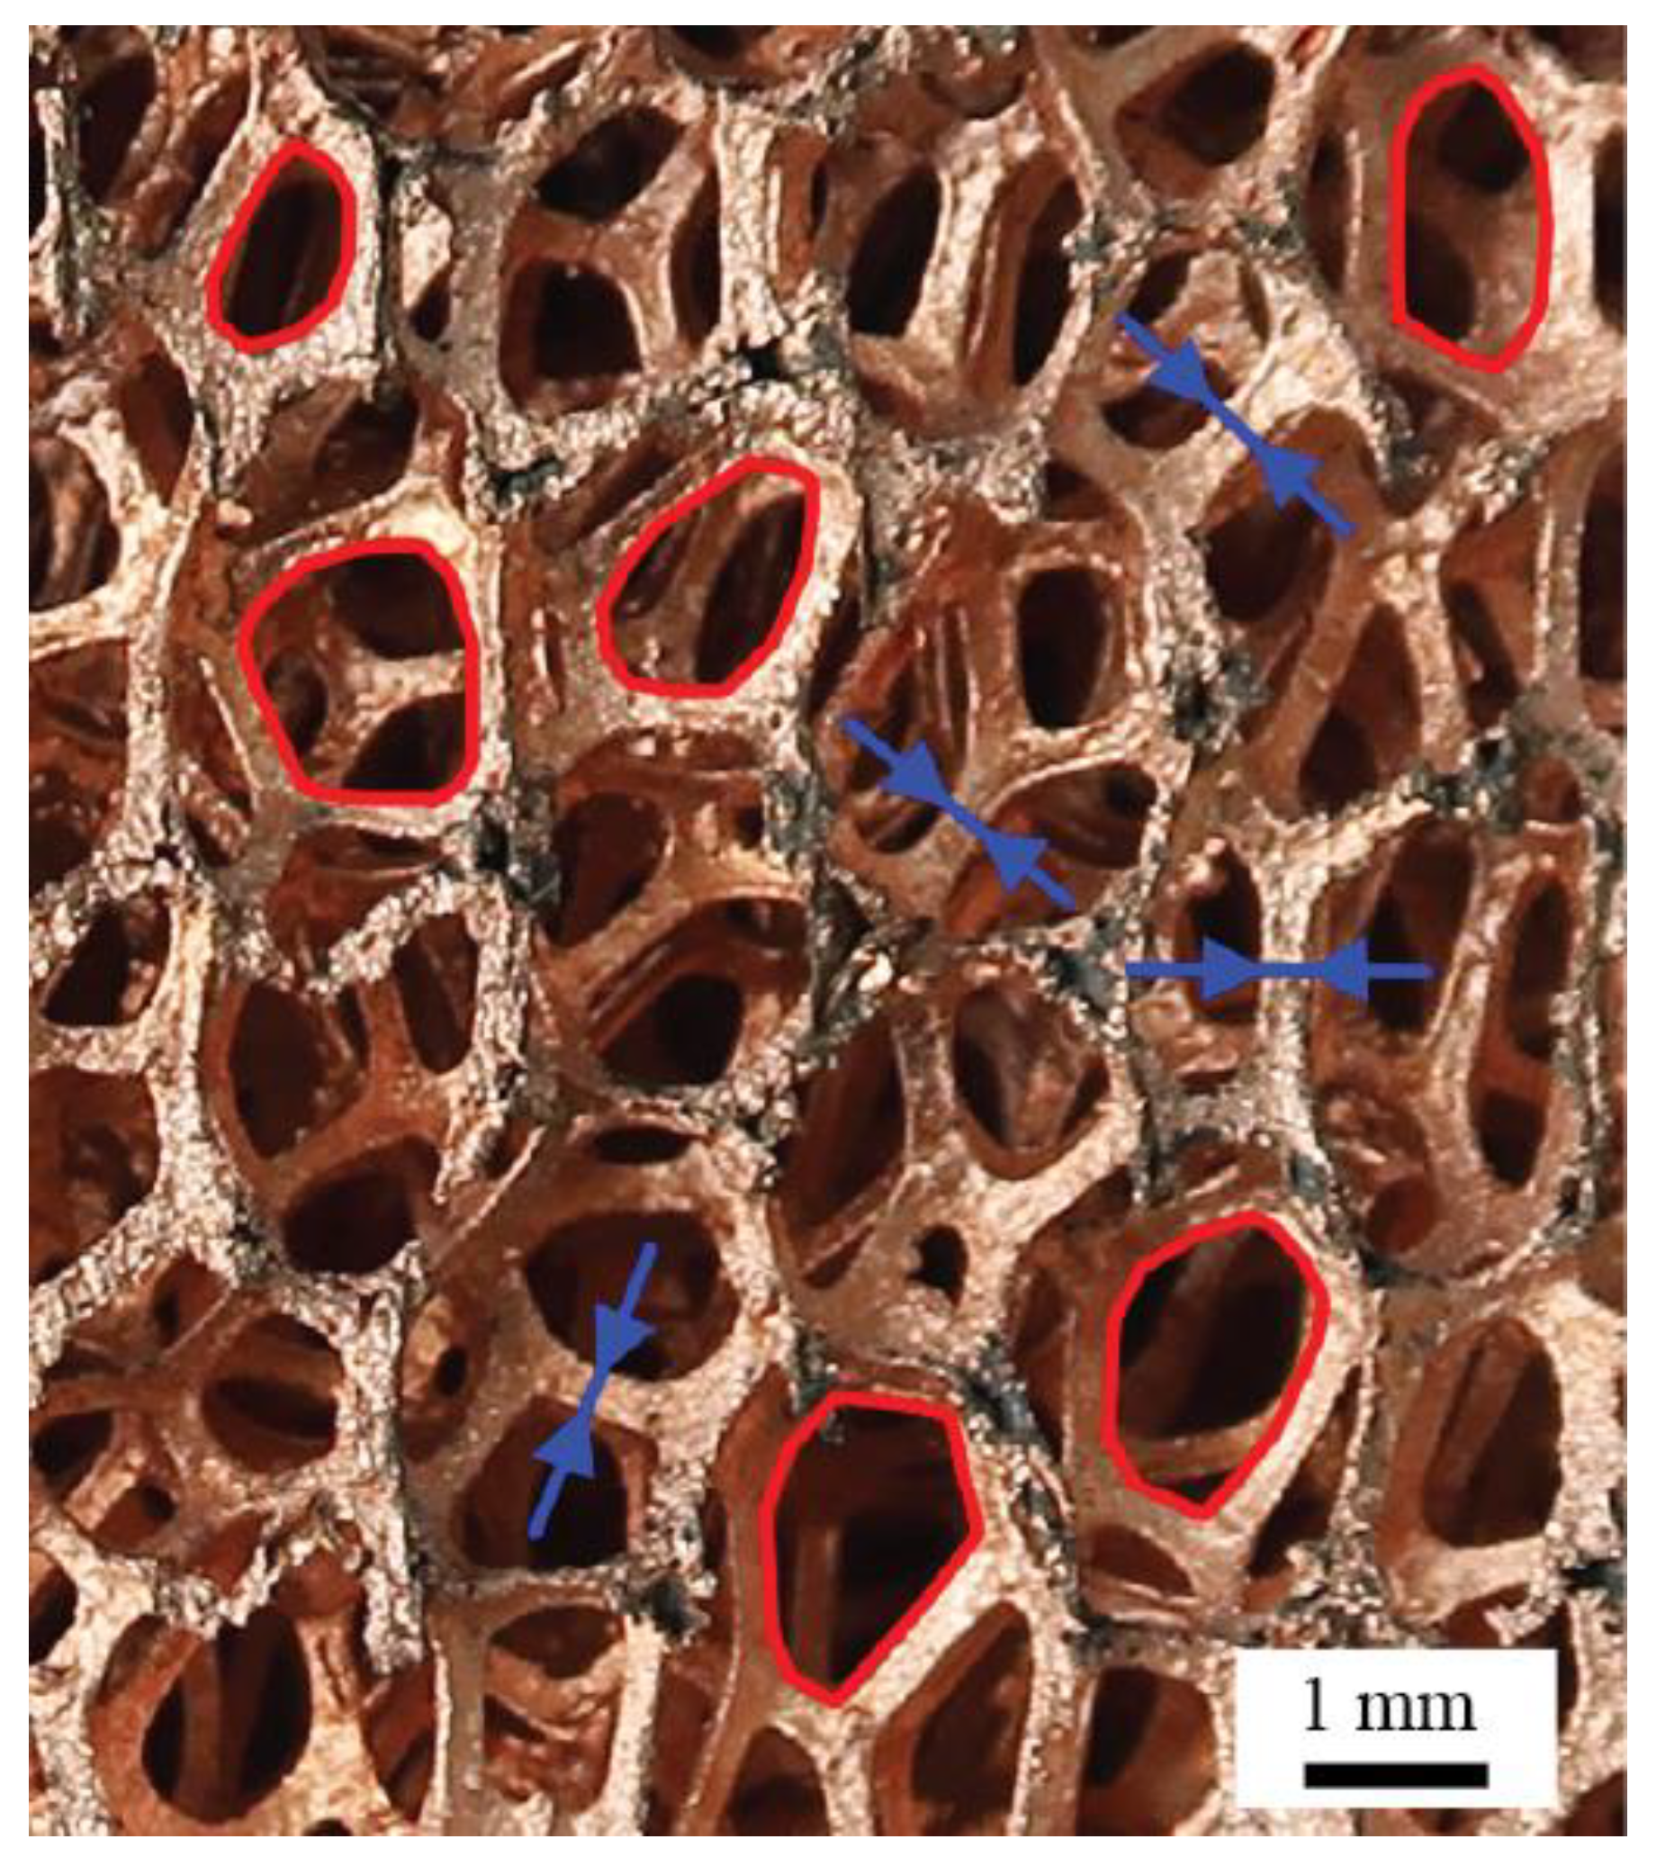
The need for correct identification of the pore shape limits the presented method for use with metal foams, which are characterized by a relatively ordered structure and are manufactured especially by the electrophoretic deposition process. The optimal number of assessed pores is based on the gradual analysis of data in steps of ten measurements. Thus, datasets with 10, 20, 30, 40 and 50 records were evaluated sequentially. The dataset with 50 records did not show a statistically significant deviation and error within records. Based on the Kelvin geometric representation of the metal foam structure, data set was expanded to total 56 pores, from which 24 were with square shape and 32 were with a hexagonal shape. The situation is much simpler when determining the diameter of the ligament. When identifying a suitable ligament, it is sufficient to monitor compliance of its parallelism with parallelism of the upper surface of the sample. The number of identified and measured ligaments was based on the same principle as in determining the pore diameter. An example of the selection of ligament diameter and pores is shown in
Figure 3.
3. Results
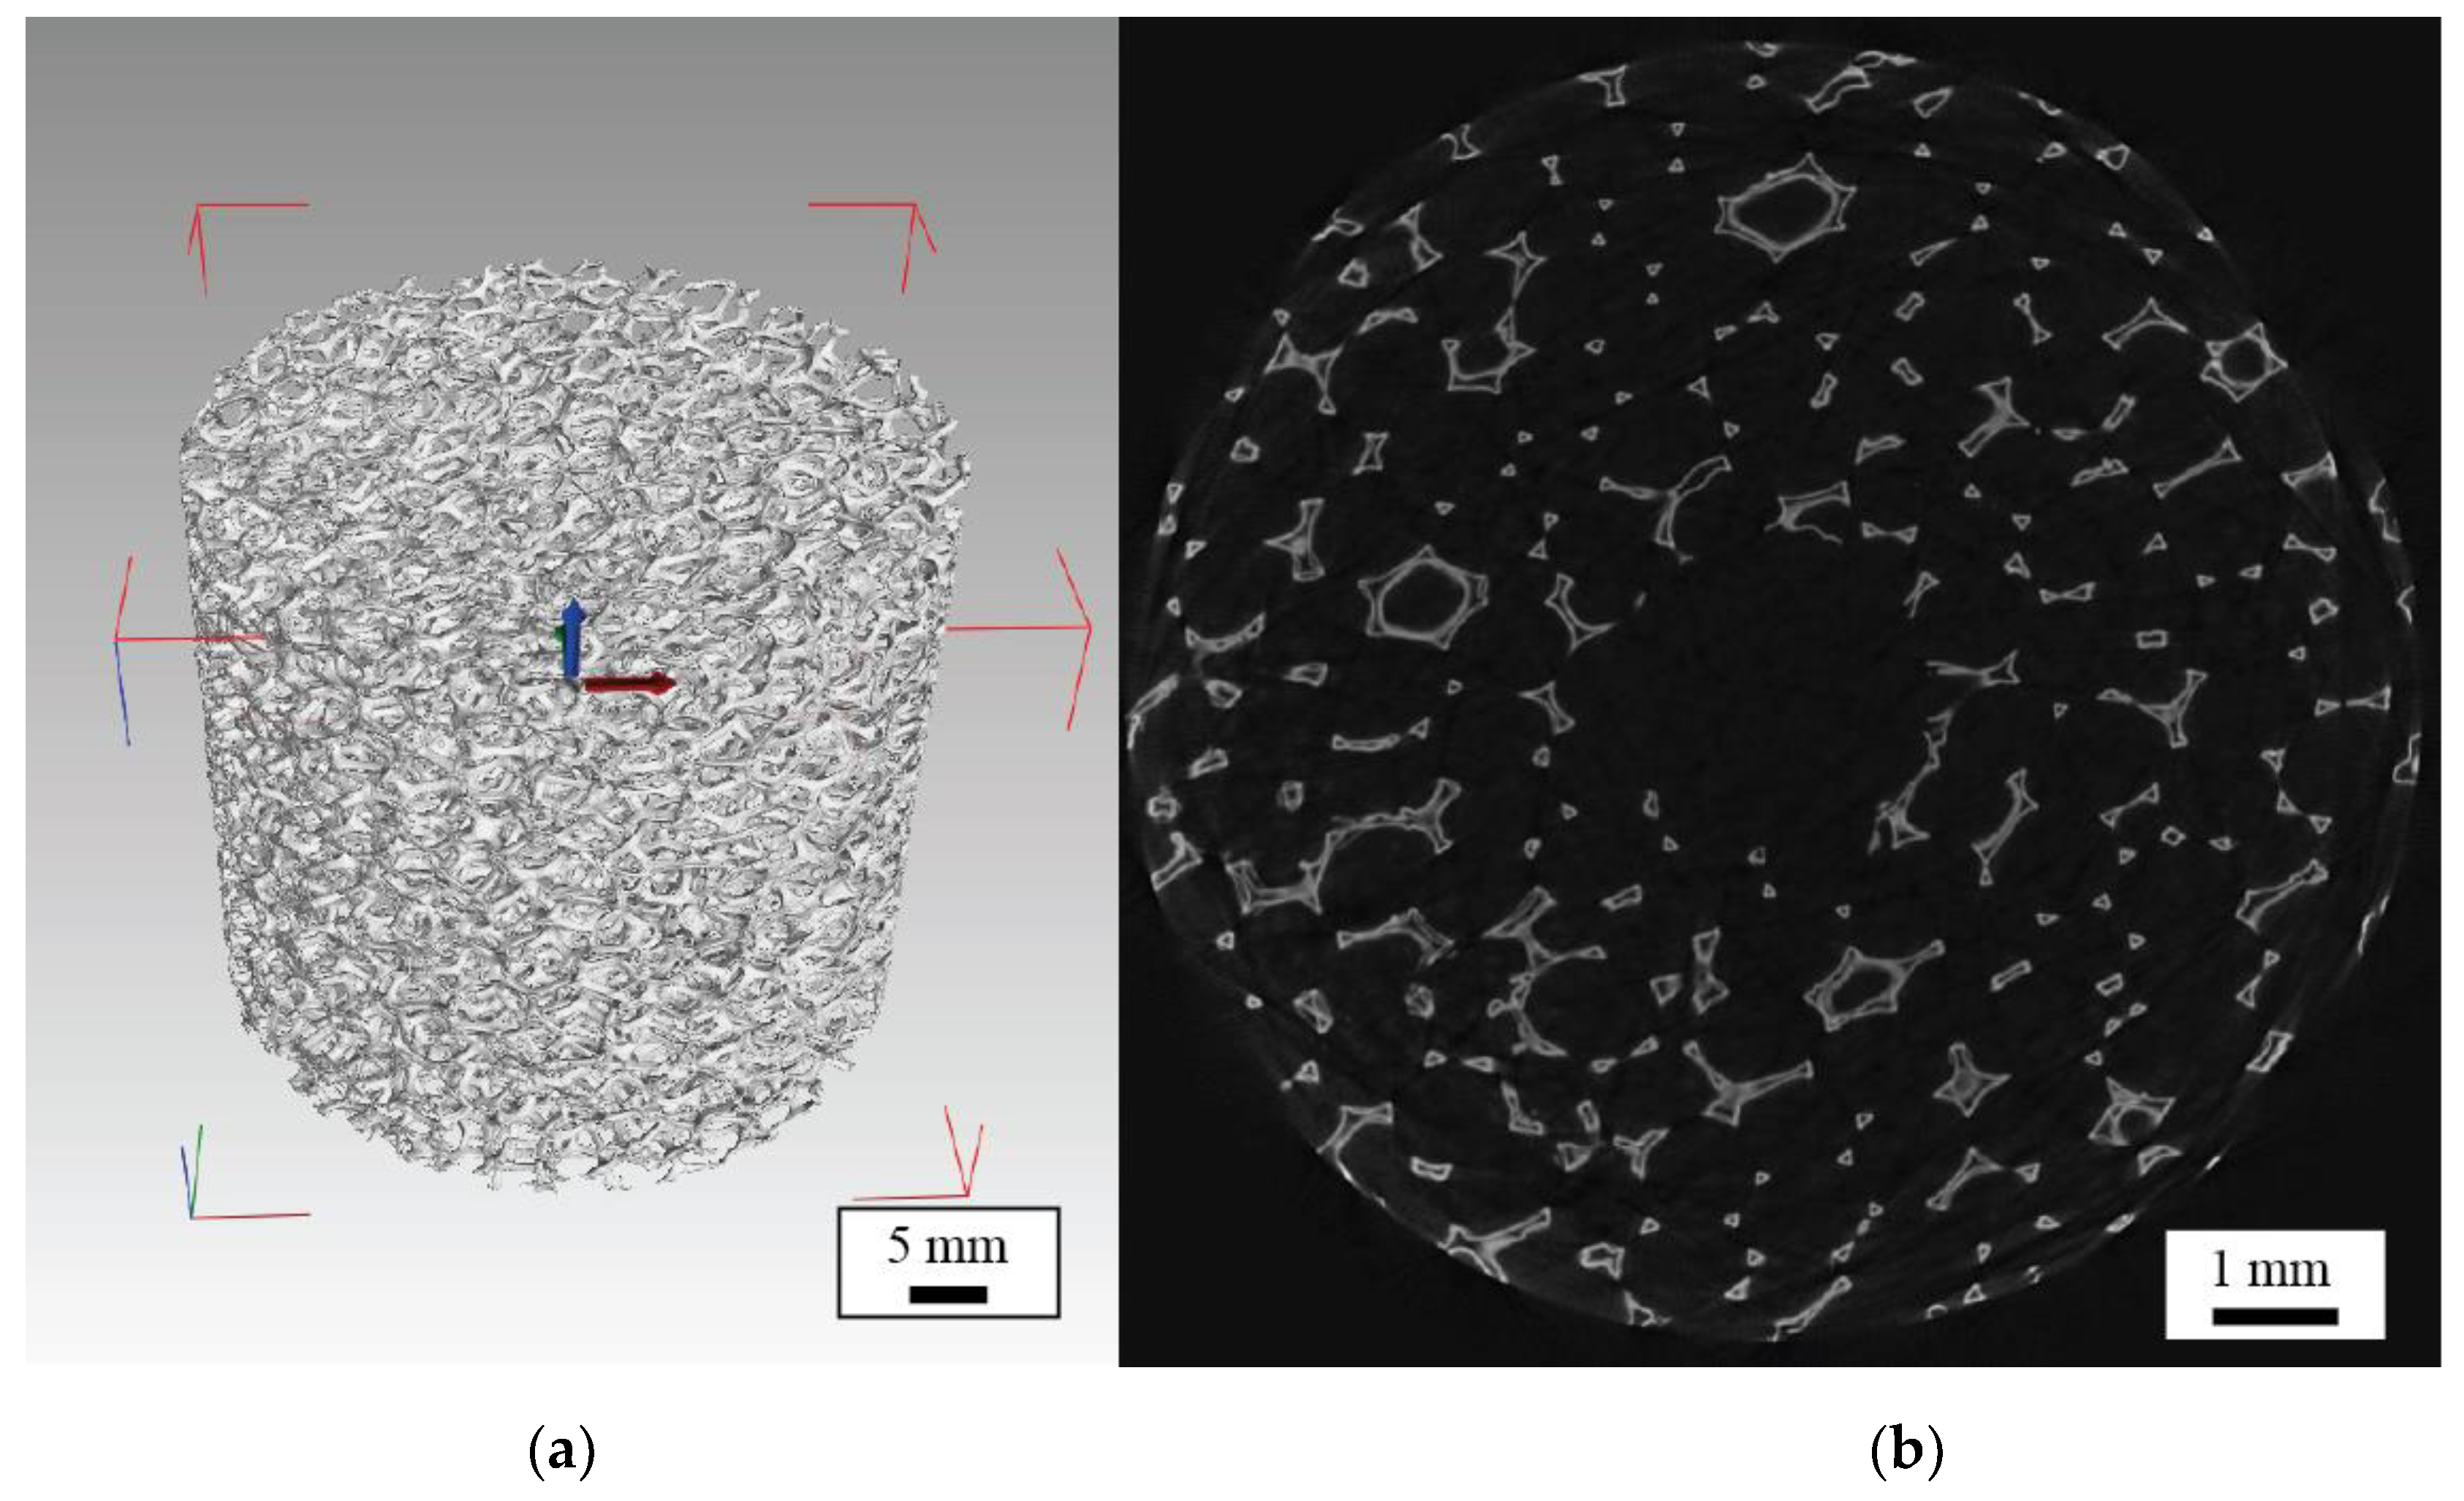
To evaluate overall accuracy, the proposed method was compared with commonly used high-resolution X-ray microtomography system ZEISS METROTOM 1500 [
29], with length measurement error (9 + L/50) μm, where L is voxel value. The resolution of individual radiographic frame was resolution 1024 × 1024 px, and the flat panel CMOS detector was used. Scanning parameters were selected based on the requirement of sufficient contrast between sample and surroundings. The distance and power of the detector were chosen concerning voxel and point size. The filter and its thickness were set with respect to the elimination of artifacts created during scanning. One thousand layers were scanned to create a 3D model of metal foam (see
Figure 4), which was analyzed in software VGSTUDIO MAX (Volume Graphics, Heidelberg, Germany) [
30], where the diameters of the ligaments and the areas of hexagonal and pentagonal pores were determined with use of Length and Area measurement function. For detailed parameters of used high-resolution X-ray microtomography, see
Table 2.
The presented measurements by the proposed method and by the comparative method resulted in four datasets with 56 and 50 records, respectively. For simplicity and clarity of the following text were these datasets named
dL_image for ligament diameter measured by the proposed method,
dP_image for pore diameter measured by the proposed method,
dL_tomo for ligament diameter measured by high-resolution X-ray microtomography and
dP_tomo for pore diameter measured by high-resolution X-ray microtomography. Through descriptive statistics basic statistical variables were defined: average, standard deviation, minimum, maximum, and coefficient of variance. The normality test defines that the data have a normal distribution for selected parameters (pore diameter and ligament diameter), which is often the case with values produced by measurements. The average value of
dL_image is 0.514 mm with a standard deviation of 0.06 which represents a variation of 12.32% over the average. For comparison, the average value of
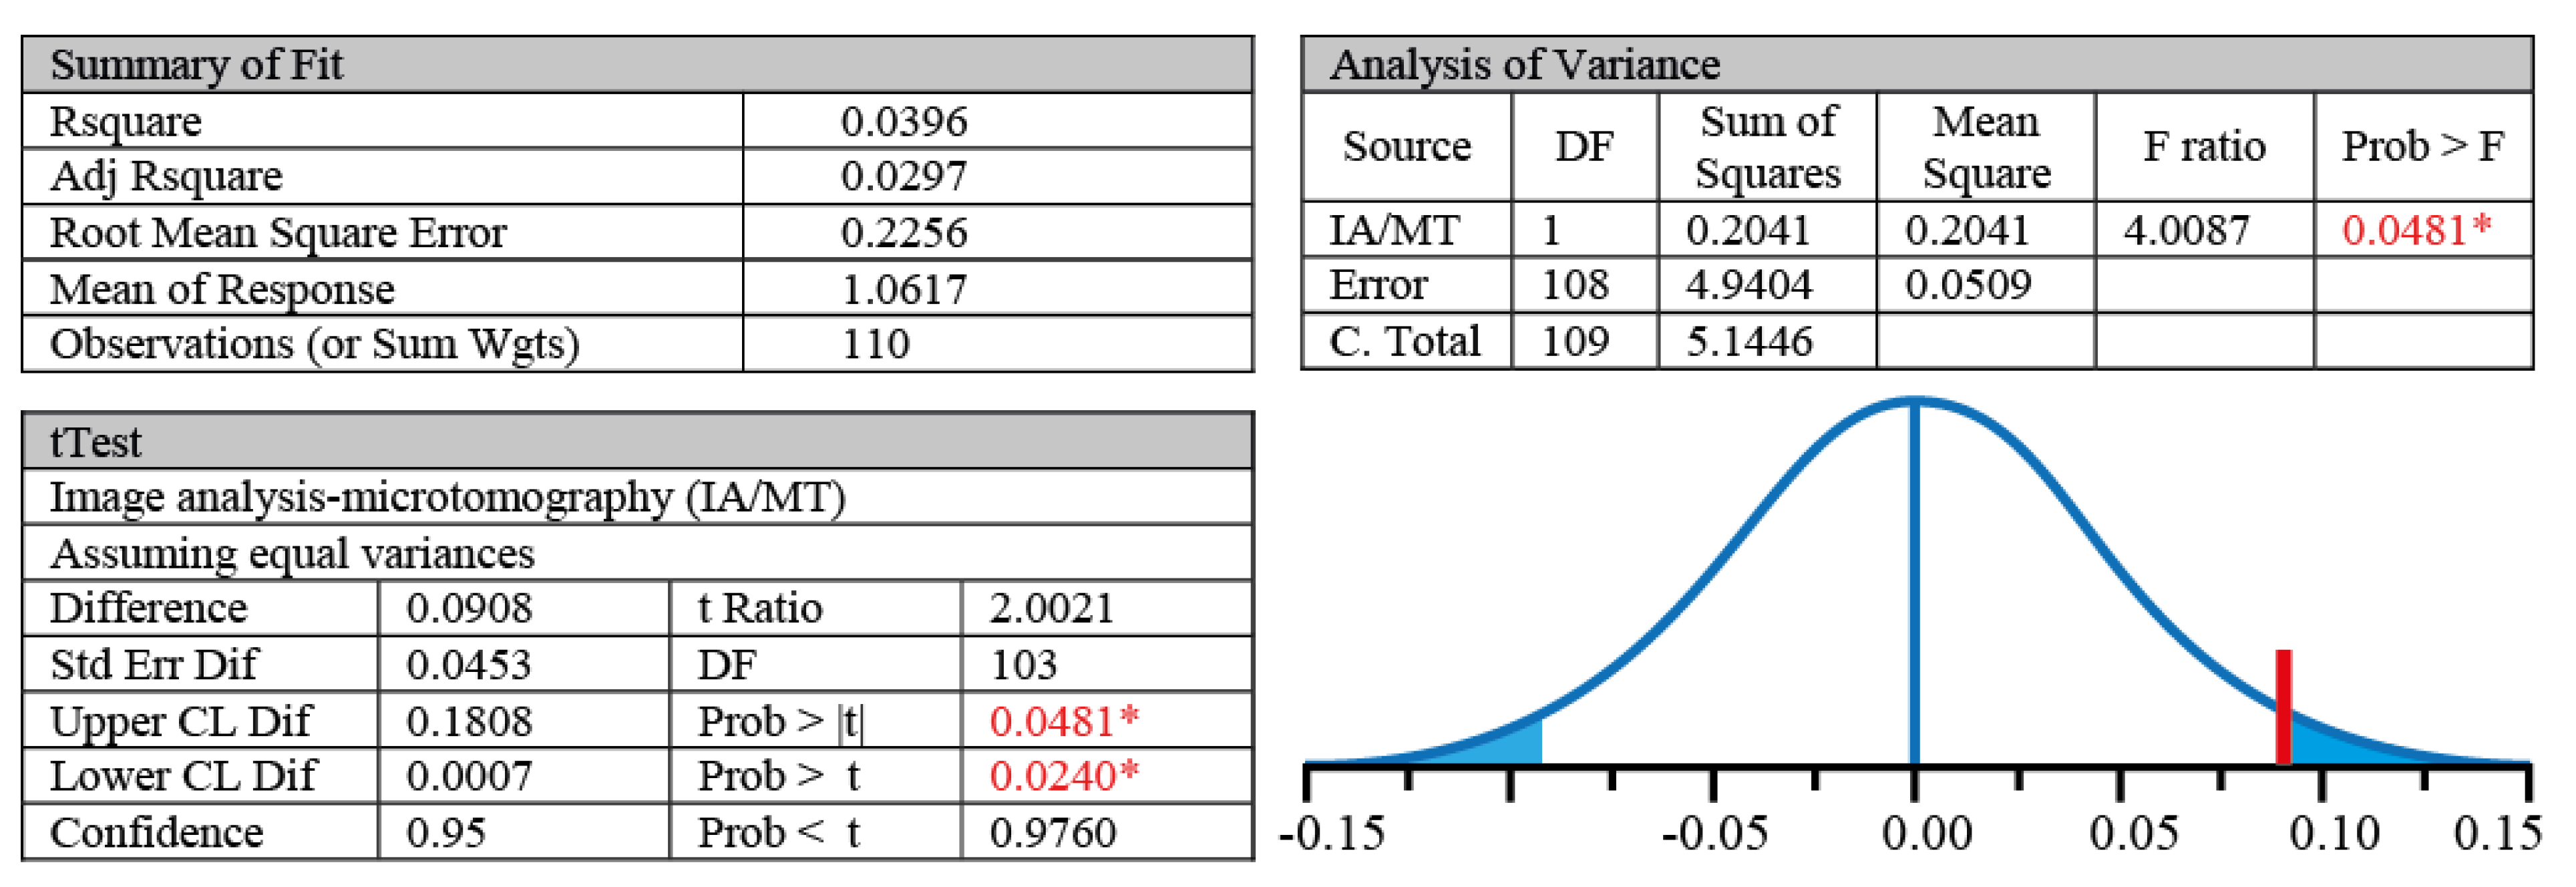
dL_tomo is 0.502 mm with a standard deviation of 0.04. If we take into account that the results of the tomography represent the most accurate picture of the monitored parameters, then higher values of standard deviations suggests that the proposed method has a slightly lower accuracy, but according to results of descriptive statistic and ANOVA test presented in
Figure 5 this difference is not statistically significant. The average value of
dP_image is 1.097 mm with a standard deviation of 0.23 which represents a variation of 21.81% over the average. For comparison, the average value of
dP_tomo is 1.016 mm with a standard deviation of 0.22. Based on the presented data of pore diameter, it can be stated that both methods of measurement achieved almost the same variability. Its higher value, compared to
dL datasets, resulted from the nature of the metal foam that is formed by the two types of pores—hexagonal and square—and therefore, a wider variance was measured as can be seen in min and max values in
Table 3.
By comparing both methods of measurements it is possible to find that the average value is higher when measured by the proposed novel method. This difference is considered borderly statistically significant, as is confirmed by the outcome of ANOVA analysis in
Figure 5.
The confidence intervals for average values at a significance level of α = 0.05 are in the range <1.029, 1.165> mm for dP_image value, and in the range <0.954, 1.079> mm for dP_tomo value.
Uncertainty Analysis and Error Propagation
An important part of the presented paper is the calculation of the method accuracy. Uncertainty and error propagation were analyzed using the Kline–McClintock method according to Equation (1). The analysis includes several possible inputs of uncertainty in the final results. The first is the accuracy of the used precision ruler
δlruler/lr, which is set by the manufacturer to ±0.05 mm. The second option is an inaccurate determination of the scale in the image analysis software
δlsc/lsc, where it is necessary to correlate the displayed pixels and the known distance, in this case, the millimeter read from the enclosed precision scale. Considering the scaling procedure in the image analysis software, the uncertainty is set to ±1 px (half of the pixel for each boundary line), which is 0.0334 mm. The last possibility of entering the error is determining the edge of the pore,
δdedge/dedge. In this case, the error rate was set to ±2 px (one pixel in each direction), which is 0.0667 mm.
Based on Equation (1), the results errors were calculated for a pore diameter at an average of ±0.149 mm and for ligament diameter at an average of ±0.151 mm. The overall accuracy of the results obtained in the VGSTUDIO MAX software is according to available studies 0.00285 mm [
31].
The measurement outputs were used to calculate the specific surface area of the metal foam sample according to equations presented in
Table 1, except Smorygo et al. [
24] since it uses a cell diameter that was not determined in this work. The results of the calculation show the trend of small deviations within the applied methods of determining geometric characteristics (proposed versus microtomography), the smallest deviation was 2.3% and the largest 12.17%. It is also possible to observe the fact that the results are considerably different when using different equations. This low level of compliance is caused by different approaches to simplifying the geometric representation as well as the suitability of the calculation used for a particular type of metal foam. Significant differences in results using the equations from Alazami et al. [
21] and Giani et al. [
23] are caused by the aforementioned elongation of the pores into an oval shape. This shape is not entirely consistent with the geometric model used in the calculations of Alazami et al. [
21] and Giani et al. [
23]. The results of the specific area calculation are summarized in
Table 4.
The above-presented results show that the method proposed by the author achieves relatively accurate results compared to microtomography, but at a fraction of the cost and with equipment, which is available and universally applicable to other activities related to scientific work. The approximate cost of the equipment used in the author’s proposed method is on the border of a thousand euros. With the use of microtomography, it is possible to speak of a price of several hundred thousand euros and with the use of SEM several tens of thousands of euros. Based on the speed of development and changes in image output quality, it is also expected that the method proposed by the author will achieve an even greater degree of compliance with microtomography, mainly as a result of increased sharpness of images and reduced noise.
4. Conclusions
The paper deals with the basic geometrical characteristics of metal foam, which include mainly pore diameter and ligament diameter. In many cases, these characteristics provide input to the calculation of the other important parameters of the metal foam, such as a specific surface area or the calculation of the pressure drop of the flowing medium. The basic geometrical characteristics can be determined by various techniques, the most commonly used are the use of optical microscopes, SEM and microtomography, which are, however, very expensive and therefore in many parts of the world unavailable. In this paper, the authors proposed an economical non-destructive method of determining the basic geometric characteristics and dimensions using available and universally usable devices, the main idea being the use of available photo technics and image analysis software. The inaccuracy of the proposed method, given both by the inaccuracy of the used equipment and the errors resulting from the work in the image analysis software, was calculated to be ±0.150 mm. In the evaluation of the proposed method, a comparison with microtomography was made, where the results of the descriptive statistical analysis indicate a high degree of agreement considering the ligament diameter measurement and a slightly lower degree of agreement considering the pore diameter. The results were also compared in the calculation of the specific surface area of the metal foam sample, where the difference between the methods ranged from 2.3 to 12.1%.


