Article

Development and Results from Application of PCM-Based Storage Tanks in a Solar Thermal Comfort System of an Institutional Building—A Case Study

1
Departamento de Química y Física, Universidad de Almería, 04120 Almería, Spain
2
CIESOL, Joint Center University of Almería-CIEMAT, 04120 Almería, Spain
3
Faculty of Mechanical and Power Engineering, Wrocław University of Science and Technology, Wybrzeże Wyspiańskiego 27, 50-370 Wrocław, Poland
4
Department of Chemical Engineering and Mineral Processing, and Center for Advanced Study of Lithium and Industrial Minerals (CELiMIN), Universidad de Antofagasta, Antofagasta 02800, Chile
5
Departamento de Ciencias Exactas e Ingeniería, Universidad Católica Boliviana San Pablo, Unidad Académica de Cochabamba, Cochabamba, Bolivia
*
Author to whom correspondence should be addressed.
Energies 2020, 13(15), 3877; https://doi.org/10.3390/en13153877
Submission received: 26 May 2020 / Revised: 13 July 2020 / Accepted: 27 July 2020 / Published: 29 July 2020

Abstract

:
An important element of a solar installation is the storage tank. When properly selected and operated, it can bring numerous benefits. The presented research relates to a project that is implemented at the Solar Energy Research Center of the University of Almeria in Spain. In order to improve the operation of the solar cooling and heating system of the Center, it was upgraded with two newly designed storage tanks filled with phase change materials (PCM). As a result of design works, commercial material S10 was selected for the accumulation of cold, and S46 for the accumulation of heat, in an amount of 85% and 15%, respectively. The article presents in detail the process of selecting the PCM material, designing the installation, experimental research, and exergy analysis. Individual tasks were carried out by research groups cooperating under the PCMSOL EUROPEAN PROJECT. Results of tests conducted on the constructed installation indicate that daily energy saving when using a solar chiller with PCM tanks amounts to 40% during the cooling season.

Graphical Abstract

1. Introduction

The use of phase change materials (PCMs) has become more common due to the increase in the application of renewable energy sources, and thus the need to accumulate heat. The topicality of this issue is demonstrated by the amount of current research that is devoted to materials and systems with PCMs. These solutions are used, among others, to reduce energy consumption in buildings. There are many ways of applying PCMs. This material can be placed in walls or floors, as well as in thermal storage tanks [1,2,3]—such a solution is one of the most common areas of research and analysis.
Tanks filled with phase change material can accumulate heat or cold, and in most cases cooperate with solar installations. H. Huang et al. in [4,5] studied a thermal storage tank containing sodium acetate trihydrate. The analyses concerned the effect of the positions of the PCMs on the thermal stratification of a water tank at various flow rates. S. Bazri et al. in [6] examined a tank filled with three different materials (from the paraffin wax group), and performed tests for different flows. The tank was connected to a solar collector. The system’s energy efficiency, which is calculated as the total energy in relation to solar radiation, was in the range of 36–54% on a typical sunny day for all three types of PCMs, and increased to 47–58% on a typical cloudy/rainy day [6].
A lot of research involves simulations for existing buildings in order to evaluate the benefits of using phase change material. J. Zhao et al. in [7] performed simulations of a public building in Lhasa. The results show that a solar heating system with a PCM tank provides a 34% increase in energy saving capability when compared to an ordinary water tank heating system. The analyzed materials were lauric acid, paraffins, and hydrated salts. R. Stropnik et al. in [8] presented experimental studies on the improvement of sensible thermal energy storage with implemented cylindrical modules filled with PCM (RT 28 HC). The comparative analyses were conducted for a tank with water and a tank that was filled with 15% and 40% of PCM. As was predicted, the smallest storage tank volume with regards to stored energy at a temperature difference of 25 K was obtained for the tank filled with 40% of PCM, and it amounted to about 1.4 m3. In turn, for the tank filled with water it was equal to about 2.1 m3. S. Lu et al. in [9] analyzed the work of a tank with two different PCM materials that had different melting points. The results show that this type of solution significantly reduces the charging time of a tank due to the better use of the potential of the power source. E. Mahboob et al. in [10] presented experimental studies for PCM (hydrated salts) enclosed in spheres of two different sizes. Analyses were performed for three different aspect ratios. The authors described the obtained results as guidelines for the design of thermal storage, which is based on phase change material, for solar thermal applications.
D. Lafri et al. in [11] described research concerning two storage tanks of the same volume with different filling positions of PCM (paraffin). In the first tank, the PCM was integrated directly with the walls of the tank, whereas in the second tank it was placed in a tube that was located in the central axis of the tank. The results showed that the material melted twice as fast in the second configuration.
M.Y. Abdelsalam et al. in [12] presented numerical studies of a tank with both PCM (organic fatty acids) and direct and indirect heat exchange systems. The results showed that the storage system with direct heat exchange operates with an 18–23% larger solar fraction, and that the addition of PCM modules in the water tank with a 50% volume fraction can yield a potential reduction of around 40% in the storage volume.
A lot of research conducted around the world also concerns the possibility of improving the heat exchange process in PCM bed storages through various additions and design solutions, such as the use of ribs [13], aluminum foam [14], metal honeycomb structures [15], or the cascade system [16,17].
Based on the presented articles, it can be concluded that solutions based on the placement of PCM in water tanks dominate, and are the easiest to attach to both new and existing installations. However, in the case of the simplest methods of increasing the operating parameters of an installation, the use of two different materials in one tank should also be considered.
Most of the presented scientific papers are either theoretical or made on a laboratory scale. There are also articles from studies carried out on real building objects. W. Lin et al. in [18] presented a water-based thermal energy storage unit that uses phase change materials implemented in the HVAC system of a net-zero energy Solar Decathlon house. The PCM material used is S10. Research results show that, due to the appropriate optimization, the thermal energy storage density can be improved from 13.58 to 26.47 kWh/m3. In the cited article, the optimization was based on the use of Particle Swarm Optimization and the Hooke–Jeeves algorithm to maximize its thermal energy storage density for fast charging [18].
I. Henne and K. Midtomme in [19] described an installation that has been operating since 2014 at the University of Bergen in Norway. The system includes borehole thermal energy storage (with a heating power of 1700 kW) that has phase change material storage (with day-storage capacity from 11,200 kWh) and adiabatic pre-cooling. The used PCM material is S10. The results show that the peak cooling load was reduced by about 50% due to the PCM-storage [19]. Another research group from this university described, in an article written by M. Jokiel et al. [20], the operation of PCM cold storage tanks, which successfully reduce the required three ammonia chiller capacity.
G. Englmair et al. in [21] described a heat-storage prototype consisting of a 735 L water tank and four PCM units, each containing 200 kg of sodium acetate trihydrate composite. The solar installation with accumulation is used for the space heating and hot water demand patterns of a standard-size Passive House in the Danish climate. The authors showed that the heat stores were efficiently utilized in spring and autumn.
The publications that describe the experience of researchers regarding the work of existing systems with an accumulation of heat in PCM indicate the advantage of such systems over conventional systems, and also point to a significant seasonal reduction in heating and cooling demands. Therefore, it seems that despite the high investment costs in relation to water accumulators, it is worth developing and using this technology in already existing installations.
This article also applies to the existing solar heating and cooling system of a research building located in the south of Spain in Almeria. As part of the awarded grant, a number of works were completed, including the equipping of the building’s installation with two tanks filled with phase change material. The further part of the article will involve a description of the following steps, which are shown in Figure 1:
  • the principle of operation of the solar heating and cooling system before modernization, which is located at the University of Almeria in Spain (project leader location),
  • the selection of phase change material by a group from the University of Antofagasta in Chile,
  • the calculation of the building’s energy, and the selection of the tank size and PCM material, which was carried out by a group from Wroclaw University of Science and Technology in Poland,
  • the experimental research of the modernized system, which was carried out by the project leader group,
  • the exergy analysis performed by the Bolivian Catholic University in Bolivia,
  • a summary and conclusions from the conducted research.

2. Project Description

The project “Thermal energy storage with phase change materials for solar cooling and heating applications: A technology viability analysis” (PCMSOL) aims at development and implementation in an actual facility of new materials for thermal storage in the form of latent heat, including the modelling of the PCM containers and storage tanks, and the analysis of the performance of the tanks. The newly developed storage system is incorporated in the solar cooling and heating system (SCH) previously installed in the Solar Energy Research Center (CIESOL). The center is a joint center between the University of Almeria and the Center for Energy, Environment and Technology (CIEMAT) located on the campus of the University of Almeria. The two-story CIESOL building comprises an area of 1100 m2 with 10 laboratories, five offices, and one conference room. The workplace, entrance hall, and all corridors do not have the cooling service, and therefore only 389 m2 of the building surface is cooled/heated by the SCH system.
The climatization system was originally supported with thermal storage tanks working with liquid water, and the final goal of the present project was to incorporate a storage system based on a phase change material (PCM) both for the purpose of cooling and heating.
Due to the specific location of Almería in south Spain, the cooling demand (in summer) is much larger than the heating demand (in winter). Thus, the main focus of our research involves thermal storage for cooling, although both cases were considered. The refrigerant (water) is cooled down in a chiller manufactured by Yazaki co., following an absorption cycle working with a LiBr–H2O solution. The hot water entering the cycle is heated up in an array of solar collectors and stored in two tanks, as further explained below. For the heating mode, this hot water is driven to a heat exchanger where it heats up the water that is fed to the fan-coils.
The project is structured in five main work packages (WP) that deal with the different research steps, the coordination and dissemination plans, as well as some external tasks (such as the preparation of a business model). The main WP of PCMSOL are as follows:
  • WP1: Selection and enhancement of materials;
  • WP2: Modelling of the melting and freezing transitions of single encapsulated PCM;
  • WP3: Simulations of cold and hot storage tanks based on encapsulated PCMs units;
  • WP4: Exploitation;
  • WP5: Feasibility analysis and life cycle assessment.

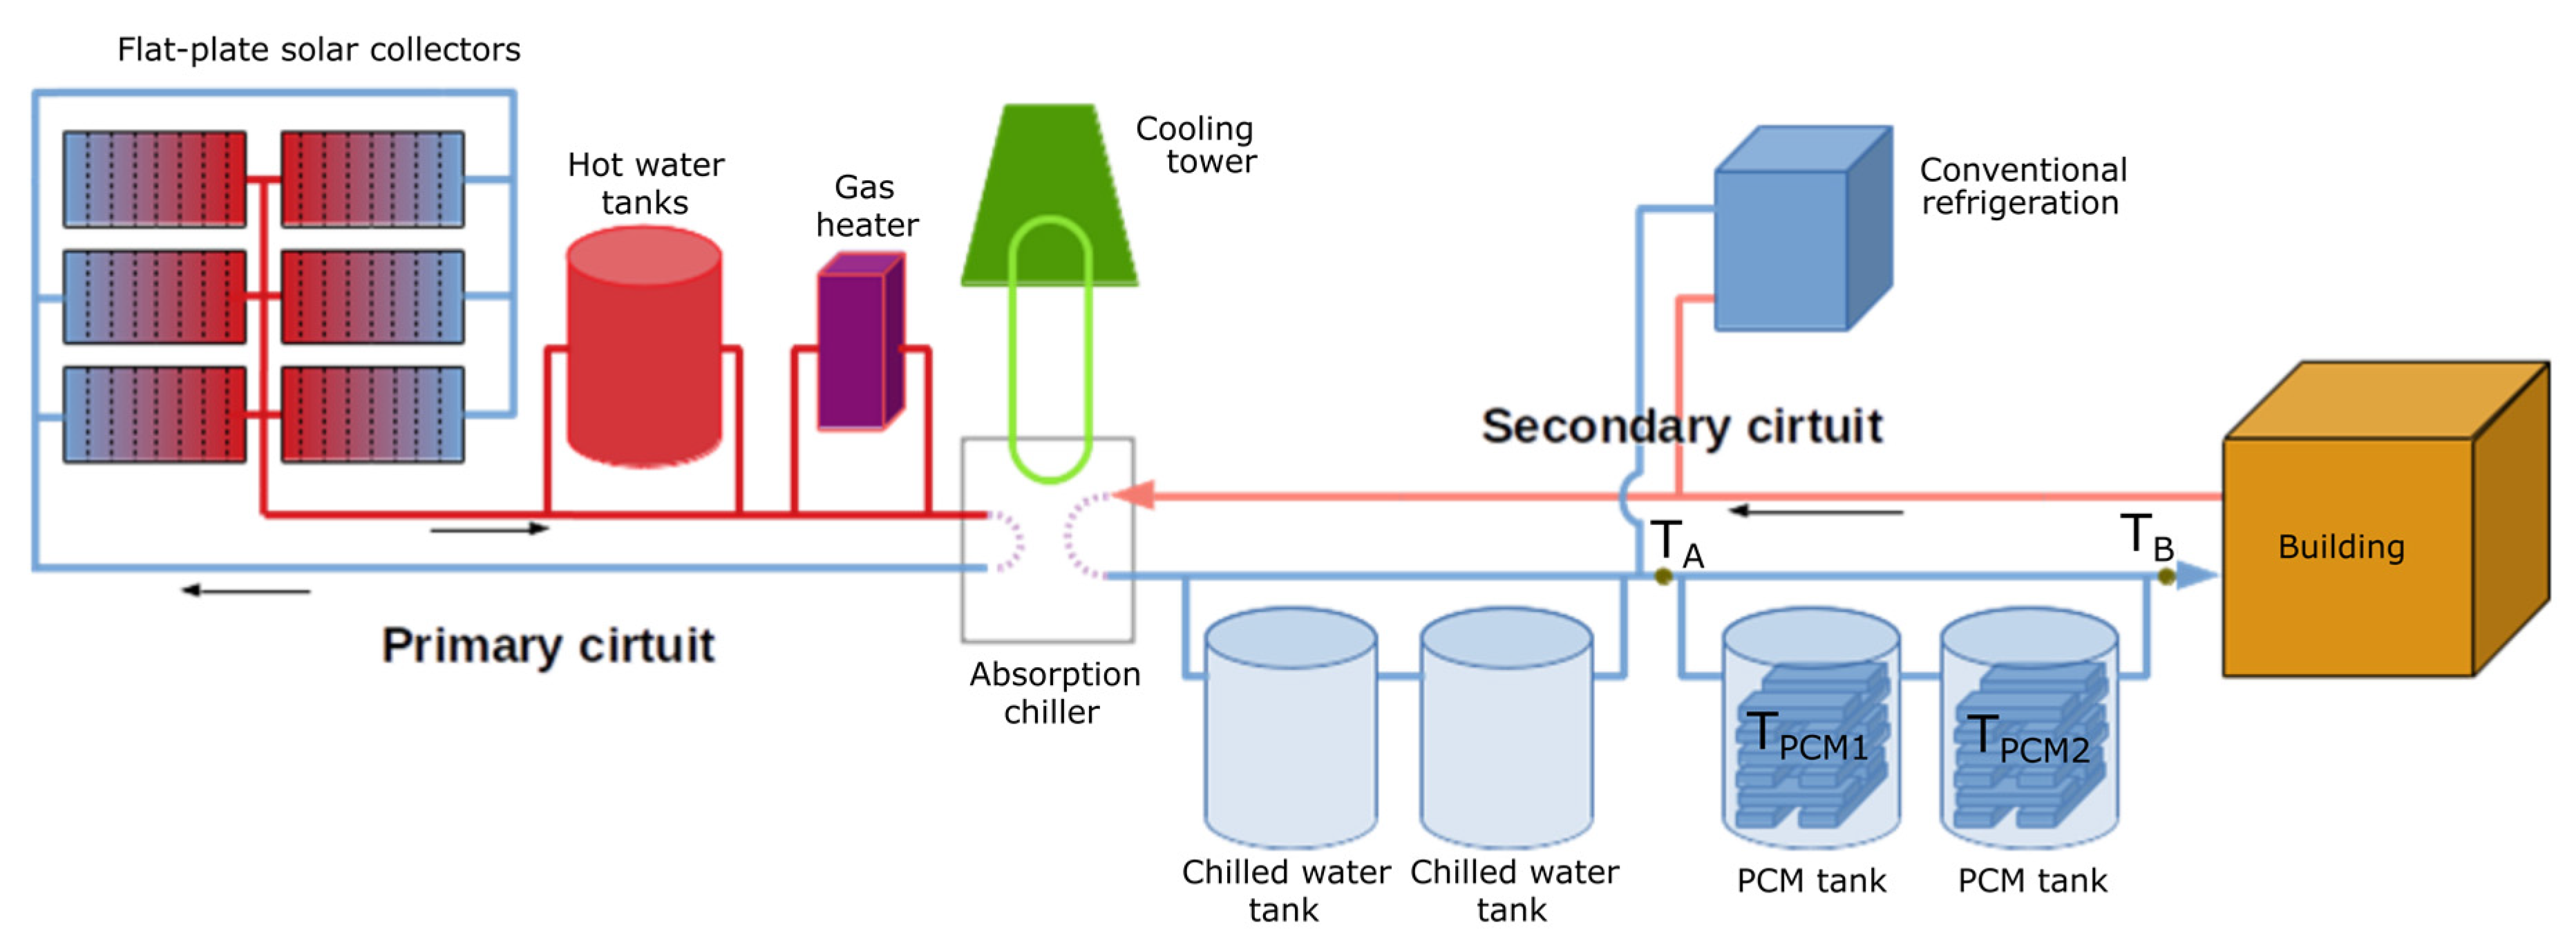
Heating and Cooling System of the CIESOL Building before Changes

The SCH system installed in CIESOL prior to the start of the project consists of a flat-plate collector array facing due south and tilted at an angle of 30° to the horizontal plane. The system has a total surface area of 160 m2, a hot water driven single-effect LiBr-H2O absorption chiller, a cooling tower, a shallow geothermal heat dissipation system, two hot water storage tanks (each with a 5000 L capacity), two chilled water storage tanks of 2000 and 3000 L, an auxiliary gas boiler, a plate heat exchanger, and peripheral equipment such as valves and pumps.
Due to Almeria’s particular meteorological conditions, the SCH system also makes a contribution to CIESOL’s heating for 5 months of the year (from November to March). In winter mode, the building’s water supply temperature is over 45 °C, covered mainly by the solar field with the help of the storage tanks. In turn, in summer mode, the building’s water temperature supply is between 7 and 12 °C in order to cover CIESOL’s cooling load. Figure 2a illustrates the system’s general layout with the minimum and maximum temperature range of each component operating in the summer. To produce chilled water in the desired temperature range, it is necessary to supply the absorption chiller with hot water of between 70 and 95 °C; this is mainly obtained from the solar collector array. When the solar hot water temperature is too low, the warm water from the hot water storage tanks can be used; otherwise the auxiliary heater is used to drive the absorption chiller. In winter, a fundamental necessity is to provide hot water between 40 and 45 °C. To provide the building’s distribution network with water at this temperature, we supply the plate heat exchanger with water at around 65 °C. Figure 2b illustrates the general layout of the SCH system operating in winter, with the minimum and maximum temperature range of each component. Hot water flowing from the solar collector array, and hot water storage tanks (or the auxiliary heater) can be used to fulfill this goal.

3. Materials and Methods

This section describes the stages of designing the system, which include the selection of phase change material for heat and cold storage; experiments and numerical simulations of a single nodule containing the PCM material, calculations of the heat and cold demand in the building of the CIESOL, and also mathematical modelling of the process of discharging tanks during the summer and winter seasons.

3.1. Strategy for Design and Selection of Material

The selection of phase change materials was made based on the working conditions of the CIESOL building and their commercial availability. For cooling operational mode, the temperature varies in the range from ca. 6 °C, the output temperature of the solar-driven cooling machine, to 15 °C, the maximum temperature of the working fluid fed into the fan-coils, was considered. This range sets the optimal melting temperature of the PCM for this application at 9–12 °C, with only a small subcooling allowed. For the heating application, a wider operation range is found. Currently, the system is operated from 40 to 50 °C, but it is possible to extend the range to higher values, reaching up to 60 °C.
Initially, the search in the literature for previously developed materials that can be used for our application, with the requirements mentioned above, as well as commercially available PCMs, was made. At the same time, in order to increase the number of possible materials, and improve the applicability to CIESOL’s working conditions for cooling, new eutectic mixtures were modeled using the modified Brunauer, Emmettt, and Teller (BET) model. This theoretical prediction allows the activities of salts in water for a multicomponent system to be calculated, and has the ability to predict phase diagrams and compositions for eutectic mixtures of highly soluble salt hydrates [22,23]. The group of salts to form eutectic mixtures was selected while taking into consideration that the modified BET model is applied to salts with the common cation or anion, and also that it is necessary to know the model’s parameters, mixing coefficients, and an equation that describes the dependence of the equilibrium constant with temperature. Moreover, the salts that are selected as components of the eutectic mixture must have stable thermal properties and be commercially available. The compounds, which meet all the selection criteria set in this study, were salts with the common nitrate anion. Based on modeling results, the two most promising mixtures, according to their latent heat and melting temperature were studied experimentally. Details on the modelling results and the characteristics of their thermophysical properties are shown in Figure 3 and summarized in Table 1.
In this way, two new designed mixtures, based on Li/Mn/Na and Li/Mg/Mn nitrate salts and water, with a melting temperature predicted at 10.8 °C, were proposed as candidates for the PCM for the storage tanks to be installed in CIESOL. The cost evaluation for both samples indicated that it was close to the average values of commercial PCMs (USD 30 per MJ) [22].
For the design and selection of the PCM for heating, the final price of material was considered, in addition to CIESOL working conditions and availability. The strategy for creating the new PCM was to use the eutectic mixture composition from [24] and to replace magnesium chloride hexahydrate with bischofite. Bischofite is a waste mineral obtained during nonmetallic mining activity in the north of Chile. It contains MgCl2·6H2O as the majority component, and 5% (approximately) of different inorganic salts as impurities (see Figure 4).
This waste material was studied as a possible PCM at different scales, from laboratory to pilot plant [25,26], demonstrating that bischofite has similar thermophysical characteristics to synthetic MgCl2·6H2O, but a lower cost. Thus, the replacement strategy was applied, and the proposed novel low-cost mixture based on Mg(NO3)2·6H2O/bischofite had a melting temperature of 58.2 °C and the heat of fusion of 116.9 kJ·kg−1. The details of their thermal and physical properties, as well as their characterization and optimization can be found in [27,28].

3.2. Modelling of the Melting and Freezing Transitions of Single Encapsulated PCM

The PCMs developed in WP1, in addition to the other two commercial candidates, were encapsulated in polymeric containers in order to study their performance. A single spherical nodule was placed in a thermostatic bath, and the kinetics of freezing and melting were studied while monitoring the temperature in several locations inside and outside the nodule. The range of temperatures used in these experiments was equal to the operating conditions in CIESOL. These types of studies also allowed us to perform an aging analysis of the new materials by repeating a large number of melting and freezing cycles. Figure 5 shows a photograph of the experimental setup. Further details on the experimental layout can be found in [29].
In addition to the experimental studies, the kinetics of the phase transition were modelled using computer simulations with the physical parameters obtained in the characterization of the materials. A new technique was developed, based on the MonteCarlo method of trial configurations, to effectively model convection in the liquid phase. This methodology is much faster than modelling the full velocity profile, and requires only two additional parameters that can be fitted easily. The method was validated after studying the melting and freezing of water used as PCM encapsulated in different containers or temperatures [29]. The enthalpy method was used to model the phase change, fitting the temperature range of the phase change to the experimental data; whereas a temperature gap of ΔT = 1.5 °C was necessary for the PCM developed within the project, the S10 PCM required a much smaller range, 0.5 °C.
Figure 6 shows the kinetics of melting and freezing of the Li/Mn/Na PCM, which was developed in WP1 for the cooling application, in comparison with the commercial one, S10, from PCMproducts Ltd. (see below for details). The kinetics of the phase transition is monitored by a temperature probe in the center of the nodule. Experimental and simulation results are compared in Figure 6, with good agreement between them. In the simulations, the physical parameters of PCM-cold, and S10, were used as provided, except the latent heat of S10, which was reduced significantly to L = 25 kJ/kg. Convection, due to the high viscosity, was not relevant in both PCMs. The comparison between the PCMs shows that the PCM developed within the project has much longer charging and discharging times (and also a larger heat storage capacity). The PCMs have similar freezing temperatures.
As discussed below, two commercial PCMs for both working conditions were selected with regards to the thermodynamic properties, aging behavior, ease of preparation, and price. Despite this choice, our experimental and simulation results indicate that the PCM for cooling, which was developed within the project, has a large application potential.

3.3. Building Needs Calculations and System Design

The demand for the building’s cooling capacity results from the heat gains going through its external partitions and the heat generated inside the building. External heat gains (through the building envelope) were calculated using the climatic data of a Typical Meteorological Year (TMY) for the actual location of the CIESOL building. They contained heat flux resulting from the building’s solar exposure, temperature difference, and the building’s foundation on the ground in accordance with EN 12831-1:2017 [30]. When calculating these gains, it was assumed that the temperature inside the building (tIN) follows the temperature of the outside air (ta) and meets the criterion described by Equation (1). At the same time, it was assumed that this temperature could not be lower than +21 °C throughout the year.
t I N = t a + 20   ° C 2
For the calculation of internal heat gains resulting from the activity of people, lighting and ventilation, the data presented in [31] were used. The necessary amount of ventilation air was determined both by the number of air changes and the amount of fresh air per person, assuming 30 m3/(h × person).
The calculations showed that the maximum required cooling power is definitely higher than that for heating, and amounts to 61.4 and 24.8 kW, respectively (Figure 7). This is due to the fact that the CIESOL building is heavily burdened with internal gains, which account for up to 40% of the total heat gains, as described in [32]. The average daily demand for cooling power in summer reaches 40 kW, while in winter the average demand for heating power does not exceed 10 kW. Figure 7 also contains the profile of the average monthly demand for cooling and heating power, which again shows that the key to thermal comfort inside the CIESOL building is the correct adoption of the cooling strategy. The daily consumption of cooling and heating power during the year is shown in Figure 8. There is a huge imbalance between cooling and heating. Cooling is required for nine months of the year, while significant heating is only needed in December, January, and the first half of February. The maximum consumption of cooling is close to 1 MWh/day, and falls in the middle of July. Moreover, almost 70% of the total cooling power consumption is from June to September.

3.4. Mathematical Modelling of Heat Transfer Processes

The tanks with the PCM should cover the heating and cooling demands described in Section 3.3 for the longest possible time. In order to determine the working time of the tanks with the PCM, a calculation algorithm was created for their discharging process. This model included balance equations of the heat exchange between the water flowing through the tanks and the PCM, as well as the heat losses from the tanks surface. Due to a small difference in temperature between the inside of the tank and the environment, which is usually equal to 18 °C in the summer and 22 °C in the winter, the loss flux from the tank is small when compared to the heat flow transferred between the water and the PCM. Therefore, these losses were not further analyzed.
An important element of the model is a description of the heat exchange process between the water flowing through the tanks and the PCM placed in them. Knowing that this material was to be enclosed in commercial packaging called ICEFlat from the PCMProducts Company, which was meant to be arranged in layers, a 1D model was created to describe the heat losses from the tanks, in which the temperature changes with the direction of water flow. In addition, a 1D description of the heat exchange process between the water and the PCM was made. It was assumed that heat is transferred only through the largest surface of the PCM packaging, and the phase change front moves from the packaging wall to its center. The natural convection in the PCM was replaced by thermal conductivity, and the thermal resistance changed as the phase change front moved. The algorithm was finished with a balance equation, which took into account heat losses from the tanks, heat flux transferred between the water and the PCM, and also the energy flux that is transported by the water. The algorithm contained a total of 30 heat exchange equations and 30 unknowns for each tank. More information about the model can be found in [33].
In these simulations, the properties of the selected PCM, the experimental flow rate, and other physical details are used, as well as previous results of the freezing and melting kinetics of a single container from a single container test. In addition, the internal status of the tanks can be monitored, especially the fraction of PCM that remains in the original phase, as was shown by the authors in [33].
In order to make the tanks useful for the heating and cooling applications, it was decided at this stage that the tanks should contain a mixture of containers for both cases. The ratio of containers of heating-PCM to total containers was also studied in the simulation model. Due to the larger demand of cooling, it was expected that a larger number of containers of the cooling-PCM was needed, but a proper analysis considering the latent heat and conductivities of the components was mandatory.
The commercial materials S10 and S46 offered by the PCMProducts Company were selected for the analysis. This is due to the fact that they correspond best to the temperature of circulating water in the heating and cooling installation, as was mentioned in Section 2. Various proportions of S46/S10 were analyzed with regards to the fact that the cooling demands are greater, as can be seen in Table 2.
The heat flux that is released by the tanks with the PCM with regards to different proportions of S46 and S10 is shown in Figure 9. In the analyzed case, the tanks were connected in series, and therefore the thermal power of the tanks that is visible in Figure 9 is the sum of the heat flux released by both tanks. The temperature of the water flowing out of the first tank was the same as the temperature of the water flowing into the second tank.
As shown in Figure 10, the thermal power of the storage tanks decreases during the discharge process. This allows the tank’s volume, its internal configuration, or flow rate to be optimized. However, it should be noted that the thermal power of the tanks is greater for heating than for cooling. This is mainly due to the larger temperature difference between the water flowing into the tanks and the PCM that undergoes the phase change.
The temperature of the water flowing out of the storage tanks is another parameter that should be controlled. It affects the correct operation of the entire heat receiving system in the building. The control of settings that switch the operation of the system from installations with tanks to a conventional system depends on the value of the temperature of the water that flows into the building. As can be seen in Figure 11, the temperature of the water flowing out of the tanks changes rapidly in the first minutes of the discharge process. This is the result of a decreasing heat flux exchanged between the PCM and the water. Due to the rapidly changing temperature of the water flowing out of the tanks with the PCM, the time of the system’s operating with these tanks is significantly reduced.
The obtained results enabled the temperature of the water flowing through the tanks, as well as the temperature and changed mass of the material inside the tanks to be determined. The authors provided a broader analysis of the impact of S46 and S10 on these parameters in [33]. On this basis, it was decided that the share of S46 and S10 would be 15% and 85%, respectively. This resulted in the preparation of tanks filled with ICEFlat containers that contained fixed proportions of PCMs, as described in Section 4.

4. Results

This section describes the process of upgrading the already existing SCH system of the CIESOL building, modifications to the control panel of the installation, and also the process of filling tanks with phase change material. In addition, it also presents the results of experimental research conducted in summer and winter, as well as the exergy aspect of modifying the installation.

4.1. Final System Configuration

The materials developed within WP1 are possible materials to be used in thermal storage. Moreover, the comparison in Section 3.2. shows that the charging and discharging times are longer than for the commercial material S10, with comparable melting temperatures. For the heating application, the newly developed PCM has a higher melting temperature. Due to the non-existence of appropriate facilities at the university for handling large amounts (about 1 ton) of inorganic salts for preparing the eutectic mixtures and also operational difficulties in encapsulating such mixtures, it was decided to purchase PCMs developed and encapsulated by the same company. For these reasons, the PCMSOL’s consortium decided that the next step of the project should be redefined, and that the PCMs to be used in the thermal storage system need to be changed for commercial ones.
Subsequently, different commercial PCMs were studied with regards to their melting temperature, latent heat, thermal stability, price, and availability. The finally chosen PCMs were S10 and S46 from PCM Products Ltd. The properties of these materials are given in Table 3.
Both PCMs are served encapsulated in triple sealed HDPE flat containers with the dimensions of 50 × 25 × 3.2 cm3, and the capsule wall has a thickness of 3 mm (the volume contained in each capsule is about 3.5 L). Each container has a total mass of approximately 5 kg (Figure 12).
Furthermore, due to the specific climate conditions of Almeria, the cooling demand of the CIESOL building is much larger than the heating one. This asymmetry in demand implies very different thermal storage requirements for both seasons. Thus, it was decided that two tanks filled with cold-PCMs, as well as hot-PCMs will be installed instead of the previously planned two separated thermal storage tanks one for heating and another for cooling purposes. The fraction of PCM for the cooling application was optimized to provide an equal storage capacity in both applications. Moreover, following the results of WP3 (Section 3.4), the optimal fraction of cooling PCM was estimated to be 85% of the total number of flat containers.
First, the layout of the general SCH system with the newly designed two PCM-based storage tanks was approved. Subsequently, the upgrading of the existing SCH system began (Figure 13). This included three main consecutive steps:
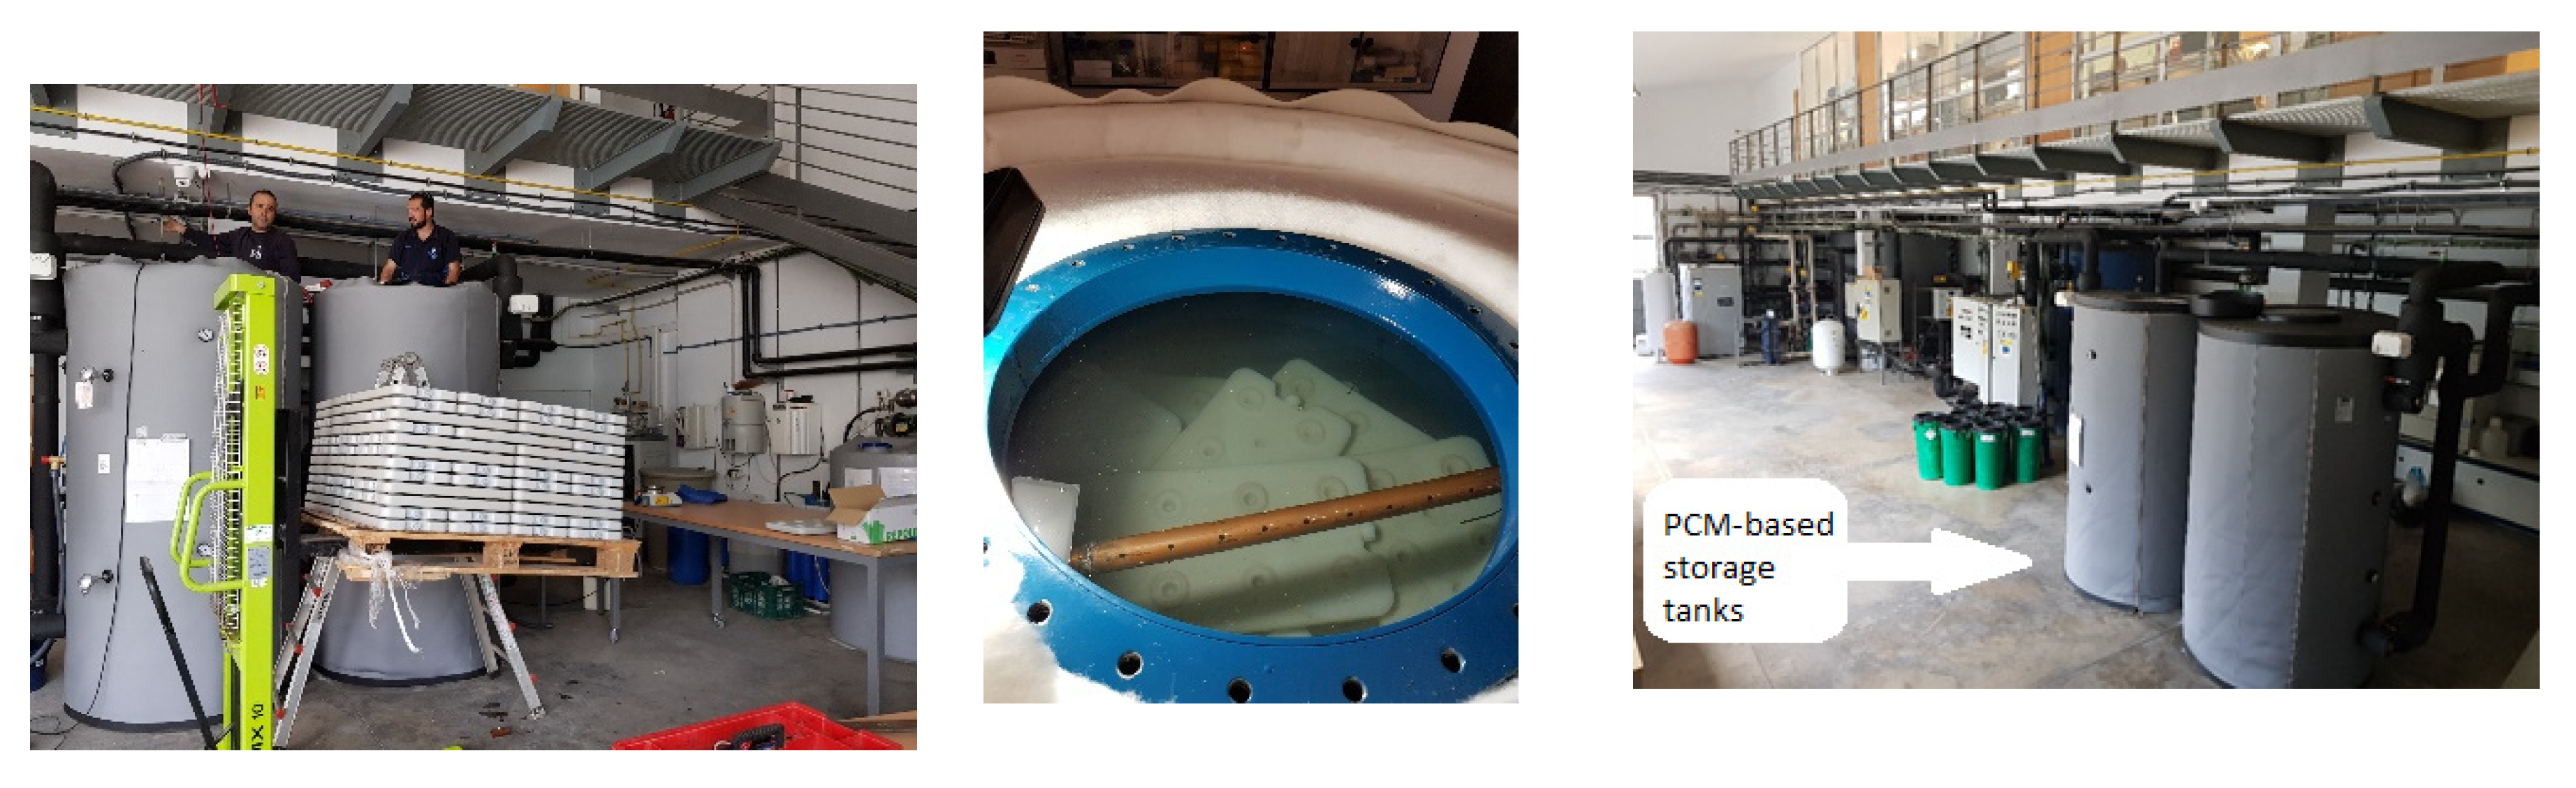
  • Installation of two vertical cylinders with a volume of ca. 2000 L each and their thermal isolation—December 2018.
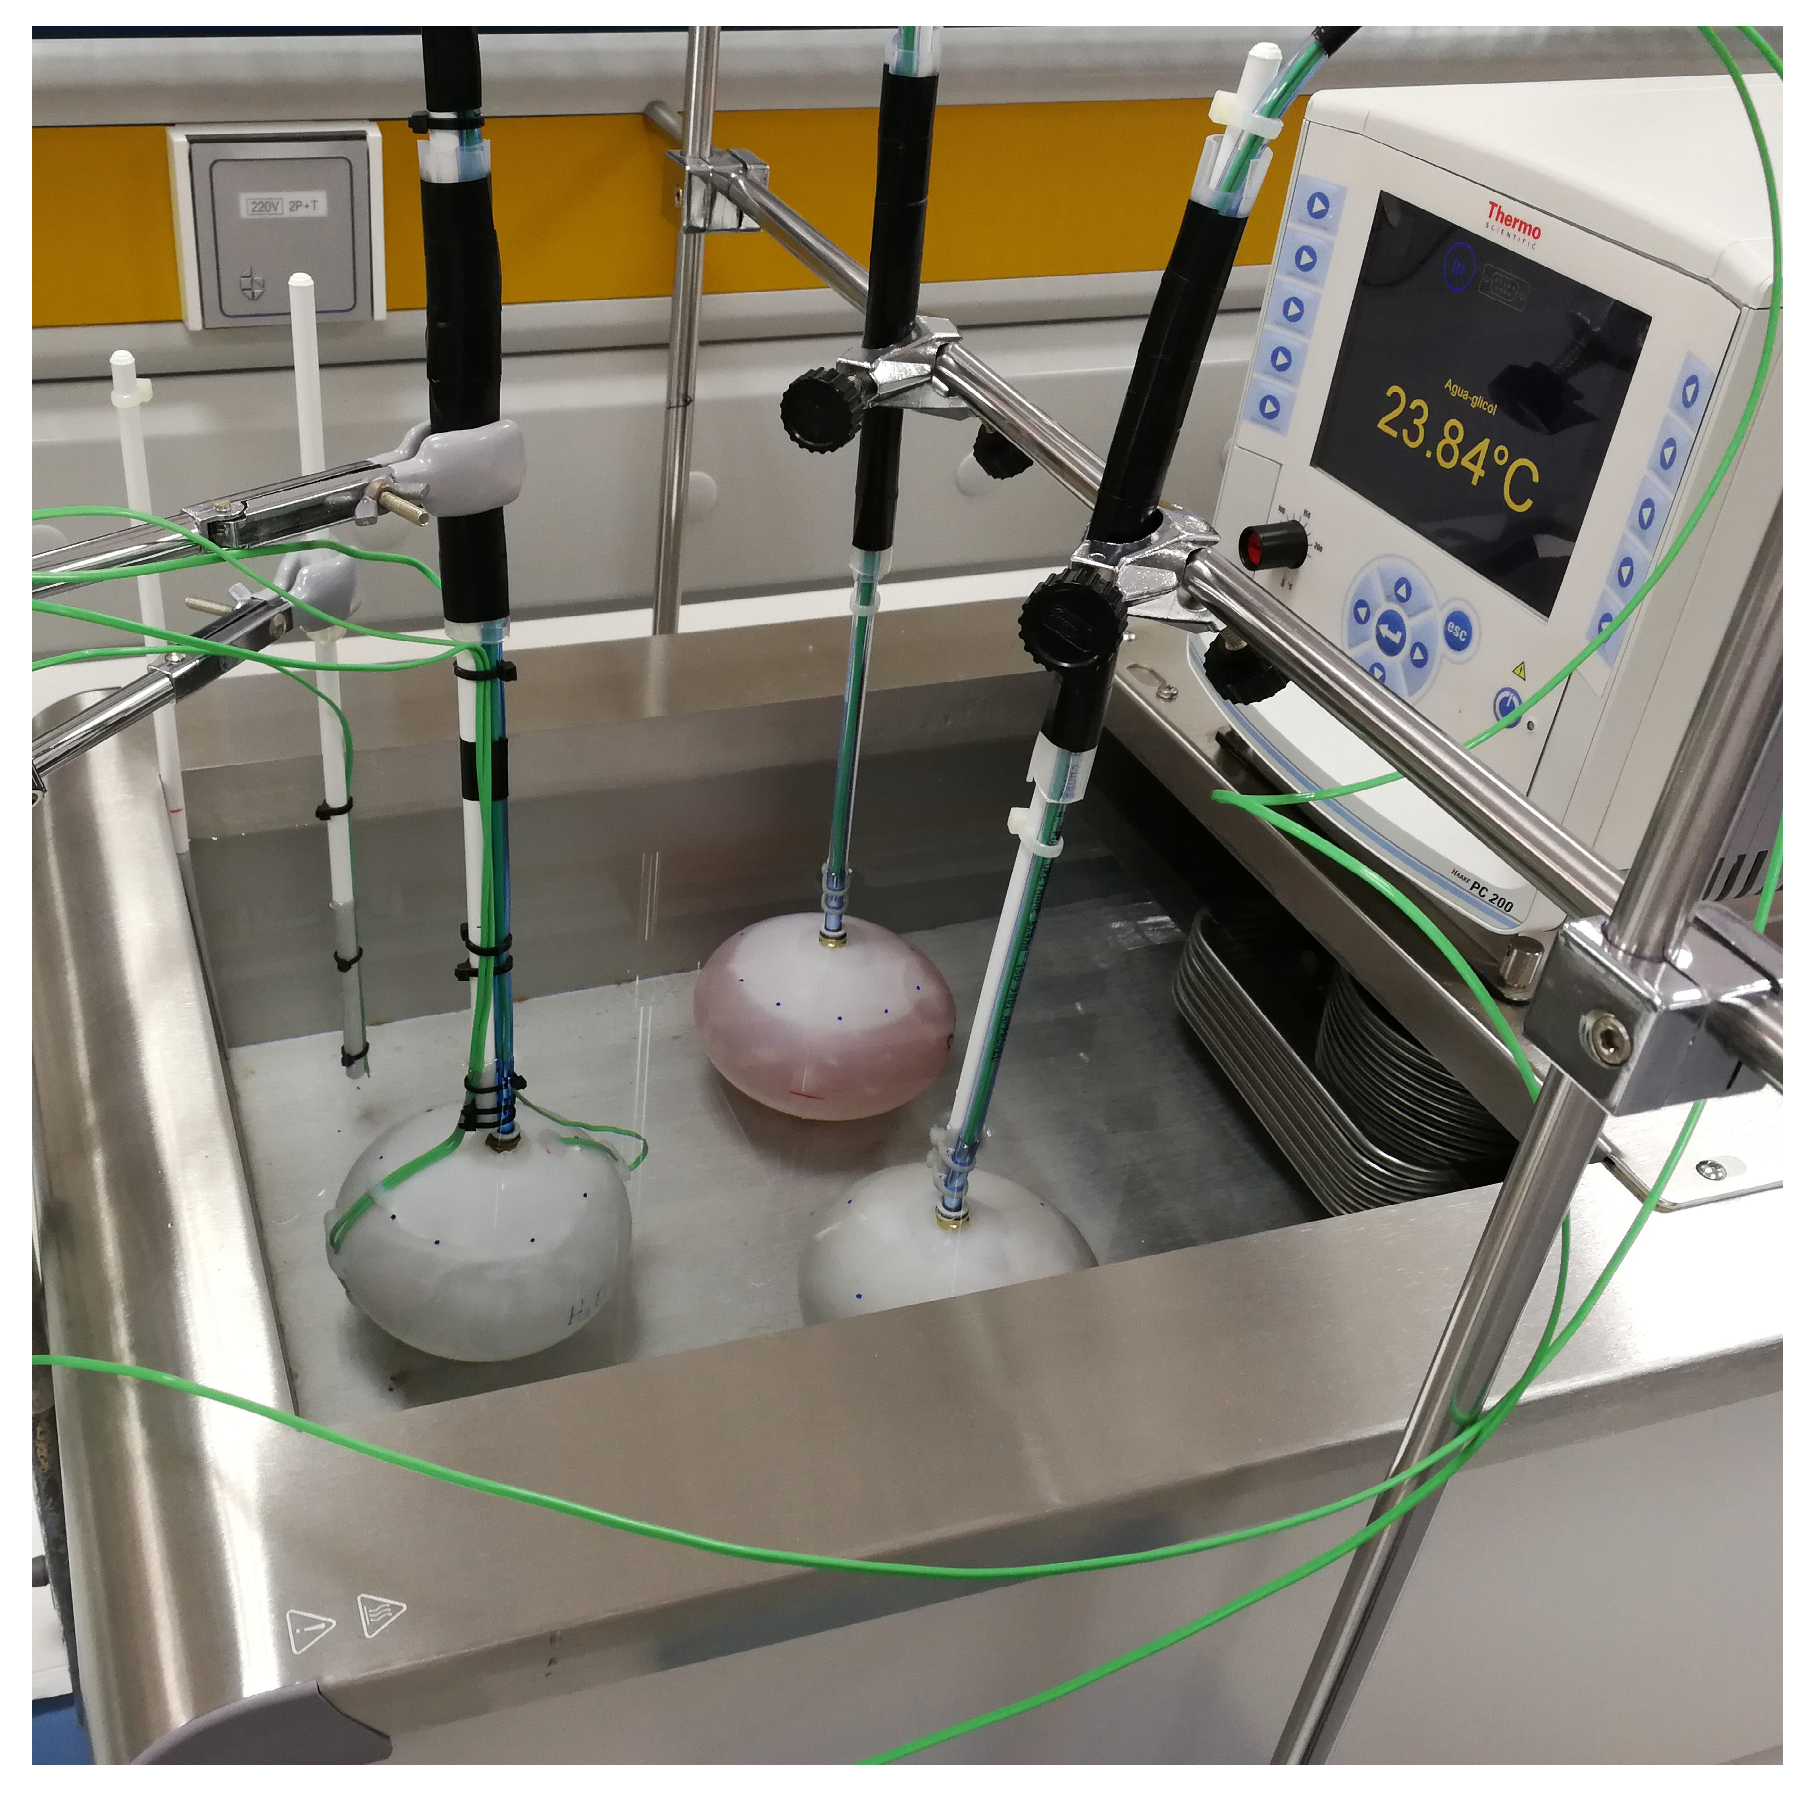
  • Filling both tanks with cold and warm PCMs, as well as water—April 2019.
  • Installation of three new three-way valves, two new temperature sensors per tank and SCADA connections for data collecting—May 2019.
The completed cooling and heating process was visualized using commercial software (https://www.sauter-controls.com/en/). The control panel provides instantaneous information about the SCH system’s activity. Figure 14 illustrates the SCH system’s updated control panel after the installation of two PCM-based storage tanks. A user can easily manage the entire system, allowing modifications to its preset variables using the control panel. By considering the system’s predetermined conditions and by measuring the system’s key variables, the control system decides which actuators should be enabled. Each of the SCH system components has its own actuator—after having received the set of input variables from the acquisition system, each actuator controls the state/position of its corresponding equipment.
With respect to the costs of installations, the total cost was 21.525,91 euro, resulting from the tanks and PCM holders, and including the acquisition, delivery and installation costs, as well as other minor equipment and actions, such as three-way valves, probes and control software re-programming.
The schematic representation of the final SCH system, which is coupled with two storage tanks designed within the PCMSOL project, is shown in Figure 15. In heating mode, the chiller is changed for a heat exchanger, and the secondary circuit transfers hot water to the building instead of cold water.

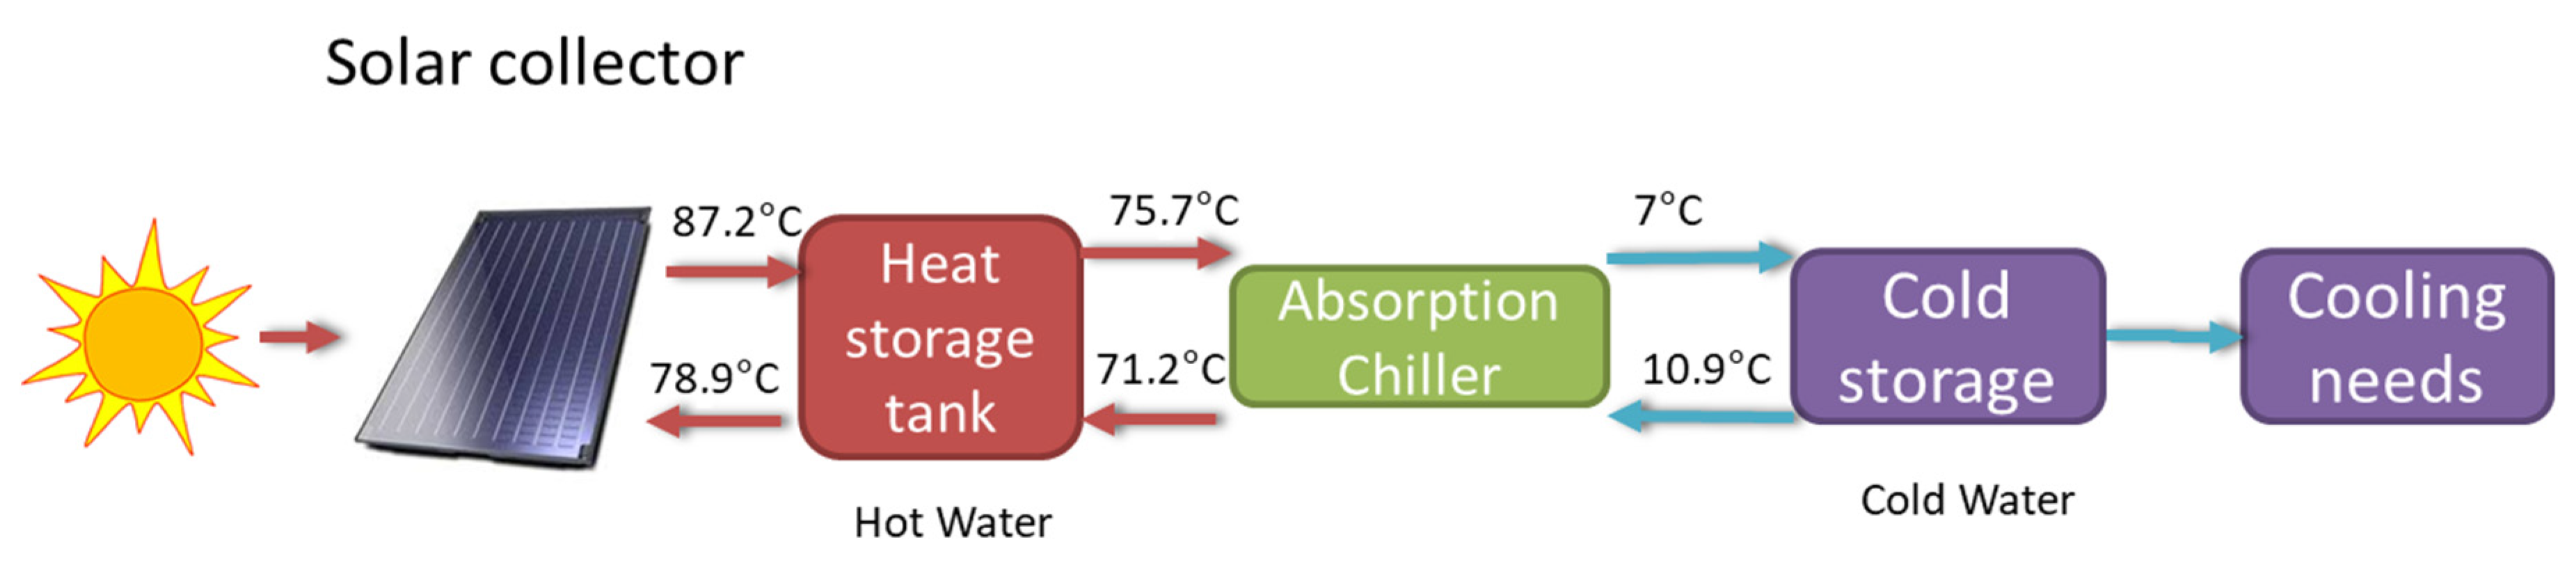
4.2. Operation Characteristics of the Heating and Cooling System

This section presents the results of the every-day operation of the SCH system, starting with refrigeration. This season typically starts in mid-May and lasts until mid-October.
The upper panel of Figure 16 shows the evolution of the temperature of the coolant (water) in two locations of the refrigeration circuit (before and after the PCM tanks, see points TA and TB in Figure 15), and inside the PCM tanks as a function of solar time, ST (upper panel), and the electric consumption of the different components (lower panel). Recall that the building starts its normal operation at 9 a.m. (7.00 ST) and finishes at around 6 p.m. (16.00 ST). However, some laboratories or offices require cooling for an extended period, and four chemical analysis laboratories must be kept at a constant temperature continuously (day and night). Thus, additional support from a conventional refrigerator system is used when necessary (especially at night).
In this test, the water passes through the PCM tanks at all times, charging or discharging them, whereas the chilled water tanks are left isolated. For the day studied in the figure, the conventional HVAC system runs from 0.00 ST to 7.00 ST. This can be confirmed by the cyclic electric consumption, and the concomitant temperature cycles between the two set-points. As the temperature inside the tanks is lower than the melting temperature of the PCM, the tanks charge during the night with conventional HVAC. At 9 AM, the conventional system was disconnected and the “cold” stored in the tanks was recovered by circulating water through them. This reservoir can cover the cooling demand of the building for more than 2 h before the inlet temperature to the building reaches the limit of 15 °C (note that this period is in good agreement with our predictions from the model developed in WP3, see Section 3.4).
At this stage (around 11.30 AM, or Time = 570 min), the solar chiller is turned on to provide cooling to the building and to simultaneously charge the PCM tanks, as shown by the decrease of the temperature inside the tanks (upper panel). This implies an important cooling demand, which the solar cooling machine can hardly comply, given the temperature in the primary circuit. Therefore, the system requires extra heating of the hot fluid, which is provided by the gas heater. This is confirmed by the gas consumption in the early stages of this charging process (green line in the bottom panel for Time≈570–630 min). After approximately 90 min, the solar chiller is switched off, and the energy stored in the tanks is recovered, providing cooling for almost 2 h.
The third discharging of the tanks occurs in the evening (starting around 5 PM, Time = 900 min), when the activity in the building, as well as the concomitant cooling demand has decreased significantly. Thus, the tanks can cover the demand of the building for more than 3 h. After that, the solar irradiation is too low for the solar chiller, and the conventional refrigeration system is started (around 8 PM, Time = 1090 min) in order to comply with the building demand and charge the tanks. It is worth noting that the charging is much faster in this case than with the solar chiller, but the temperatures reached in the tanks are slightly larger. The subsequent discharging (starting at 9.45 PM, Time = 1185 min) covers the demand for almost 6 h, until the conventional refrigeration system is started again for the night service (at 2.00 a.m., next day).
Regarding electric consumption, in the case of the SC it is distributed among the pumps of the primary and secondary loops, cooling tower and its pump, and the chiller itself. On the other hand, the “pump” label in the figure refers to the consumption of the pump of the secondary circuit when the solar chiller is not working, and refrigeration is provided by the energy stored in the PCM tanks. It must be noted that the instantaneous power consumed by the conventional refrigeration is much larger than that of the solar chiller.
Table 4 gives the average daily electric and gas consumptions of the SC with the PCM tanks, separating the consumption of the pump of the secondary loop when the solar chiller is not working. These results were averaged over six different days in September 2019 (due to the large number of initial tests in the operation of the system and different strategies, a limited number of days was available). These consumptions must be compared with the consumption of the conventional refrigeration system working 24 h per day (also given in the table). The times of operation when using conventional refrigeration, as well as when using—SC coupled with PCM tanks—are shown in the right-most column of the table.
It must be noted that the solar cooling system notably reduces the electricity consumption when compared to conventional refrigeration; a reduction of ca. 100 kWh per day is reported, i.e., a reduction of 40%. Studying the different components also yields important conclusions: two thirds of the total electricity is used in conventional refrigeration, which is working for 9 h per day, whereas the solar chiller is working for almost 4 h with a consumption of only 22% of the total energy (note that this consumption also includes the charging of the hot tanks of the primary loop, which might occur when the chiller is switched off due to the action of PCM storages). Finally, it is important to note that the PCM tanks can provide cooling effect for more than 11 h per day. There is a significant energy saving; only 14.5 kWh are consumed in this time interval.
According to our records, cooling is required for almost 150 days per year, which implies that the energy saving with the use of SC with PCM tanks amounts to 15,000 kWh during the cooling season. This saving, in addition to the savings in the winter season studied below, must be compared with the installation and maintenance costs of the solar assisted equipment. Depending on the specific electricity and gas prices, and considering a discount rate of 3.5%, as well as the typical value for cost-benefit analysis [35], the pay-back period is of 9 years without any maintenance costs. This allows a contract of ca. 1500 euro/year for maintenance, in a 20-years pay-back scenario. Further details on the economic analysis and viability of the facility will be published elsewhere.
In winter, there is a low demand for heating from mid-December to mid-March and therefore a similar analysis as for cooling was carried out. However, it must be recalled that only 15% of the PCM in the storage tanks has a melting temperature in the appropriate range for the heating application. The hot water tanks of the secondary loop are not used in this analysis. Figure 17 presents the temperatures from the same probes as Figure 16, and the electric and gas consumption, with the same color code, for a typical day in January 2020. The electricity consumption of the SH includes, in this case, only the pump in the primary loop, and is significantly lower than the chiller consumption discussed in the refrigeration case.
Notably, support from an external heat pump is not necessary, and the system can completely cover the heating demand of the building with only solar energy. Overnight, the PCM tanks can provide heating for the building until the next morning, when the solar heating is connected again. The normal operation hours of the building are clearly noted in the different extensions of the discharging times, and the whole demand of a single day can be covered with just three charging and discharging cycles.
With respect to the electricity consumption, it must be noted that the pump of the primary circuit is working even when the system is not providing heat to the building or the tanks. This corresponds to the power consumed by the pump of the primary circuit that stores heat in the hot water tanks. This heat is used to provide heating to the building and to charge the tanks when solar radiation is not available; note that the first charging of the tanks occurs between 1 a.m. and 2 a.m. When this heat is not sufficient to charge the tanks, usually because radiation is too low, the gas heater is used to comply with the demand, as shown by the gas consumption (green line in the bottom panel).
The total daily electric consumptions and operation times are presented in Table 5. In this case, the consumption of the solar heater includes only the pump of the primary loop, and the operation time given in the table corresponds to the time when it is providing heat to the tanks or the building. On the other hand, the consumption needed to recover the heat stored in the PCM tanks corresponds to the pump of the secondary loop.
The most important result given in the table is that the total daily consumption of the solar-driven heating system is only one fourth of the consumption of the conventional heat pump. Note that the tanks covered the heating demand of the building for 21 h, with a minimal consumption, thus significantly reducing the total consumption.
Bearing in mind the small fraction of PCM for the heating application in the tanks, it is obvious that an important fraction of the heat stored in the tanks is kept as sensible heat in the PCM for cooling. In any case, it is evident from the consumptions given in Table 5 that the distribution of PCMs has been appropriate. This result obviously depends on the specific demands of heating and cooling, and ultimately on the location of the facility.
Considering the consumptions for summer and winter, as well as the expected days of operation for each one, the year-wide consumption and saving can be extrapolated. Assuming that refrigeration is required for 122 days (from June to September), and heating for 74 days (from mid-December to February), the total electricity consumption is ca. 20 MWh per year. This can be compared to ca. 38 MWh/year if conventional cooling/heating is used. Therefore, a saving of 45–50% of the total electricity consumption for air-conditioning is predicted.

5. Exergy Analysis

Exergy analysis is a very effective tool to establish which technological options or operating conditions can improve the efficiency of a system. Exergy can be understood as the fraction of an energy flux that can be completely transformed to useful work. Normally, as energy is transferred from one system to another, some of the exergy content is lost, even if all the energy transferred is preserved. The amount of exergy lost in a process is known as the irreversibility of the process. The main difference between the concept of energy and exergy is that energy is never lost (first principle), but the exergy content in a system, or energy flux, can be lost. Only in the case of a reversible process, which means dSuniv. = 0, will exergy be preserved, and therefore a reversible process is the optimum way of realizing a process [36].
In the case of HVAC systems, we usually deal with energy fluxes with very low exergy contents, and therefore we need low amounts of exergy to drive the energy fluxes that are required. In practice, this is quite difficult to achieve, and high exergy energy fluxes are frequently used, which results in high amounts of exergy being lost in the process. Irreversibility (I) is defined by the following equation:
δ I = δ W r e a l δ W r e v . = T o d S u n i v . 0
where W r e a l is the useful work exchanged in a real process, W r e v . is the useful work that would be exchanged if the process was reversible, T o is the ambient temperature, and d S u n i v . is the entropy change of the universe associated to the process.
All real processes will have a certain amount of exergy lost, thus irreversibility. There is an important relation between irreversibility and entropy increase of the Universe, as shown by Equation (2), this is called the Gouy-Stodola equation [37] which shows that all the exergy lost in a process becomes directly in entropy created in the Universe. In order to calculate the irreversibility of a process, W r e a l can be calculated using energy balance equations, and W r e v , using exergy balance equations. An efficient process will be the one that destroys the minimum exergy or generates the minimum entropy in the Universe. With these criteria of efficiency, an exergy efficiency concept can be defined as the fraction of exergy that is preserved in a process.
The calculation strategy we followed was to start with the incoming exergy of the sun and calculate the irreversibilities at every stage of the process, integrating the following equations for a whole day:
δ I = T o d S u n i v . = T o ( d S V C + o u t s i d m i i n s j d m j + d Q o T o + d Q i T i )
The terms in parentheses represent the entropy change of the universe for an open system in transitory state, not all terms will apply in every estate of the process. The first term refers to the entropy change in the Volume Control (VC), the second and third terms to the entropy that flows out and into the VC, and the other terms to entropy changes of heat fluxes to the environment and other external heat sources. The mass and energy flows were calculated with energy and mass balance equations. Then, the efficiency of each stage of the process was calculated with the following equation:
ε = 1 I i E x i n
where I i is the sum of all irreversibilities generated at a certain stage, and E x i n is the total exergy that enters the process associated to mass flow, heat flux, and work done on the system.
As the objective of our research is to improve the efficiency of the solar HVAC system installed in the CIESOL center using PCMs in order to store exergy as heat or as cold, an exergy analysis of the actual operating conditions of the system was conducted in order to determine its overall efficiency and to find the main causes of exergy losses. The effect of introducing PCMs for the stages where heat and cold must be stored was then analyzed. As shown before, the most important need in the CIESOL building is cooling during the summer months, in particular August, and therefore we concentrated our exergy analysis for the cooling operation mode of the system. For the heating mode, the system has the capacity for providing all the heat needed in the winter months.
For the exergy analysis, we considered a model of the cooling system that is shown in Figure 18. The Sun is the main exergy source, and its radiant exergy is captured by the solar collectors where it is transferred to water that is stored in hot water tanks. The hot water is transferred to the absorption chiller where cool water is generated, and then stored in tanks for later use in the building’s cooling system. The temperatures of the water flows in the different stages considered in the model are described in Figure 18. The solar radiation of a typical day in August over a flat plate inclined 30° was obtained from the Photovoltaic Geographical Information System (PVGIS) [38]. Starting from the intensity of solar radiation received, all water flows were determined through an energy balance on the system. With this information, an exergy efficiency analysis was performed, and the results are shown in Table 6.
As can be seen in Table 6, the overall efficiency of the system is 1.51%, which is rather low but typical of this kind of system, essentially determined by the low efficiency of the solar collectors and the efficiency of the absorption chiller. Therefore, we conducted an analysis of the best operating conditions for both elements, which depend essentially on the temperatures of water flows, and the results are shown in Figure 19. We can see that the solar collector will have a maximum daily efficiency of 7.5% if the incoming water has a temperature of around 87 °C. In the case of the absorption chiller the highest efficiency is obtained when the incoming hot water is below 77.5 °C. Therefore, in order to improve the efficiency of the system we should operate within these temperature ranges. However, in the case of the absorption chiller, the cooling power lowers to about 40 kW under the optimum conditions, which is much lower than the 70 kW stated in the equipment’s manual.
The exergy analysis also enables the expected efficiency of the system to be studied while introducing further changes. In particular, the effect of introducing PCMs for storing heat in the hot water tanks in the primary loop was analyzed. For heat storage, we chose S83, keeping the cold storage in the secondary loop with S10 PCMs. The use of S10 implies that the water is delivered at 5 °C, which reduces the efficiency of the chiller significantly. Therefore, two scenarios were analyzed, the first one with PCMs for heat and cold storage; the second one with PCM for the heat storage only, where the cold would be stored as cold water. We assumed that the solar collector and the absorption chiller would be operating close to the optimum conditions previously determined before. The results are shown in Figure 19.
As can be seen Figure 20, the introduction of S83 PCM in the system lowers the efficiency of heat storage from 89.0% to 85.6%, and the introduction of S10 lowers the efficiency of cold storage from 88.9% to 61.6%. This lowering of efficiency is due to the fact that the introduction of PCMs implies additional operations of heat transfer for charging and discharging the PCMs that produce additional irreversibilities in the whole process, the effect is more pronounced in the case of S10 PCM because it operates closer to room temperature. However, the PCMs allow more exergy to be stored in a smaller volume, e.g., instead of about 10 m3 of hot water in a tank, a 3 m3 tank with S83 would be enough. This analysis indicates that a good option would be to use S83 to store heat and water at 7 °C to store cold. Under these conditions the overall theoretical efficiency would be about 2.35%, which represents a 55.6% increase in the overall efficiency when compared to the present situation.

6. Conclusions

As a part of the PCMSOL project, a number of analytical and experimental works were carried out in order to modify the solar thermal comfort system of an institutional building:
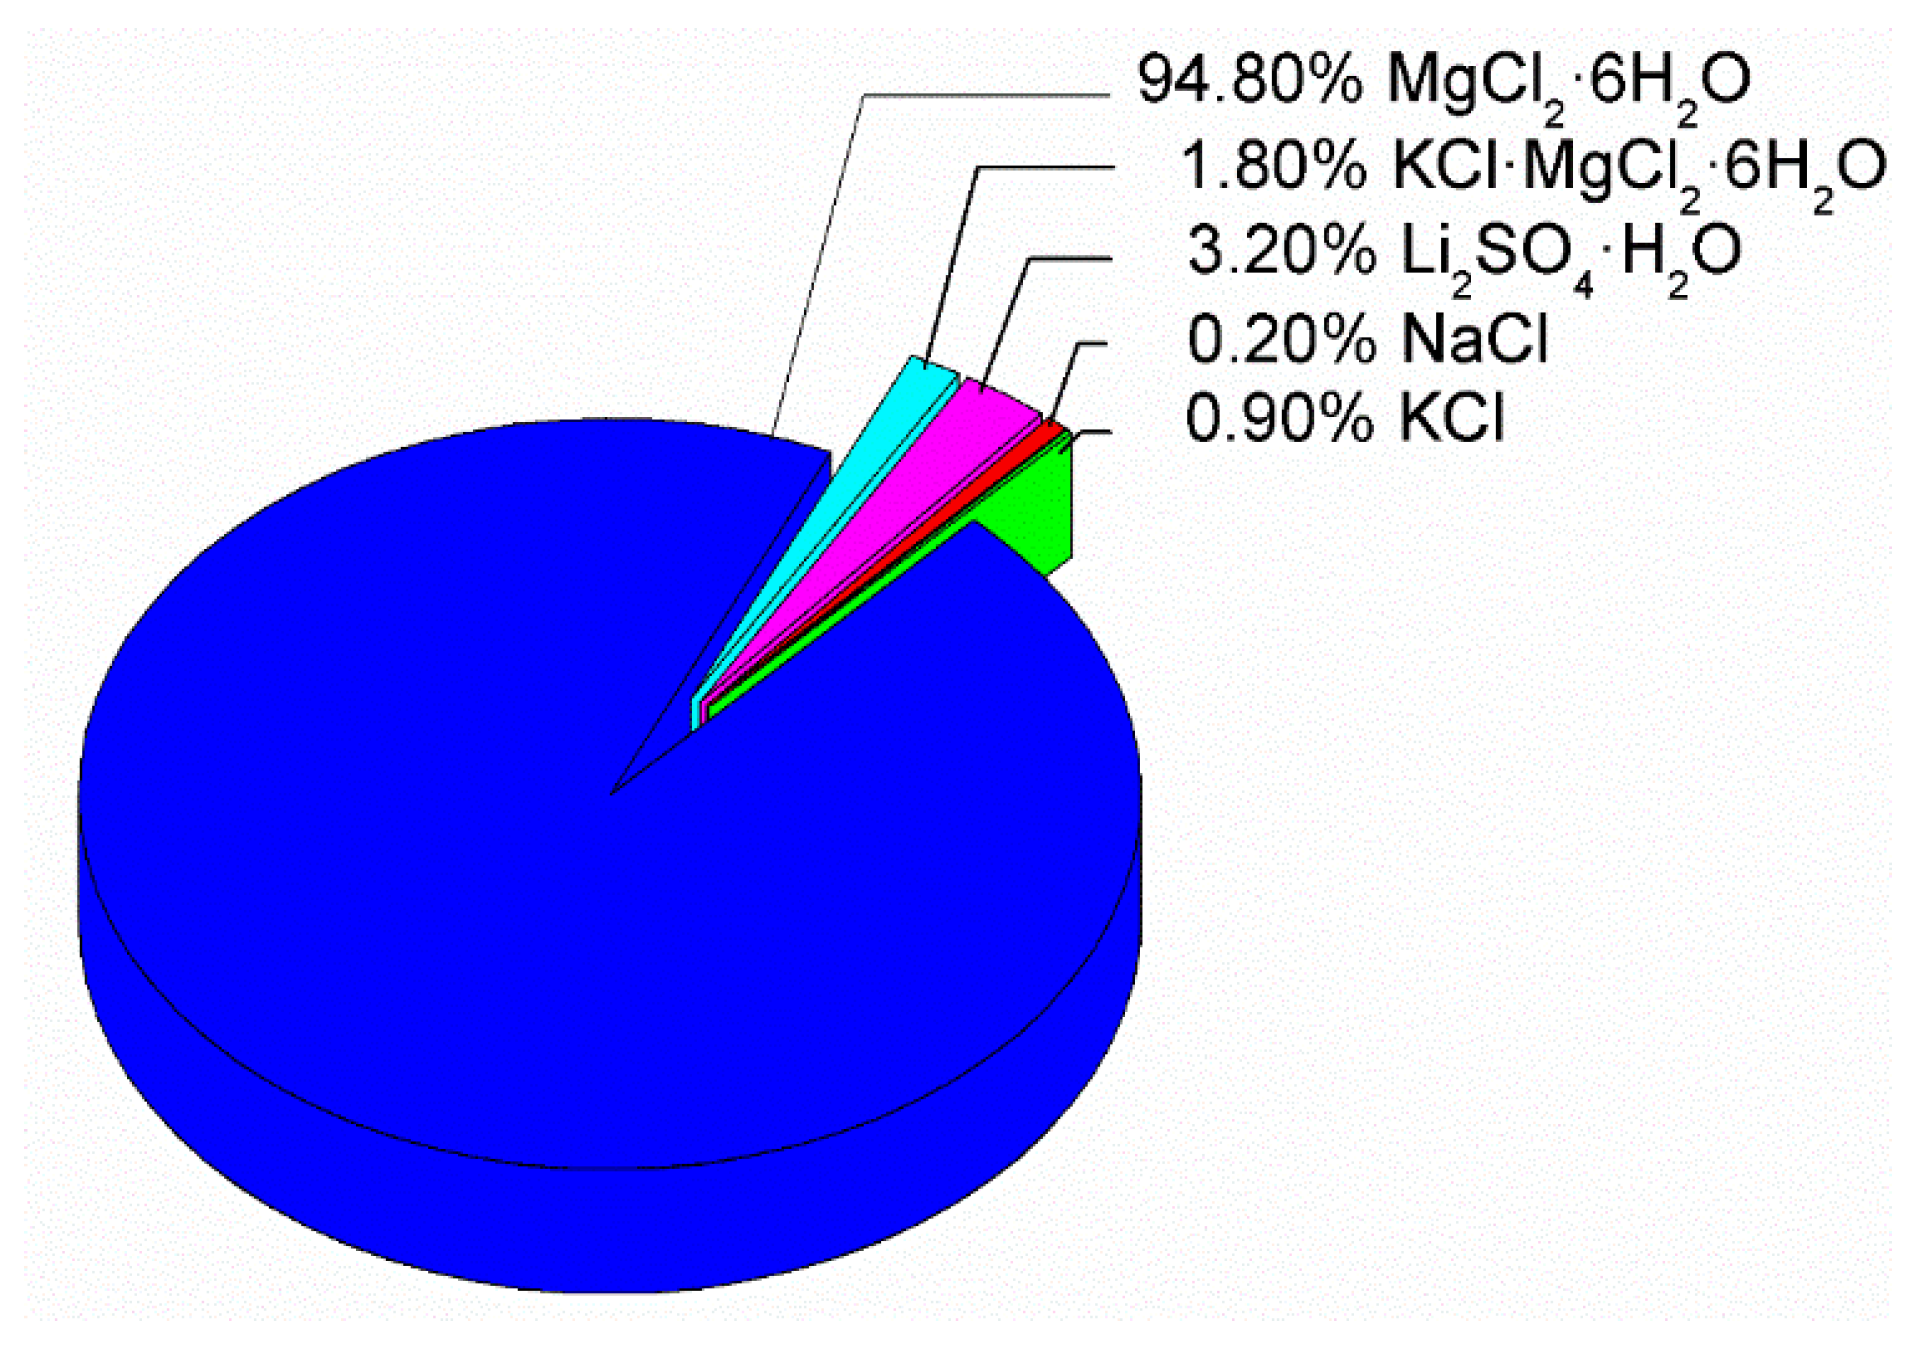
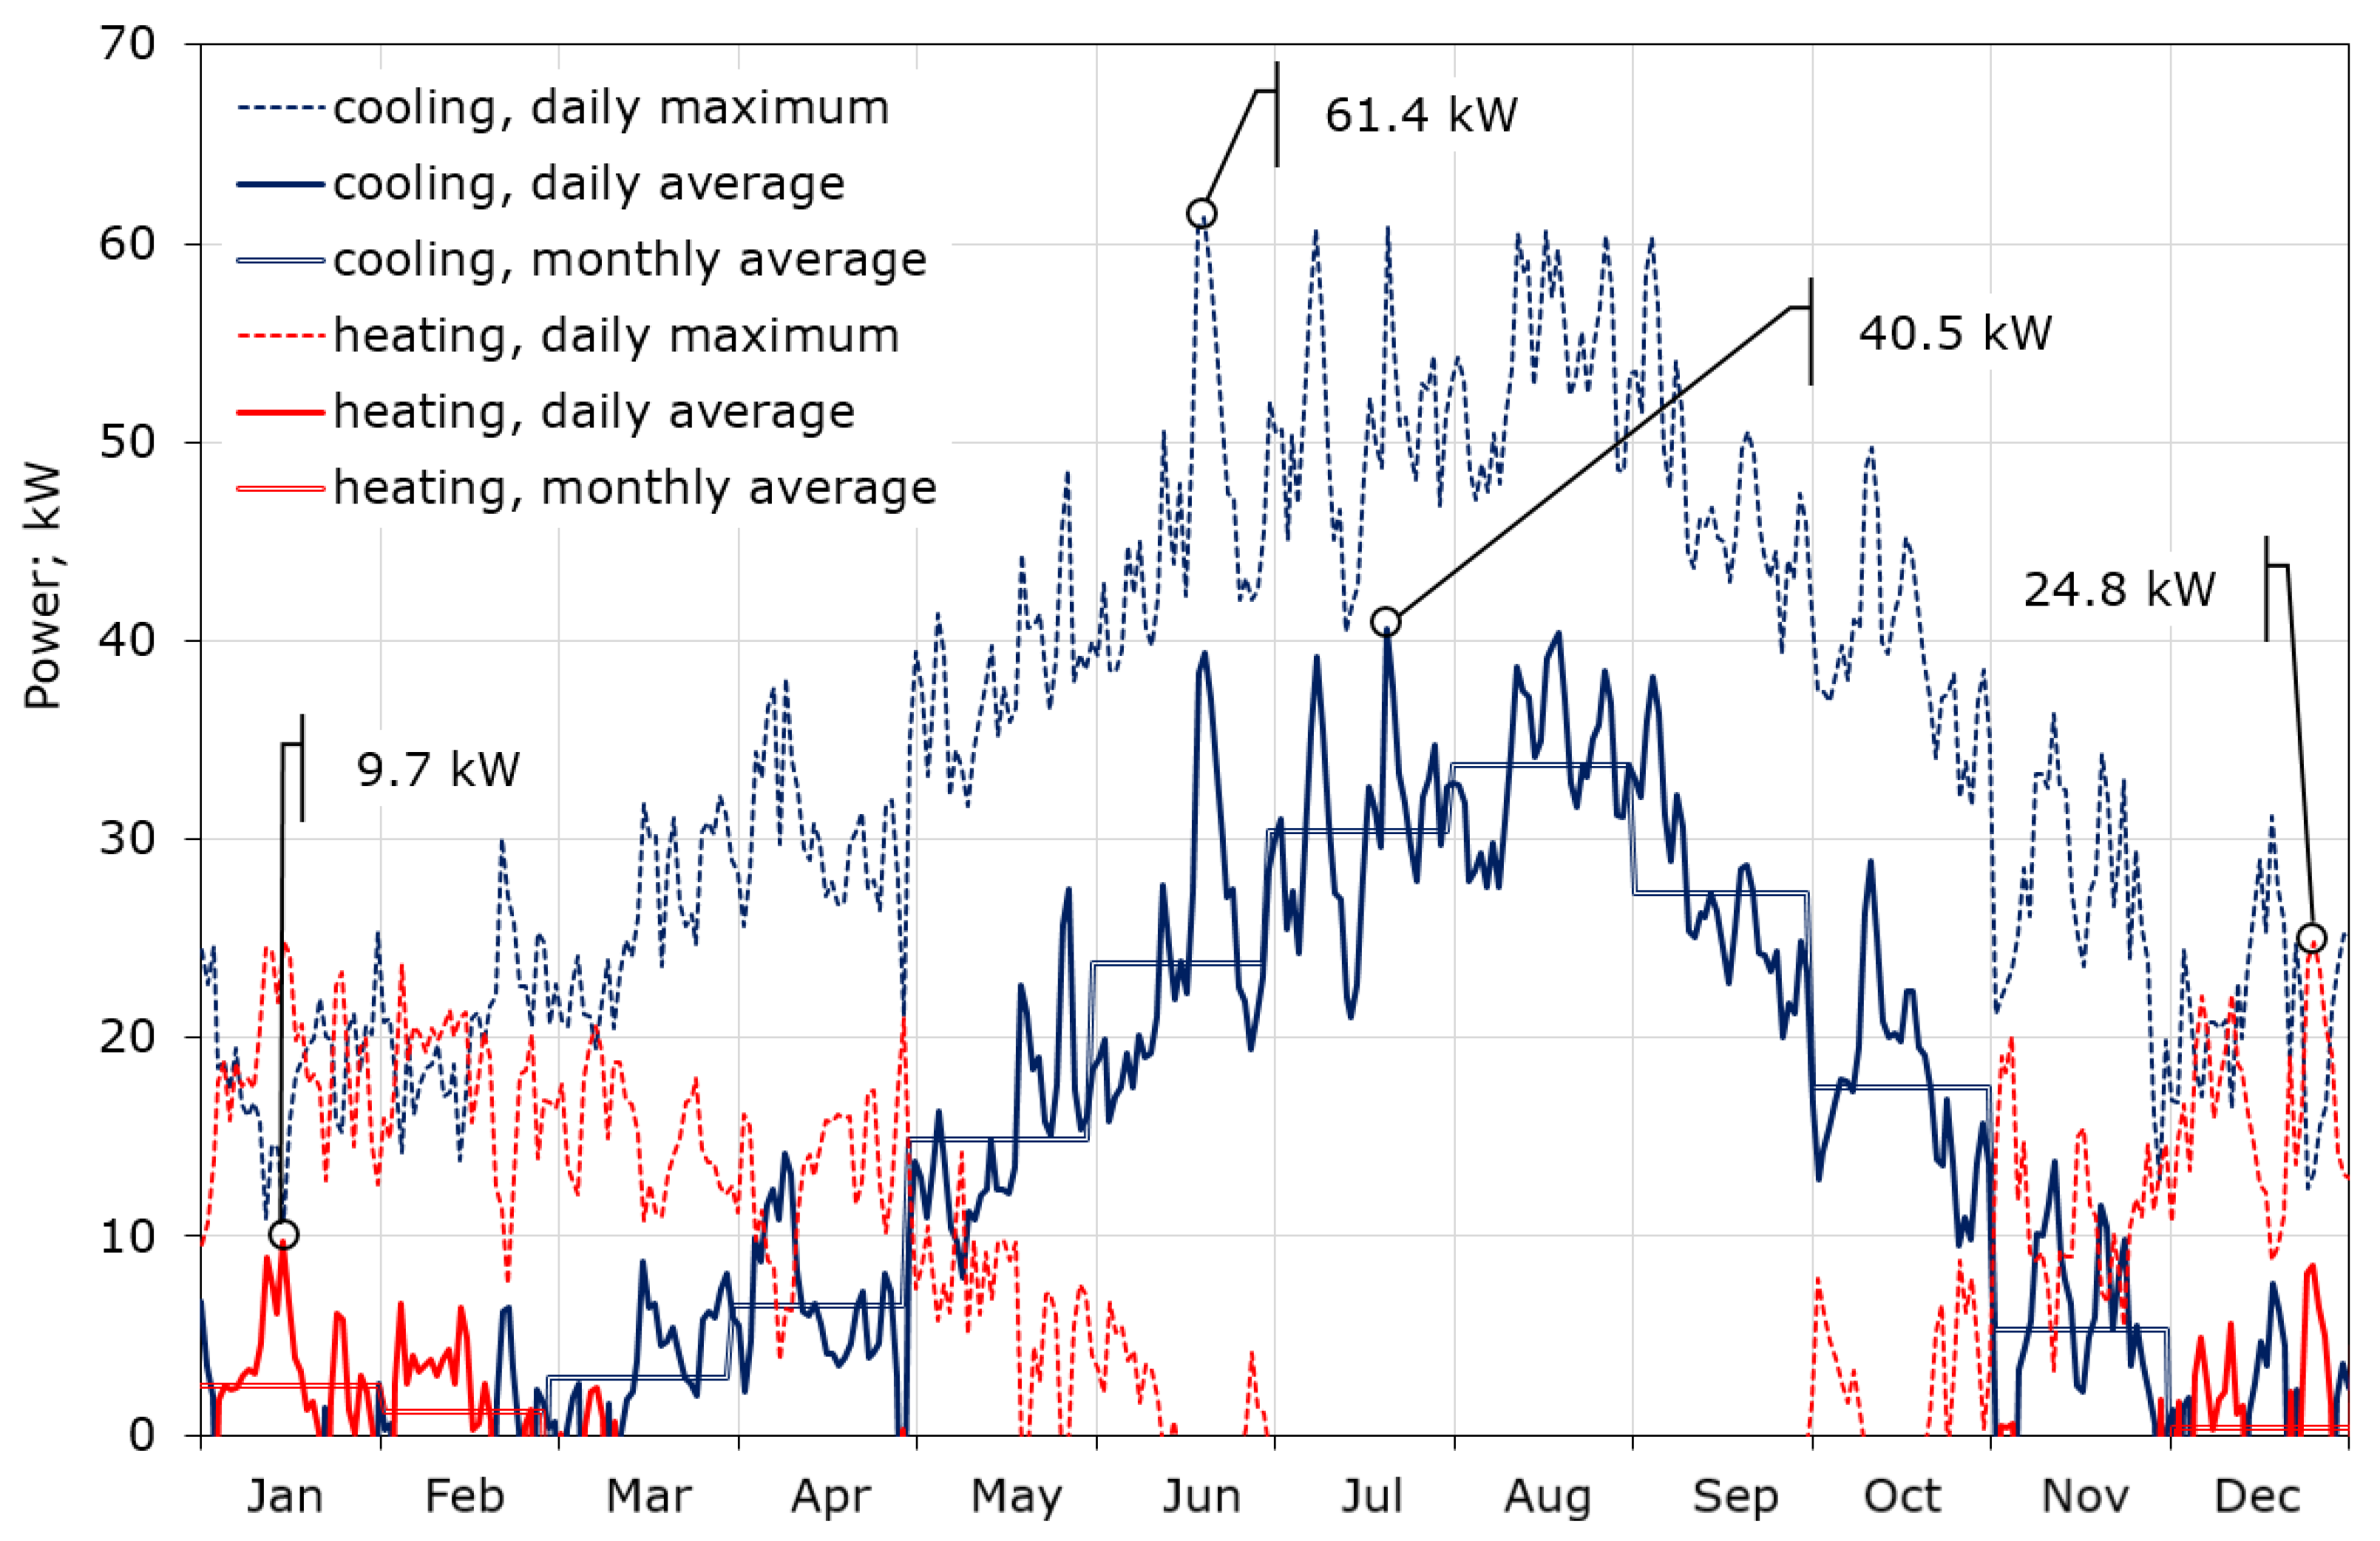
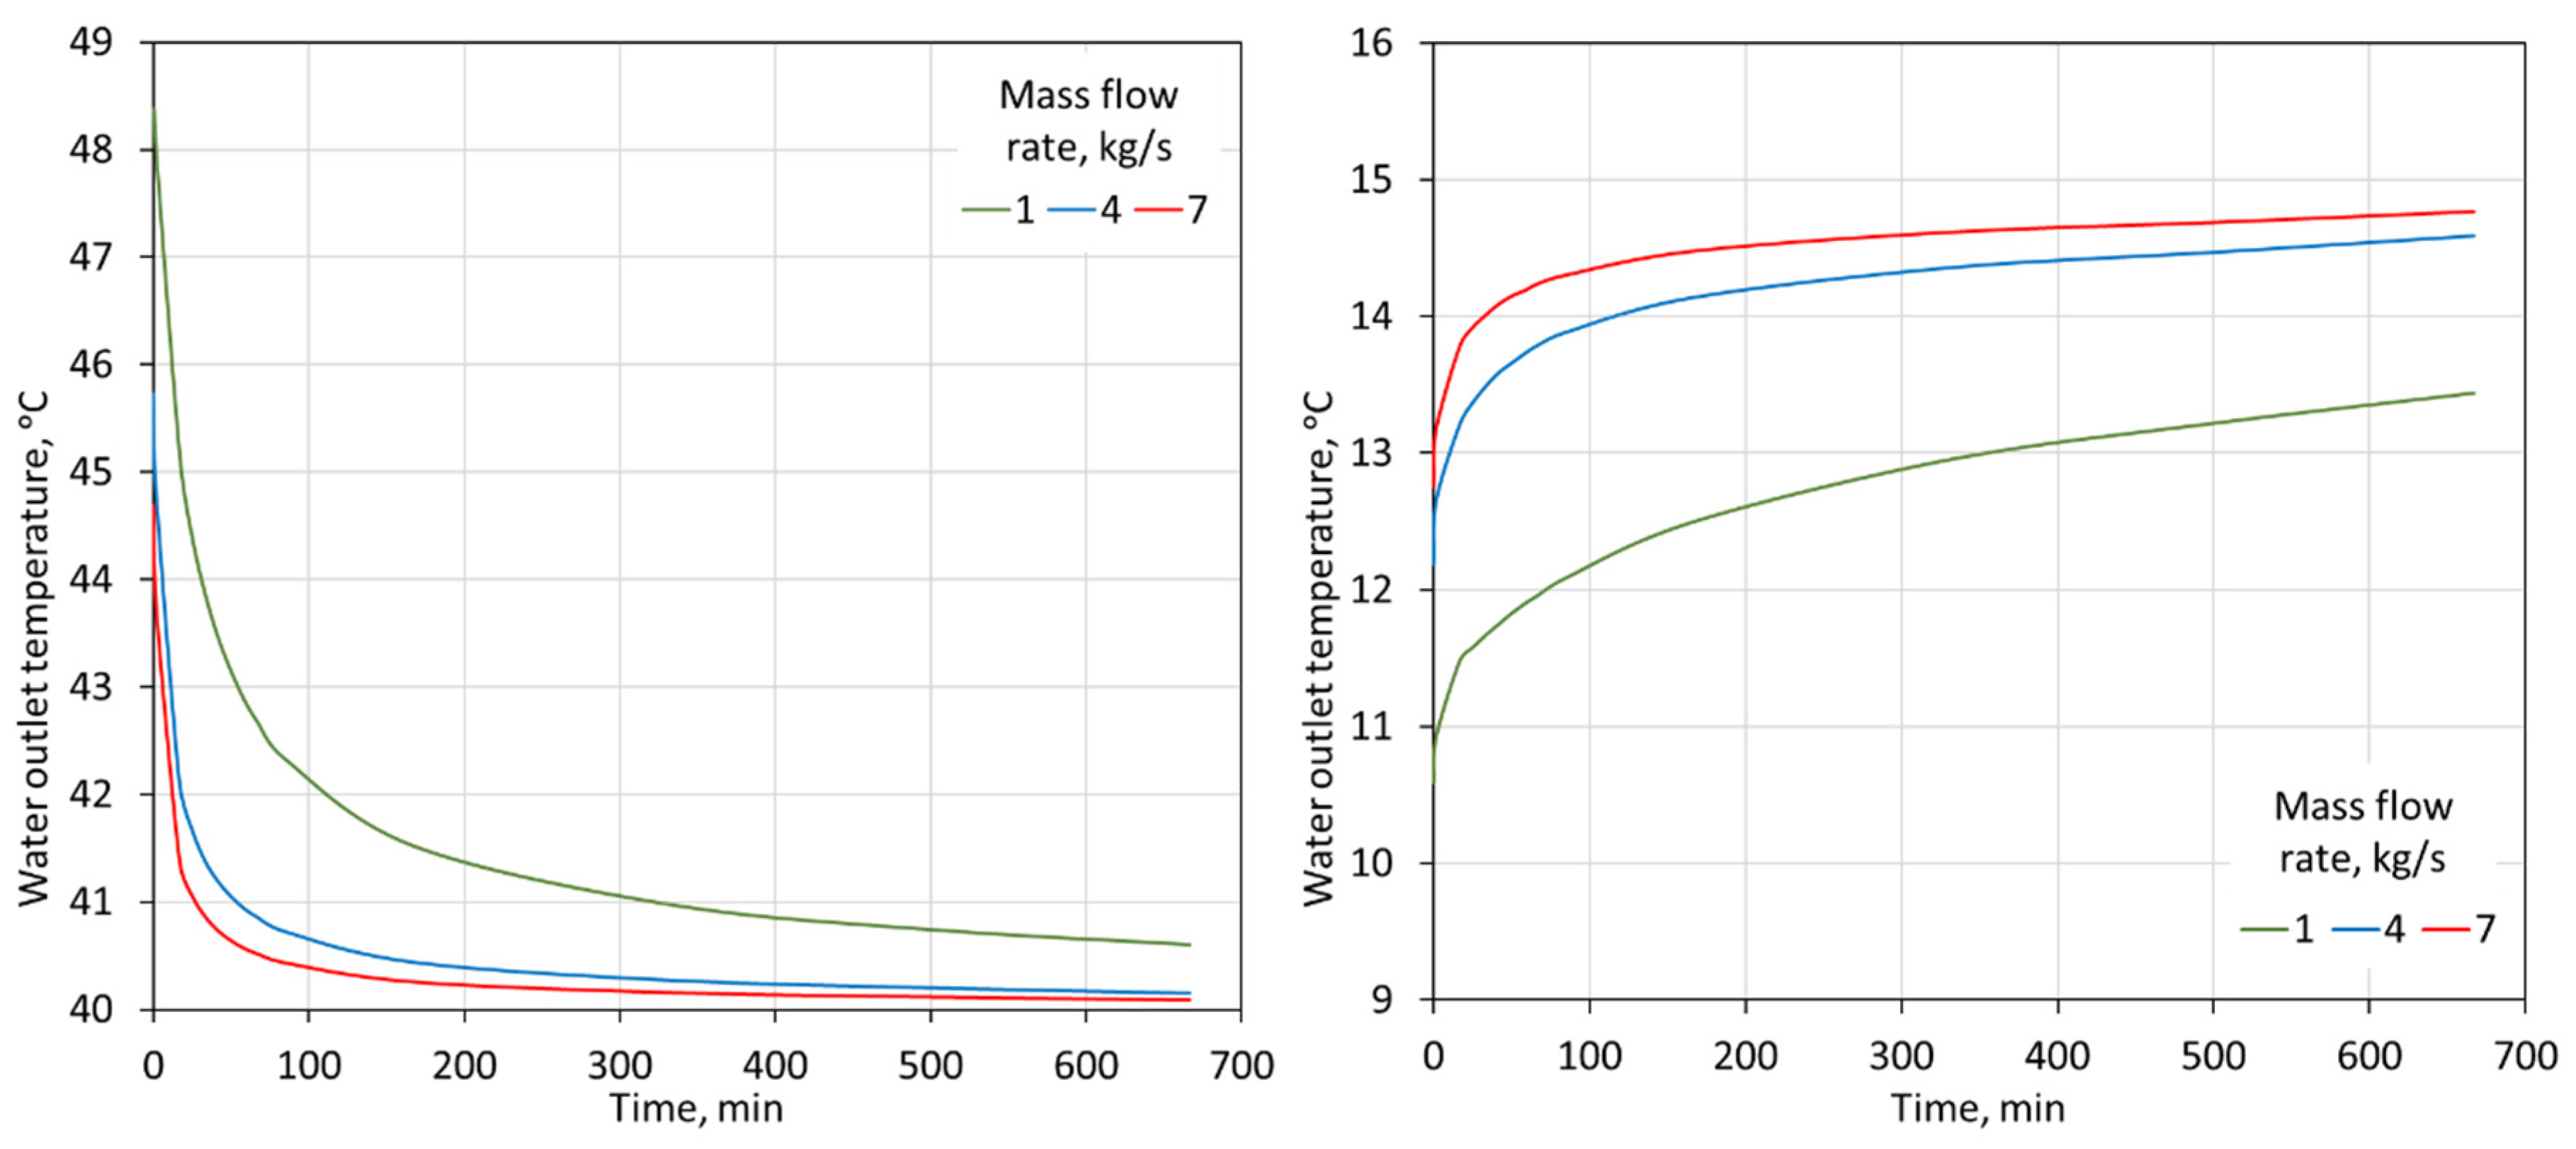
  • During the initial design works, it was proposed to use two new phase change materials for the cooling system, and one, based on waste material (bischofite), for the heating system. The analysis of the building’s operation carried out during the year allows the real demands of the heating and cooling system to be determined. The average daily demand for cooling power in summer reaches 40 kW, while in winter the average demand for heating power does not exceed 10 kW. The presented results of the simulation of the process of discharging the tanks with the PCM showed that the heat stream that is transferred between the PCM and water quickly decreases during the discharging of the tank. This can cause problems with restoring all the heat accumulated in the PCM material if the power of the tanks will be lower than the heating demands.
  • Finally, commercial S10 material was used for cooling. The PCM tanks can provide cooling for more than 11 h per day, with a high energy saving; only 14.5 kWh are consumed in this time interval. According to our records, cooling is required for almost 150 days per year, implying that energy saving when using the solar chiller with PCM tanks amounts to 15,000 kWh during the cooling season.
  • S46 was used as the heat accumulating material. It was decided that only 15% of the PCM in the storage tanks has a melting temperature in the appropriate range for the heating application. The small amount of S46 is due to the small heating demands of the building. However, it should be remembered that heat is also accumulated in S10, in the form of sensible heat, as well as in water, which fills the free space in the tanks.
  • The exergy analysis shows that it is very important to operate the solar collectors and the absorption chiller under the most favorable conditions in order to improve efficiency. The introduction of PCMs will lower the efficiency due to the fact that additional heat transfer operations are needed to charge and discharge the PCMs.
  • In the present case it would be convenient to use S83 PCM to store heat as this allows to reduce significantly the storage volume and allows a higher flexibility given the mismatch between the intensity of cooling needs and the available solar radiation.
  • The environmental trade-off weaknesses and the effects on the environment, either direct or indirect, will be studied with a life cycle assessment. This last WP will be finalized with the elaboration of a business model where the economic balance, in particular the payback period, is estimated in order to assess the viability of these kinds of applications.

Author Contributions

Conceptualization, F.J.B., S.U., M.N. and S.R.; methodology, M.S.R.-C. and S.R.; validation, A.M.P. and M.G.; formal analysis, F.J.B., A.M.P., M.S.R.-C. and S.R.; investigation, B.G., S.U., M.L., D.M., A.N., A.M.P. and M.S.R.-C.; writing—original draft preparation, B.G., M.N., A.N., A.M.P., S.R. and M.G.; writing—review and editing, J.K. and M.L.; supervision, F.J.B. and S.U.; project administration, A.M.P.; funding acquisition, F.J.B., S.U., J.K. and S.R. All authors have read and agreed to the published version of the manuscript.

Funding

The financial support for this work was provided under the ERA-Net LAC, project ELAC2015/T06-0988, PCMSOL. The Spanish team was funded by the Spanish Ministerio de Economía, Industria y Competitividad, project PCIN-2016-013, PCMSOL; the group from Chile was funded by ANID/FONDAP Nº 15110019 SERC-Chile and CONICYT/ELAC2015/T06-0988; the group from Poland was funded by Polish National Centre for Research and Development (Ref. EraNet-LAC/PCMSOL/08/2017).

Conflicts of Interest

The authors declare no conflict of interest.

References

  1. Cunha, S.R.; Aguiar, J.L. Phase change materials and energy efficiency of buildings: A review of knowledge. J. Energy Storage 2020, 27, 101083. [Google Scholar] [CrossRef]
  2. Kalidasan, B.; Pandey, A.K.; Shahabuddin, S.; Samykano, M.; Thirugnanasambandam, M.; Saidur, R. Phase change materials integrated solar thermal energy systems: Global trends and current practices in experimental approaches. J. Energy Storage 2020, 27, 101118. [Google Scholar]
  3. Mofijur, M.; Mahlia, T.M.I.; Silitonga, A.S.; Ong, H.C.; Silakhori, M.; Hasan, M.H.; Putra, N.; Rahman, S.M.A. Phase Change Materials ( PCM ) for Solar Energy Usages and Storage: An Overview. Energies 2019, 12, 3167. [Google Scholar] [CrossRef] [Green Version]
  4. Huang, H.; Wang, Z.; Zhang, H.; Dou, B.; Huang, X.; Liang, H.; Goula, M.A. An experimental investigation on thermal stratification characteristics with PCMs in solar water tank. Sol. Energy 2019, 177, 8–21. [Google Scholar] [CrossRef]
  5. Wang, Z.; Zhang, H.; Dou, B.; Zhang, G.; Wu, W.; Zhou, L. An experimental study for the enhancement of stratification in heat-storage tank by equalizer and PCM module. J. Energy Storage 2020, 27, 101010. [Google Scholar] [CrossRef]
  6. Bazri, S.; Badruddin, I.A.; Naghavi, M.S.; Seng, O.K.; Wongwises, S. An analytical and comparative study of the charging and discharging processes in a latent heat thermal storage tank for solar water heater system. Sol. Energy 2019, 185, 424–438. [Google Scholar] [CrossRef]
  7. Zhao, J.; Ji, Y.; Yuan, Y.; Zhang, Z.; Lu, J. Energy-saving analysis of solar heating system with PCM storage tank. Energies 2018, 11, 237. [Google Scholar] [CrossRef] [Green Version]
  8. Stropnik, R.; Koželj, R.; Zavrl, E.; Stritih, U. Improved thermal energy storage for nearly zero energy buildings with PCM integration. Sol. Energy 2019, 190, 420–426. [Google Scholar] [CrossRef]
  9. Lu, S.; Zhang, T.; Chen, Y. Study on the performance of heat storage and heat release of water storage tank with PCMs. Energy Build. 2018, 158, 1770–1780. [Google Scholar] [CrossRef]
  10. Afshan, M.E.; Selvakumar, A.S.; Velraj, R.; Rajaraman, R. Effect of aspect ratio and dispersed PCM balls on the charging performance of a latent heat thermal storage unit for solar thermal applications. Renew. Energy 2020, 148, 876–888. [Google Scholar] [CrossRef]
  11. Lafri, D.; Semmar, D.; Hamid, A.; Ouzzane, M. Experimental investigation on combined sensible and latent heat storage in two different configurations of tank filled with PCM. Appl. Therm. Eng. 2019, 149, 625–632. [Google Scholar] [CrossRef]
  12. Abdelsalam, M.Y.; Teamah, H.M.; Lightstone, M.F.; Cotton, J.S. Hybrid thermal energy storage with phase change materials for solar domestic hot water applications: Direct versus indirect heat exchange systems. Renew. Energy 2020, 147, 77–88. [Google Scholar] [CrossRef]
  13. Senthil, R. Effect of uniform and variable fin height on charging and discharging of phase change material in a horizontal cylindrical thermal storage. Therm. Sci. 2019, 23, 1981–1988. [Google Scholar] [CrossRef]
  14. Lazzarin, R.; Noro, M.; Righetti, G.; Mancin, S. Application of hybrid PCM thermal energy storages with and without al foams in solar heating/cooling and ground source absorption heat pump plant: An energy and economic analysis. Appl. Sci. 2019, 9, 1005. [Google Scholar] [CrossRef] [Green Version]
  15. Dmitruk, A.; Naplocha, K.; Grzęda, J.; Kaczmar, J.W. Aluminum inserts for enhancing heat transfer in PCM accumulator. Materials 2020, 13, 415. [Google Scholar] [CrossRef] [Green Version]
  16. Prieto, C.; Cabeza, L.F. Thermal energy storage (TES) with phase change materials (PCM) in solar power plants (CSP). Concept and plant performance. Appl. Energy 2019, 254, 113646. [Google Scholar]
  17. Huang, H.; Xiao, Y.; Lin, J.; Zhou, T.; Liu, Y.; Zhao, Q. Improvement of the efficiency of solar thermal energy storage systems by cascading a PCM unit with a water tank. J. Clean. Prod. 2020, 245, 118864. [Google Scholar] [CrossRef]
  18. Lin, W.; Ma, Z.; McDowell, C.; Baghi, Y.; Banfield, B. Optimal design of a thermal energy storage system using phase change materials for a net-zero energy Solar Decathlon house. Energy Build. 2020, 208, 109626. [Google Scholar] [CrossRef]
  19. Henne, I.; Midttomme, K. Integrated Thermal Energy Storage Combining PCM Storage and borehole thermal energy storage—Western Norway University of Applied Sciences, Campus Kronstad, Bergen Norway. In Proceedings of the 14th International Conference on Energy Storage, Adana, Turkey, 25–28 April 2018. [Google Scholar]
  20. Jokiel, M.; Kauko, H.; Schlemminger, C.; Hafner, A.; Claussen, I.C. Phase change material thermal energy storage for a large scale ammonia chiller/heat pump system. In Proceedings of the 7th IIR Conference: Ammonia and CO2 Refrigeration Technologies, Ohrid, Macedonia, 11–13 May 2017. [Google Scholar]
  21. Englmair, G.; Kong, W.; Berg, J.B.; Furbo, S.; Fan, J. Demonstration of a solar combi-system utilizing stable supercooling of sodium acetate trihydrate for heat storage. Appl. Therm. Eng. 2020, 166, 114647. [Google Scholar] [CrossRef]
  22. Ushak, S.; Vega, M.; Lovera-Copa, J.A.; Pablo, S.; Lujan, M.; Grageda, M. Thermodynamic modeling and experimental verification of new eutectic salt mixtures as thermal energy storage materials. Sol. Energy Mater. Sol. Cells 2020, 209, 110475. [Google Scholar] [CrossRef]
  23. Lovera-Copa, J.A.; Ushak, S.; Reinaga, N.; Villalobos, I.; Martínez, F.R. Design of phase change materials based on salt hydrates for thermal energy storage in a range of 4–40 °C. J. Therm. Anal. Calorim. 2020, 139, 3701–3710. [Google Scholar] [CrossRef]
  24. Nagano, K.; Ogawa, K.; Mochida, T.; Hayashi, K.; Ogoshi, H. Thermal characteristics of magnesium nitrate hexahydrate and magnesium chloride hexahydrate mixture as a phase change material for effective utilization of urban waste heat. Appl. Therm. Eng. 2004, 24, 221–232. [Google Scholar] [CrossRef]
  25. Ushak, S.; Gutierrez, A.; Galleguillos, H.; Fernandez, A.G.; Cabeza, L.F.; Grágeda, M. Thermophysical characterization of a by-product from the non-metallic industry as inorganic PCM. Sol. Energy Mater. Sol. Cells 2015, 132, 385–391. [Google Scholar] [CrossRef] [Green Version]
  26. Gasia, J.; Gutierrez, A.; Peiró, G.; Miró, L.; Grageda, M.; Ushak, S.; Cabeza, L.F. Thermal performance evaluation of bischofite at pilot plant scale. Appl. Energy 2015, 155, 826–833. [Google Scholar] [CrossRef]
  27. Galazutdinova, Y.; Grágeda, M.; Cabeza, L.F.; Ushak, S. Novel inorganic binary mixture for low-temperature heat storage applications. Int. J. Energy Res. 2017, 41, 2356–2364. [Google Scholar] [CrossRef]
  28. Galazutdinova, Y.; Vega, M.; Grágeda, M.; Cabeza, L.F.; Ushak, S. Preparation and characterization of an inorganic magnesium chloride/nitrate/graphite composite for low temperature energy storage. Sol. Energy Mater. Sol. Cells 2018, 175, 60–70. [Google Scholar] [CrossRef] [Green Version]
  29. Romero-Cano, M.S.; Puertas, A.M.; Rosiek, S.; Batlles, F.J. Kinetics of freezing and melting of encapsulated phase change materials with effective convection: Experiments and simulations. Numer. Heat Transf. Part A Appl. 2019, 76, 909–924. [Google Scholar] [CrossRef]
  30. EN 12831-1:2017 Energy Performance of Buildings—Method for Calculation of the Design Heat Load—Part 1: Space Heating Load, Module M3-3; European Committee for Standardization CEN-CENELEC Management Centre: Brussels, Belgium, 2017.
  31. Rosiek, S.; Batlles, F.J. Renewable energy solutions for building cooling, heating and power system installed in an institutional building: Case study in southern Spain. Renew. Sustain. Energy Rev. 2013, 26, 147–168. [Google Scholar] [CrossRef]
  32. Gil, B.; Rosiek, S.; Kasperski, J.; Nemś, M.; Nemś, A. Analysis of heat gains in a real research building: The difference in the need of air conditioning systems for various locations around the world. In Proceedings of the 29th International Conference on Efficiency, Cost, Optimisation, Simulation and Environmental Impact of Energy Systems, Wrocław, Poland, 23–28 June 2020; Stanek, W., Gładysz, P., Werle, S., Adamczyk, W., Eds.; Institute of Thermal Technology, Silesian University of Technology: Gliwice, Poland, 2019; pp. 2557–2568. [Google Scholar]
  33. Nemś, A.; Nemś, M.; Rosiek, S.; Puertas, A.; Gil, B.; Kasperski, J.; Batlles, F.J. Modeling of the discharging process of a heat storage tank filled with PCM to cover the heat demand of a building. In Proceedings of the ISES Solar World Conference 2019 and the IEA SHC Solar Heating and Cooling Conference for Buildings and Industry, Santiago, Chile, 4–7 November 2019; Cardemil, J.M., Guthrie, K., Rüther, R., Eds.; International Solar Energy Society: Freiburg im Breisgau, Germany, 2019; pp. 1341–1352. [Google Scholar]
  34. Phase Change Material Products Limited. Available online: http://www.pcmproducts.net/ (accessed on 2 April 2020).
  35. Martínez-Paz, J.; Almansa, C.; Casasnovas, V.; Colino, J. Pooling Expert Opinion on Environmental Discounting: An International Delphi Survey. Conserv. Soc. 2016, 14, 243–253. [Google Scholar] [CrossRef]
  36. Wark, K.; Richards, D.E. Termodinámica, 6th ed.; McGraw-Hill: Madrid, Spain, 2001. [Google Scholar]
  37. Gouy, G. Sur l’énergie utilisable. J. Phys. Theor. Appl. 1889, 8, 501–518. [Google Scholar] [CrossRef]
  38. Photovoltaic Geographical Information System (PVGIS). Available online: http://re.jrc.ec.europa.eu/pvgis/ (accessed on 10 February 2018).
Figure 1. Stages, where 1—concept, 2—material selection, 3—single capsule simulations, 4—tank modeling with material, 5—system construction, 6—experimental research, 7—exergy analysis.
Energies 13 03877 g001
Figure 2. The general layout of the solar cooling and heating system (SCH) system installed at the Solar Energy Research Center (CIESOL), working in (a) the summer and (b) the winter season.
Energies 13 03877 g002
Figure 3. Calculated phase diagram of the quaternary system (a) LiNO3-NaNO3-Mn(NO3)2-H2O, and (b) LiNO3-Mg(NO3)2-Mn(NO3)2-H2O, where (∙∙∙∙)—isotherms; (-)—univariate curve; (○)—calculated eutectic point e. (Based on [22]).
Energies 13 03877 g003
Figure 4. Mineralization results of a bischofite sample [25], indicating the presence of about 95% of magnesium chloride hexahydrate and 5% of impurities based on inorganic salts.
Energies 13 03877 g004
Figure 5. Experimental setup for the study of the melting and freezing cycles of isolated nodules. The image shows three nodules with S10, the phase change materials (PCM) developed within the project, and water (as a reference), with the temperature probes in the thermostatic bath.
Energies 13 03877 g005
Figure 6. Kinetics of melting (left panel) and freezing (right panel) of the PCM developed within the project for the cooling application and the commercial one S10, as shown by the evolution of the temperature in the nodule center. Experiments (symbols) and simulations (lines) are shown.
Energies 13 03877 g006
Figure 7. Required cooling and heating power of the CIESOL building throughout the year; calculations based on TMY data for Almeria, Spain.
Energies 13 03877 g007
Figure 8. Daily cooling and heating power consumption.
Energies 13 03877 g008
Figure 9. Heat flux released from two 2000-L tanks for a 7 kg/s water mass flow rate for the heating (left) and cooling (right) modes for different proportions of S46 and S10.
Energies 13 03877 g009
Figure 10. Heat flux released from two 2000-L tanks for 15–85% proportions of heating-PCM and cooling-PCM for heating (left) and cooling (right) modes for different water flow rates through the tanks.
Energies 13 03877 g010
Figure 11. Water outlet temperature from two 2000-L tanks for 15–85% proportions of heating-PCM and cooling-PCM for heating (left) and cooling (right) modes for different water flow rates through the tanks.
Energies 13 03877 g011
Figure 12. FlatICE containers installed in the CIESOL building (based on [34]).
Energies 13 03877 g012
Figure 13. The SCH system with two newly installed PCM-based storage tanks.
Energies 13 03877 g013
Figure 14. The main control panel of the SCH system with two PCM-based storage tanks.
Energies 13 03877 g014
Figure 15. Schematic representation of the upgraded SCH system coupled with two newly designed PCM storage systems in CIESOL, with the places of measuring the temperature for the added tanks highlighted.
Energies 13 03877 g015
Figure 16. Cooling application. Upper panel: Evolution of the temperatures before (TA) and after (TB) the PCM tanks and in the tanks. Lower panel: Electric and gas consumption as a function of solar time—left and right axis, respectively. Every charging/discharging period is identified by the decrease/increase of the temperature in the tanks, and by the energy consumed.
Energies 13 03877 g016
Figure 17. Heating application. Upper panel: Evolution of the temperatures before (TA) and after (TB) the PCM tanks, and in the tanks. Lower panel: Electric and gas consumption as a function of solar time—left and right axis, respectively. Every charging/discharging cycle is identified by the increase/decrease of the temperature in the tanks.
Energies 13 03877 g017
Figure 18. Stages of the energy and exergy flow in the cooling mode of the HVAC solar system of CIESOL.
Energies 13 03877 g018
Figure 19. Exergy efficiencies of solar collectors (left) and the absorption chiller (right) as a function of the temperature of incoming water and the flux in both systems.
Energies 13 03877 g019
Figure 20. Final results of exergy analysis of the HVAC system with and without PCMs.
Energies 13 03877 g020
Table 1. Predicted composition and experimental thermophysical characterization results of eutectic mixtures (based on [22]).
Mixture ComponentsMass RatioCp(s)Cp(l)ρ(s)ρ(l)η*T mΔHm
kJ kg−1 K−1kJ kg−1 K−1kg m−3kg m−3cPC°kJ kg−1
LiNO3⋅3H2O:
NaNO3:
Mn(NO3)2⋅6H2O
24.2:
3.0:
72.8
1.535
(273 K)
2.500 (290 K)1.753
(273 K)
1.65518.1810.8172.5
LiNO3⋅3H2O:
Mn(NO3)2⋅6H2O:
Mg(NO3)2⋅6H2O
22.9:
68.6:
8.5
1.250
(270 K)
2.428 (305 K)1.679
(273 K)
1.63818.1513.1152.8
* measured at 298K.
Table 2. Proportions and the number of S46 and S10 containers in the 2000-L tank, which were analyzed in the model research.
PCM\Proportions, %50–5040–6030–7020–8015–8510–90
S46907254362718
S1090108126144153162
Table 3. Material properties of S10 and S46 phase-change materials from PCM Products Ltd. [34].
PCMTmρΔHCpλ (s)Max Temp.
°Cg/cm3kJ/kgkJ/(kg K)W/m K°C
S10101.471701.900.4360
S46461.592102.410.4560
Table 4. Average daily consumption of the solar driven cooling system and operation times of every component. A conventional refrigeration system is included for comparison in the last row.
ComponentElectric Consump. (kWh)Operation Time
Solar cooling (SC)33.53 h 44′
Pump (second. loop)14.511 h 9′
Nocturnal conventional HVAC101.89 h 7′
Total149.824 h
Conventional HVAC246.124 h
Table 5. Average daily consumption of the solar driven heating system and the operation times of every component. A conventional heat pump is included for comparison.
ComponentElectric Consump. (kWh)Operation Time
Solar heating (SH)10.52 h 59′
PCM tanks14.321 h 1′
Total24.824 h
Conventional HVAC99.9324 h
Table 6. Percentage exergy efficiency, of the HVAC system in cooling mode.
StageSolar CollectorsHeat StorageChillerCold StorageOverall
Efficiency5.42%89.0%35.2%88.9%1.51%

