Article

Power System Hardware in the Loop (PSHIL): A Holistic Testing Approach for Smart Grid Technologies

by
Manuel Barragán-Villarejo
*,
Francisco de Paula García-López
,
Alejandro Marano-Marcolini
and
José María Maza-Ortega
Department of Electrical Engineering, Universidad de Sevilla, Camino de los Descubrimientos s/n, 41092 Sevilla, Spain
*
Author to whom correspondence should be addressed.
Energies 2020, 13(15), 3858; https://doi.org/10.3390/en13153858
Submission received: 20 June 2020 / Revised: 14 July 2020 / Accepted: 24 July 2020 / Published: 28 July 2020
(This article belongs to the Special Issue Advancements in Real-Time Simulation of Power and Energy Systems)

Abstract

:
The smart-grid era is characterized by a progressive penetration of distributed energy resources into the power systems. To ensure the safe operation of the system, it is necessary to evaluate the interactions that those devices and their associated control algorithms have between themselves and the pre-existing network. In this regard, Hardware-in-the-Loop (HIL) testing approaches are a necessary step before integrating new devices into the actual network. However, HIL is a device-oriented testing approach with some limitations, particularly considering the possible impact that the device under test may have in the power system. This paper proposes the Power System Hardware-in-the-Loop (PSHIL) concept, which widens the focus from a device- to a system-oriented testing approach. Under this perspective, it is possible to evaluate holistically the impact of a given technology over the power system, considering all of its power and control components. This paper describes in detail the PSHIL architecture and its main hardware and software components. Three application examples, using the infrastructure available in the electrical engineering laboratory of the University of Sevilla, are included, remarking the new possibilities and benefits of using PSHIL with respect to previous approaches.

1. Introduction

The power system is undergoing a revolution nowadays, with the fast evolution of new hardware and software technologies. Power electronics, automation, cloud computing, big data, information, and communication technologies are some of the key components of the so-called smart grid. These new technologies are the enablers of the electricity sector decarbonization pursued by a society worried about energy dependence and the environmental impact of the consumed energy [1]. Without any doubt, the fulfillment of the Kyoto protocol [2] for restricting CO2 emissions and other greenhouse gases is resulting in drastic changes in terms of the generation mix of the power system, where a more active participation of renewable energies is required, but also the electrification of the transportation sector [3].
As a result, the operation and planning of power systems both in the transmission and distribution sides turn out to be even more complex than before. In fact, the uncertainty associated with renewable power sources and electrical vehicle charging, the security of supply and power quality expected by the final users with competitive energy prices and the constrained investment on network assets are stressing the power system [4]. At the same time, however, the technologies required for reducing this stress and also improving network operation are ready, but their network deployment has to be carefully done. This is of utmost importance for those components that interact with the power system in an active manner, i.e., generators, protection devices, capacitor and reactor banks, On-Load Tap Changers (OLTCs), Flexible AC Transmission Systems (FACTS), High-Voltage DC links (HVDC), etc. Given the current automation level of the power system, where different control devices widespread along the network react to either local conditions or set points determined by a control center, it is mandatory to be sure that any new component does not interfere with the already existing ones.
For this purpose, simulation tools have brought a cost-effective solution to figure out the performance of a device or a system from its initial design stages, reducing the development costs and the time to market. The current available simulation tools cover almost all of the electrical engineering fields from electromagnetic transients to steady-state analysis. These design-support tools provide invaluable information, especially in the case of complex devices and systems. Simulation, however, is just one of the design process steps, experimental validation through a prototype or proof of concept always being required before any commercial product or even a pilot project. In fact, not all physical phenomena can be reproduced on a computer simulation tool because the reality is quite complex. In this regard, a recent branch of research, namely Hardware-in-the-Loop (HIL), focuses on the use of hardware and software tools to test devices and systems in the most realistic possible way and with a low investment. The main idea is to take advantage of the real-time simulation capabilities to test controllers or devices in a situation as close as possible to the reality. Two different and complementary options have been proposed in the HIL paradigm: Controller-Hardware-in-the-Loop (CHIL) and Power-Hardware-in-the-Loop (PHIL). Figure 1 describes these two HIL options and compares them with simulation tools. This figure highlights the simulated and physical devices (green and blue colored parts, respectively), the information flow, the power flows, and the interfaces between the actual and simulated environments. Let’s consider that the objective of the simulation is to validate the performance of a device, i.e., the Device Under Test (DUT), connected to a power system. For this purpose, it is required to model all of the system components with the required detail level, but also the DUT including its control algorithms. The simulation tool can be executed on a conventional computer or a Real-Time Control System (RTCS) [5,6,7,8,9]. A step forward on the technology validation consists of applying CHIL [10,11,12,13]. In this case, all of the power components (power system and power components of the device) are still simulated in a RTCS, but the device control algorithm is embedded into a physical controller, e.g., a digital signal processor, with the objective of its real-time testing. The interface between the DUT (physical controller) and the RTCS is done using adequate analog/digital input/output ports as shown in Figure 1. It is possible, however, to move a step forward towards the reality by incorporating power components in the tests using a PHIL approach. This requires a power amplifier, which acts as a front end between the simulated and physical parts. The power amplifier is in charge of imposing the voltage at the point of common coupling with the DUT, which is computed by the RTCS considering its reaction. For this purpose, it is required to feedback the DUT injected current in the real-time simulated power system by using adequate analog/digital input/output ports [14,15,16,17,18,19].
In spite of the benefits provided by HIL testing, it is also important to point out that these techniques, and especially PHIL, are devoted to analyzing the behavior of a single DUT connected to a network node. Therefore, some aspects related to the introduction of a new technology in the power system can be masked. Interactions between different DUTs, the impact on the power system of a massive deployment of a new smart grid technology or the interaction between physical devices (DUTs) and the algorithms in charge of determining their setpoints are just some of these. In order to overcome these shortcomings, this paper proposes to extend the PHIL approach by: (i) introducing the algorithms determining the DUT setpoints, i.e., Algorithm Under Test (AUT); (ii) expanding the test focus from the current device-oriented approach to a system-oriented concept including the impact of the tested technology on the power system. This new approach, namely Power System Hardware-in-the-Loop (PSHIL), may allow the evaluation of the impact of a given technology over the power system in a holistic manner, considering all its power and control components.
The structure of this document is as follows. Section 2 elaborates on the PSHIL architecture and components. Then, the PSHIL functionalities and benefits with respect to simulation and conventional HIL approaches are outlined. Subsequently, Section 4 describes the PSHIL environment of the Department of Electrical Engineering at the University of Sevilla. Section 5 shows some case studies to evidence the wide range of possibilities that PSHIL testing may offer to the power community. Finally, the paper closes with the main conclusions and future lines of research.

2. PSHIL Architecture

This section describes the different PSHIL components and how they interact each other. Basically, a general PSHIL architecture is shown in Figure 2, where the simulated and physical environments are differentiated. On the simulation side, all the components, including network, generators, loads, and AUTs, are represented using adequate models which interact on a real-time simulation platform. In contrast, the physical side comprises a set of actual elements which may involve networks, generators, loads, DUTs, and AUTs implemented in different ways. The interaction between the simulated and the physical environments must be done through adequate interfaces. Finally, note that a management layer is required to coordinate the simultaneous testing in both environments. The next subsections are devoted to detailing each of these components.

2.1. Real-Time Simulated Power System

In this case, the power system used for testing purposes is simulated using an RTCS. Buses, branches, loads, generators, etc. are fully simulated. The physical devices (DUTs) are connected to this simulated network through a controllable voltage source, which acts as a power amplifier [20] as shown in Figure 2. The purpose of this amplifier is to physically reproduce the instantaneous voltage on a given bus of the real-time simulated network. Then, the DUT connected to the amplifier reacts to this voltage according to its control algorithm. This reaction is normally reflected in a current absorption/injection from the power amplifier, which is measured and sent back to the RTCS to be considered in the real-time simulation. In this way, it is possible also to evaluate the DUT’s local impact in the simulated network. Note that this is quite convenient for testing local controllers (LCs) and hardware components of a single DUT (PHIL). However, it is also possible to envision configurations with multiple power amplifiers for simultaneously testing different DUTs. In this case, it should be possible to evaluate the interactions between the DUTs through the real-time simulated network, but at a cost of requiring one power amplifier for each tested DUT.

2.2. Physical Power System

Two alternatives can be presented in this case: full-scaled networks and scaled-down networks. In the first case, different buses are interconnected through electrical lines and the DUTs are full-scale prototypes that interact with the different network components. Without any doubt, this testing environment gives to the test results the highest credibility because it is quite close to an actual field deployment. The space requirements and cost for high-voltage an high-power applications have to be considered, however. On the other hand, it is possible to use scaled-down networks where a change of the system base (rated voltage and rated power) is applied to scale down a given original network to an adequate value to be used on a laboratory environment. In this way, the main scaled-down magnitudes (voltage, current, and power) expressed in per-unit values are exactly the same as the ones in the original system. The buses of the scaled-down systems are interconnected through resistors and inductors with adequate values for emulating the original electrical lines. This network requires physical generators and loads that will be analyzed later. The main advantage of these physical testing environments is that some phenomena difficult to reproduce in simulations, such as heating and electromagnetic interference, always appear. The main disadvantage, however, is the reduced flexibility to modify either the topology or the parameters of the electrical network. This may hamper the impact of the DUTs on networks with different characteristics.
It is important to highlight that the PSHIL approach also considers that simulated and physical networks may coexist in a testing environment, as shown in Figure 2. This may provide an extended flexibility degree, which will be later exemplified in Section 5.1.

2.3. Power Supply

The objective of the power supply used in the physical network is to energize the testing environment providing the required power for the loads and DUTs. For this purpose, it is possible to consider the following not mutually exclusive options:
  • External network. This is the most cost-effective option to supply the PSHIL platform since only a connection with an available external network is required. This usually corresponds to a node of the laboratory network in case of scaled-down distribution systems. The rated power and voltage depend on the characteristic of this connection node. This, however, has limited flexibility, as the PSHIL voltage and frequency are mainly imposed by the laboratory network. Therefore, intentional events such as voltage and frequency disturbances required for testing the provision of ancillary services [21,22,23] cannot be reproduced in a straightforward manner. This option, however, is adequate for analyzing the interaction of different DUTs and the power system in quasi-steady-state conditions [24,25,26,27].
  • Synchronous generator. In this case, a synchronous generator driven by a primary energy source (steam/hydraulic turbine, diesel motor, DC machine or induction motor fed with a variable speed drive) provides the power to the network [28]. Note that without a connection to an external network, the physical environment is operated in islanded mode. This endows the system with greater flexibility because it should be possible to reproduce frequency and voltage disturbances. Moreover, with the adequate control actions on those prime movers based on electrical machines (DC machine or induction motor fed with a variable speed drive), it should be possible to reproduce the dynamic behavior of any actual generator driven by a hydraulic/steam turbine or diesel motor without any complex auxiliary systems [29].
  • Controllable voltage source. This is the power-electronic counterpart of the synchronous generator where the mechanically coupled rotating machines are substituted by two voltage-source converters (VSCs) in a back-to-back configuration. This allows a total controlability of the output voltage with really fast dynamics. Note also that controllable voltage sources are an indispensable component for interfacing the real-time simulated with the physical network if required. The main drawback of these devices is the high cost, especially for those that are based on linear technology.
  • Actual renewable generators. This type of power supply, including photovoltaic and wind generators, provides realism to the testing. Its main drawback, however, refers to the impossibility of controlling the primary energy source, which considerably limits the replicability of the testing conditions.

2.4. Loads

The loads are elements that absorb power from the buses of the physical power system under study. These can be classified into passive or active elements depending on the control capability:
  • Passive elements. These are elements with no control capability to change their operating states according to setpoints. Resistors, inductors, and capacitors are within this group. The main advantage of these elements is that they are inexpensive, but at the cost of providing a limited flexibility, which may limit the testing scenarios.
  • Active elements. This kind of load allows controlling the power demand according to setpoints, with adapting the testing scenarios according to the user needs being possible. Moreover, this capability allows reproducing the daily load profiles of different customer types (domestic, commercial, and industrial loads). Commercial electronic loads or VSCs supplied from the DC side with an external DC source may act as a controllable active element. The main drawback, however, is that they are complex devices involving different technologies like power electronics and control and communication systems.

2.5. Devices and Algorithms under Test—DUTs and AUTs

DUTs correspond to an actual device whose functionality and impact on the power system is tested using a PHIL approach. The possible list of devices that can be found in the specialized literature is endless, ranging from photovoltaic (PV) inverters [30], wind generators [31], HVDC [32], FACTS [14], energy storage systems [33], electric vehicle charging stations [26], OLTCs for power transformers [34], to digital protective relays [35]. Similarly, the functionalities that can be tested are numerous: primary control of voltage and frequency of Distributed Energy Resources (DERs) [36], current control in VSCs, inertia emulation in DERs [37,38], protection of VSCs during short-circuit faults [20], high-frequency power smoothing of renewable energy resources [39], MPPT in PV systems [40,41], etc. The simultaneous implementation of these strategies in several DUTs within a PSHIL environment allows evaluating the global impact on the power system under study, but also, mutual interactions between different DUTs can be analyzed, such as the elimination of zero-sequence current flow between transformerless grid-connected VSCs with a common DC bus [42] or the resonance frequencies originating between VSCs [43] .
The PSHIL approach, in addition, considers the possibility of also testing algorithms (AUTs) for optimizing real-time system operation and which may interact with DUTs through adequate setpoints. Therefore, the PSHIL concept extends the testing capabilities associated with the PHIL approach. Several objectives can be implemented for centralized or decentralized control structures, such as voltage control [44,45,46], minimization of power losses [47], congestion release [48], or the optimal allocation of ancillary services provided by different distributed control resources [49], among others. Basically, these algorithms are implemented on a computer that receives all of the network information (static and real-time data) following the general scheme outlined in Figure 2. The AUT computes and sends the DUT setpoints according to the available information and the intended objective. Furthermore, the PSHIL approach allows including in the loop the validation of other components such as the communication infrastructure, e.g., communication latencies, which are key for a comprehensive assessment of the real-time control strategies.
Therefore, the PSHIL concept simultaneously combines device- and system-oriented testing, which provides a new holistic approach especially suited to complex smart grid technologies.

2.6. PSHIL Management

The objective of the management layer is to coordinate the different components involved in the PSHIL testing platform. Basically, it consists of a hierarchical control architecture comprising two layers:
  • Local controllers. The first control layer consists of the different LCs associated with each element, i.e., loads, generators, or DUTs. The objective of each LC is to guarantee that the corresponding device follows specific setpoints during the tests, which are sent by the centralized PSHIL management. Additionally, LCs are in charge of monitoring and protecting the controlled device.
  • Centralized PSHIL management. This layer is in charge of several tasks, which can be broadly classified into two main categories [24]: off-line and on-line tasks. On the one hand, off-line tasks are devoted to configuring the testing scenario by: (i) adjusting the topology and parameters of the networks; (ii) defining the operation of loads and generators; and (iii) setting the functionalities of DUTs and AUTs. On the other hand, online tasks are committed to controlling and supervising the tests. Control tasks are required to send to the different LCs the adequate setpoints according to the defined testing scenario. Note that some of these setpoints are defined by the offline tasks, e.g., active power demand of a load, but other ones can be determined in real-time by the AUT, e.g., optimal reactive power of a distributed generator. In any case, all of these setpoints are managed by this centralized management layer. In turn, supervision tasks are in charge of monitoring the relevant electrical magnitudes with a twofold objective: guaranteeing the safe operation of all of the physical components (network, loads, generators, and DUTs) and gathering all of the required measurements. These measurements are provided to the AUTs, which may use them to compute the DUT setpoints, but are also stored for later analysis.
The information flow between the central management and LCs of generators, loads, and DUTs, as well as the interfaces between the simulated and physical networks, are key for proper PSHIL operation. Following a top-down description, the centralized PSHIL management layer is connected with each LC by using digital signals according to a communication protocol (CAN, Modbus, UDP, etc.) over a communication channel (RS-232, RS-485, Ethernet, etc.). Communication latencies depend on the performed tests, but usual values are in the order of seconds. Then, LCs are in charge of following these setpoints commanded by the centralized management layer, usually based on closed-loop algorithms to achieve a good dynamic response. For this purpose, it is required to manipulate analog signals related to the physical controlled device. This control loop latency depends on the required control bandwidth, but typical values are around dozens of microseconds. Regarding the interfaces between the simulated and physical environments, an information exchange as rapid as possible is required to avoid the problems generated by the time delays [50]. For this reason, the information exchange from the real-time simulation to the physical environment, and vice versa, is done by means of analog measurements that are regularly sampled at dozens of microseconds.

2.7. Energy Management

The energy management between the components of the PSHIL depends on whether the system under study is connected to a main electrical network or operates in islanded mode. In the first case, the electrical network is responsible for supplying or absorbing the energy necessary to maintain the power balance between loads and generators in the system. In islanded mode, however, it is required to provide adequate energy management to assure this active and reactive power balance. In this regard, two operation modes are clearly distinguished: communication-based and communication-less schemes [51]. The former schemes collect data from the PSHIL components (voltage, current, power, etc.) using a communication infrastructure in order to set the output power of the generators. Two alternative energy management algorithms within this group are usually implemented: centralized and decentralized energy management schemes [52]. The centralized algorithms receive all of the data from the PSHIL components in the Centralized PSHIL management layer and sets the operating points of the generators according to an objective, such as minimizing system operation and maintenance costs, environmental impact, or power losses [53,54]. In decentralized energy management schemes, local controllers of generation units exchange information through a communication bus. This information is used by the local controllers to determine an adequate setpoint by means of an optimization algorithm based on the shared information. Artificial-intelligence-based methods such as neural network or fuzzy systems [55] along with genetic algorithms have been used for this purpose [56]. Conversely, in communication-less schemes each generator operates independently without a communication infrastructure to exchange information with a control center or other generators. Droop-based strategies for frequency and voltage control implemented in each generation local controller are the most common techniques for energy management in this case [57].

3. PSHIL Benefits

The flexibility provided by the PSHIL approach clearly enlarges the testing capability with respect to the HIL concept. Basically, PSHIL may simultaneously test device and system functionalities provided by the DUTs and AUTs, as shown in Table 1. In this regard, it is interesting to note that the PSHIL approach is as powerful as a simulation tool but within an actual hardware environment close to the reality. Some examples of the functionalities tested using a PSHIL approach have been reported in [25,26]. In the first work, an Optimal Power Flow (OPF) for losses minimization (AUT) using an OLTC, a DC link, and distributed generators (DUTs) have been tested in a scaled-down MV distribution system. The second work deals with the integration of an electric vehicle charging station in an LV distribution network (DUT) to balance the MV/LV transformer loading (AUT). Both works reveal that the PSHIL approach allows us to obtain specific conclusions about the DUT and AUT’s performance but also the global impact of the tested technology on the network.
It has to be said, however, that this proximity to the reality is at the cost of relying on a physical network, which is difficult to reconfigure or adapt to other scenarios. In spite of this limitation, the PSHIL concept has several advantages with respect to simulation and conventional HIL strategies:
  • Simultaneous testing of different DUTs considering their mutual interaction through the real-time simulated or actual power system.
  • Simultaneous testing of DUTs and AUTs, which analyzing the performance of closed control loop actions in real conditions.
  • Simultaneous testing of different technologies such as power electronics, control software, communication infrastructure, etc., which may interact each other.
  • Power-system-oriented testing capability in addition to the classical device-oriented approach.

4. PSHIL Infrastructure at the University of Sevilla

This section is devoted to describing the PSHIL infrastructure implemented in the Department of Electrical Engineering at the University of Sevilla. Figure 3 and Figure 4 show a scheme and a view of this laboratory, respectively, whose main components are the following.
  • Real-time simulated network. OPAL-RT is available for simulating in real-time any transmission or distribution network.
  • Physical electrical network. The PSHIL infrastructure has a scaled-down version of the MV distribution network proposed by the CIGRE Task Force C06.04.02 for the analysis of the distributed generation [58]. This physical system, whose one-line diagram is shown in Figure 5, is fully described in [24]. Basically, it is composed of two feeders with 14 nodes where different loads, generators, and DUTs can be connected. The lines between the different nodes are emulated using their corresponding lumped resistive and inductive parameters. This physical system is rated to 400 V and 100 kVA at the head of the feeders.
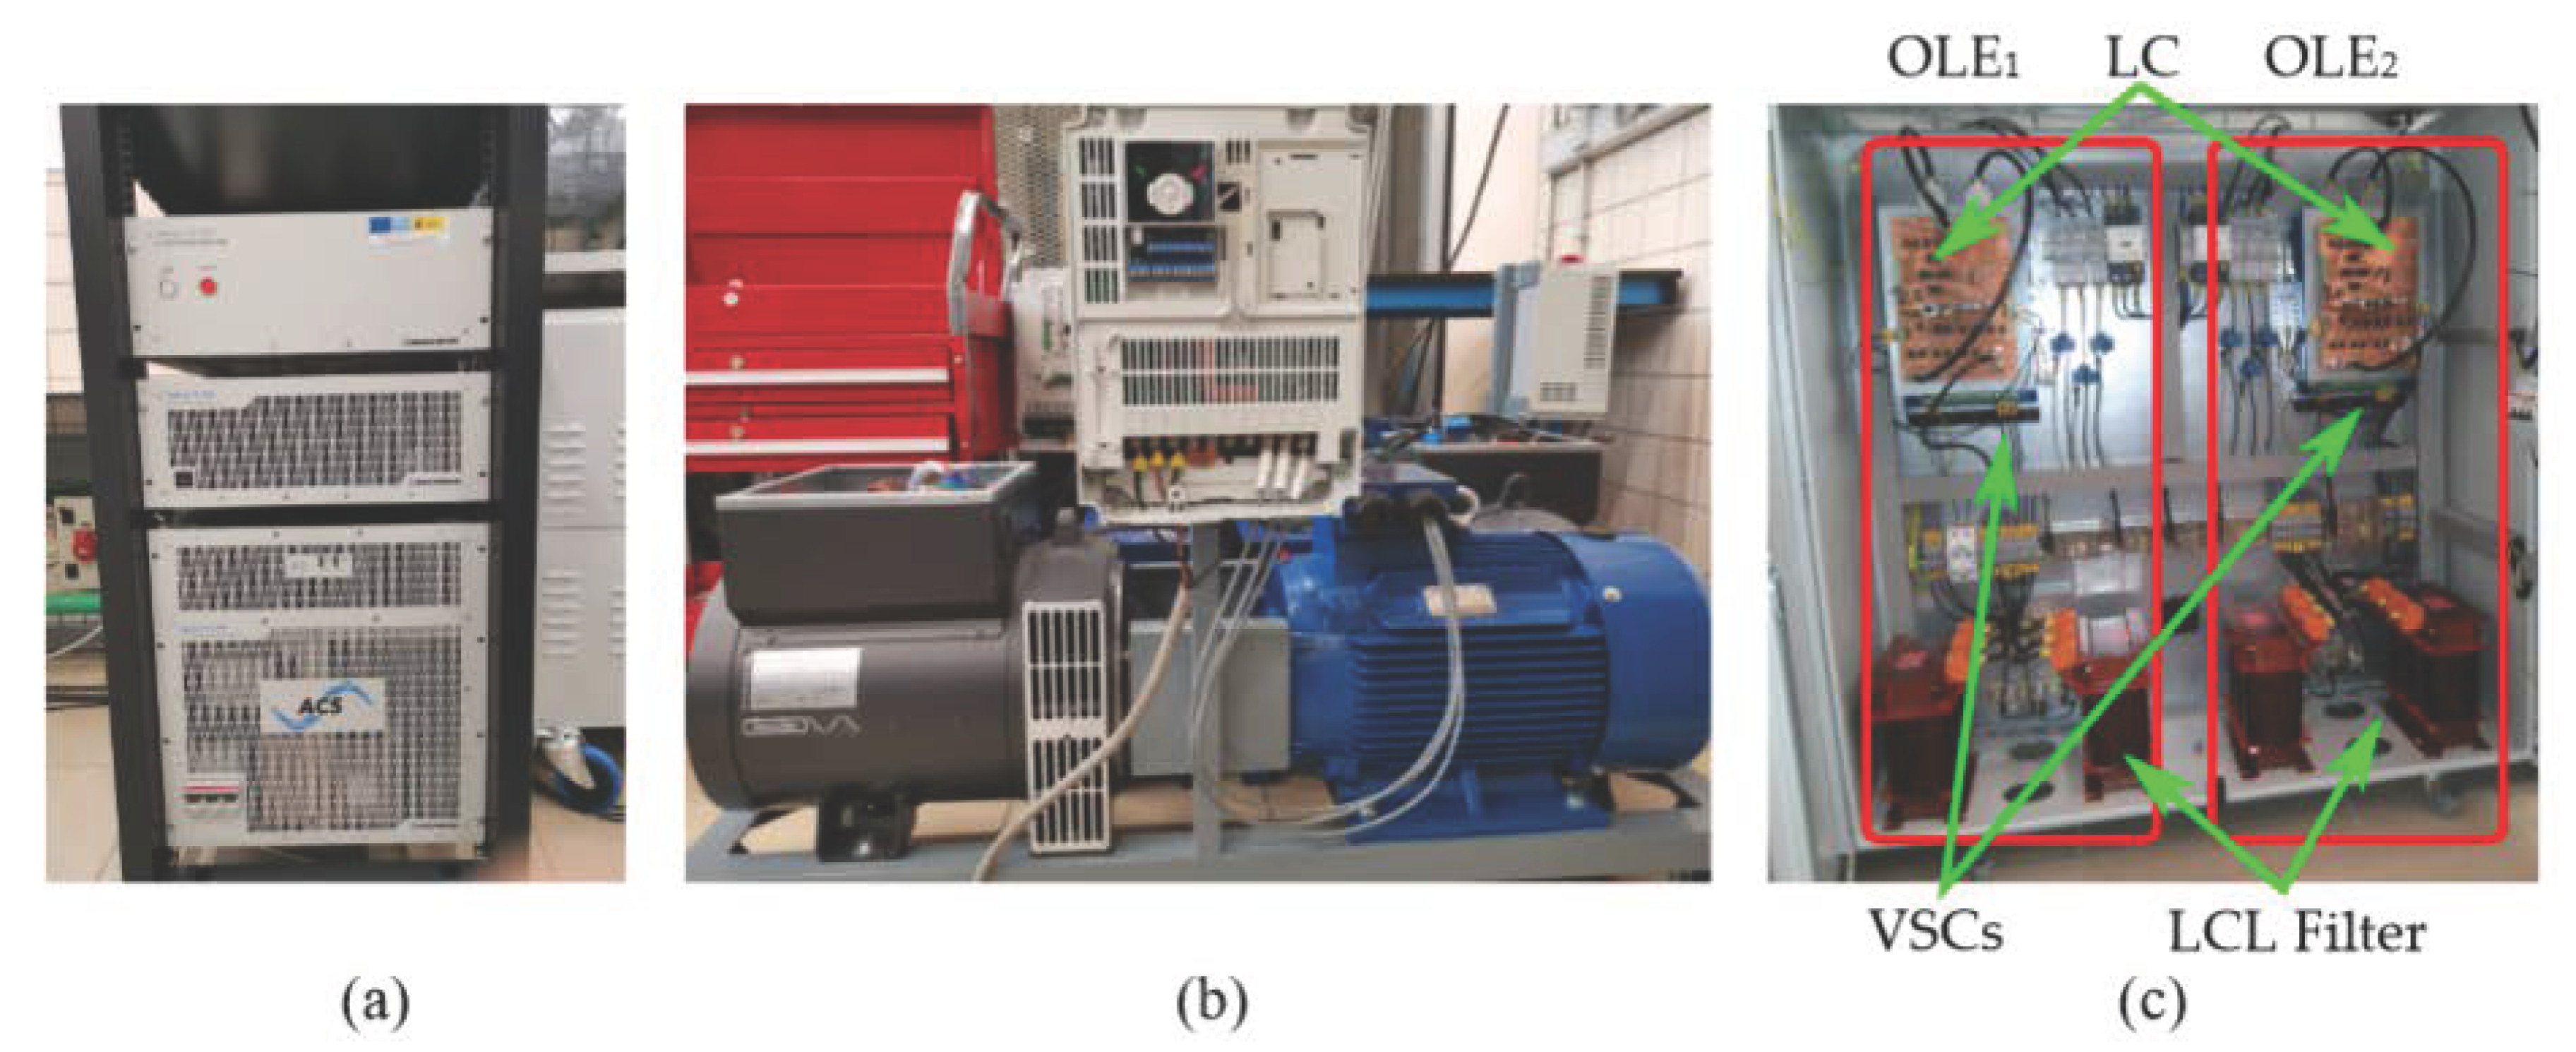
  • Power supply. Three different possibilities are available: laboratory LV network, synchronous generators, and power amplifier. The laboratory LV network, 400 V and 100 kVA, is the common option for the grid-connected analysis of the network under study. For those tests where a precise control of the supply voltage is required, a Regatron TC.ACS power amplifier shown in Figure 6a, 400 V and 50 kVA, is used. This power amplifier can also be connected to the OPAL-RT platform for interfacing a DUT. The synchronous generators shown in Figure 6b, 3 units rated to 400 V and 15 kVA, can be used for testing the network in islanded conditions. In this case, the synchronous generators are driven by induction motors fed with a variable speed drive.
  • Loads. The PSHIL infrastructure is equipped with active loads able to change their operating point (active and reactive powers) according to an external reference provided by the management layer. The active loads are based on the Omnimode Load Emulator (OLE) concept [24]. Basically, an OLE is composed pf a controlled VSC that is connected to a node of the scaled-down distribution network in its AC side. Additionally, the DC side is connected to a common DC bus that is controlled by an additional VSC in charge of providing the required active power of each OLE connected to the DC bus. Note that the OLEs can be used for emulating loads or generators, and the balanced VSC, which is connected to the laboratory LV grid, has to provide just the net power injected to the physical scaled-down distribution network. Each individual OLE, shown in Figure 6c, is based on a two-level VSC that is controlled following a classical PI approach in dq coordinates [24]. All of the OLEs are rated to 400V and 20 kVA, while the balanced VSC in charge of regulating the DC bus voltage is rated to 400 V and 100 kVA. The OLEs are connected to the buses N3, N5, N6, N7, N8, N9, N10, and N14.
  • DUTs. Two DUTs are so far available to be tested in this PSHIL infrastructure. First, a DC link between the nodes N8 and N14 for controlling the active power transfer between the feeders and also the reactive power injections at these nodes as shown in Figure 5. The DC link is rated to 400 V and 20 kVA. Second, a static OLTC based on thyristor technology coupled to a 400 ± 5 % / 400 V transformer installed at the connection point with the laboratory network, which allows regulating the supply voltage on load. In addition, it is important to highlight that the design of this PSHIL infrastructure is quite flexible, being possible to incorporate also as DUT some of the already analyzed OLEs, or any other device. In fact, [25] analyzes the minimization of power losses (AUT) in the scaled-down distribution system using the static OLTC, the DC link, and the reactive power injections of some distributed generators emulated with the OLEs.
  • PSHIL management. It has been implemented in a real-time platform provided by SpeedGoat. Particularly, this management system provides a bidirectional communication channel with the OLEs, DUTs, and AUTs by means of an UDP/IP communication protocol. The time latency with the local controllers of OLEs and DUTs is in the range of hundreds of microseconds, while the characteristic latency of AUTs depends on the algorithm but are in the range of minutes.

5. PSHIL Example of Application

This section is devoted to describe a PSHIL application example using the University of Sevilla infrastructure presented in the above section. The objective is to evidence some of the main functionalities of a PSHIL testing environment to validate the integration of different DUTs and AUTs and their global impact on the power system under study. This application example revolves around the benefits that active distribution network management may bring to the operation of distribution systems with a high distributed energy resource (DER) penetration. This is usually studied in the MV and LV levels separately, but this section presents a simultaneous analysis of these two voltage levels. In order to do so, three different test cases following a step-by-step procedure will be presented to reach the pursued final goal.

5.1. PSHIL Infrastructure Used in the Application Example

The proposed application example comprises MV and LV distribution networks. The scaled-down distribution network supplied from the laboratory network previously described is used for this purpose. The LV network selected in this case is the residential feeder of the LV benchmark network proposed by the CIGRE Task Force C06.04.02 for the analysis of distributed generation in LV systems, shown in Figure 7 [58]. This LV network is simulated in real time using the OPAL-RT platform. It has been assumed that the LV network is connected to bus N14 of the MV scaled-down network as shown in Figure 5. The interface between these networks is done by the OLE connected at this bus following the scheme shown in Figure 8. To do so, the active and reactive powers of the LV network computed in the real-time simulation ( P M 0 , Q M 0 ) are sent to the corresponding OLE as references using the OPAL-RT analog outputs. Conversely, the voltage measured in bus N14 of the MV scaled-down network is sent to the real-time simulation to be considered as the bus M0 voltage using the OPAL-RT analog inputs. Note that the OLE connected to bus N14 also has to emulate an industrial load with power references ( P 14 i n d , Q 14 i n d ) sent from the management layer. Therefore, the OLE reference powers ( P N 14 , Q N 14 ) are the sum of these two setpoints.
Regarding the MV scaled-down physical network, the OLEs are connected to the following buses: N3, N5, N6, N7, N8, N9, and N10. Each bus has a combination of generators (photovoltaic and wind turbine) and loads (industrial and domestic types) with a peak power defined in Table 2. These peak power values correspond to those of the scaled-down system being required to apply the corresponding scale factor to obtain the values referred to the original system (20 MVA/100 kVA). A constant power factor of 0.87 for industrial loads and 0.98 for domestic loads has been assumed. The 24-h active power profiles of loads and generators are detailed in Figure 9 in per-unit values. The DUTs to be tested connected to this physical system are the distributed generation emulated by OLEs, the OLTC, and the DC link. These DUTs follow the optimal setpoints computed by an OPF that minimizes the power losses (AUT) [25].
Similarly, the loads and generators connected to the LV real-time simulated network get the same power profiles than the ones used in the physical system and represented in Figure 9. The peak power of the load and generators connected to each node is summarized in Table 3. Note that these values correspond to the original system rather than a scaled-down one because this network is simulated. Therefore, the corresponding scale factor must be applied to compute the reference powers ( P 14 , Q 14 ). The AUT to be tested considers the reduced communication infrastructure associated with LV distribution systems, which prevents the use of secondary controllers like the one applied in the MV network. In this case, it is proposed to test an AUT that assigns a voltage reference to each distributed generator of the network, computed on a planning stage based on historical data. The local controllers of the distributed generators apply a reactive power droop strategy to achieve the assigned voltage reference.

5.2. PSHIL Test Cases

The test cases used to demonstrate the benefits of an active management of MV and LV distribution systems have been organized in a step-by-step manner as follows:
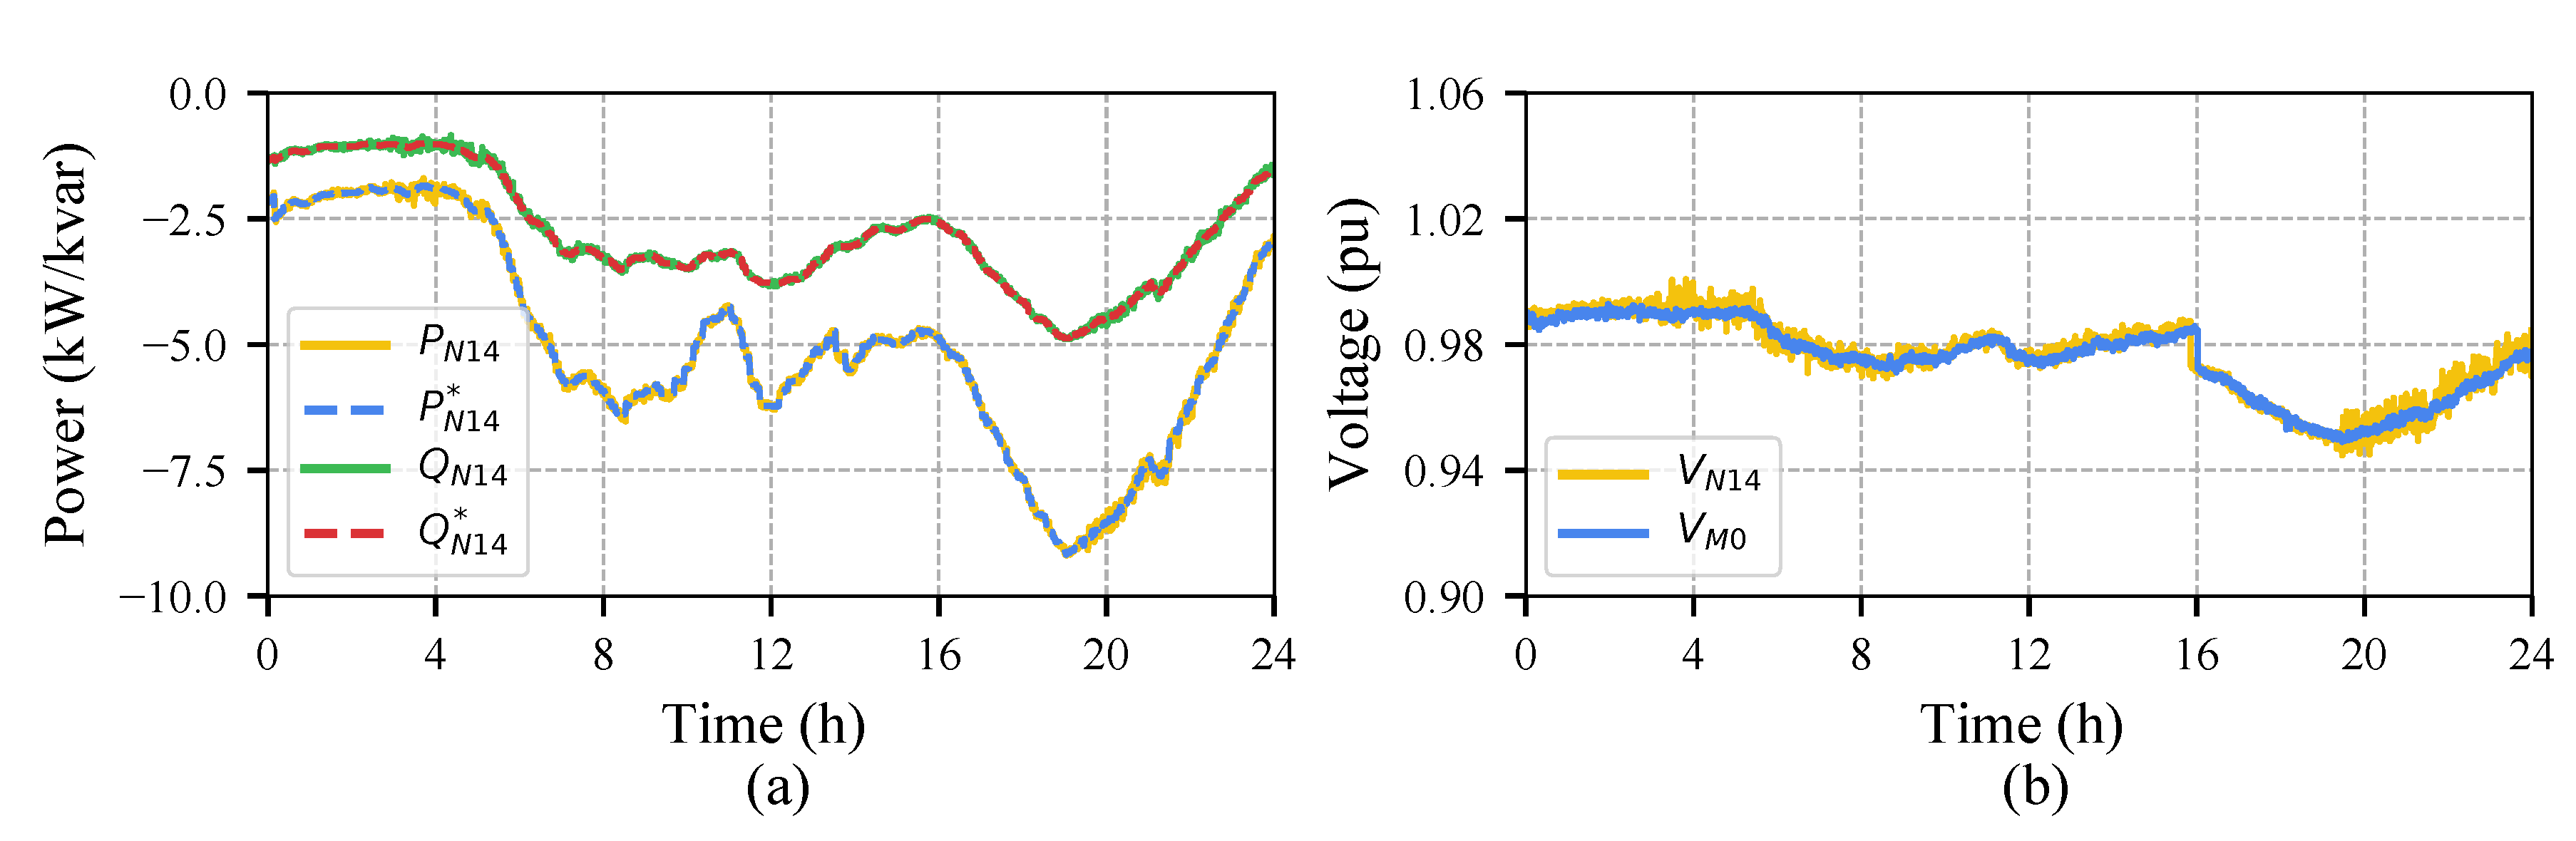
  • PSHIL MV and LV network coupling (PSHIL-1). This test case evaluates the performance of the DUT in charge of interfacing the physical network and the real-time simulated network. This corresponds to the OLE connected to bus N14 of the physical system.
  • PSHIL MV control assets (PSHIL-2). The MV network DUTs (DERs, OLTC, and DC Link) are added to the previous case with setpoints computed by an AUT based on an OPF to minimize power losses. In addition to the assessment of each individual DUT, this case is focused on the impact of MV control assets to both MV and LV networks.
  • PSHIL MV/LV control assets (PSHIL-3). This case adds to the previous case the voltage control on the LV network using a local reactive power droop strategy. Therefore, it should be possible to evaluate how the LV network control assets react with the MV and LV network changes.
Table 4 collects the DUTs/AUTs and the functionalities tested in each case. This table clearly shows the step-by-step procedure followed to reach the final goal of simultaneous testing of an active management of MV and LV distribution systems with a high DER penetration.

5.3. PSHIL Experimental Results

5.3.1. PSHIL-1 Results

Figure 10a shows the 24-h active and reactive power profiles of the OLE connected to bus N14 for the test case PSHIL-1. This OLE is in charge of emulating an industrial load, detailed in Table 2, and also the integration of the LV real-time simulated network into the physical MV scaled-down system. The continuous lines represent the actual OLE active and reactive powers, while the dashed lines correspond to the setpoints (sum of the industrial load and LV real-time simulated network). It can be observed that there is hardly any difference between the power references and the actual injected values. In addition, Figure 10b compares the voltages measured at bus N14 and the ones used in the real-time simulation for bus M0. Both voltages are practically coincident, similarly to what happens with the powers. Therefore, these results confirm an adequate integration of the LV real-time simulated network into the physical MV scaled-down network.
Figure 11a shows the daily voltages of buses N3, N6, and N14 where undervoltage situations (voltages below 0.95 pu) during some periods are noticed. These undervoltages are more severe in those buses located farther away from the primary substation and mainly concentrated during the hours without DER injections. Conversely, these are responsible for the voltage peaks around 11:00 in nodes N3 and N14 because of the DER-related active power profile shown in Figure 9. It is interesting to note that this effect is not reproduced in bus N14 because the DC link is not connected in this test case and the net active power of the industrial load and the real-time simulated LV network is always negative (consumption), as shown in Figure 10a.
Figure 11b illustrates the nodal voltages of buses M1, M4, and M7 within the real-time simulated LV system. Similarly to the MV system, undervoltages arise around 20:00 and peak voltages around 11:00 when PV generation is peaking. Note that this effect is more prominent in bus M7, where PV generation is connected, becoming even higher than voltages in buses M4 and M1, which indicates a reverse power flow in the lines connecting these nodes. Bus M1 voltage is barely modified during this period of PV peaking because of its proximity to the MV/LV transformer. It can be observed, anyway, that the general voltage trend in the LV network is imposed by bus N14 of the MV network, especially in those periods without LV DER injections. These conclusions arise from the simultaneous analysis of the MV and LV networks facilitated by the proposed PSHIL approach.

5.3.2. PSHIL-2 Results

The AUT in the test case PSHIL-2 is an OPF for minimization of power losses in charge of defining the setpoints of the MV DUTs (OLTC, DERs, and DC link), whose daily evolution is detailed in Figure 12. The following comments can be stated for each of these DUTs:
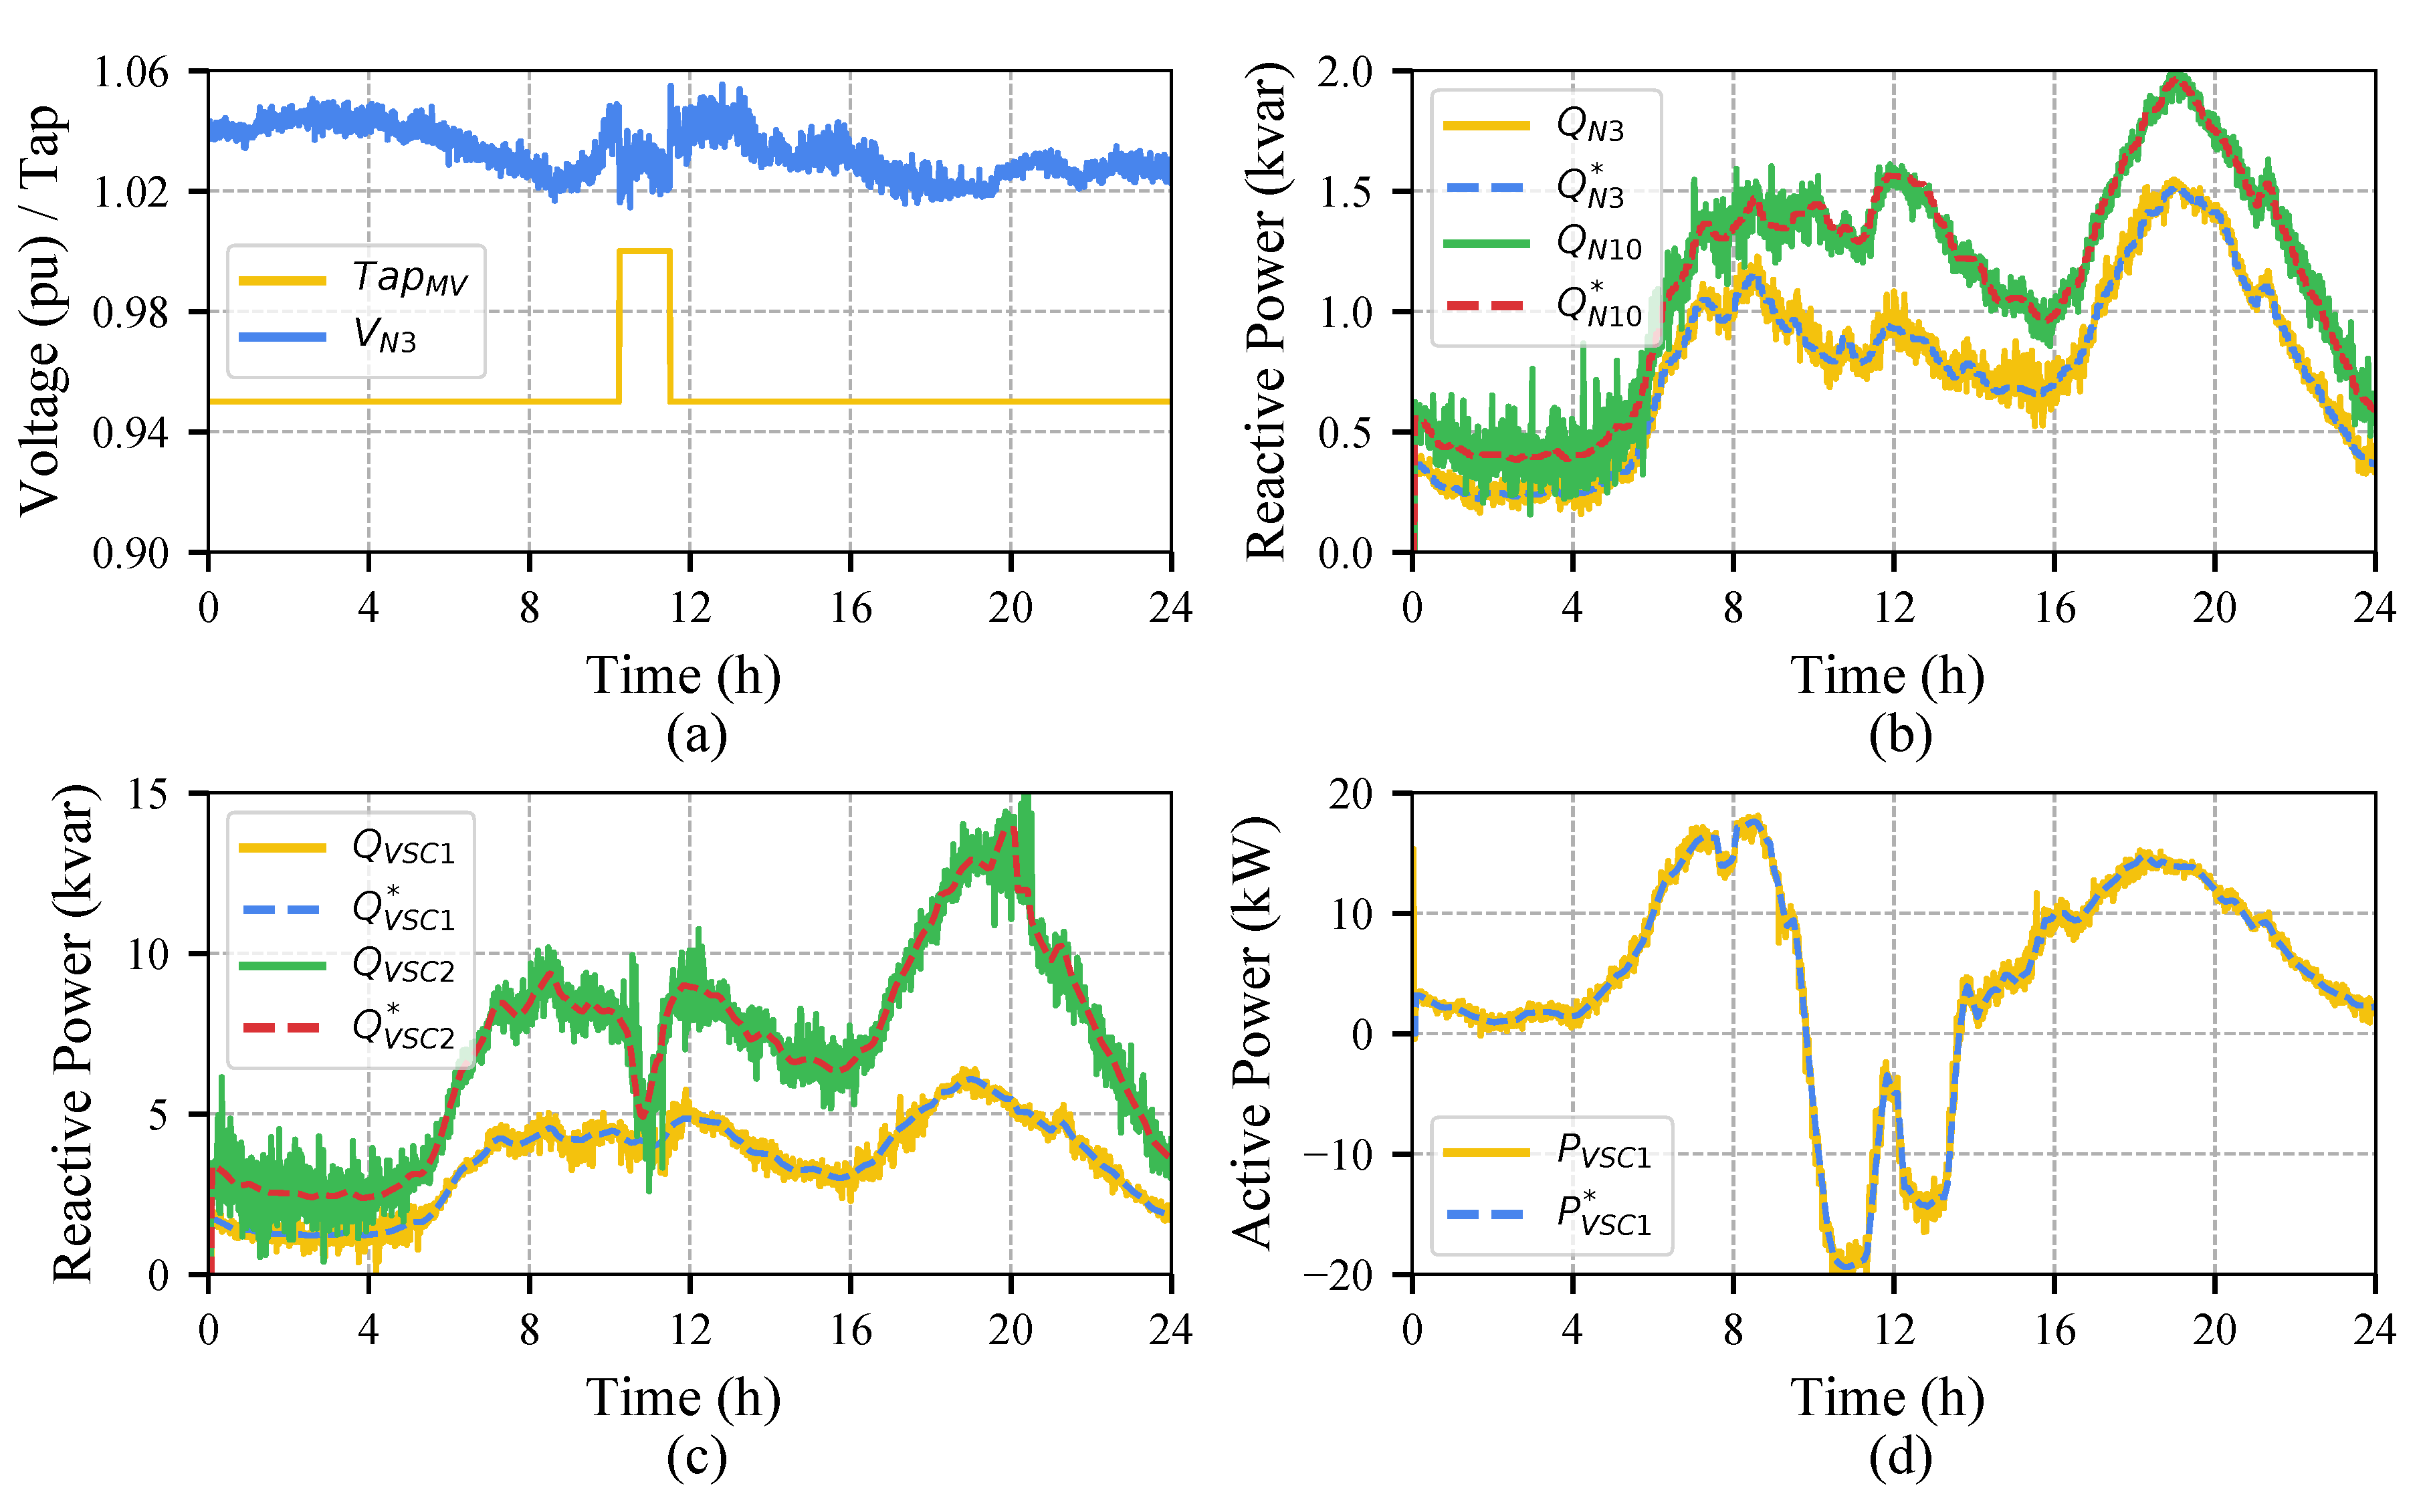
  • OLTC. Figure 12a shows the 24-h OLTC tap position and the voltage of bus N3. The tap position is maintained most of the time in the lowest position in order to increase the MV voltages to reduce the power losses as much as possible. However, the tap is changed to its central position during the period when the DER injects the maximum power to fulfill the maximum voltage constraint imposed by the OPF (1.05 pu).
  • DERs. The reactive power injections of DERs connected to buses N3 and N10 are depicted in Figure 12b. These show a proper tracking of the setpoints computed by the AUT. Note that the reactive power injection in bus N10 is higher that in bus N3 because of the electrical distance. This bus is farther away from the initial node of the MV scaled-down network and, therefore, experiences a larger voltage drop caused by the loads. This requires a higher reactive power injection to maintain the voltages as high as possible.
  • DC link. The 24-h active and reactive power flows through the DC link are depicted in Figure 12c and Figure 12d, respectively. The setpoints computed by the AUT are tracked without errors by the DC link. Both DC-link sides inject reactive power to their corresponding connection nodes to increase the voltages locally. In addition, the DC link transfers active power from N8 to N14 around noon when the PV generation injects the maximum power. The opposite situation happens in the rest of the day, where the DC link acts to equalize the load of each MV scaled-down distribution feeder to reduce the active power losses as much as possible.
Therefore, it can be claimed that the adequate control actions are computed by the AUT and executed correspondingly by the corresponding DUTs.
Regarding the impact of the AUT on the tested power system, it is interesting to note the evolution of the MV and LV voltages shown in Figure 13. This figure represents the voltages of the same nodes represented in Figure 11 for the test PSHIL-1. Regarding the MV nodes, it can be clearly noticed that most of the time the voltages are above 1 pu and very close to 1.05 pu, which is the maximum voltage considered in the OPF. In addition, a flatter voltage profile can be observed compared to those of Figure 11a in spite of the highly variable DER generation. On the other hand, the evolution of the LV buses detailed in Figure 13b shows a similar evolution than the voltage of bus N14. This is reflected in a voltage increase of all LV buses thanks to the AUT and DUTs of the MV network, which avoid undervoltage situations (below 0.95 pu). This effect is especially remarked around hour 11, where the OLTC action drastically reduces the voltages of the LV buses. Finally, it is interesting to note the AUT effect on the power losses of the MV and LV networks, which have been reduced with respect to PSHIL-1 from 0.584% to 0.465% and 7.086% to 6.382%, respectively.

5.3.3. PSHIL-3 Results

In this case, the same voltage reference was imposed for all of the LV PV generators, for simplification purposes. Figure 14 shows the voltage and the active and reactive powers injected in by the PV connected in node M7. The bus voltage is compared with the reference voltage (1.05 pu) to compute the reactive power injection using a linear droop strategy. Note that the reactive power injection shown in Figure 14b is always positive because the nodal voltage is most of the time below the reference voltage, as shown in Figure 14a. This is especially noticeable at night when the voltages are low due to the network loading and the PV uses most of its capacity to inject reactive power according to the rated power detailed in Table 3.
Regarding the impact of these control actions on the distribution system, Figure 15 shows the daily voltage profiles on the MV and LV networks. The MV voltages, shown in Figure 14a, are almost the same as those presented in PSHIL-2 because only one LV distribution network has been simulated and, therefore, its effect on the MV side is barely noticed. The analysis of the LV voltages, however, reveal some differences due to the voltage control algorithm implemented in this network. During the midday hours, the PV power injection causes the voltage in bus M7 to be higher than the voltage in bus M1, revealing an inverse power flow between these two LV nodes. During the evening, with the peak load and the absence of PV active power injection, the voltage decreases. However, the influence of the reactive power injection using the spare PV converter capacity is noticeable comparing the voltage of buses M4 and M7. Note that in this evening period, the voltage at bus M7 is very close to that of bus M4, even though its electrical distance to the head node is larger. This effect is also noticeable when comparing these nodal voltages in the test PSHIL-2 (Figure 13b), where no LV control actions are applied. Finally and regarding the power losses, the LV local voltage control achieves a reduction of power losses from 6.382% reported in PSHIL-2 to 4.590%.

6. Conclusions

This paper has presented a new HIL approach for simultaneously testing several DUTs and AUTs interacting with each other in a power system. In this way, the proposed PSHIL approach can be considered a natural evolution of the PHIL concept, which is mainly focused on the individual performance of a DUT connected to a network node. The PSHIL architecture has been depicted including a description of its main actual and simulated components classified according to their functionalities.
The PHSIL infrastructure available at the electrical engineering laboratory of the University of Sevilla has been used as an example of application to evidence the PSHIL testing functionalities, analyzing the active management of a MV and LV distribution system with high penetration of renewable generation. Different cases have been tested, each of which evidences some of the possible functionalities of the PSHIL approach.
The first test (PSHIL-1) shows how to integrate an LV real-time simulated network into a physical scaled-down MV system. The second one (PSHIL-2), using the first test as a starting point, elaborates on the use of an OPF (AUT) for power losses minimization in the physical MV scaled-down network combined with several DUTs (OLTC, DER reactive power, and a DC link) in charge of following the OPF-computed optimal setpoints. Finally, the third test case (PSHIL-3) introduces a voltage control algorithm in the LV network based on local conditions in buses where DERs are connected.
In conclusion, the staged testing procedure has demonstrated the PSHIL capacity of simultaneously analyzing an MV and LV distribution system in a hardware environment. Moreover, the results shown in the previous section evidence that the individual performance of each DUT can be successfully studied, as well as their impact on the power system. The PSHIL concept allows an evolution from a device- to a system-oriented testing approach, providing a powerful framework for the study of smart grid technologies and allowing an assessment of the potential benefits that new technologies may bring to the power system.

Author Contributions

Conceptualization, M.B.-V. and J.M.M.-O.; Methodology, M.B.-V.; Software, ; F.d.P.G.-L. and A.M.-M.; Validation, M.B.-V. and F.d.P.G.-L.; Formal Analysis, J.M.M.-O. and A.M.-M.; Investigation, M.B.-V.; Resources, J.M.M.-O.; Data Curation, F.d.P.G.-L.; Writing—Original Draft Preparation, M.B.-V., J.M.M.-O. and A.M.-M.; Writing—Review & Editing, M.B.-V., J.M.M.-O. and A.M.-M.; Visualization, F.d.P.G.-L.; Supervision, M.B.-V. and J.M.M.-O.; Project Administration, J.M.M.-O.; Funding Acquisition, J.M.M.-O. All authors have read and agreed to the published version of the manuscript.

Funding

This research was funded by the Spanish Ministry of Economy and Competitiveness and the European Union Horizon 2020 under grant numbers ENE2017-84813-R and 764090, respectively. The APC was funded by the Ministry of Economy and Competitiveness under grant number ENE2017-84813-R.

Conflicts of Interest

The authors declare no conflict of interest.

Abbreviations

The following abbreviations are used in this manuscript:
ACAlternating Current
AUTAlgorithm Under Test
CHILController-Hardware-in-the-Loop
DCDirect Current
DERDistributed Energy Resource
DUTDevice Under Test
FACTSFlexible AC Transmission System
HILHardware-in-the-Loop
HVDCHigh-Voltage DC
LCLocal Control
LVLow Voltage
MVMedium Voltage
OLEOmnimode Load Emulator
OLTCOn-Load Tap-Changer
OPFOptimal Power Flow
PHILPower-Hardware-in-the-Loop
PSHILPower-System-Hardware-in-the-Loop
POIPoint of Interconnection
PVPhotovoltaic
RTCSReal-Time Control System
VSCVoltage Source Converter

References

  1. International Energy Agency. Global EV Outlook 2018: Towards cross-modal electrification. In Proceedings of the Clean Energy Ministerial, Copenhagen, Denmark, 22–24 May 2018. [Google Scholar]
  2. Kyoto Protocol to the United Nations Framework Convention on Climate Change. 1998. Available online: https://unfccc.int/resource/docs/convkp/kpeng.pdf (accessed on 16 March 1998).
  3. Steinberg, D.; Bielen, D.; Eichman, J.; Eurek, K.; Logan, J.; Mai, T.; McMillan, C.; Parker, A.; Vimmerstedt, L.; Wilson, E. Electrification and Decarbonization: Exploring U.S. Energy Use and Greenhouse Gas Emissions in Scenarios with Widespread Electrification and Power Sector Decarbonization; Technical Report; NREL: Washington, DC, USA, 2017. [CrossRef] [Green Version]
  4. De Quevedo, P.M.; Muñoz-Delgado, G.; Contreras, J. Impact of Electric Vehicles on the Expansion Planning of Distribution Systems Considering Renewable Energy, Storage, and Charging Stations. IEEE Trans. Smart Grid 2019, 10, 794–804. [Google Scholar] [CrossRef]
  5. Yu, X.; Jiang, Z.; Zhang, Y. Control of Parallel Inverter-Interfaced Distributed Energy Resources. In Proceedings of the 2008 IEEE Energy 2030 Conference, Atlanta, GA, USA, 17–18 November 2008; pp. 1–8. [Google Scholar] [CrossRef]
  6. Li, H.; Li, F.; Xu, Y.; Rizy, D.T.; Kueck, J.D. Adaptive Voltage Control With Distributed Energy Resources: Algorithm, Theoretical Analysis, Simulation, and Field Test Verification. IEEE Trans. Power Syst. 2010, 25, 1638–1647. [Google Scholar] [CrossRef]
  7. Li, H.; Li, F.; Xu, Y.; Rizy, D.T.; Kueck, J.D. Interaction of multiple distributed energy resources in voltage regulation. In Proceedings of the 2008 IEEE Power and Energy Society General Meeting—Conversion and Delivery of Electrical Energy in the 21st Century, Pittsburgh, PA, USA, 20–24 July 2008; pp. 1–6. [Google Scholar] [CrossRef]
  8. Yang, T.; Wu, D.; Stoorvogel, A.A.; Stoustrup, J. Distributed coordination of energy storage with distributed generators. In Proceedings of the 2016 IEEE Power and Energy Society General Meeting (PESGM), Boston, MA, USA, 17–21 July 2016; pp. 1–5. [Google Scholar] [CrossRef]
  9. Xu, S.; Sun, H.; Zhang, Z.; Guo, Q.; Zhao, B.; Bi, J.; Zhang, B. MAS-Based Decentralized Coordinated Control Strategy in a Micro-Grid with Multiple Microsources. Energies 2020, 13, 2141. [Google Scholar] [CrossRef]
  10. Salcedo, R.; Corbett, E.; Smith, C.; Limpaecher, E.; Rekha, R.; Nowocin, J.; Lauss, G.; Fonkwe, E.; Almeida, M.; Gartner, P.; et al. Banshee distribution network benchmark and prototyping platform for hardware-in-the-loop integration of microgrid and device controllers. J. Eng. 2019, 2019, 5365–5373. [Google Scholar] [CrossRef]
  11. Kotsampopoulos, P.; Lagos, D.; Hatziargyriou, N.; Faruque, M.O.; Lauss, G.; Nzimako, O.; Forsyth, P.; Steurer, M.; Ponci, F.; Monti, A.; et al. A Benchmark System for Hardware-in-the-Loop Testing of Distributed Energy Resources. IEEE Power Energy Technol. Syst. J. 2018, 5, 94–103. [Google Scholar] [CrossRef]
  12. Newaz, A.; Ospina, J.; Faruque, M.O. Controller Hardware-in-the-Loop Validation of a Graph Search Based Energy Management Strategy for Grid-Connected Distributed Energy Resources. IEEE Trans. Energy Convers. 2020, 35, 520–528. [Google Scholar] [CrossRef]
  13. Pellegrino, L.; Sandroni, C.; Bionda, E.; Pala, D.; Lagos, D.T.; Hatziargyriou, N.; Akroud, N. Remote Laboratory Testing Demonstration. Energies 2020, 13, 2283. [Google Scholar] [CrossRef]
  14. Kotsampopoulos, P.; Georgilakis, P.; Lagos, D.T.; Kleftakis, V.; Hatziargyriou, N. FACTS Providing Grid Services: Applications and Testing. Energies 2019, 12, 2554. [Google Scholar] [CrossRef] [Green Version]
  15. Rizy, D.T.; Xu, Y.; Li, H.; Li, F.; Irminger, P. Volt/Var control using inverter-based distributed energy resources. In Proceedings of the 2011 IEEE Power and Energy Society General Meeting, Detroit, MI, USA, 24–28 July 2011; pp. 1–8. [Google Scholar] [CrossRef]
  16. Huerta, F.; Gruber, J.K.; Prodanovic, M.; Matatagui, P. Power-hardware-in-the-loop test beds: Evaluation tools for grid integration of distributed energy resources. IEEE Ind. Appl. Mag. 2016, 22, 18–26. [Google Scholar] [CrossRef]
  17. Huerta, F.; Gruber, J.K.; Prodanovic, M.; Matatagui, P.; Gafurov, T. A laboratory environment for real-time testing of energy management scenarios: Smart Energy Integration Lab (SEIL). In Proceedings of the 2014 International Conference on Renewable Energy Research and Application (ICRERA), Glasgow, UK, 27–30 September 2014; pp. 514–519. [Google Scholar] [CrossRef]
  18. Darbali-Zamora, R.; Quiroz, J.E.; Hernández-Alvidrez, J.; Johnson, J.; Ortiz-Rivera, E.I. Validation of a Real-Time Power Hardware-in-the-Loop Distribution Circuit Simulation with Renewable Energy Sources. In Proceedings of the 2018 IEEE 7th World Conference on Photovoltaic Energy Conversion (WCPEC) (A Joint Conference of 45th IEEE PVSC, 28th PVSEC 34th EU PVSEC), Waikoloa, HI, USA, 10–15 June 2018; pp. 1380–1385. [Google Scholar] [CrossRef]
  19. Kikusato, H.; Ustun, T.S.; Suzuki, M.; Sugahara, S.; Hashimoto, J.; Otani, K.; Shirakawa, K.; Yabuki, R.; Watanabe, K.; Shimizu, T. Microgrid Controller Testing Using Power Hardware-in-the-Loop. Energies 2020, 13, 44. [Google Scholar] [CrossRef] [Green Version]
  20. Kotsampopoulos, P.C.; Kleftakis, V.A.; Hatziargyriou, N.D. Laboratory Education of Modern Power Systems Using PHIL Simulation. IEEE Trans. Power Syst. 2017, 32, 3992–4001. [Google Scholar] [CrossRef]
  21. Oureilidis, K.; Malamaki, K.N.; Gallos, K.; Tsitsimelis, A.; Dikaiakos, C.; Gkavanoudis, S.; Cvetkovic, M.; Mauricio, J.M.; Maza Ortega, J.M.; Ramos, J.L.M.; et al. Ancillary Services Market Design in Distribution Networks: Review and Identification of Barriers. Energies 2020, 13, 917. [Google Scholar] [CrossRef] [Green Version]
  22. Maza-Ortega, J.M.; Mauricio, J.M.; Barragán-Villarejo, M.; Demoulias, C.; Gómez-Expósito, A. Ancillary Services in Hybrid AC/DC Low Voltage Distribution Networks. Energies 2019, 12, 3591. [Google Scholar] [CrossRef] [Green Version]
  23. Yu, X.; Tolbert, L.M. Ancillary services provided from DER with power electronics interface. In Proceedings of the 2006 IEEE Power Engineering Society General Meeting, Montreal, QC, USA, 18–22 June 2006; p. 8. [Google Scholar] [CrossRef]
  24. Maza-Ortega, J.M.; Barragán-Villarejo, M.; García-López, F.d.P.; Jiménez, J.; Mauricio, J.M.; Alvarado-Barrios, L.; Gómez-Expósito, A. A Multi-Platform Lab for Teaching and Research in Active Distribution Networks. IEEE Trans. Power Syst. 2017, 32, 4861–4870. [Google Scholar] [CrossRef]
  25. García-López, F.d.P.; Barragán-Villarejo, M.; Marano-Marcolini, A.; Maza-Ortega, J.M.; Martínez-Ramos, J.L. Experimental Assessment of a Centralised Controller for High-RES Active Distribution Networks. Energies 2018, 11, 3364. [Google Scholar] [CrossRef] [Green Version]
  26. De Paula García-López, F.; Barragán-Villarejo, M.; Maza-Ortega, J.M. Grid-friendly integration of electric vehicle fast charging station based on multiterminal DC link. Int. J. Electr. Power Energy Syst. 2020, 114, 105341. [Google Scholar] [CrossRef]
  27. Carpita, M.; Affolter, J.; Bozorg, M.; Houmard, D.; Wasterlain, S. ReIne, a flexible laboratory for emulating and testing the Distribution grid. In Proceedings of the 2019 21st European Conference on Power Electronics and Applications (EPE ’19 ECCE Europe), Genova, Italy, 2–6 September 2019; pp. P.1–P.6. [Google Scholar] [CrossRef]
  28. Orue, I.; Larrieta, J.; Gilbert, I.P. Development and requirements of a new High Power Laboratory. In Proceedings of the IEEE PES T&D 2010, Minneapolis, MN, USA, 25–29 July 2010; pp. 1–6. [Google Scholar] [CrossRef]
  29. Torres, M.; Lopes, L. Inverter-Based Diesel Generator Emulator for the Study of Frequency Variations in a Laboratory-Scale Autonomous Power System. Energy Power Eng. 2013, 5, 274–283. [Google Scholar] [CrossRef] [Green Version]
  30. Liu, Y.; Lan, P.; Lin, H. Grid-connected PV inverter test system for solar photovoltaic power system certification. In Proceedings of the 2014 IEEE PES General Meeting|Conference Exposition, Washington, DC, USA, 27–31 July 2014; pp. 1–5. [Google Scholar] [CrossRef]
  31. Chinchilla, M.; Arnaltes, S.; Rodriguez-Amenedo, J.L. Laboratory set-up for wind turbine emulation. In Proceedings of the 2004 IEEE International Conference on Industrial Technology, IEEE ICIT ’04, Hammamet, Tunisia, 8–10 December 2004; Volume 1, pp. 553–557. [Google Scholar] [CrossRef]
  32. Sanchez, S.; D’Arco, S.; Holdyk, A.; Tedeschi, E. An approach for small scale power hardware in the loop emulation of HVDC cables. In Proceedings of the 2018 Thirteenth International Conference on Ecological Vehicles and Renewable Energies (EVER), Monte Carlo, Monaco, 10–12 April 2018; pp. 1–8. [Google Scholar] [CrossRef] [Green Version]
  33. Aktas, A.; Erhan, K.; Ozdemir, S.; Ozdemir, E. Experimental investigation of a new smart energy management algorithm for a hybrid energy storage system in smart grid applications. Electr. Power Syst. Res. 2017, 144, 185–196. [Google Scholar] [CrossRef]
  34. Zecchino, A.; Hu, J.; Coppo, M.; Marinelli, M. Experimental testing and model validation of a decoupled-phase on-load tap-changer transformer in an active network. IET Gener. Transm. Distrib. 2016, 10, 3834–3843. [Google Scholar] [CrossRef] [Green Version]
  35. Papaspiliotopoulos, V.A.; Korres, G.N.; Kleftakis, V.A.; Hatziargyriou, N.D. Hardware-In-the-Loop Design and Optimal Setting of Adaptive Protection Schemes for Distribution Systems With Distributed Generation. IEEE Trans. Power Deliv. 2017, 32, 393–400. [Google Scholar] [CrossRef]
  36. Madureira, A.G.; Lopes, J.A.P. Coordinated voltage support in distribution networks with distributed generation and microgrids. IET Renew. Power Gener. 2009, 3, 439–454. [Google Scholar] [CrossRef] [Green Version]
  37. Fang, J.; Tang, Y.; Li, H.; Blaabjerg, F. The Role of Power Electronics in Future Low Inertia Power Systems. In Proceedings of the 2018 IEEE International Power Electronics and Application Conference and Exposition (PEAC), Shenzhen, China, 4–7 November 2018; pp. 1–6. [Google Scholar] [CrossRef]
  38. Fang, J.; Li, H.; Tang, Y.; Blaabjerg, F. On the Inertia of Future More-Electronics Power Systems. IEEE J. Emerg. Sel. Top. Power Electron. 2019, 7, 2130–2146. [Google Scholar] [CrossRef]
  39. Dimitra Tragianni, S.; Oureilidis, K.O.; Demoulias, C.S. Supercapacitor sizing based on comparative study of PV power smoothing methods. In Proceedings of the 2017 52nd International Universities Power Engineering Conference (UPEC), Heraklion, Greece, 28–31 August 2017; pp. 1–6. [Google Scholar] [CrossRef]
  40. Lashab, A.; Sera, D.; Guerrero, J.M. A Dual-Discrete Model Predictive Control-Based MPPT for PV Systems. IEEE Trans. Power Electron. 2019, 34, 9686–9697. [Google Scholar] [CrossRef]
  41. Mei, Q.; Shan, M.; Liu, L.; Guerrero, J.M. A Novel Improved Variable Step-Size Incremental-Resistance MPPT Method for PV Systems. IEEE Trans. Ind. Electron. 2011, 58, 2427–2434. [Google Scholar] [CrossRef]
  42. Nieves-Portana, M.; Barragán-Villarejo, M.; Maza-Ortega, J.; Mauricio-Ferramola, J. Reduction of Zero Sequence Components in Three-Phase Transformerless Multiterminal DC link based on Voltage Source Converters. Renew. Energy Power Qual. J. 2013, 1206–1211. [Google Scholar] [CrossRef]
  43. Harnefors, L.; Wang, X.; Yepes, A.G.; Blaabjerg, F. Passivity-Based Stability Assessment of Grid-Connected VSCs—An Overview. IEEE J. Emerg. Sel. Top. Power Electron. 2016, 4, 116–125. [Google Scholar] [CrossRef] [Green Version]
  44. Song, I.; Jung, W.; Kim, J.; Yun, S.; Choi, J.; Ahn, S. Operation Schemes of Smart Distribution Networks With Distributed Energy Resources for Loss Reduction and Service Restoration. IEEE Trans. Smart Grid 2013, 4, 367–374. [Google Scholar] [CrossRef]
  45. Fahmy, B.N.; Soliman, M.H.; Talaat, H.E. Active Voltage Control in Distribution Networks including Distributed Generations using Hardware-In-The-Loop Technique. In Proceedings of the 2019 21st International Middle East Power Systems Conference, MEPCON 2019, Cairo, Egypt, 17–19 December 2019; pp. 656–661. [Google Scholar] [CrossRef]
  46. Ko, M.S.; Lim, S.H.; Kim, J.K.; Hur, K. Distribution voltage regulation using combined local and central control based on real-time data. In Proceedings of the 2019 IEEE Milan PowerTech, PowerTech, Milan, Italy, 23–27 June 2019; pp. 1–6. [Google Scholar] [CrossRef]
  47. Fandi, G.; Ahmad, I.; Igbinovia, F.O.; Muller, Z.; Tlusty, J.; Krepl, V. Voltage Regulation and Power Loss Minimization in Radial Distribution Systems via Reactive Power Injection and Distributed Generation Unit Placement. Energies 2018, 11, 1399. [Google Scholar] [CrossRef] [Green Version]
  48. Kulmala, A.; Angioni, A.; Repo, S.; Giustina, D.D.; Barbato, A.; Ponci, F. Experiences of Laboratory and Field Demonstrations of Distribution Network Congestion Management. In Proceedings of the IECON 2018—44th Annual Conference of the IEEE Industrial Electronics Society, Washington, DC, USA, 21–23 October 2018; pp. 3543–3549. [Google Scholar] [CrossRef]
  49. Karagiannopoulos, S.; Gallmann, J.; Vayá, M.G.; Aristidou, P.; Hug, G. Active Distribution Grids Offering Ancillary Services in Islanded and Grid-Connected Mode. IEEE Trans. Smart Grid 2020, 11, 623–633. [Google Scholar] [CrossRef]
  50. Lauss, G.; Strunz, K. Multirate Partitioning Interface for Enhanced Stability of Power Hardware-in-the-Loop Real-Time Simulation. IEEE Trans. Ind. Electron. 2019, 66, 595–605. [Google Scholar] [CrossRef]
  51. Li, Y.; Nejabatkhah, F. Overview of control, integration and energy management of microgrids. J. Mod. Power Syst. Clean Energy 2014, 2, 212–222. [Google Scholar] [CrossRef] [Green Version]
  52. Nehrir, M.H.; Wang, C.; Strunz, K.; Aki, H.; Ramakumar, R.; Bing, J.; Miao, Z.; Salameh, Z. A Review of Hybrid Renewable/Alternative Energy Systems for Electric Power Generation: Configurations, Control, and Applications. IEEE Trans. Sustain. Energy 2011, 2, 392–403. [Google Scholar] [CrossRef]
  53. Katiraei, F.; Iravani, R.; Hatziargyriou, N.; Dimeas, A. Microgrids management. IEEE Power Energy Mag. 2008, 6, 54–65. [Google Scholar] [CrossRef]
  54. Colet-Subirachs, A.; Ruiz-Alvarez, A.; Gomis-Bellmunt, O.; Alvarez-Cuevas-Figuerola, F.; Sudria-Andreu, A. Centralized and Distributed Active and Reactive Power Control of a Utility Connected Microgrid Using IEC61850. IEEE Syst. J. 2012, 6, 58–67. [Google Scholar] [CrossRef]
  55. Zhao, P.; Suryanarayanan, S.; Simoes, M.G. An Energy Management System for Building Structures Using a Multi-Agent Decision-Making Control Methodology. IEEE Trans. Ind. Appl. 2013, 49, 322–330. [Google Scholar] [CrossRef]
  56. Tehrani, K. A smart cyber physical multi-source energy system for an electric vehicle prototype. J. Syst. Archit. 2020, 111, 101804. [Google Scholar] [CrossRef]
  57. Guerrero, J.M.; de Vicuna, L.G.; Matas, J.; Castilla, M.; Miret, J. A wireless controller to enhance dynamic performance of parallel inverters in distributed generation systems. IEEE Trans. Power Electron. 2004, 19, 1205–1213. [Google Scholar] [CrossRef]
  58. CIGRE. Benchmark Systems for Network Integration of Renewable and Distributed Energy Resources; Electra: Paris, France, 2019. [Google Scholar]
Figure 1. Possible testing setups for assessing the effect of a new smart grid technology in the power system: (a) Simulation, (b) Control Hardware-in-the-Loop (CHIL), (c) Power-Hardware-in-the-Loop (PHIL).
Energies 13 03858 g001
Figure 2. Generic scheme describing the Power System Hardware-in-the-Loop (PSHIL) configuration.
Energies 13 03858 g002
Figure 3. PSHIL platform of the Department of Electrical Engineering at the University of Sevilla.
Energies 13 03858 g003
Figure 4. PSHIL layout of the Department of Electrical Engineering at the University of Sevilla.
Energies 13 03858 g004
Figure 5. One-line diagram of the MV physical network within the PSHIL infrastructure at the University of Sevilla.
Energies 13 03858 g005
Figure 6. Elements of the PSHIL: (a) Regatron system, (b) synchronous generator, (c) OLEs Electrical cabinet.
Energies 13 03858 g006
Figure 7. PSHIL application example. One-line diagram of the LV real-time simulated network.
Energies 13 03858 g007
Figure 8. PSHIL application example. Integration of the LV real-time simulated network and the physical MV network.
Energies 13 03858 g008
Figure 9. PSHIL application example. Daily profiles in per-unit (a) Load profiles, (b) Generation profiles.
Energies 13 03858 g009
Figure 10. PSHIL-1: N14 industrial load and integration of the LV real-time simulated network within the MV scaled-down physical system. (a) 24-h evolution of active and reactive power injected by the OLE connected to bus N14. (b) 24-h evolution of voltages in bus N14 (physical network) and M0 (real-time simulated network).
Energies 13 03858 g010
Figure 11. PSHIL-1. Impact on the MV and LV distribution networks. (a) 24-h evolution of the MV network voltages at buses N3, N6, and N14. (b) 24-h evolution of the LV network voltages at buses M1, M4, and M7.
Energies 13 03858 g011
Figure 12. PSHIL-2. DUT performance using 24-h evolution of: (a) OLTC tap position and voltage of bus N3. (b) DER reactive power injections in buses N3 and N6. (c) DC-link reactive power injections. (d) DC-link active power transfer from N8 to N14.
Energies 13 03858 g012
Figure 13. PSHIL-2. Impact on the MV and LV distribution networks. (a) 24-h evolution of the MV network voltages at buses N3, N6, and N14. (b) 24-h evolution of the LV network voltages at buses M1, M4, and M7.
Energies 13 03858 g013
Figure 14. PSHIL-3. (a) 24-h evolution of voltage in bus M7. (b) 24-h evolution of PV active and reactive power injections in bus M7.
Energies 13 03858 g014
Figure 15. PSHIL-3. Impact on the MV and LV distribution networks. (a) 24-h evolution of the MV system voltage in buses N3, N6, and N14. (b) 24-h evolution of the LV system voltage in buses M1, M4, and M7.
Energies 13 03858 g015
Table 1. Testing approaches for DUTs and AUTs.
Tested ElementSimulationCHILPHILPSHIL
DUT
AUT
AUT & DUT
Table 2. Peak power of loads and generators connected in each node of the MV scaled-down distribution network.
NodeGeneration (kW)Load (kW)
PVWind TurbineIndustrialHousehold
N34.340.002.822.52
N57.040.000.006.61
N66.520.000.005.01
N70.006.070.910.00
N86.520.000.005.36
N97.040.006.750.00
N106.520.000.804.35
N140.000.009.050.00
Table 3. Peak power of loads and generators connected in each node of the LV original distribution network.
NodePVHousehold
Generation (kW)Load (kW)
M71515
M85252
M95555
M103535
M114747
Table 4. DUT/AUT and functionalities of the test cases.
DUT/AUTCase PSHIL-1Case PSHIL-2Case PSHIL-3
MV/LV network interconnection
HV/MV OLTC
MV DER reactive power
DC link
LV PV reactive power
Functionalities
Current control (DER, DC link)
Reactive power control (DER, DC link)
Active Power control (DC link)
OLTC tap Control
OPF for MV power losses minimization
Local droop for LV voltage control

