Abstract
Savonius wind turbines are characterized by various advantages such as simple design, independence of wind direction, and low noise emission, but they suffer from low efficiency. Numerous investigations were carried out to face this problem. In the present paper, a new idea of the Savonius turbine with a variable geometry of blades is proposed. Its blades, made of elastic material, were continuously deformed during the rotor revolution to increase a positive torque of the advancing blade and to decrease a negative torque of the returning blade. In order to assess the turbine aerodynamic performance, a two-dimensional numerical model was developed. The fluid-structure interaction (FSI) method was applied where blade deformations were defined by computational solid mechanics (CSM) simulations, whereas computational fluid dynamics (CFD) simulations allowed for transient flow prediction. The influence of the deformation magnitude and the position of maximally deformed blades with respect to the incoming wind direction were studied. The aerodynamic performance increased with an increase in the deformation magnitude. The power coefficient exceeded Cp = 0.30 for the eccentricity magnitude of 10% and reached 0.39 for the highest magnitude under study. It corresponded to 90% improvement in comparison to Cp = 0.21 in the case of the fixed-shape Savonius turbine.
1. Introduction
Vertical axis wind turbines (VAWTs) are typically characterized by lower wind energy-conversion efficiency than commonly used horizontal axis wind turbines (HAWTs). However, they are often favored in micro power generation due to their simple design, a possibility to locate a generator near the ground, and to accept the wind blowing from different directions [1,2]. They are quieter and safer than small-scale HAWTs and, thus, suitable for applications in urbanized areas [3,4,5].
A vertical axis wind turbine, referred to as the Savonius turbine, was invented by S.J. Savonius [6]. In the top view, it resembles the letter “S” with two typically semi-cylindrical blades, often slightly overlapping. Its primary advantage lies in simple and, thus, cheap and robust design [7,8]. Similar to other VAWTs, Savonius turbines are independent of the wind direction. However, contrary to Darrieus wind turbines, they are characterized by a high starting torque for selected rotor positions. They are classified as drag-driven turbines and operate at low rotational speeds, with tip speed ratios not exceeding 2, which makes them safer than HAWTs at strong winds [9]. They perform well at low wind speeds most often encountered close to the ground and they are characterized by a low level of noise emission. Thus, Savonius turbines are suitable for application in urbanized areas [3].
Unfortunately, the primary disadvantage of Savonius turbines is their low efficiency. Typically reported values of the power coefficient for designs with semi-cylindrical blades fall within the range Cp = 0.15–0.20 [7,10,11]. Therefore, this kind of turbine in its basic configuration is not usually a reasonable alternative when compared to other types of wind turbine. Nonetheless, owing to their advantages, Savonius turbines were subject to numerous investigations aimed at increasing their efficiency. Many works were focused on the search for optimal dimensions of geometrical parameters of rotors. The influence of the number of blades, overlap ratio, aspect ratio, end plates and other factors was studied both with experimental and numerical methods. Results of those investigations were presented in numerous papers, which further were summarized in thorough reviews [7,12].
Many studies were focused on modifications of the blade shape or an application of additional elements to direct the air flow towards blades. The replacement of conventional semi-cylindrical blades by more sophisticated shapes allowed one to increase the Savonius turbine performance significantly, with maximal values of the power coefficient up to Cp = 0.25–0.30. A substantial part of the research concentrates on two-dimensional (2D) thin blade configurations, i.e.,: Bach, Benesh, elliptical and spline [11,13,14]. Airfoil shape blades were studied in [15,16]. Optimization methods were also applied in order to search for an optimal blade shape in [16,17,18,19], taking advantage of 2D simplifications in numerical simulations. Three-dimensional (3D) blade arrangements with twisted or helical blades were tested as well. In this case, it was possible to reduce static and dynamic torque variations for different angular positions of the rotor with respect to the incoming wind, however, no significant improvement was reported as far as the turbine performance is considered [12,14].
Different augmentation systems can be used to change the wind flow path around and in the Savonius rotor. Its power output was increased by 20% up to 50% if the turbine rotor was equipped with flat plate deflectors [18,20,21], v-shaped deflectors [22] or a combination of flat and circular deflectors [23], shielding the returning blade and reducing its negative moment. A similar effect was achieved if the wind was directed towards the advancing blade with a curtain-deflector system [24], self-adjusting conveyor-deflector curtains [15], a system of adjustable shielding plates for twin rotors [9] or even a rectangular guide-box tunnel surrounding the rotor [25]. A comprehensive summary of different augmentation systems with the power coefficient exceeding considerably Cp = 0.3 can be found in [11,26]. However, a disadvantage of such approaches consists in larger dimensions of the turbine, an increase in the complexity of its geometry and dependence on the wind direction.
An idea of the Savonius turbine with a variable geometry of blades is proposed in order to enlarge the projected area of the advancing blade (increase the positive moment) and, at the same time, to diminish the area of the returning blade (decrease the negative moment). Elaborate two-dimensional (2D) computational fluid dynamics (CFD) simulations were performed to assess the output power gain for different arrangements of blade deformations.
The deformations of blades in this case were determined with a structural solver and then the geometry was transferred to a fluid solver for the aerodynamic analysis. This approach is referred to as the fluid-structure interaction (FSI). The FSI is a very wide concept of solvers coupling in order to obtain high-fidelity numerical solutions. Solvers can be one-way coupled once the data, i.e., loads from the fluid acting on the wall, are transferred to the structural solver where stress and strains are determined [27,28]. Another example of one-way coupling takes place where the deformation of the structure influences the flow structure and loads determined in the fluid solver. The most advanced method, called the two-way FSI, requires co-simulation between computational fluid dynamics and structural mechanics. Both CFD and structural solvers are coupled and synchronized to attain converged solutions. The two-way FSI is applied to highly dynamical systems as in the case of the aeroelastic response analysis [29] or whenever the structure is flabby [30]. The FSI strategy is typically used in horizontal axis wind turbines (HAWTs). It is also used in the analysis of vertical axis wind turbines (VAWTs), e.g., in the case of an H-rotor [31,32], but no reference reporting an analysis of the Savonius-based turbine is known to the authors. It is due to much lower blade loads than in the case of lift-driven HAWTs or VAWTs.
Idea of the Savonius Rotor with Deformable Blades
An idea of the novel turbine with a variable geometry of blades is shown in Figure 1 for subsequent phases of the rotor revolution [33]. Shapes of the blades made of a flexible material change constantly during its rotation. This is achieved by guiding the outer edges of the blades (tips marked as dots in the color of the blades) along the guide ring (red) placed eccentrically with respect to the rotor shaft. Rods attached to the outer edges of the blades can move linearly with respect to sliders, which are fixed to the shaft. The rode–slider mechanisms, marked by a red dashed line, are applied at the top and bottom of the turbine and they transfer the torque generated by the blades to the shaft. The inner edges of the blades are also attached to the rotor shaft.
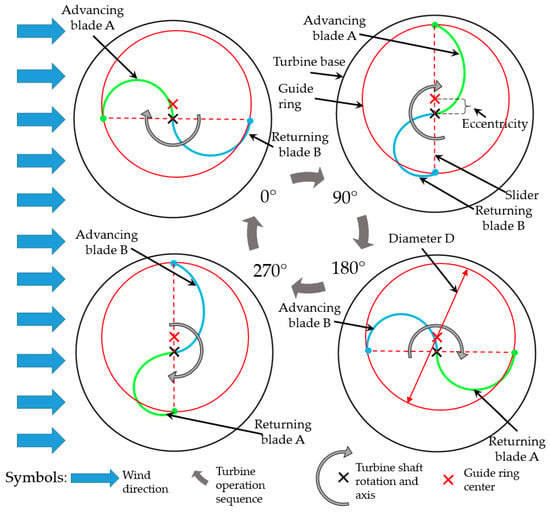
Figure 1.
Principle of the turbine operation.
The phases 90° and 270° presented in Figure 1 illustrate the maximal deformation of the blades. If the extended, advancing blade is located in such a way that its concave side is exposed to the wind and, simultaneously, the wind blows at the convex side of the contracted, returning blade, one can expect that the turbine will be driven with the wind energy more efficiently than in the case of both blades having the same, fixed shape. This implies that the turbine needs to be properly located with respect to the incoming wind. Therefore, the guide ring needs to change its position by rotation around the axis of the base of the turbine, which is coaxial with the rotor shaft axis, marked as a black X in Figure 1. The guide ring mechanism has to be equipped with an aerodynamic or mechanical system in order to adjust its position with respect to the wind direction. The turbine generator is fixed to the frame and a gear or a transmission has to be applied to transfer the mechanical energy from the turbine blades.
The additional mechanisms make the design of the proposed turbine more complex than the original Savonius. However, they consume a part of the energy generated by the turbine. Thus, all elements need to be carefully designed to be resistant and efficient. The present study focuses on the aerodynamic performance of a novel, efficient design but neither mechanical losses due to friction nor energy losses due to blade deformations are considered. Thus, one must bear in mind that the overall performance of the turbine will depend on the mechanical design and that a portion of energy will be consumed by the system itself.
2. Materials and Methods
The numerical simulation of the Savonius turbine with deformable blades was performed within the FSI method available in Ansys Workbench v19.2. The geometry and position of the rotor blades change continuously and, thus, transient simulations were performed both for a structural analysis with the ANSYS solver and a fluid flow analysis with the ANSYS fluent solver.
Full 3-dimensional (3D) simulations of the turbine were not possible due to enormous requirements of the coupled fluid flow and structural solvers. Therefore, it was decided to solve the problem as the 2D one, actually quasi-2D, as the structural solver demanded a three-dimensional model to be applied. Despite its limitations as 3D effects at the blade ends are disregarded, a 2D approach is a frequently applied simplification, which allows one to learn about performance of the turbine configuration. It is especially useful to observe changes in the performance if different configurations of the blades are compared. However, one can keep in mind that significant differences can be obtained comparing a 2D prediction with the full three-dimensional one, especially when the aspect ratio of Savonius turbines is low [34,35].
The geometry of the blades, the guidance system and the fluid domain were prepared in SolidWorks. In general, the guide ring can be of any arbitrary smooth shape, preferably elliptical. However, in this first study the guide ring of the constant diameter D = 1 m was selected. It was also the value of the diameter of the reference turbine rotor with fixed-shape blades, where the eccentricity was equal to zero. The blades of that reference rotor had a semi-circular shape. In the case of the rotor with eccentricity, the arc length of the blades was the same as in the reference rotor, but the distance between outer edges of the deformable blades was variable during the rotor revolution. In order to simplify the numerical model, it was decided to disregard the rotor shaft. Its impact on the flow around the rotor blades is rather limited and it can be assumed to be similar in all configurations. The blade overlap can have a positive effect on the turbine performance. However, in those investigations, it was decided not to overlap the blades.
As one can see in Figure 2, the fluid domain was divided into two regions. The internal domain of the diameter 1.5D including turbine blades was surrounded by the external one. The total length of the domain was 60D in the flow direction, with the turbine axis located 20D from its inlet and in the middle of the domain height, which was set to 40D. The domain blockage was similar to our previous studies [34] or in [18] and it did not affect comparisons between different turbine configurations.
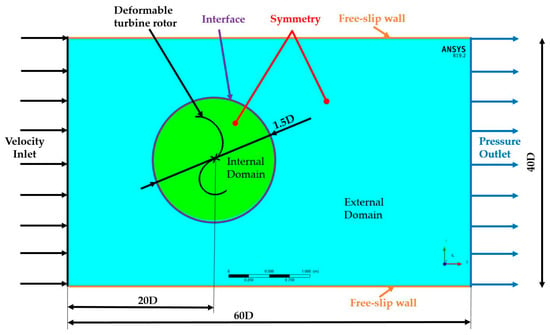
Figure 2.
Computational domain scheme (external domain dimensions do not correspond to the scale).
Due to the complexity of blade deformations, combined with their rotation, a tool outside the fluid flow solver was needed to define the instantaneous rotor geometry. It was decided to use the structural ANSYS solver in order to take advantage of the FSI method implemented in the Ansys Workbench. A one-way system coupling was defined between simulation components, where the deformation of blades obtained in the structural analysis was transferred to the fluid flow solver. Because the pressure variation around the blade for the considered wind speed (v = 4 m/s) was less than 100 Pa, the two-way coupling, where the pressure load on blades would be transferred from the flow to the structural analysis, was disregarded. The one-way system coupling method was successfully used and presented in [27].
In order to satisfy a good coupling of the structural and flow parts of the problem, the same timestep of transient simulations was applied to both of them. The value of the timestep was selected on the basis of solution stability tests performed for the rotors with the highest magnitude of blade deformation. The typically accepted timestep corresponding to the revolution of the rotor by 1° was selected initially in the Savonius rotor simulations. However, due to solution instabilities during the remeshing procedure, it was successively reduced. In the case of the timestep equal to 0.001 s, the numerical errors resulting from the mesh deformation and the remeshing algorithm were very limited and the computations were successful. The simulations were carried out for the tip speed ratio TSR = 0.8, for which Savonius rotors of typical aspect ratios (AR = H/D = 0.8–1.5) reach the maximal value of the power coefficient Cp [34,36]. For this TSR, the angular velocity of the turbine was 6.4 rad/s. Thus, the selected timestep of 0.001 s corresponded to a revolution of the rotor by approximately 0.367°, resulting in 982 steps per one revolution, which is sufficiently low as far as the time discretization is concerned [16]. The total time of simulations was 10 s, which corresponds to more than 10 full revolutions, thus eliminating an influence of the initial conditions onto the simulation results.
The tip speed ratio TSR Equation (1) and the power coefficient Cp Equation (2), i.e., the energy extracted by the turbine to the available wind energy, were defined as follows:
where: ω—angular velocity [rad/s], R—turbine radius, v—wind speed [m/s], T—output torque [Nm], ρ—air density [kg/m3], A—projected area of the rotor (DH) [m2], D—rotor diameter (2R) [m], H—rotor height [m].
2.1. Definition of Structural Simulations
As mentioned above, the structural solver was used to determine the deformation of the blades for each timestep. One structural model, whose scheme is presented in Figure 3, was designed to perform a series of simulations. Different eccentricity magnitudes and various angular positions of the eccentricity line with respect to the incoming wind were attained by changing the position of the guide ring center (red X) with respect to the rotor shaft (black X) as indicated by white arrows. That position was fixed in particular simulations.
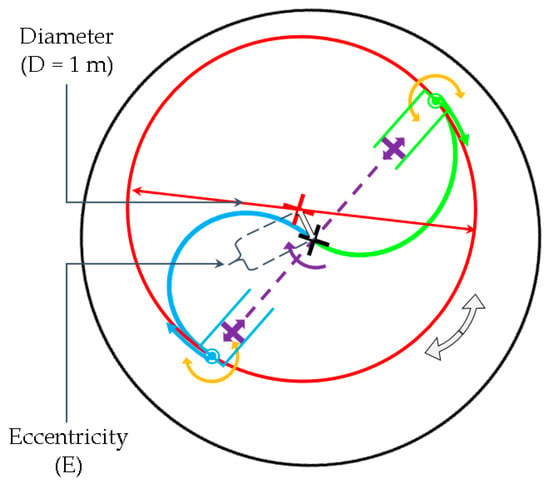
Figure 3.
Turbine motion constrains in the structural simulation.
The kinematics of the blades (blue and green arcs) was restricted by several constraints indicated schematically in Figure 3. The turbine shaft rotated around the axis indicated by a black X, where the blades were tangent. Their outer tips marked with green and blue points were constrained by frictionless movement along the guide ring (red circle) as indicated by green and blue arrows. The torque generated by the blades was transferred to the shaft by rode–slider mechanisms. The rode marked with a purple dashed line was fixed to the turbine shaft. The sliders, marked as blue and green cylinders, were connected to the blade tips. The rode–slider mechanisms allowed for frictionless linear movement of the blade outer tips with respect to the axis of rotation, but the mechanisms kept them in the same relative angular position during the turbine rotation. Additionally, the blade outer tips could rotate without friction with respect to the rods as indicated by yellow arrows.
The blade was made of structural steel from the standard ANSYS material library, with the Young modulus and Poisson’s ratio equal to 210 GPa and 0.3, respectively. The material was selected to limit deformation to the elastic range to ensure stability of the structural solution for selected eccentricity magnitudes.
2.2. Definition of Flow Simulations
In comparison to typical simulations of Savonius turbines with blades of fixed shapes (where the internal domain rotates), deformations of the blades enforced an application of an advanced meshing approach in that fluid flow analysis. In the case under study, both flow domains are in the stationary frame of reference.
The computational mesh was generated in ANSYS Meshing. Following the mesh dependence test, described in the next subsection, a mesh composed of 1.16 million control volumes was used in the simulations. The external domain did not change during the computational campaign, thus, it was meshed with a single layer of hexahedral elements through the slice. Refinements were applied around the interface with the internal domain and in the wake downstream of the turbine (Figure 4). The internal domain consisted of two regions marked in green and in red. Due to the requirements of the ANSYS Fluent concerning the dynamic mesh options of deformation and remeshing, tetrahedral elements were used in those regions. In order to ensure a high-quality mesh in the region around the blades (marked in red), a highly refined mesh with 12 layers of prismatic elements at the wall was generated. That number of layers was sufficient to satisfy the condition y+ < 1 of the first mesh element at the wall for almost all the simulations. The value was exceeded only for very limited regions at the blade tips. Thus, the mesh was sufficient to solve fully the flow in the boundary layer, which is very important as the flow is characterized by numerous boundary layer separations, especially at convex sides of the blades. Refinement of the mesh around the blades (especially at their tips) caused the number of elements through its width to be increased to two and even four elements at the blade tips in this region of the domain. In order to avoid numerical errors, the sizes of elements at the interface between the outer and inner domains did not differ significantly.
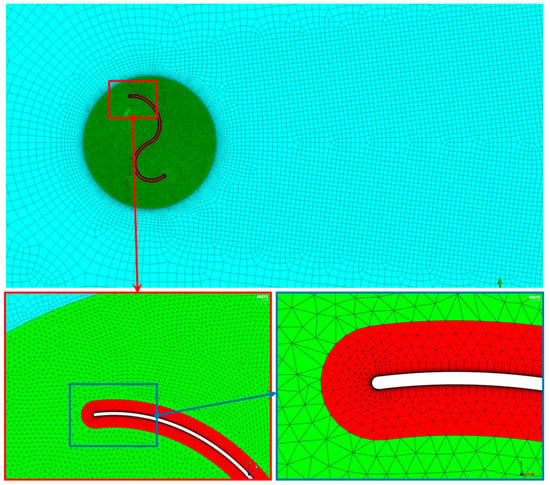
Figure 4.
Computational mesh in the external and internal domains with details of its refinement in the blade vicinity presented in the successive magnifications.
The problem of rotation of turbine blades with a constant angular velocity as well as their deformation due to eccentricity was addressed by deforming, remeshing and smoothing algorithms of the dynamic mesh offered by ANSYS Fluent [37]. The instantaneous blade geometry was transferred from the structural analysis every timestep. In the region marked in red, the mesh was following the blade and the elements were deforming as the blade was changing its shape. In the region marked in green, the continuous motion of the blade caused deformation of mesh elements and remeshing was launched wherever they degenerated and the quality measures were not satisfied, namely, the minimal and maximal length scale (1 and 5 mm) with the maximum face skewness of 0.6 and maximum cell skewness of 0.8 were set. The highest skewness of the grid cells was in the region of the deformed and remeshed grid, with the maximal value of 0.84. In the remaining regions, the skewness was below 0.6. The maximal cell aspect ratio at the blades was equal to 68 and was almost constant during the solution as the deformation of the prismatic elements was limited.
The flow simulations were performed in a transient mode with the pressure-based ANSYS Fluent solver. Reynolds-averaged Navier–Stokes (RANS) equations were calculated with the k-ω SST (Shear Stress Transport) turbulence model of Menter [38], which is one of the most frequently used in Savonius turbine simulations [16,39,40], due to its good performance in the adverse pressure gradient and separated flows. Despite the fact that changes in air density are negligible, the fluid was defined as compressible according to the ideal gas law, in order to compensate for numerical instabilities resulting from mesh deformation and remeshing.
A set of the boundary conditions applied in the simulations is indicated in Figure 2. At the inlet, the velocity of 4 m/s was specified with 1% of the turbulence intensity and the turbulent viscosity ratio equal to 1. This velocity corresponds to the Reynolds number based on the turbine diameter equal to 2.5 × 10⁵. The pressure outlet condition (absolute pressure of 101,325 Pa) was defined at the opposite end of the domain. At the upper and lower surfaces of the domain in Figure 2, a free-slip wall condition was imposed. As the task was solved in a quasi-2D way, the symmetry condition was defined on the side surfaces, perpendicular to the axis of turbine rotation. The motion of the blades was governed in the structural simulation and was transferred to the Fluent solver by system coupling. The blades of the turbine were defined as non-slip and smooth walls. The interface between both domains was applied to exchange data. The initial conditions were determined on the basis of the boundary conditions.
The SIMPLE (semi-implicit method for pressure-linked equations) pressure-velocity coupling method was used. The second-order spatial discretization schemes were applied for mass, momentum and energy equations. A first-order implicit transient scheme was also used. Maximally 20 iteration loops were solved in every timestep of transient simulations. Typically, it was enough to reach the residual target of 1e-3, selected as the convergence criterion for all equations solved in Fluent. This criterion was not reached only for a few timesteps, due to numerical problems resulting from mesh deformation or remeshing.
2.3. Validation of the Numerical Procedure
In order to assess the precision of the numerical method with mesh deformation and remeshing used in this investigation, it was decided to compare its results with the results of a typical simulation of the Savonius turbine, applied, e.g., in [13,16,17]. It was possible to do it for the eccentricity magnitude equal to zero, i.e., when rotor blades were not deformed. In this case, the flow was additionally simulated with a fixed mesh, where continuous changes of the rotor position were obtained by rotation of the circular inner domain and exchange of data at the sliding mesh interface between the stationary and rotational domains. The rest of the simulation conditions was preserved.
Taking advantage of much faster simulations for such a task arrangement, the mesh size dependence was also verified by means of Richardson’s extrapolation, similarly as in [41]. The same task was solved on three different grids with a mesh refinement ratio of 2. The numbers of control volumes of the grids and the average power coefficient values obtained for them are presented in Table 1. According to the Richardson’s extrapolation procedure described in [35], the extrapolated value (RE), the apparent order p, the ratio of error R and the fine-grid convergence index (FGCI) were determined. The negative value of R indicates an oscillatory convergence. Only a slight variation of the average power coefficient was observed (1.2%), however, the y+ < 1 condition was fulfilled for the mesh composed of 1.16 million control volumes shown in Figure 4. The uncertainty due to discretization determined for the average Cp on the basis of the Richardson’s extrapolation procedure described in [42] for this mesh was low, i.e., 1.7%. Thus, it was decided to use it in the further numerical investigations.

Table 1.
Mesh size dependence study.
In the cases of typical 2D simulations of fixed-shape Savonius rotors within the RANS method [16,17], after simulations of a few or more of rotor revolutions, one can reach the limit cycle of the blade load. In this case, a change in the period-averaged value of the power coefficient was lower than 1% of its value after 7 revolutions. The same criterion for this coefficient for particular instants of the rotor revolution (limit cycle) was reached after 10 revolutions. This limit cycle is marked in Figure 5 with a dashed line.
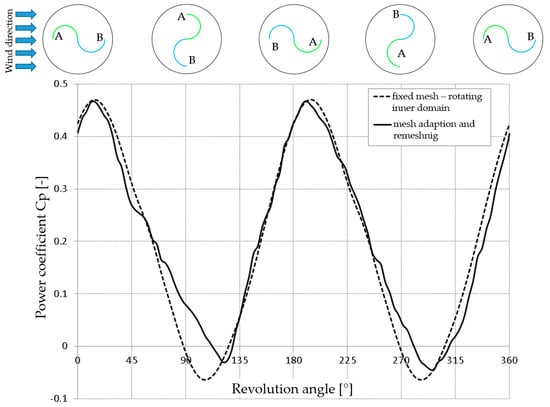
Figure 5.
Comparison of the power coefficient Cp for one revolution of the non-deformable rotor from simulations with the rotating inner domain and the deformed/remeshed one. Subsequent positions of the turbine illustrated in the schemes above the graph correspond to the turbine revolution angle.
In the case of the simulations with mesh deformation and remeshing applied in the further investigations, such a limit cycle was not obtained, mostly due to numerical instabilities. They resulted from the continuous deformation of mesh control volumes, which successively deteriorated in quality up to the moment when the specific regions were remeshed. Remeshing introduced some further numerical errors due to the data interpolation onto a new mesh. Thus, slight random fluctuations of the blade load were present. Therefore, the data presented in Figure 5 with a solid line were averaged for the last 5 out of 15 rotor revolutions. This number of periods was sufficient to reach no significant changes of the data averaged for the same angular positions during the rotor revolution. The period-averaged values of the power coefficient changes were lower than 1% after 10 revolutions.
As one can see, no significant differences can be observed for two parts of the period for the fixed-mesh simulations (dashed line in Figure 5). In the case of simulations with mesh deformation and remeshing (solid line), differences for two parts of the period are significant. They are observed especially for the revolution angles where the rotor performance is the lowest (75–120° and 255–300°). In these particular ranges, random fluctuations of the blade loads were the highest. The most probable explanation is a very complex flow pattern with numerous vortex structures at the convex side of the advancing blade. The vortex in particular at its tip is very strong with high velocity gradients and, thus, it can be vulnerable to some fluctuations due to the mesh quality deterioration or the remeshing procedure. The poorer flow prediction in those ranges caused that the period-averaged value of the power coefficient was 4.6% higher with respect to the fixed mesh (Cp = 0.206 for remeshed, Cp = 0.197 for fixed-mesh simulations). This difference is definitely not negligible, but it is an order of magnitude lower than the pressure coefficient increase predicted for rotors with deformable blades. Thus, despite its drawbacks, the method with mesh deformation and remeshing can be considered as sufficiently reliable for the needs of these investigations.
3. Results and Discussion
The influence of the deformation magnitude and the position of maximally deformed blades with respect to the incoming wind direction was studied. A detailed analysis was performed for the turbine with deformable blades in comparison to the non-deformable (fixed-shape) Savonius rotor.
The presentation and discussion of the results was divided into three sections. In the first section, the turbine performance was analyzed for different values of the deformation magnitude in a full range of the position of maximal deformation with respect to the incoming wind. The favorable range of the position was identified. In the second section, changes in the power coefficient during the rotor revolution were presented for the rotor with deformable blades in the optimal position and compared to the non-deformable Savonius rotor. The parts of the revolution cycle where the power output of the deformable rotor was significantly increased were identified and contributions of the individual blades were revealed. In the third section, a detailed analysis of blade loads was performed for three instants of the rotor revolution to display the main differences between the rotors with deformable and non-deformable blades.
3.1. Influence of Eccentricity of Deformed Blades on the Turbine Performance
Numerical simulations of the air flow in the Savonius rotor with deformable blades were carried out for different magnitudes of eccentricity and different angular positions of the eccentricity line with respect to the direction of the incoming wind. The eccentricity magnitude E was defined as a distance between the axis of turbine rotation (marked with a black X in Figure 6) and the center of the blade tip trajectory (marked with a red X), whereas the eccentricity line connects these centers. Selected angular positions of the eccentricity line marked by purple arrows are shown in Figure 6. The rotor blades are presented for their highest deformation. Three magnitudes of eccentricity E = 50 mm (the ratio of eccentricity to the guide ring diameter E/D = 5%), 100 mm (10%) and 150 mm (15%) were investigated for the whole 360° range of angular positions of the eccentricity line with respect to the direction of the incoming wind.
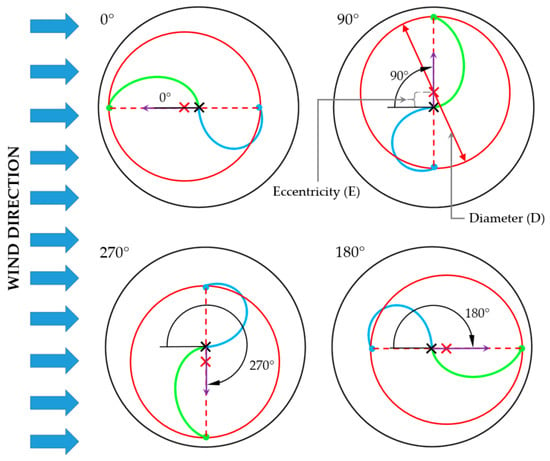
Figure 6.
Angular positions of the eccentricity line.
The polar plot of the power coefficient distribution is shown in Figure 7, where data markers indicate all the simulations performed. The black line in the figure indicates the case with a non-deformable rotor. The aim of the investigations was to find the optimal eccentricity position. Therefore, the initial screening calculations were performed with eccentricity changes every 45°. Then, the additional calculations were conducted for the range of 75–180°. In every case 10 revolutions were simulated and average values of the power coefficient out of the last three revolutions were calculated and shown in the figure. Finally, for the position of 105°, an additional 5 revolutions were simulated to determine more precisely the average values for further analysis. However, no significant difference (less than 2%) of the averaged pressure coefficient was obtained with respect to the previously obtained value.
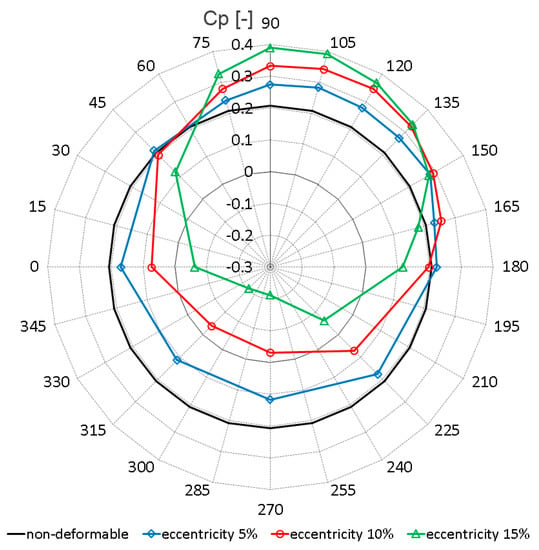
Figure 7.
Polar plot of the power coefficient Cp for deformable blade rotors with different magnitudes and positions of eccentricity.
As one can see in Figure 7, some gain of the Savonius rotor aerodynamic performance due to blade deformation is obtained for the eccentricity angular position in the range 45–180° (with respect to the direction of the incoming wind—0°). This range diminishes with a growth in the eccentricity magnitude. The optimal position of eccentricity is around 105° for all eccentricity values, however, differences in performance in the range 90–120° are low. In these cases, the advancing blade is expanded and the returning blade is contracted. For the eccentricity position of 105°, the power coefficient values are 0.284, 0.344 and 0.393 for 5%, 10% and 15% of the eccentricity magnitude, respectively. It provides a 37%, 66% and 90% increase with respect to the power coefficient of the non-deformable rotor (Cp = 0.207).
A proper angular position of the eccentricity is crucial. It can be easily noticed that for misplaced eccentricity, negative effects are very strong. For eccentricity magnitudes higher than 5%, the power coefficient is negative in a wide range of angular positions, which means that the turbine cannot convert the wind energy. Therefore, the mechanism to position the rotor with respect to the incoming wind is of a key importance in the case of this design.
The results presented in the next figures and their detailed analysis refer to the rotor with deformable blades with the eccentricity of 100 mm (10% of the rotor diameter) in the position of 105°. In this angular position (or in its close vicinity), the investigated turbine reached the maximum of its performance at any eccentricity. The eccentricity value selected for this analysis is high enough to reach significant improvement in the aerodynamic performance of the rotor and to see clearly deformation of the blades in the pressure field plots. On the other hand, deformation is not excessively high as far as the fatigue of the blade and the form of the blade deformation due to mechanical constraints are concerned. The results for this rotor configuration are compared with the results for the rotor with non-deformable blades (eccentricity 0).
3.2. Changes in the Power Coefficient during Rotor Revolution
Changes in the power coefficient during one revolution of the rotors for deformable blades and non-deformable blades are presented in Figure 8. They are sums of contributions of the individual blades shown in Figure 9. The hatched areas between deformable and non-deformable blade lines in both figures indicate positive (+) or negative (−) effects of deformable blade geometries onto the power coefficient readings. Both blades were analyzed separately for better understanding of the occurring phenomena. Blade A is marked blue and Blade B is indicated by red lines in Figure 9. Small changes can be distinguished between characteristics for each blade of the particular rotor type. They resulted from not fully repeatable loads of each blade due to random structures influenced by numerical errors (mesh deformation and remeshing). Still, 5 rotor revolutions selected for data averaging seem to be sufficient to reveal differences between the deformable and non-deformable rotors.
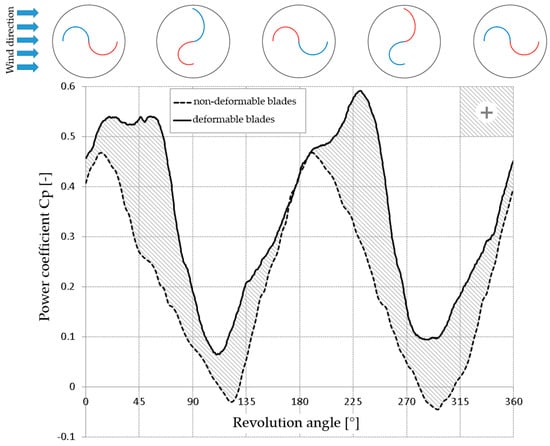
Figure 8.
Comparison of the averaged values of the power coefficient Cp for one revolution of the rotors with non-deformable and deformable blades. Subsequent positions of the turbine illustrated in the schemes above the graph correspond to the turbine revolution angle.
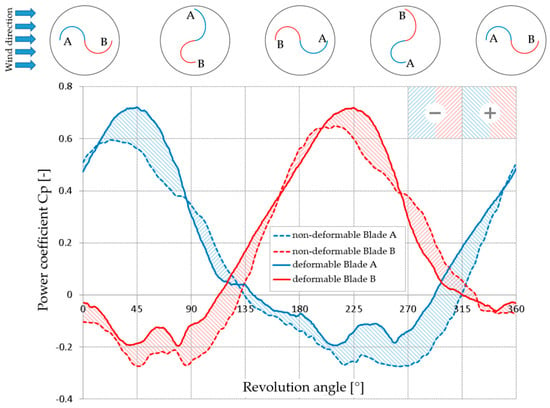
Figure 9.
Comparison of the averaged values of the power coefficient Cp for each rotor blade for one revolution of the rotors with non-deformable and deformable blades. Subsequent positions of the turbine illustrated in the schemes above the graph correspond to the turbine revolution angle.
An increase in the power coefficient of the deformable blade rotor with respect to the one with fixed shape can be observed in Figure 8 during all their revolutions. The most significant increase is observed for 30–70° and 210–250° parts of the cycle. However, one can see that for the part of the period when Cp reaches its minimum (90–135° and 270–330°), a significant increase is also observed. This positive effect results from an increase in the performance of both blades for almost all the revolutions, as one can see in Figure 9. A slight negative effect can be spotted for the advancing blade in the ranges 85–130° and 265–325° and a very minor one for the returning blade at 160–220° and 340–15°.
3.3. Blade Loading and Torque Generation
In order to better understand the contribution of the particular blade loading to the torque generation, torque distributions along the blades (from the axis towards the blade tips) are shown in Figure 10 and pressure fields in Figure 11, correspondingly. The dT/dL derivative per 1 m of the blade span (actually it is ΔT/ΔL as it is based on the finite volume simulations) is shown in Figure 10, thus, in order to obtain the torque value, this parameter needs to be integrated along the blade. Three particular instants of the rotor revolution were selected (15°, 55° and 105°), which is sufficient to display the main differences between the rotors with deformable and non-deformable blades. The data were presented for a half of the cycle, because no significant differences can be distinguished for its second part. The data in Figure 10 and Figure 11 are attained for the 10th rotor revolution, thus there is no perfect agreement with the results in Figure 9 obtained from averaging over 5 revolutions. Animations of changes in parameters for one rotor revolution are presented in Supplementary Materials (Video S1 presents the non-deformable rotor, whereas Video S2 shows the deformable one).
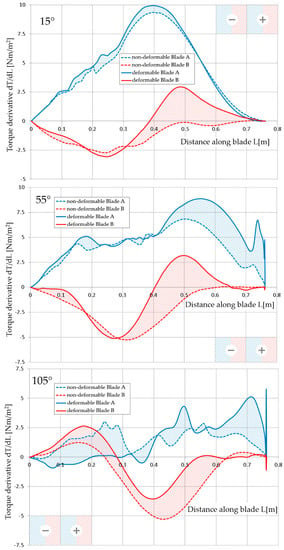
Figure 10.
Torque derivative (dT/dL) variation along the blade for selected instants (15°, 55° and 105°) of the rotor revolution with non-deformable and deformable blades.
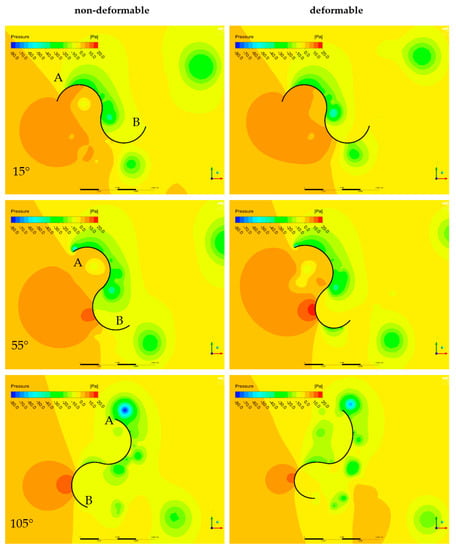
Figure 11.
Pressure fields for selected instants (15°, 55° and 105°) of one revolution of the rotors with non-deformable and deformable blades.
In the 15° (also 195°) instant of the revolution cycle, the non-deformable rotor reaches the maximum of its power output (Figure 8). In this case, one can notice in Figure 11 that a high pressure at the concave side of the advancing blade (A) and a low pressure at its convex side (due to flow acceleration) result in the highest positive torque generated by this blade. It is diminished by the retarding contribution of the returning blade (B), mostly due to a pressure difference for its part near the axis of the turbine. In this instant of the revolution cycle, the blades of the deformable rotor have a semi-circular shape like the blades of the non-deformable rotor. No significant increase in the power coefficient is observed at this moment for the rotor in reference to the non-deformable one (Figure 8). The data presented in Figure 9 reveal slight positive contributions both of the advancing (A) and returning (B) blades. The positive contribution of the advancing blade (blue lines) can be distinguished also in Figure 10. An increase of the torque can be seen for a substantial portion of the blade starting from the rotor axis (internal part), whereas the tip (external) part has slightly lower loading. In the case of the returning blade (red lines), positive and negative contributions of the blade deformation can be observed locally for the internal part of the blade, whereas a positive effect is clearly visible for the external part.
The highest positive effect of the blade deformation with respect to the non-deformable turbine is observed for the 55° (also 235°) instant of the revolution cycle (Figure 8). In this position the deformable rotor reaches the highest power output, whereas it is already significantly diminished for the non-deformable one. In Figure 9 it can be seen that both the blades contribute to the power gain. It is due to the blade deformation, i.e., expansion of the advancing blade (A) and contraction of the returning one (B), as shown in Figure 11. The torque of the advancing blade is significantly higher at its external part (Figure 10). It results from higher velocity at the convex side in a very limited way. The main reason of the higher torque is just a higher arm (radius) due to the blade expansion. Despite the fact that the pressure build-up (stagnation zone) at the convex side of the returning blade is higher than for the non-deformable blade, its contraction and higher pressure at the concave side do not reduce further the torque at its central part. On the other hand, much higher fluid acceleration at the convex side of the deformed blade for its external part results in lower pressure and locally changes its torque to the positive one. Thus, the retarding effect of the contracted returning blade is reduced significantly.
A significantly positive effect of the blade deformation can be observed also for the 105° (and 285° as well) instant of the revolution cycle (Figure 8). In this position both the deformable and non-deformable rotors reach the lowest power output. The blade deformation in this case is the highest as presented in Figure 11. In Figure 9 one can see that the deformation of the advancing blade (A) decreases the pressure coefficient, nevertheless, it remains positive. A beneficial effect of the higher arm in the torque definition due to blade expansion can be noticed for the external part of this blade (Figure 10). It is lowered by higher pressure at its convex side due to lower intensity of the vortex structure at the blade tip in comparison to the non-deformable rotor (Figure 11). This positive effect does not compensate for a decrease in the torque in the internal part of the blade. This decrease is mainly due to much lower pressure at the concave side of the blade, which is an effect of the flow acceleration in this region. Deformation of the returning blade (B) improves considerably its performance almost along its whole length, excluding the tip only (Figure 10). It is partially due to a much lower torque arm of the contracted blade. Additionally, the higher curvature of the deformed blade yields higher flow acceleration and a significant reduction in the high pressure stagnation zone at its convex side in comparison to the non-deformable rotor (Figure 11). The blade contraction is also followed by a pressure increase at the convex side of the returning blade. Thus, the pressure difference between the convex and concave sides of the blade is significantly diminished. All these aspects contribute to a reduction in the retarding torque of the deformable blade almost to zero (Figure 9).
4. Summary and Conclusions
An idea of the Savonius turbine with a variable geometry of blades was proposed. Blades made of an elastic material were continuously deformed during the rotor revolution in order to increase a positive torque of the advancing blade, and, at the same time, to decrease a negative moment of the returning blade. The main outcomes of the performed investigations are outlined below:
- An elaborate two-dimensional numerical model was developed to simulate a transient flow in the variable-geometry rotor in order to assess its aerodynamic performance. The shape and position of the rotor blades were subject to continuous changes according to the constraints defined in the structural analysis. The rotational motion and deformations of the blades were transferred to the fluid flow (CFD) analysis, where deformations of grid elements and remeshing options were applied. This method yielded a satisfactory agreement with a typical method of simulations, which consists in rotation of the internal domain surrounding the fixed-shape Savonius rotor.
- An improvement of the aerodynamic turbine performance in comparison to the non-deformable Savonius turbine was obtained. It was achieved when the blades were maximally deformed in the range of angular position 45–180° with respect to the direction of the incoming wind. The maximum of Cp was attained at the angle of 105°, i.e., when the blade chords were almost perpendicular to the wind direction.
- An increase in the blade deformation increased the rotor performance. For the eccentricity position of 105°, the power coefficient increased by 37%, 66% and 90% for 5%, 10% and 15% of the eccentricity magnitude, respectively. However, the range of angular positions for which a gain with respect to the non-deformable Savonius turbine occurred decreased.
- A detailed flow analysis for the rotor with eccentricity in the 105° position showed an increase in the power coefficient of the deformable blade rotor with respect to the one having the fixed shape during all their revolutions. The radial expansion of the advancing blade increased the positive torque and the contraction of the returning blade decreased the negative one, with slight changes in the flow patterns.
A significant increase in the aerodynamic performance of the Savonius turbine with continuously deformed blades was confirmed. The power coefficient exceeded Cp = 0.3 and it reached almost Cp = 0.4 for the highest eccentricity magnitude. Thus, this design is at least comparable to Savonius turbines equipped with augmentation systems presented in the literature [11,26]. However, additional mechanisms applied to deform blades and locate the rotor in the proper position with respect to the incoming wind are required. They will make the design of the turbine more complex than the original Savonius and they will consume a part of the energy generated by the turbine. Thus, all turbine elements need to be carefully designed to be resistant and efficient. Additionally, as the turbine performance depends considerably on the blade deformation, it is necessary to select an easily deformable material with high fatigue resistance. The numerical model of the deformable Savonius rotor needs to be further developed to limit the numerical instabilities during the solution. The mechanical losses due to friction and blade deformations are to be included. Also the problem of time consuming simulations has to be addressed.
Supplementary Materials
The following are available online at https://www.mdpi.com/1996-1073/13/14/3717/s1: Video S1: NonDeformable_Savonius.wmv; Video S2: Deformable_Savonius.wmv.
Author Contributions
Conceptualization, K.S. and D.O.; methodology, K.S., D.O., P.R.; investigation, K.S., D.O., P.R., E.M.; writing—original draft preparation, K.S. and D.O.; All authors have read and agreed to the published version of the manuscript.
Funding
The investigations have been financially supported by the research project POWR.03.02.00-00-I042/16-00 of the National Centre for Research and Development and Innovation Incubator 2.0 project MNISW/2019/157/DIR of the Ministry of Science and Higher Education.
Acknowledgments
We would like to thank Malgorzata Jozwik for her significant linguistic help during the preparation of the manuscript.
Conflicts of Interest
The authors declare no conflict of interest.
References
- Tummala, A.; Velamati, R.K.; Sinha, D.K.; Indraja, V.; Krishna, V.H. A review on small scale wind turbines. Renew. Sustain. Energy Rev. 2016, 56, 1351–1371. [Google Scholar] [CrossRef]
- Aslam Bhutta, M.M.; Hayat, N.; Farooq, A.U.; Ali, Z.; Jamil, S.R.; Hussain, Z. Vertical axis wind turbine—A review of various configurations and design techniques. Renew. Sustain. Energy Rev. 2012, 16, 1926–1939. [Google Scholar] [CrossRef]
- Kumar, R.; Raahemifar, K.; Fung, A.S. A critical review of vertical axis wind turbines for urban applications. Renew. Sustain. Energy Rev. 2018, 89, 281–291. [Google Scholar] [CrossRef]
- Toja-Silva, F.; Colmenar-Santos, A.; Castro-Gil, M. Urban wind energy exploitation systems: Behaviour under multidirectional flow conditions—Opportunities and challenges. Renew. Sustain. Energy Rev. 2013, 24, 364–378. [Google Scholar] [CrossRef]
- KC, A.; Whale, J.; Urmee, T. Urban wind conditions and small wind turbines in the built environment: A review. Renew. Energy 2019, 131, 268–283. [Google Scholar] [CrossRef]
- Savonius, S.J. The S-rotor and its applications. Mech. Eng. 1931, 53, 333–338. [Google Scholar]
- Akwa, J.V.; Vielmo, H.A.; Petry, A.P. A review on the performance of Savonius wind turbines. Renew. Sustain. Energy Rev. 2012, 16, 3054–3064. [Google Scholar] [CrossRef]
- Roy, S.; Saha, U.K. Review on the numerical investigations into the design and development of Savonius wind rotors. Renew. Sustain. Energy Rev. 2013, 24, 73–83. [Google Scholar] [CrossRef]
- Doerffer, P.; Doerffer, K.; Ochrymiuk, T.; Telega, J. Variable Size Twin-Rotor Wind Turbine. Energies 2019, 12, 2543. [Google Scholar] [CrossRef]
- Abraham, J.P.; Plourde, B.D.; Mowry, G.S.; Minkowycz, W.J.; Sparrow, E.M. Summary of Savonius wind turbine development and future applications for small-scale power generation. J. Renew. Sustain. Energy 2012, 4, 042703. [Google Scholar] [CrossRef]
- Alom, N.; Saha, U.K. Four Decades of Research into the Augmentation Techniques of Savonius Wind Turbine Rotor. J. Energy Resour. Technol. Trans. ASME 2018, 140, 1–14. [Google Scholar] [CrossRef]
- Kumar, A.; Saini, R.P. Performance parameters of Savonius type hydrokinetic turbine—A Review. Renew. Sustain. Energy Rev. 2016, 64, 289–310. [Google Scholar] [CrossRef]
- Kacprzak, K.; Liskiewicz, G.; Sobczak, K. Numerical investigation of conventional and modified Savonius wind turbines. Renew. Energy 2013, 60, 578–585. [Google Scholar] [CrossRef]
- Chen, L.; Chen, J.; Zhang, Z. Review of the Savonius rotor’s blade profile and its performance. J. Renew. Sustain. Energy 2018, 10, 013306. [Google Scholar] [CrossRef]
- Tartuferi, M.; D’Alessandro, V.; Montelpare, S.; Ricci, R. Enhancement of savonius wind rotor aerodynamic performance: A computational study of new blade shapes and curtain systems. Energy 2015, 79, 371–384. [Google Scholar] [CrossRef]
- Kerikous, E.; Thévenin, D. Optimal shape of thick blades for a hydraulic Savonius turbine. Renew. Energy 2019, 134, 629–638. [Google Scholar] [CrossRef]
- Tian, W.; Mao, Z.; Zhang, B.; Li, Y. Shape optimization of a Savonius wind rotor with different convex and concave sides. Renew. Energy 2018, 117, 287–299. [Google Scholar] [CrossRef]
- Mohamed, M.H.; Janiga, G.; Pap, E.; Thévenin, D. Optimal blade shape of a modified Savonius turbine using an obstacle shielding the returning blade. Energy Convers. Manag. 2011, 52, 236–242. [Google Scholar] [CrossRef]
- Zhang, B.; Song, B.; Mao, Z.; Tian, W.; Li, B.; Li, B. A Novel Parametric Modeling Method and Optimal Design for Savonius Wind Turbines. Energies 2017, 10, 301. [Google Scholar] [CrossRef]
- Ogawa, T.; Yoshida, H. The effects of a deflecting plate and rotor end plates on performances of Savonius-type wind turbine. Bull. JSME 1986, 29, 2115–2121. [Google Scholar] [CrossRef]
- Golecha, K.; Eldho, T.I.; Prabhu, S.V. Influence of the deflector plate on the performance of modified Savonius water turbine. Appl. Energy 2011, 88, 3207–3217. [Google Scholar] [CrossRef]
- Shaughnessy, B.M.; Probert, S.D. Partially-blocked savonius rotor. Appl. Energy 1992, 43, 239–249. [Google Scholar] [CrossRef]
- Alexander, A.J.; Holownia, B.P. Wind tunnel tests on a savonius rotor. J. Wind Eng. Ind. Aerodyn. 1978, 3, 343–351. [Google Scholar] [CrossRef]
- Altan, B.D.; Atılgan, M. The use of a curtain design to increase the performance level of a Savonius wind rotors. Renew. Energy 2010, 35, 821–829. [Google Scholar] [CrossRef]
- Irabu, K.; Roy, J.N. Characteristics of wind power on Savonius rotor using a guide-box tunnel. Exp. Therm. Fluid Sci. 2007, 32, 580–586. [Google Scholar] [CrossRef]
- Wong, K.H.; Chong, W.T.; Sukiman, N.L.; Poh, S.C.; Shiah, Y.C.; Wang, C.T. Performance enhancements on vertical axis wind turbines using flow augmentation systems: A review. Renew. Sustain. Energy Rev. 2017, 73, 904–921. [Google Scholar] [CrossRef]
- Lipian, M.; Czapski, P.; Obidowski, D. Fluid–Structure Interaction Numerical Analysis of a Small, Urban Wind Turbine Blade. Energies 2020, 13, 1832. [Google Scholar] [CrossRef]
- Karczewski, M.; Sobczak, K.; Lipian, M.; Jozwik, K. Numerical and experimental tools for small wind turbine load analysis. In Structural Control and Fault Detection of Wind Turbine Systems; Institution of Engineering and Technology: London, UK, 2018; pp. 45–79. ISBN 9781785613944. [Google Scholar]
- Shkara, Y.; Cardaun, M.; Schelenz, R.; Jacobs, G. Aeroelastic response of a multi-megawatt upwind horizontal axis wind turbine (HAWT) based on fluid–structure interaction simulation. Wind Energy Sci. 2020, 5, 141–154. [Google Scholar] [CrossRef]
- Löhner, R.; Haug, E.; Michalski, A.; Muhammad, B.; Drego, A.; Nanjundaiah, R.; Zarfam, R. Recent advances in computational wind engineering and fluid-structure interaction. J. Wind Eng. Ind. Aerodyn. 2015. [Google Scholar] [CrossRef]
- Bazilevs, Y.; Korobenko, A.; Deng, X.; Yan, J.; Kinzel, M.; Dabiri, J.O. Fluid–Structure Interaction Modeling of Vertical-Axis Wind Turbines. J. Appl. Mech. 2014, 81. [Google Scholar] [CrossRef]
- MacPhee, D.W.; Beyene, A. Fluid-structure interaction analysis of a morphing vertical axis wind turbine. J. Fluids Struct. 2016. [Google Scholar] [CrossRef]
- Obidowski, D.; Sobczak, K.; Jozwik, K.; Reorowicz, P. Vertical Axis Wind Turbine with a Variable Geometry of Blades. European Patent Application 19199085.2, 24 September 2019. [Google Scholar]
- Sobczak, K. Numerical investigations of an influence of the aspect ratio on the Savonius rotor performance. J. Phys. Conf. Ser. 2018, 1101, 012034. [Google Scholar] [CrossRef]
- Kacprzak, K.; Sobczak, K. Numerical analysis of the flow around the Bach-type Savonius wind turbine. J. Phys. Conf. Ser. 2014, 530, 012063. [Google Scholar] [CrossRef]
- Kamoji, M.A.; Kedare, S.B.; Prabhu, S.V. Experimental investigations on single stage modified Savonius rotor. Appl. Energy 2009. [Google Scholar] [CrossRef]
- ANSYS. ANSYS Fluent 19.2 Theory Guide; Ansys Inc.: Canonsburg, PA, USA, 2018. [Google Scholar]
- Menter, F.R. Two-equation eddy-viscosity turbulence models for engineering applications. AIAA J. 1994, 32, 1598–1605. [Google Scholar] [CrossRef]
- Ferrari, G.; Federici, D.; Schito, P.; Inzoli, F.; Mereu, R. CFD study of Savonius wind turbine: 3D model validation and parametric analysis. Renew. Energy 2017, 105, 722–734. [Google Scholar] [CrossRef]
- Kacprzak, K.; Sobczak, K. Computational assessment of the influence of the overlap ratio on the power characteristics of a Classical Savonius wind turbine. Open Eng. 2015, 5, 314–322. [Google Scholar] [CrossRef]
- Aramendia, I.; Fernandez-Gamiz, U.; Zulueta, E.; Saenz-Aguirre, A.; Teso-Fz-Betoño, D. Parametric Study of a Gurney Flap Implementation in a DU91W(2)250 Airfoil. Energies 2019, 12, 294. [Google Scholar] [CrossRef]
- Celik, I.B.; Ghia, U.; Roache, P.J.; Freitas, C.J.; Coleman, H.; Raad, P.E. Procedure for Estimation and Reporting of Uncertainty Due to Discretization in CFD Applications. J. Fluids Eng. 2008, 130, 078001. [Google Scholar] [CrossRef]
© 2020 by the authors. Licensee MDPI, Basel, Switzerland. This article is an open access article distributed under the terms and conditions of the Creative Commons Attribution (CC BY) license (http://creativecommons.org/licenses/by/4.0/).