Article

Analysis on the Fire Growth Rate Index Considering of Scale Factor, Volume Fraction, and Ignition Heat Source for Polyethylene Foam Pipe Insulation

1
Department of Architecture & Fire Safety, Dong Yang University, Yeongju 36040, Korea
2
R&D Laboratory, Korea Fire Institute, Yongin 17088, Korea
*
Author to whom correspondence should be addressed.
Energies 2020, 13(14), 3644; https://doi.org/10.3390/en13143644
Submission received: 17 June 2020 / Revised: 1 July 2020 / Accepted: 2 July 2020 / Published: 15 July 2020
(This article belongs to the Special Issue Engineering Fluid Dynamics 2019-2020)

Abstract

:
The fire growth rate index (FIGRA), which is the ratio of the maximum value of the heat release rate (Qmax) and the time (tmax) to reach the maximum heat release rate, is a general method to evaluate a material in the fire-retardant performance in fire technology. The object of this study aims to predict FIGRA of the polyethylene foam pipe insulation in accordance with the scale factor (Sf), the volume fraction of the pipe insulation (VF) and the ignition heat source (Qig). The compartments made of fireboard have been mock-up with 1/3, 1/4, and 1/5 reduced scales of the compartment as specified in ISO 20632. The heat release rate data of the pipe insulation with the variation of Sf, VF, and Qig are measured from 33 experiments to correlate with FIGRA. Based on a critical analysis of the heat transfer phenomenon from previous research literature, the predictions of Qmax and tmax are presented. It is noticeable that the fire-retardant grade of the polyethylene foam pipe insulation could have Grade B, C, and D in accordance with the test conditions within ±15% deviation of the predicted FIGRA. In case of establishing the database of various types of insulation, the prediction models could apply to evaluate the fire-retardant performance.

1. Introduction

Insulation is widely used in buildings as an important material to prevent energy loss of architecture [1,2,3]. Among them, polystyrene, poly-urethane, poly-ethylene, and elastomeric closed cell thermal insulation, which are made of organic substance, are mainly used as pipe insulation to prevent freezing and surface condensation by minimizing the heat loss [4,5,6]. However, pipe insulation could be ignited from the overheated hot wire or welding work for maintenance, and rapidly spread to the surrounding combustibles [7,8,9]. To fundamentally prevent the spread of fire occurred by pipe insulation, inorganic materials such as semi-combustible, which does not ignite at high temperature, is able to be applied. However, inorganic substance, especially molded stone wool, glass wool, etc., is not useful in the installation of piping compared to organic materials because of its highly absorbent feature as a mechanical weakness [10,11,12]. For these reasons, the specific material of pipe insulation is not regulated, and it is recommended to use materials that satisfy the fire retardants as an alternative [13]. The fire growth rate index (FIGRA) is a general method to evaluate the material in the fire-retardant performance in fire technology [14,15]. Therefore, the pipe insulation, which satisfies extremely low FIGRA values, should minimize the rapid spread of fire phenomenon even though the pipe insulation could not have the properties of the complete non-combustible. However, the regulated test conditions, such as the compartment size, the thermal properties of the wall, and the ignition heat source, are not equal for each test standard [16,17,18,19]. It means that FIGRA for evaluating the flame-retardant performance of the pipe insulation depends on the test conditions. Thus, the thermal characteristics inside the compartment in accordance with test conditions are important to analyze a fire risk of the pipe insulation.
There are several studies that the fire-retardant performance test result is changed by the test conditions in the use of the same pipe insulation material. The temperature inside the compartment increases in proportion to the thermal ratio, as resulted in the study of H. Pretrel et al., analyzed by the correlation under the ventilated pool fire phenomenon by the thermal ratio of dimensionless variables including thermal conductivity coefficient, the thickness of the wall, and the opening area of the compartment [20].
The fire growth rate decreases as the ignition source decreases in the same volume of pipe insulation, since the time to reach the maximum heat release is decreased proportional to the delay time of ignition, as investigation of N. Hernandez with the predictive model of the phenomenon of the penetration of radiation to the sold materials [21]. In addition, the fire growth rate decreases in proportion to the size of volume space, in the research of R.R. Leisted et al. with the analyze of the temperature distribution by the time in the case of polyisocyanurate or stone wool in the 1/5 reduced scale compartment of ISO 13784-1 [22].
In accordance with the previous research, it can be predicted that FIGRA would not be equal for the same material due to the thermal conditions. However, to the authors’ knowledge, there have been no research to predict FIGRA since the values of Qmax and tmax cannot be closed with previous investigations [20,21,22,23,24]. Especially, if the value of FIGRA for a highly combustible material is evaluated too low at a specified test condition, it can cause a risk for the material to be used for building construction. From this point of view, the quantitative analysis on FIGRA in accordance with the experiment conditions can be considered as a significant object in terms of the evaluation for the risk of fire spread. The object of this study aims to predict FIGRA of polyethylene foam pipe insulation in accordance with the scale factor (Sf), the volume fraction of the pipe insulation (VF), and the ignition heat source (Qig).

2. Materials and Methods

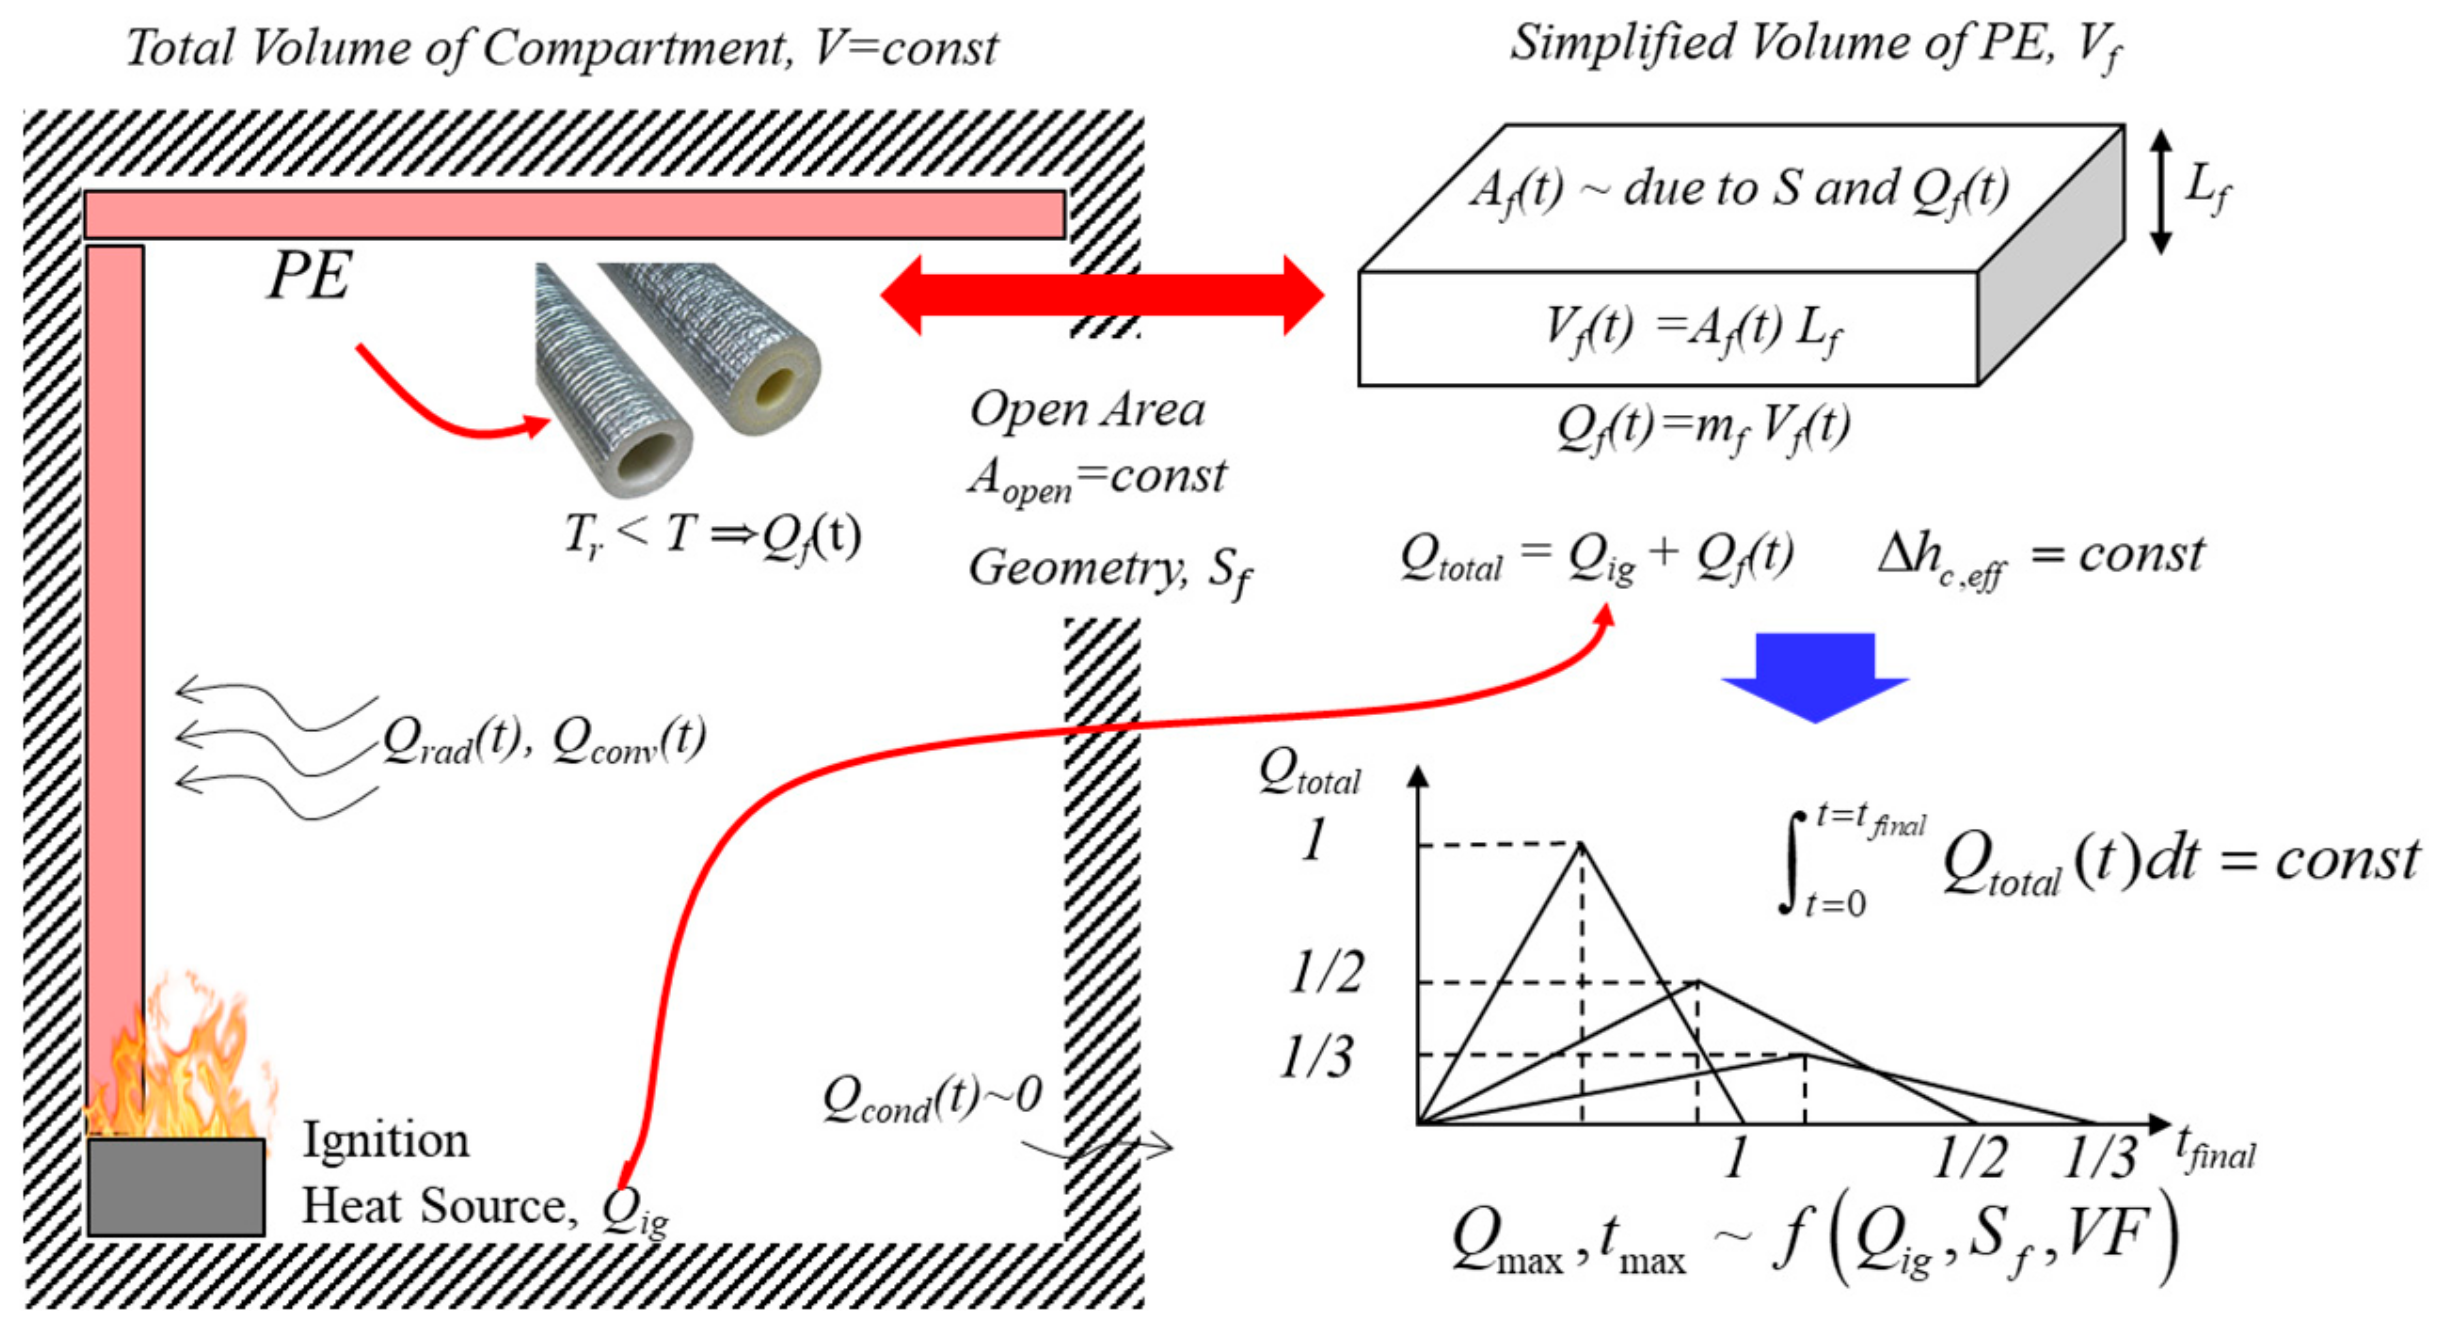
2.1. Heat Transfer Phenomenon

Figure 1 explains that the heat transmission phenomenon of a polyethylene foam pipe insulation in the semi-closed compartment space. As shown in this figure, the surface temperature of the pipe insulation increases to reach the reference temperature by the ignition heat source. Therefore, the mass loss of the pipe insulation can be quantified as [25,26].
m ˙ f r = ρ A 0 Y f n Y O 2 m e ( E / R T τ )
where m ˙ f , r , ρ, A0, Y, E, R, and Tr are the mass loss rate per unit volume, the density of pipe insulation, the pre-exponential factor, the mass fraction, the activation energy (kJ/mole), the gas constant (8.314 kJ/kmole), and the reference temperature, respectively. The heat release rate during the vaporization of the combustible (Qf) can be expressed as,
Q f = η Δ h c m ˙ f , r V f
where η, Δhc, and Vf are the combustion efficiency, the heat of combustion, and the ignited insulation volume during the combustion time, respectively [27]. When the ignition of the pipe insulation takes place inside the compartment, the surface area, which reaches the reference temperature (Tr) by convective heat from the free stream and the radiative heat from the flame and the wall, could be time-variant. Thus, the total heat release rate can be denoted as,
Q t ( t ) = Q f ( t ) + Q i g
where t denotes the combustion time, and the total heat release rate (Qt(t)) and the heat release rate of the pipe insulation (Qf(t)) in Equation (3) should be a time-variant function due to AfAf(t). However, the heat of combustion (Δhc, kJ/kg), which is one of the thermochemical properties, has a constant value for the pipe insulation as shown in Equation (4) [28,29,30].
Δ h c = t = 0 t = t f i n a l Q ˙ f ( t ) d t η Δ m f = c o n s t
where Δmf means that the mass loss after the combustion of the pipe insulation. The fire growth rate index (FIGRA) to classify the fire-retardant grade is defined as the ratio of the maximum heat release rate (Qmax), which is the net heat of the pipe insulation, and the time (tmax) to reach the maximum heat release rate (Qmax) as denoted in Equation (5) [16].
F I G R A = Q max t max
where FIGRA refers to a main parameter to evaluate the fire-retardant grade. As Qig increases, Q ˙ f ( t ) is varied in proportion, since the size of the solid surface to reach the reference temperature (Tr) varies with the combustion time. However, when the heat of combustion (Δhc) in Equation (4) maintains a constant value with a fixed value of Δmf, the integral value of Qf(t) during the total combustion time should satisfy the first law of energy conservation. It means that Qmax increases as the total combustion time decreases, as shown in the lower right side in Figure 1. Especially, the convective and radiative heat can be mainly affected by the compartment space (VM), the volume of the combustibles (Vf), and the geometrical shape of the opening area. Therefore, it is assumed that Q ˙ max and tmax can be functioned with the quantity of the volume of the compartment (VM), the volume of the combustibles (Vf), and the ignition heat source (Qig) as denoted in Equation (6).
Q max , t max ~ f ( Q i g , V M , V f )

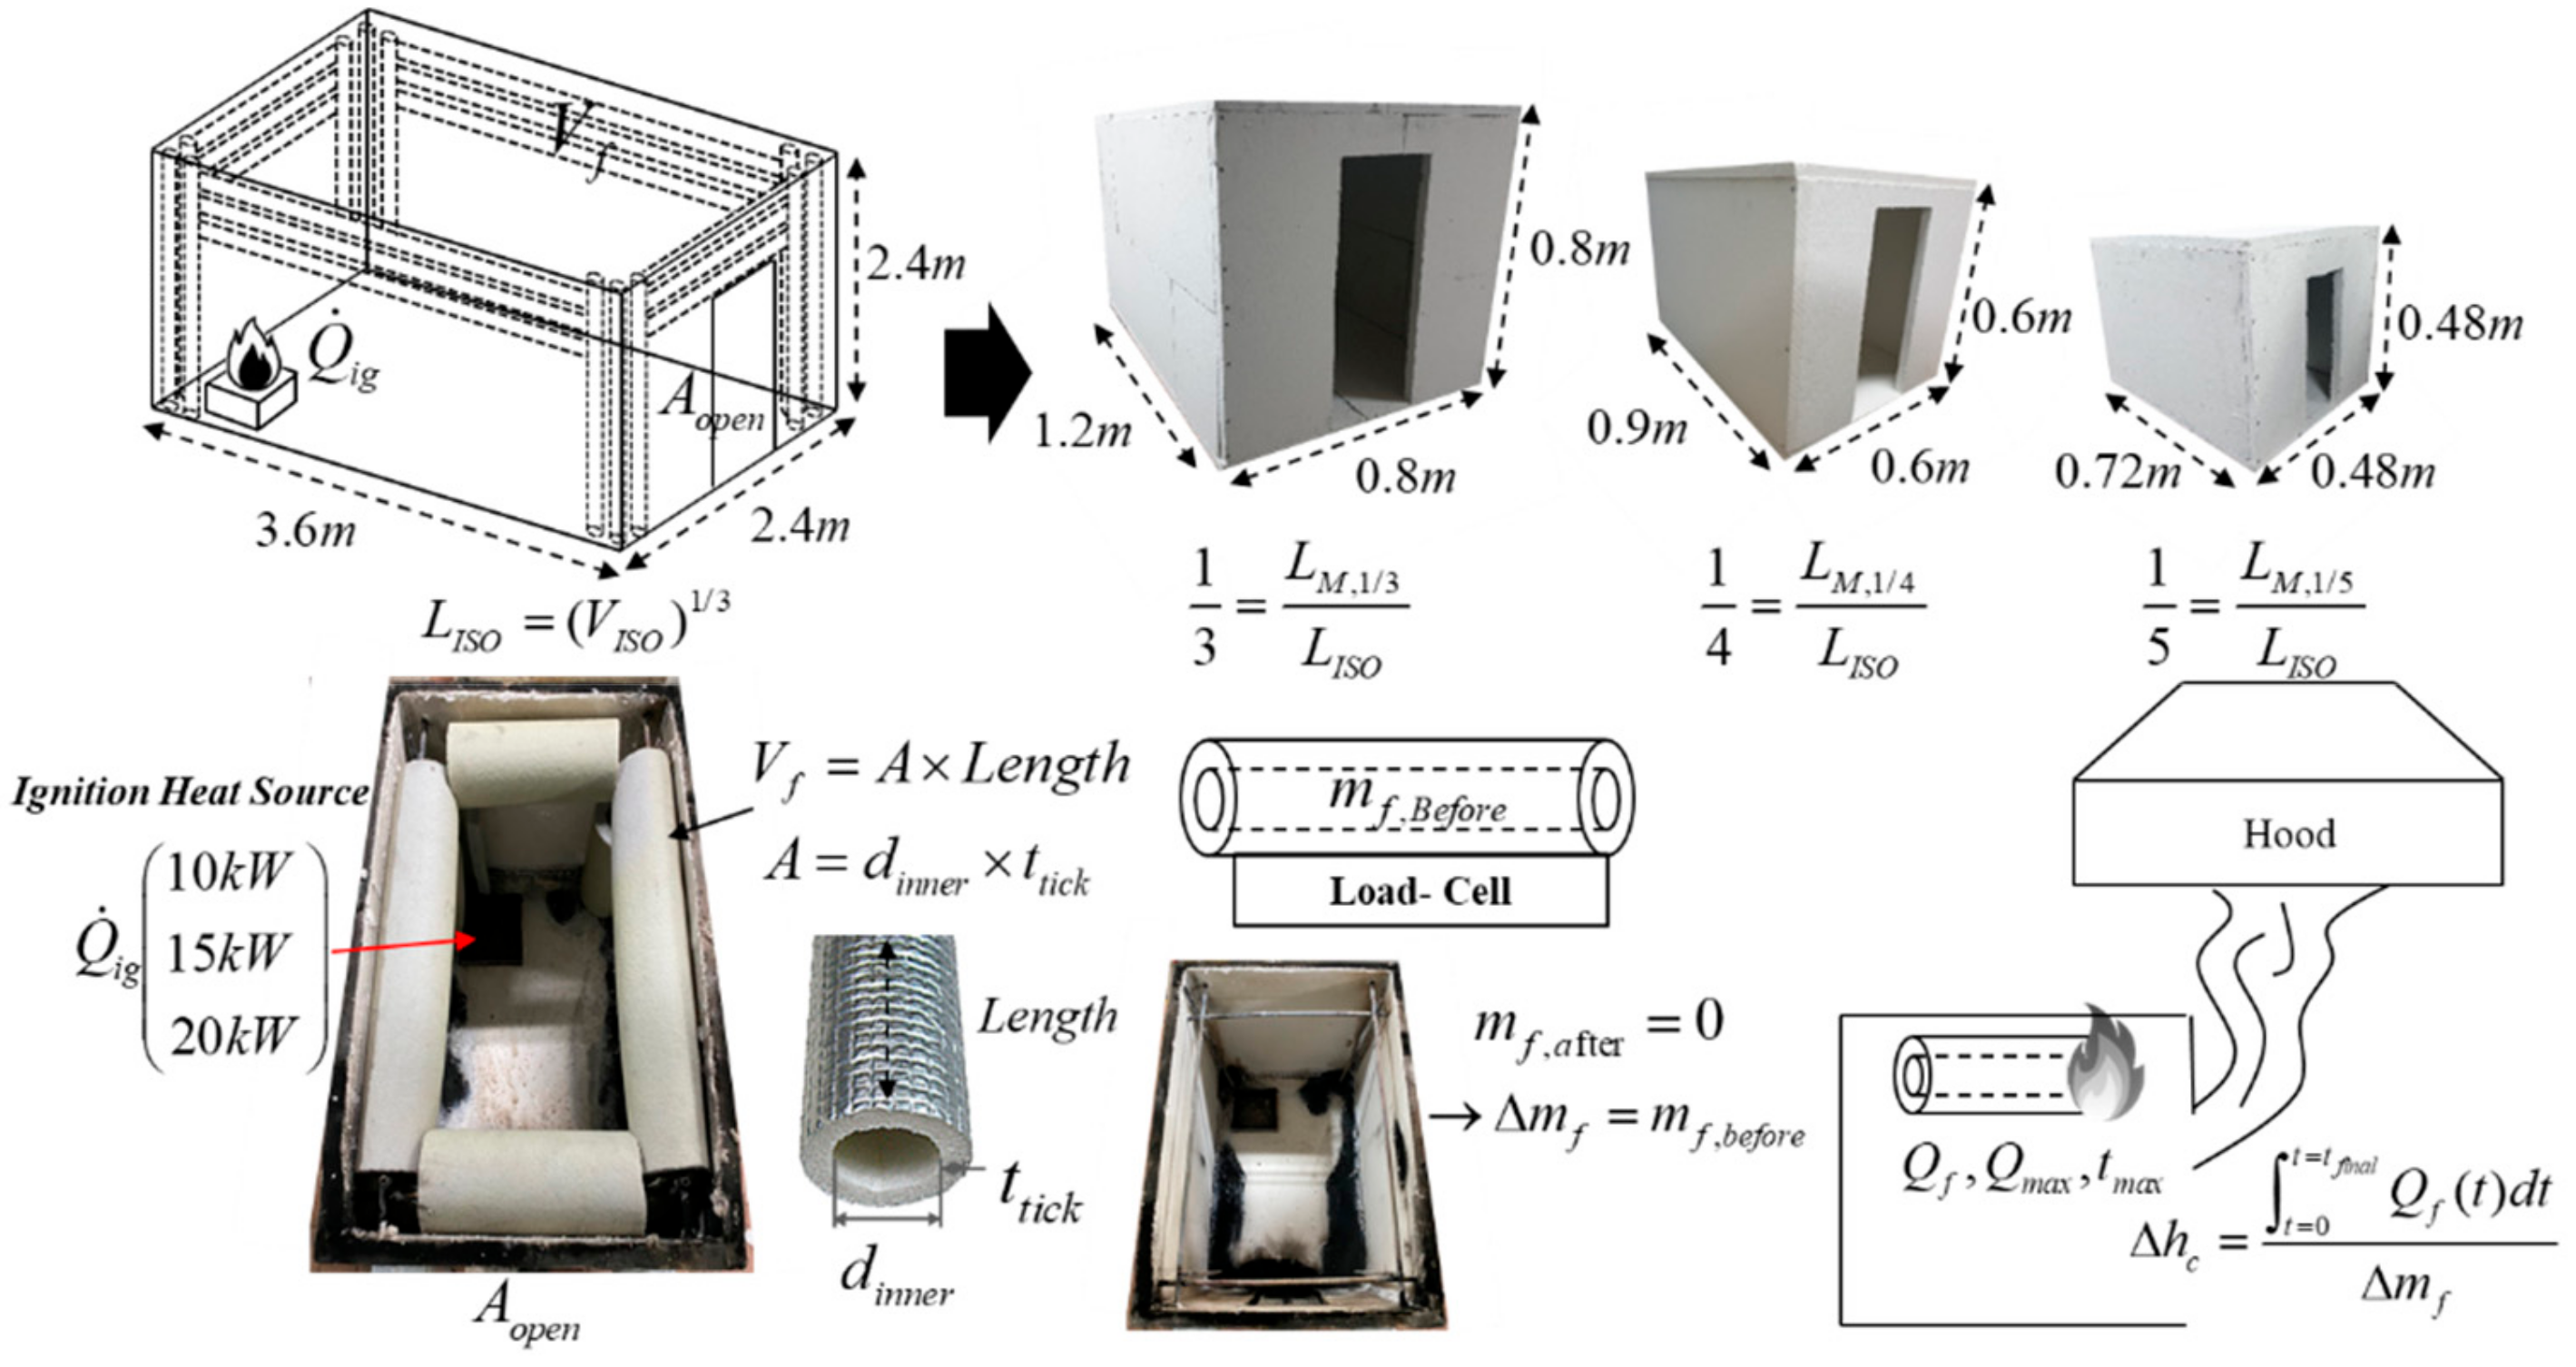
2.2. Heat Transfer Phenomenon

Table 1 summarized the test conditions of ISO 20632 and NFPA 274. As shown in the table, the volume (VM) of the compartment was reduced to 1/3, 1/4, and 1/5 of ISO 20632. In addition, the volume fractions of the pipe insulation (VF) consisted of a total 5 conditions, including those of ISO 20632 (VF = 0.024) and NFPA 274 (VF = 0.07). The experiment conditions of this study were opted with the definitions of the scale factor (Sf) and the volume fraction (VF) as denoted in Equation (6).
S f = L M L I S O , V F = V f V M
where Sf, VM, VISO, Vf, and VF are the scale factor, the volume of the compartment, the volume of the ISO 20632 compartment, and the volume fraction of the pipe insulation, respectively. The schematic diagram and pictures of the experiment conditions are explained in Figure 2.

2.3. Calibration of the Heat Release Rate

Figure 3 shows the calibration results of the heat release rate for a propane burner by the oxygen consumption method of the cone calorimeter. A mass flow controller (MFC, Model TSC-145) was used to control the flow rate of propane. In Figure 3a, the difference of maximum 50 s with the theoretical heat release rate was measured due to the increase of the response time of the MFC instrument. Thus, in the low flow range from 10 to 20 kW, the fluctuation of the mass flow rate and the delay time were minimized by the metering valve and the area flow meter. As a result of performing A-Type uncertainty under the repeated experiments, it is found that the cone-calorimeter apparatus used in this study had a reliability of ±5% when the coverage factor, k = 1.95 at 95% confidence level as displayed in Figure 3b. Table 2 shows the specifications of the experimental apparatus used in this study.

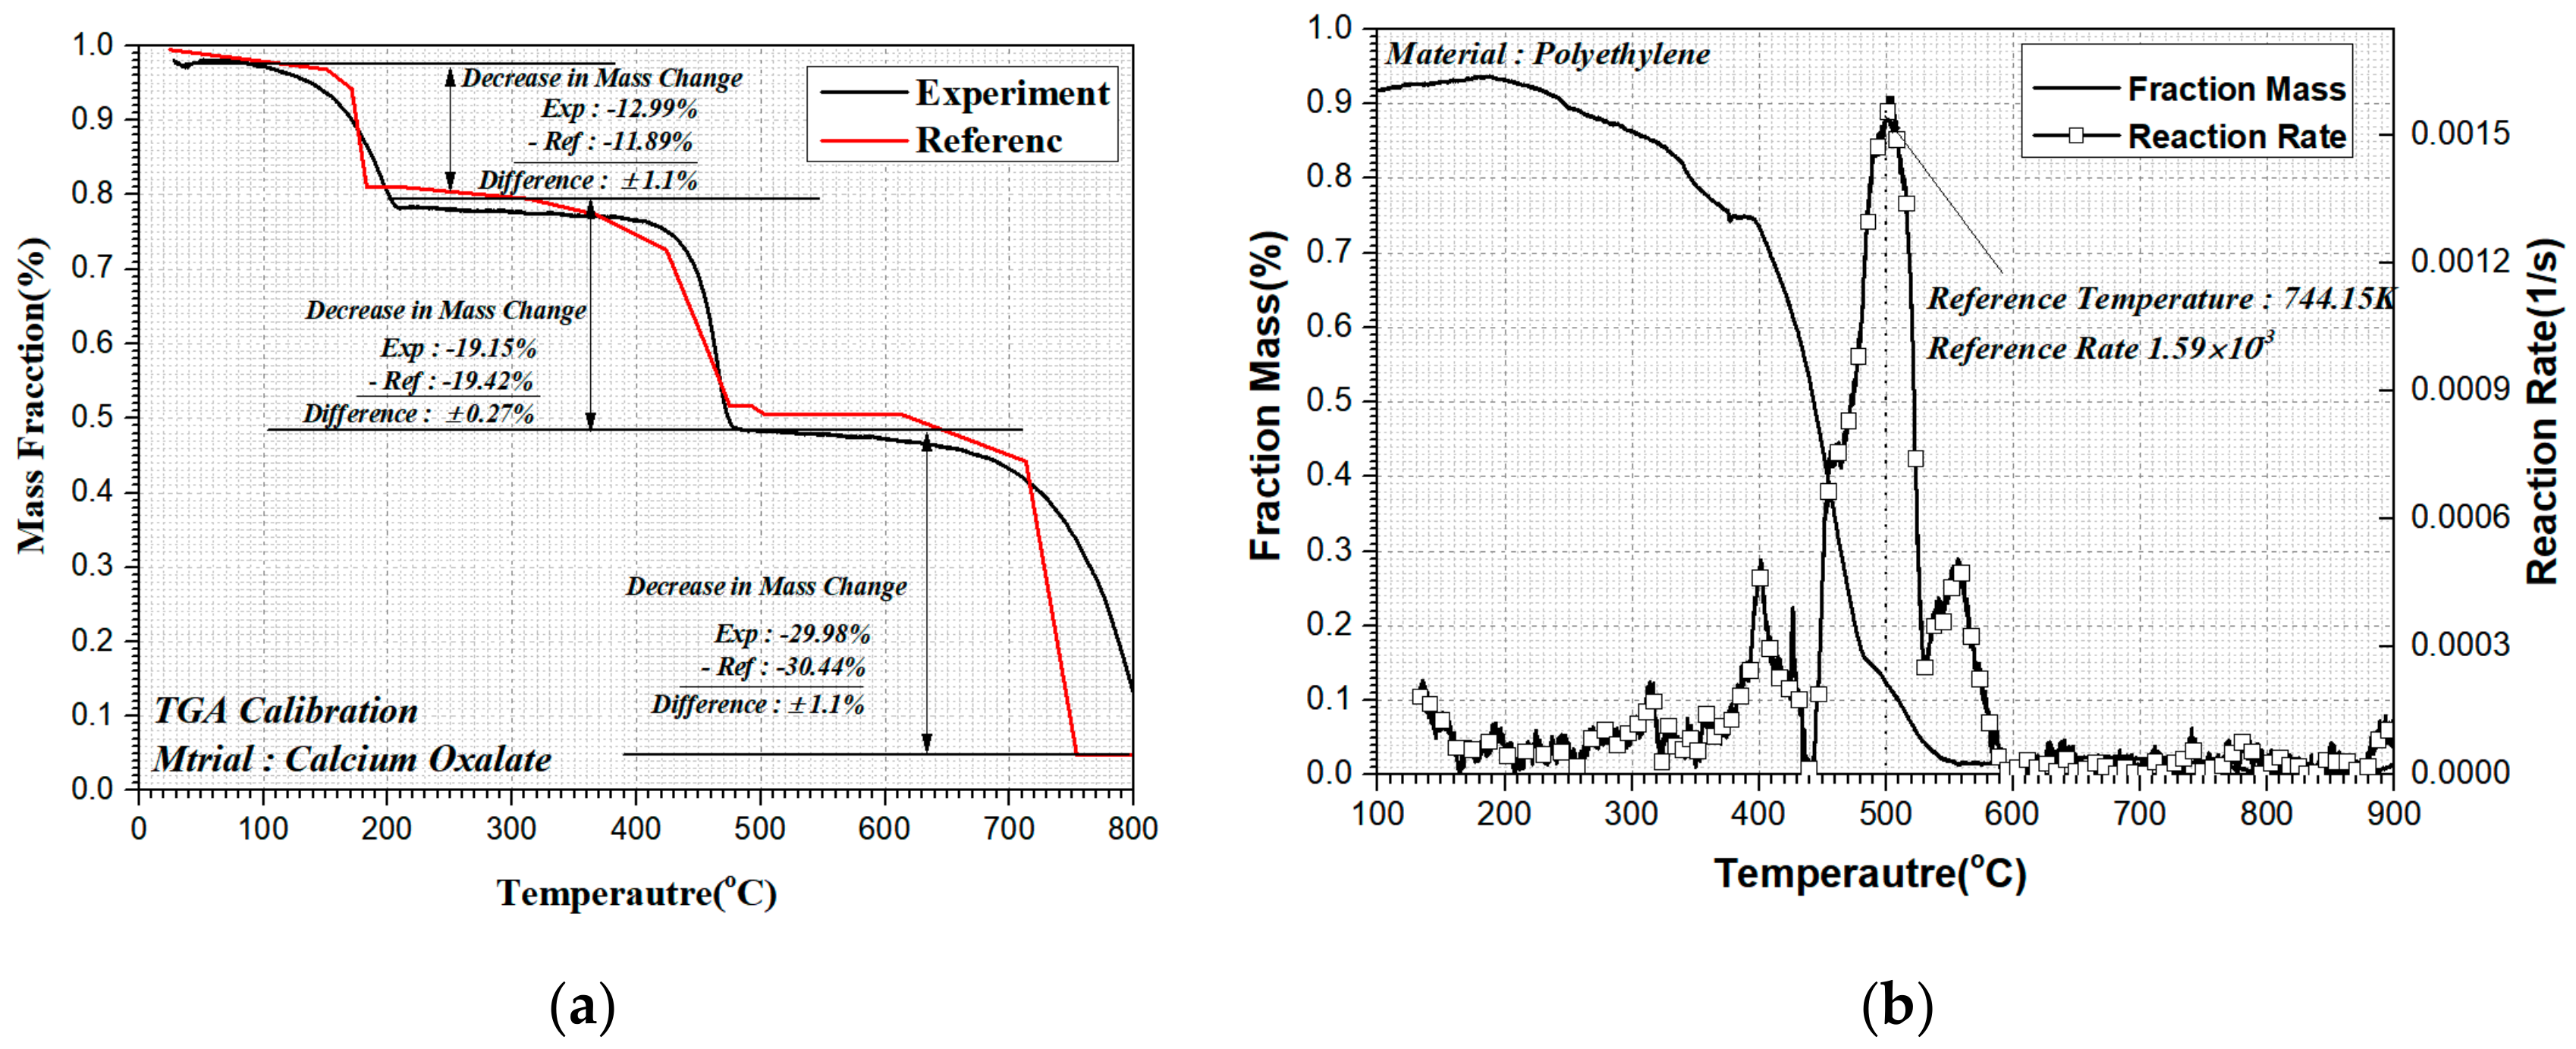
2.4. Material Properties of the Test Sample

Figure 4a shows the measurement of the mass loss rate of the standard specimen calcium oxalate to verify the accuracy of the apparatus of thermo gravimetric analysis (TGA, Model STA PT1000). The calcium oxalate changes in the symmetry of CaC2O4∙H2O, CaC2O4, and CaCO3 as mentioned in reference [31]. Thus, the reference temperature (Tr) was given as 190 °C, 450 °C, and 700 °C at ±30 °C, and the mass reduction rate was measured as −12.99%, −19.15%, and −29.98%, respectively. The measured values were in good agreement within about ±0.6% to the reference values.
Figure 4b shows the result of calculating the reaction rate, pre-exponential factor, and reference temperature, which are the thermochemical properties of the polyethylene foam pipe insulation used in this study. The reaction and the heat rate mechanism of a solid fuel can be found in the combustion theory [32]. From Tr = 744 K, the pre-exponential factor (Aj) of Equation (8) and activation energy (Ej) of Equation (9), which are suggested by Lyon et al. [30,33], are arranged in Table 3.
A j = e r p , j Y s , o e E j R T p , j
E j = e r p , j Y s , o R T p , j 2 ( d T / d t )
where Aj, Ej, Tr, and Ys,o means the pre-exponential factor, activation energy, reference temperature, and mass fraction, respectively [33].

3. Results and Discussion

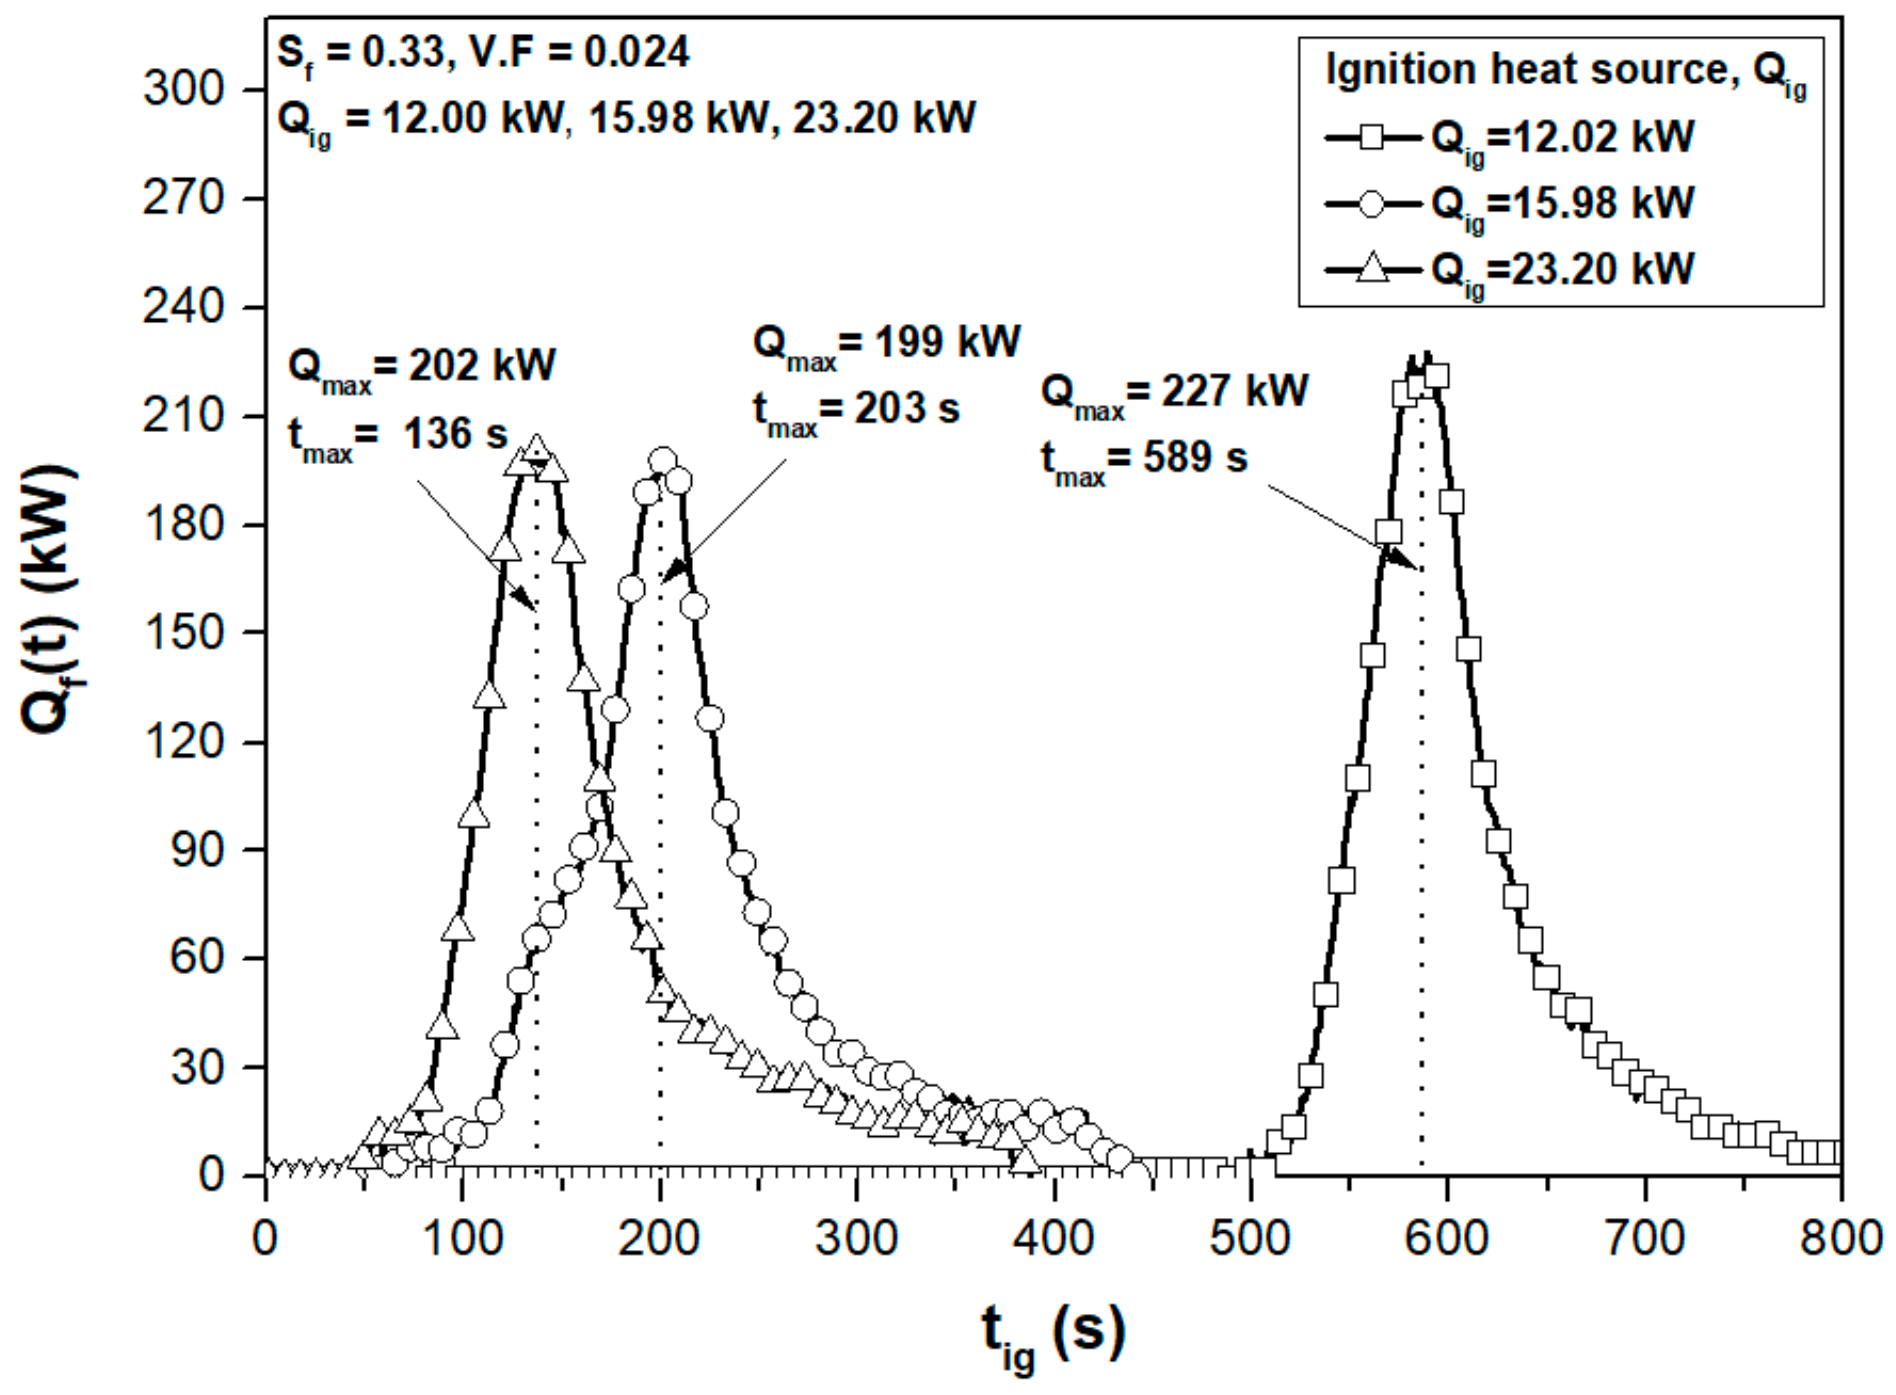
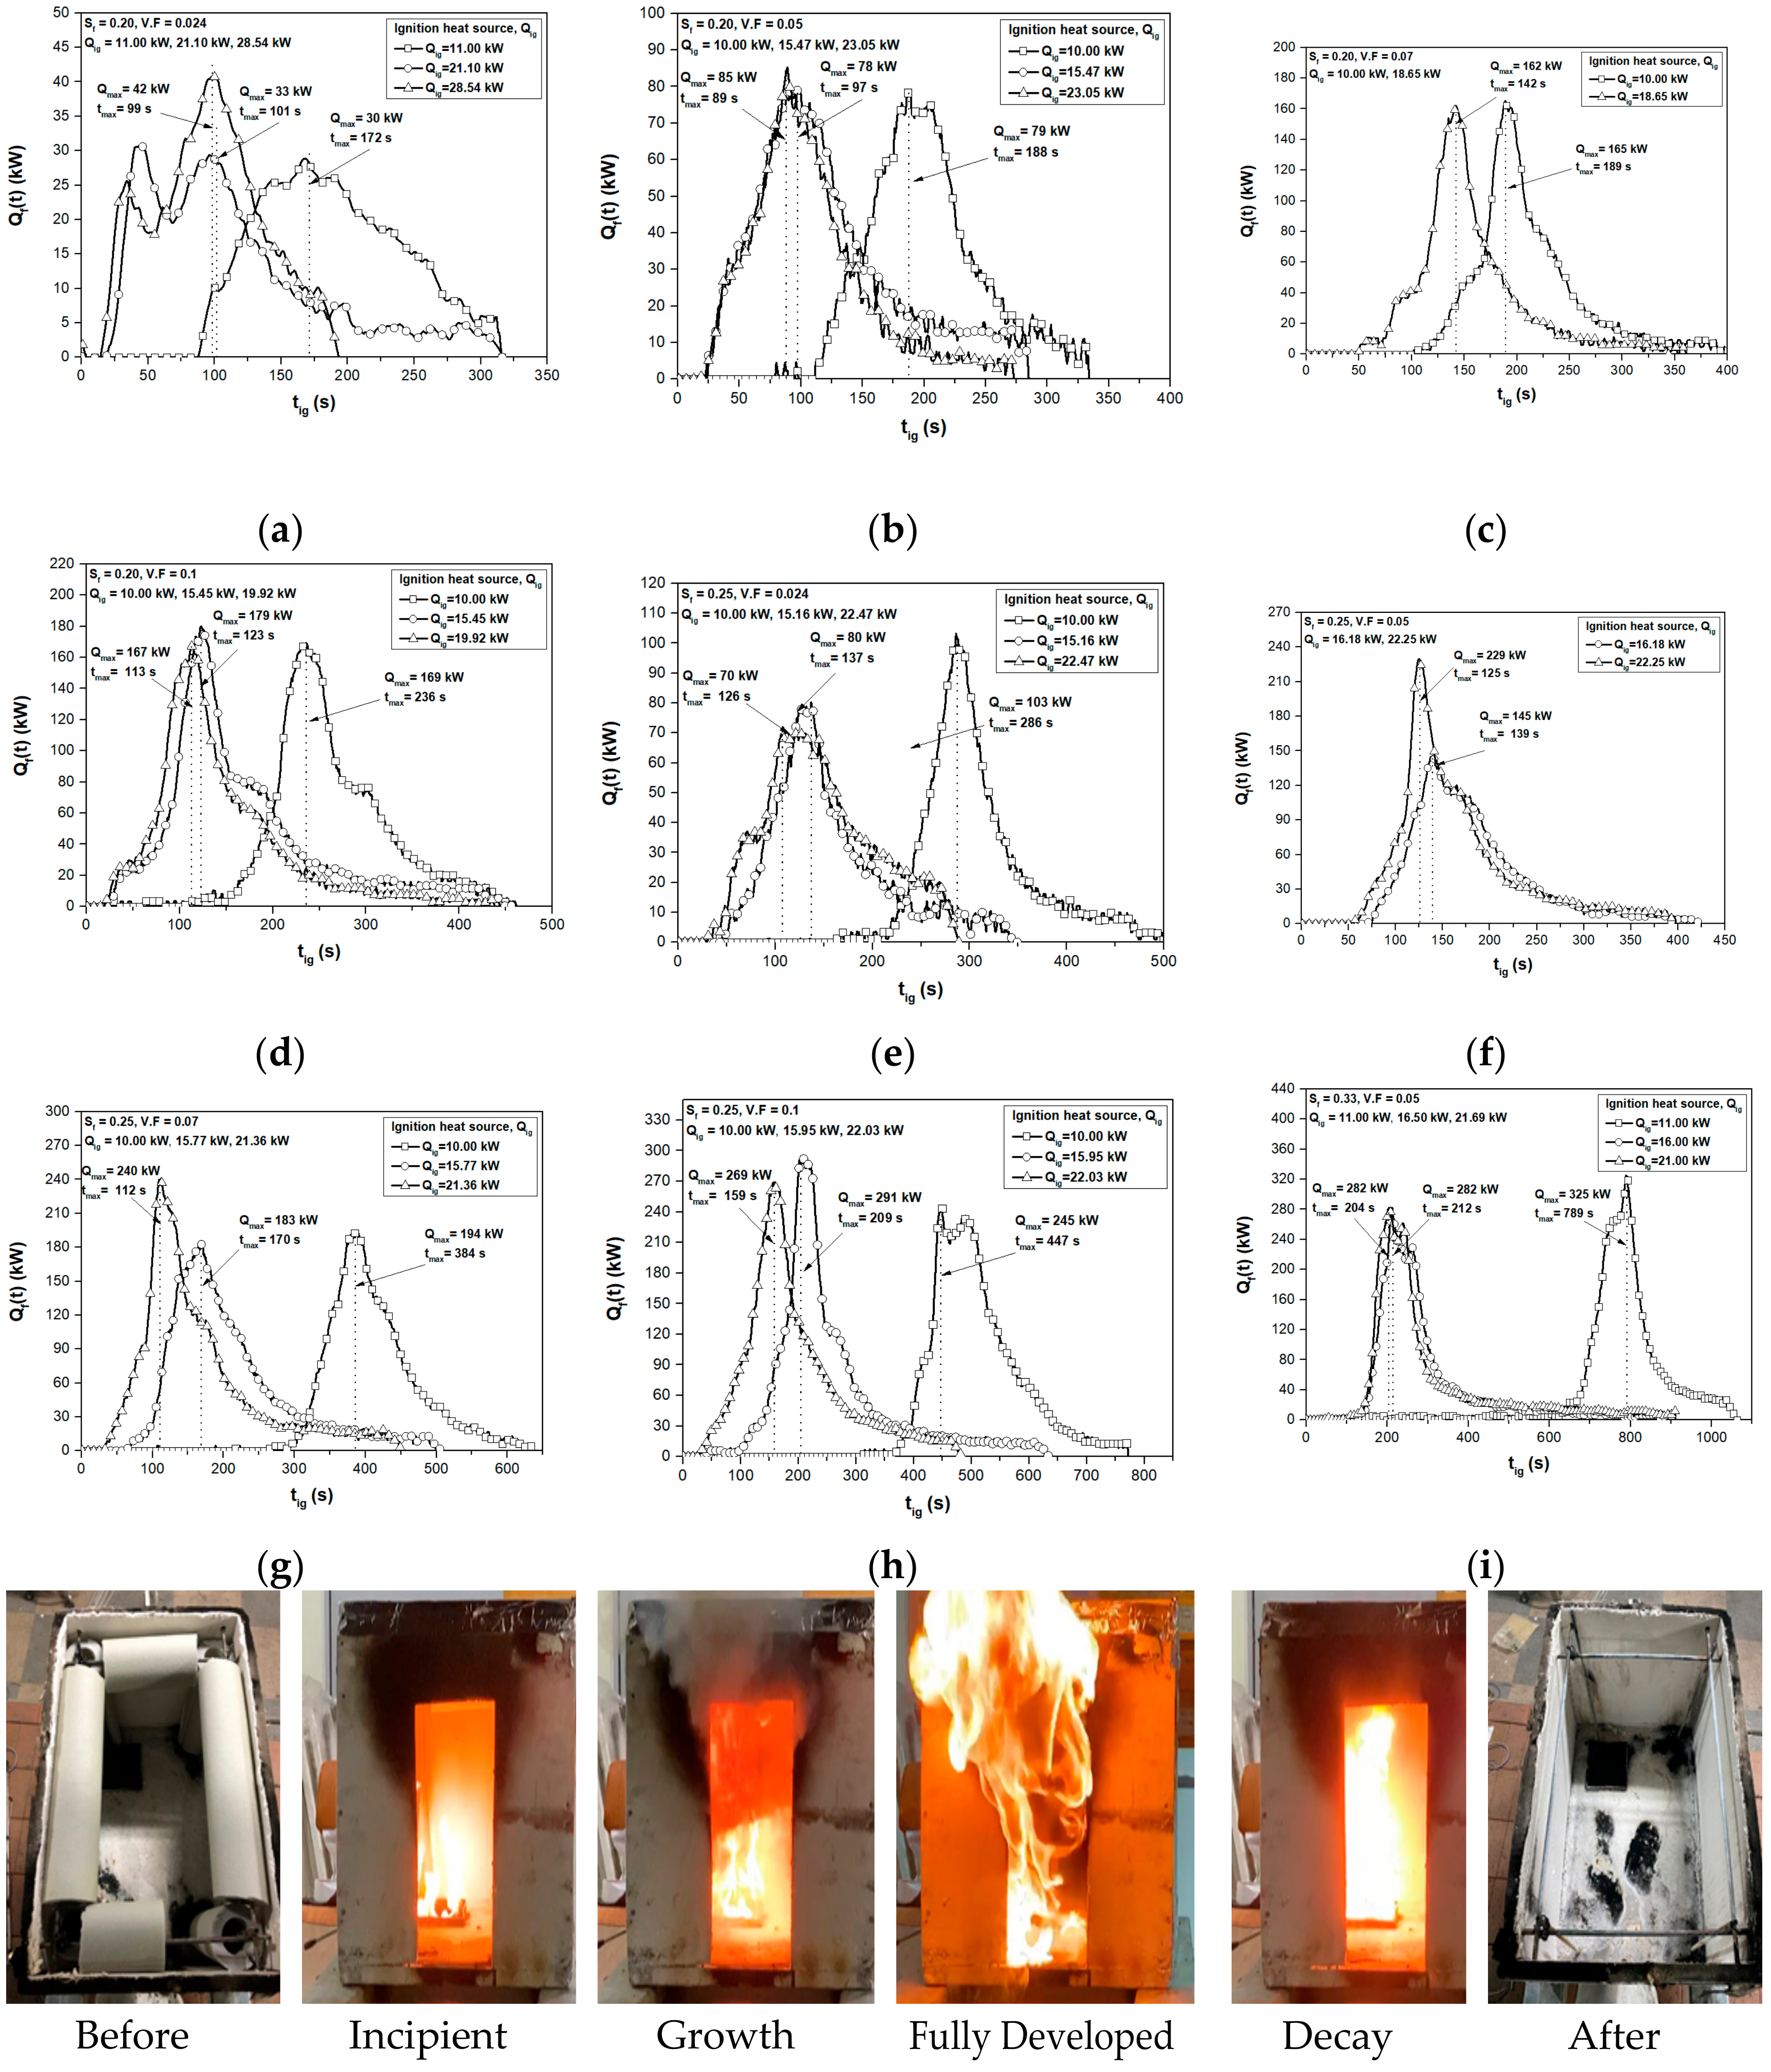
3.1. Experiment of Heat Release Rate

The effects of the ignition heat source on the heat release rate in the case of the fixed values of the scale factor (Sf = 1/3) and the volume fraction (VF = 0.024) are plotted in Figure 5. As denoted in this figure, the values of tmax were decreased as 589 s, 203 s, and 136 s in accordance with Qig = 12 kW, 16 kW, and 23 kW, respectively. While Qmax maintained a constant value at approximately 209 ± 10 kW. The results explained that the time for the pipe insulation to reach the reference temperature (Tr) of 744 K decreased as Qig increased. However, the values of Qmax maintained a constant value since the overall heat amount of the pipe insulation inside the compartment should be conserved. All results for Sf = 1/3, 1/4, and 1/5 and VF = 0.024, 0.05, 0.07, and 0.1 in accordance with the ignition heat sources are plotted in Figure 6. Test conditions and analysis based on the Figure 6 are summarized in Table 4. As shown in Table 4, tmax of Test #8, #16, and #31–#33, which have more than 20% deviation, were excluded due to the environment differences. However, in all the experimental result, the values of Qmax maintained a constant value within the range of ±3.48% average and ±12.26% maximum for the fixed volume fraction (VF), while the values of tmax were decreased, which were inversely proportional to the heat amount of ignition. From the results of Figure 6 and Table 4, the effective heat of combustion was investigated and Qmax and tmax were predicted with the effects of Sf, VF, and Qig.

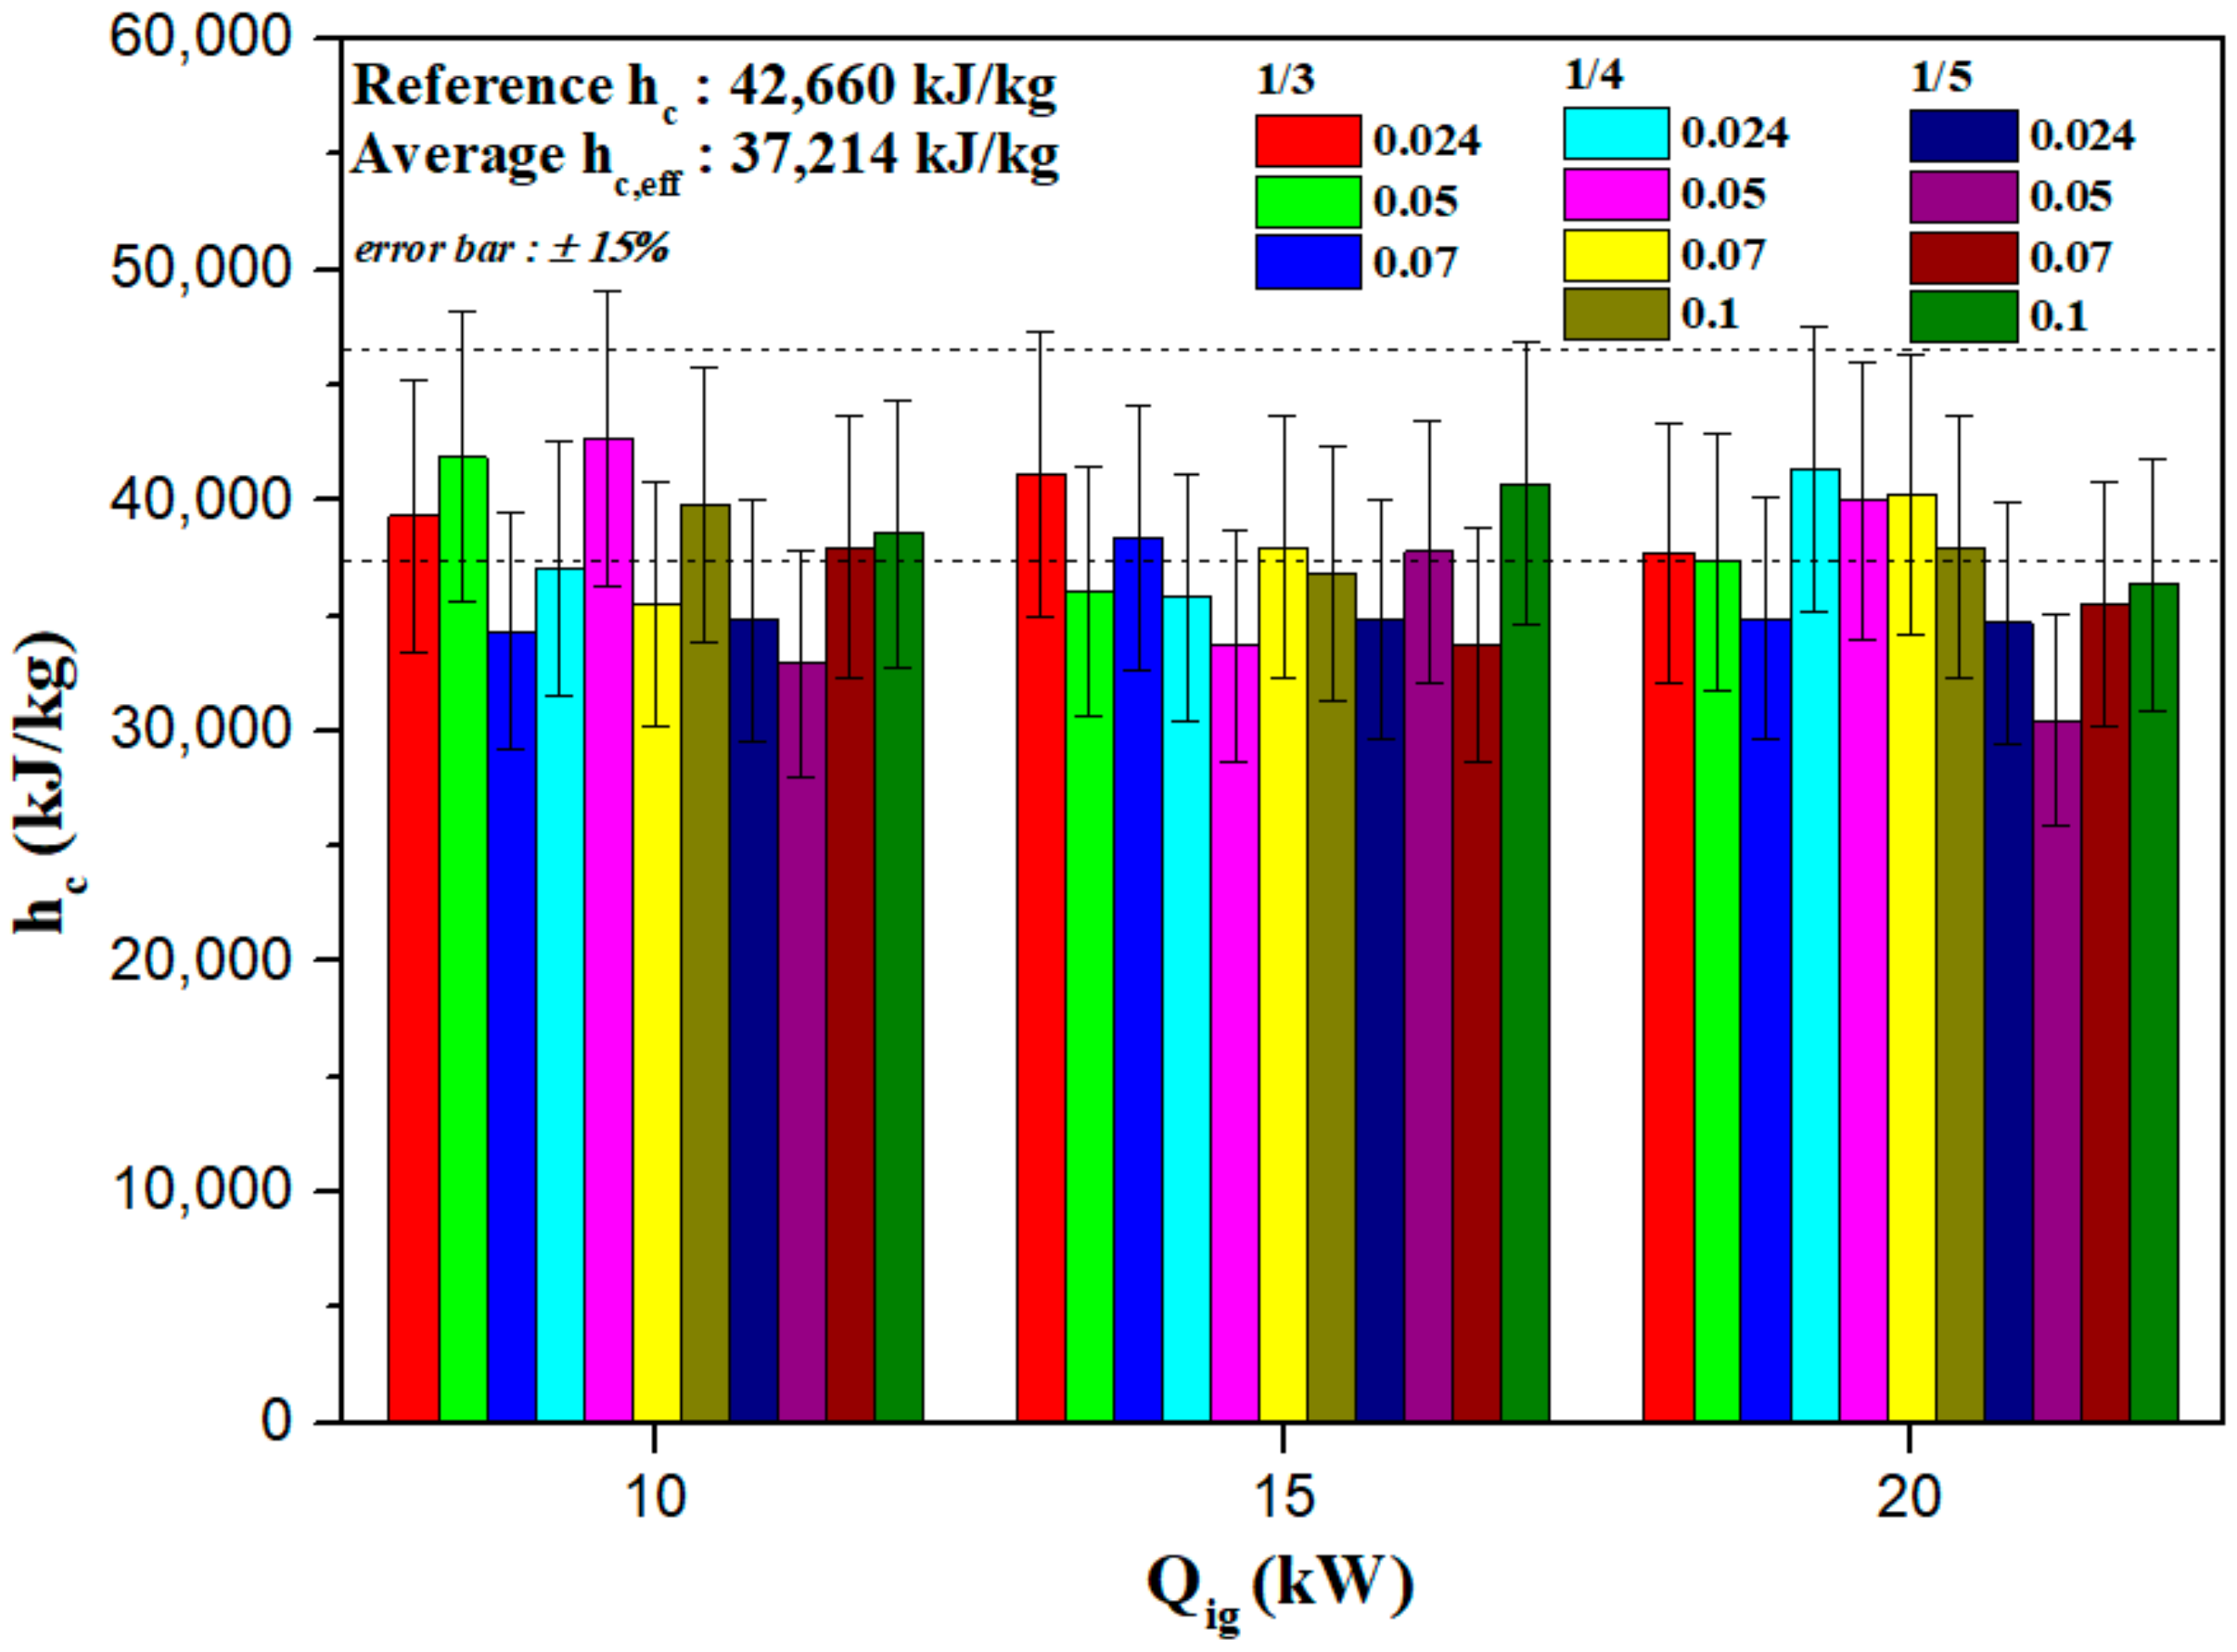
3.2. Comparison of the Effective Heat of Combustion, Δhc,eff

Regarding the previous studies, the heat of combustion (Δhc) of the polyethylene foam pipe insulation is around 42,660 kJ/g [34]. In this study, the effective heat of combustion of Equation (10) as referred in [35] was compared with the heat of combustion by integrals on the combustion time under the measured heat release rate.
h c , e f f = t = 0 t = t f i n a l Q f ( t ) d t / Δ m f
where Δhc,eff and Δmf are the effective heat of combustion and the mass loss of the pipe insulation after combustion, respectively. The measured effective heat of combustion for Sf = 1/3, 1/4, and 1/5, VF = 0.024, 0.05, 0.07, and 0.1 in accordance with the values of Qig are plotted in Figure 7. As shown in the figure, the average values of the effective heat of combustion was around 37,214 kJ/kg, which was only about 87% of the combustion efficiency compared to 42,660 kJ/kg. The main reason can be found that the incomplete combustion condition occurs due to the circumstance lack of ventilation regarding to the size of the opening area [34,35,36,37]. In addition, from R. N. Walters et al. [34], the combustion heat value could be changed by the composition ratio and the porosity of the molecule consisted of materials. Therefore, the correlation between the geometric shape of the pipe insulation and the thermochemical properties of the molecular structure of the pipe insulation should be analyzed with the combustion efficiency to obtain more accuracy reasons. However, the main purpose of this study was to predict the fire growth rate index related with the scale factor (Sf), the volume fraction (VF), and the ignition heat source (Qig). Therefore, Qmax and tmax were analyzed with the effective heat of combustion assumed to be the averaged value of 37,214 kJ/kg.

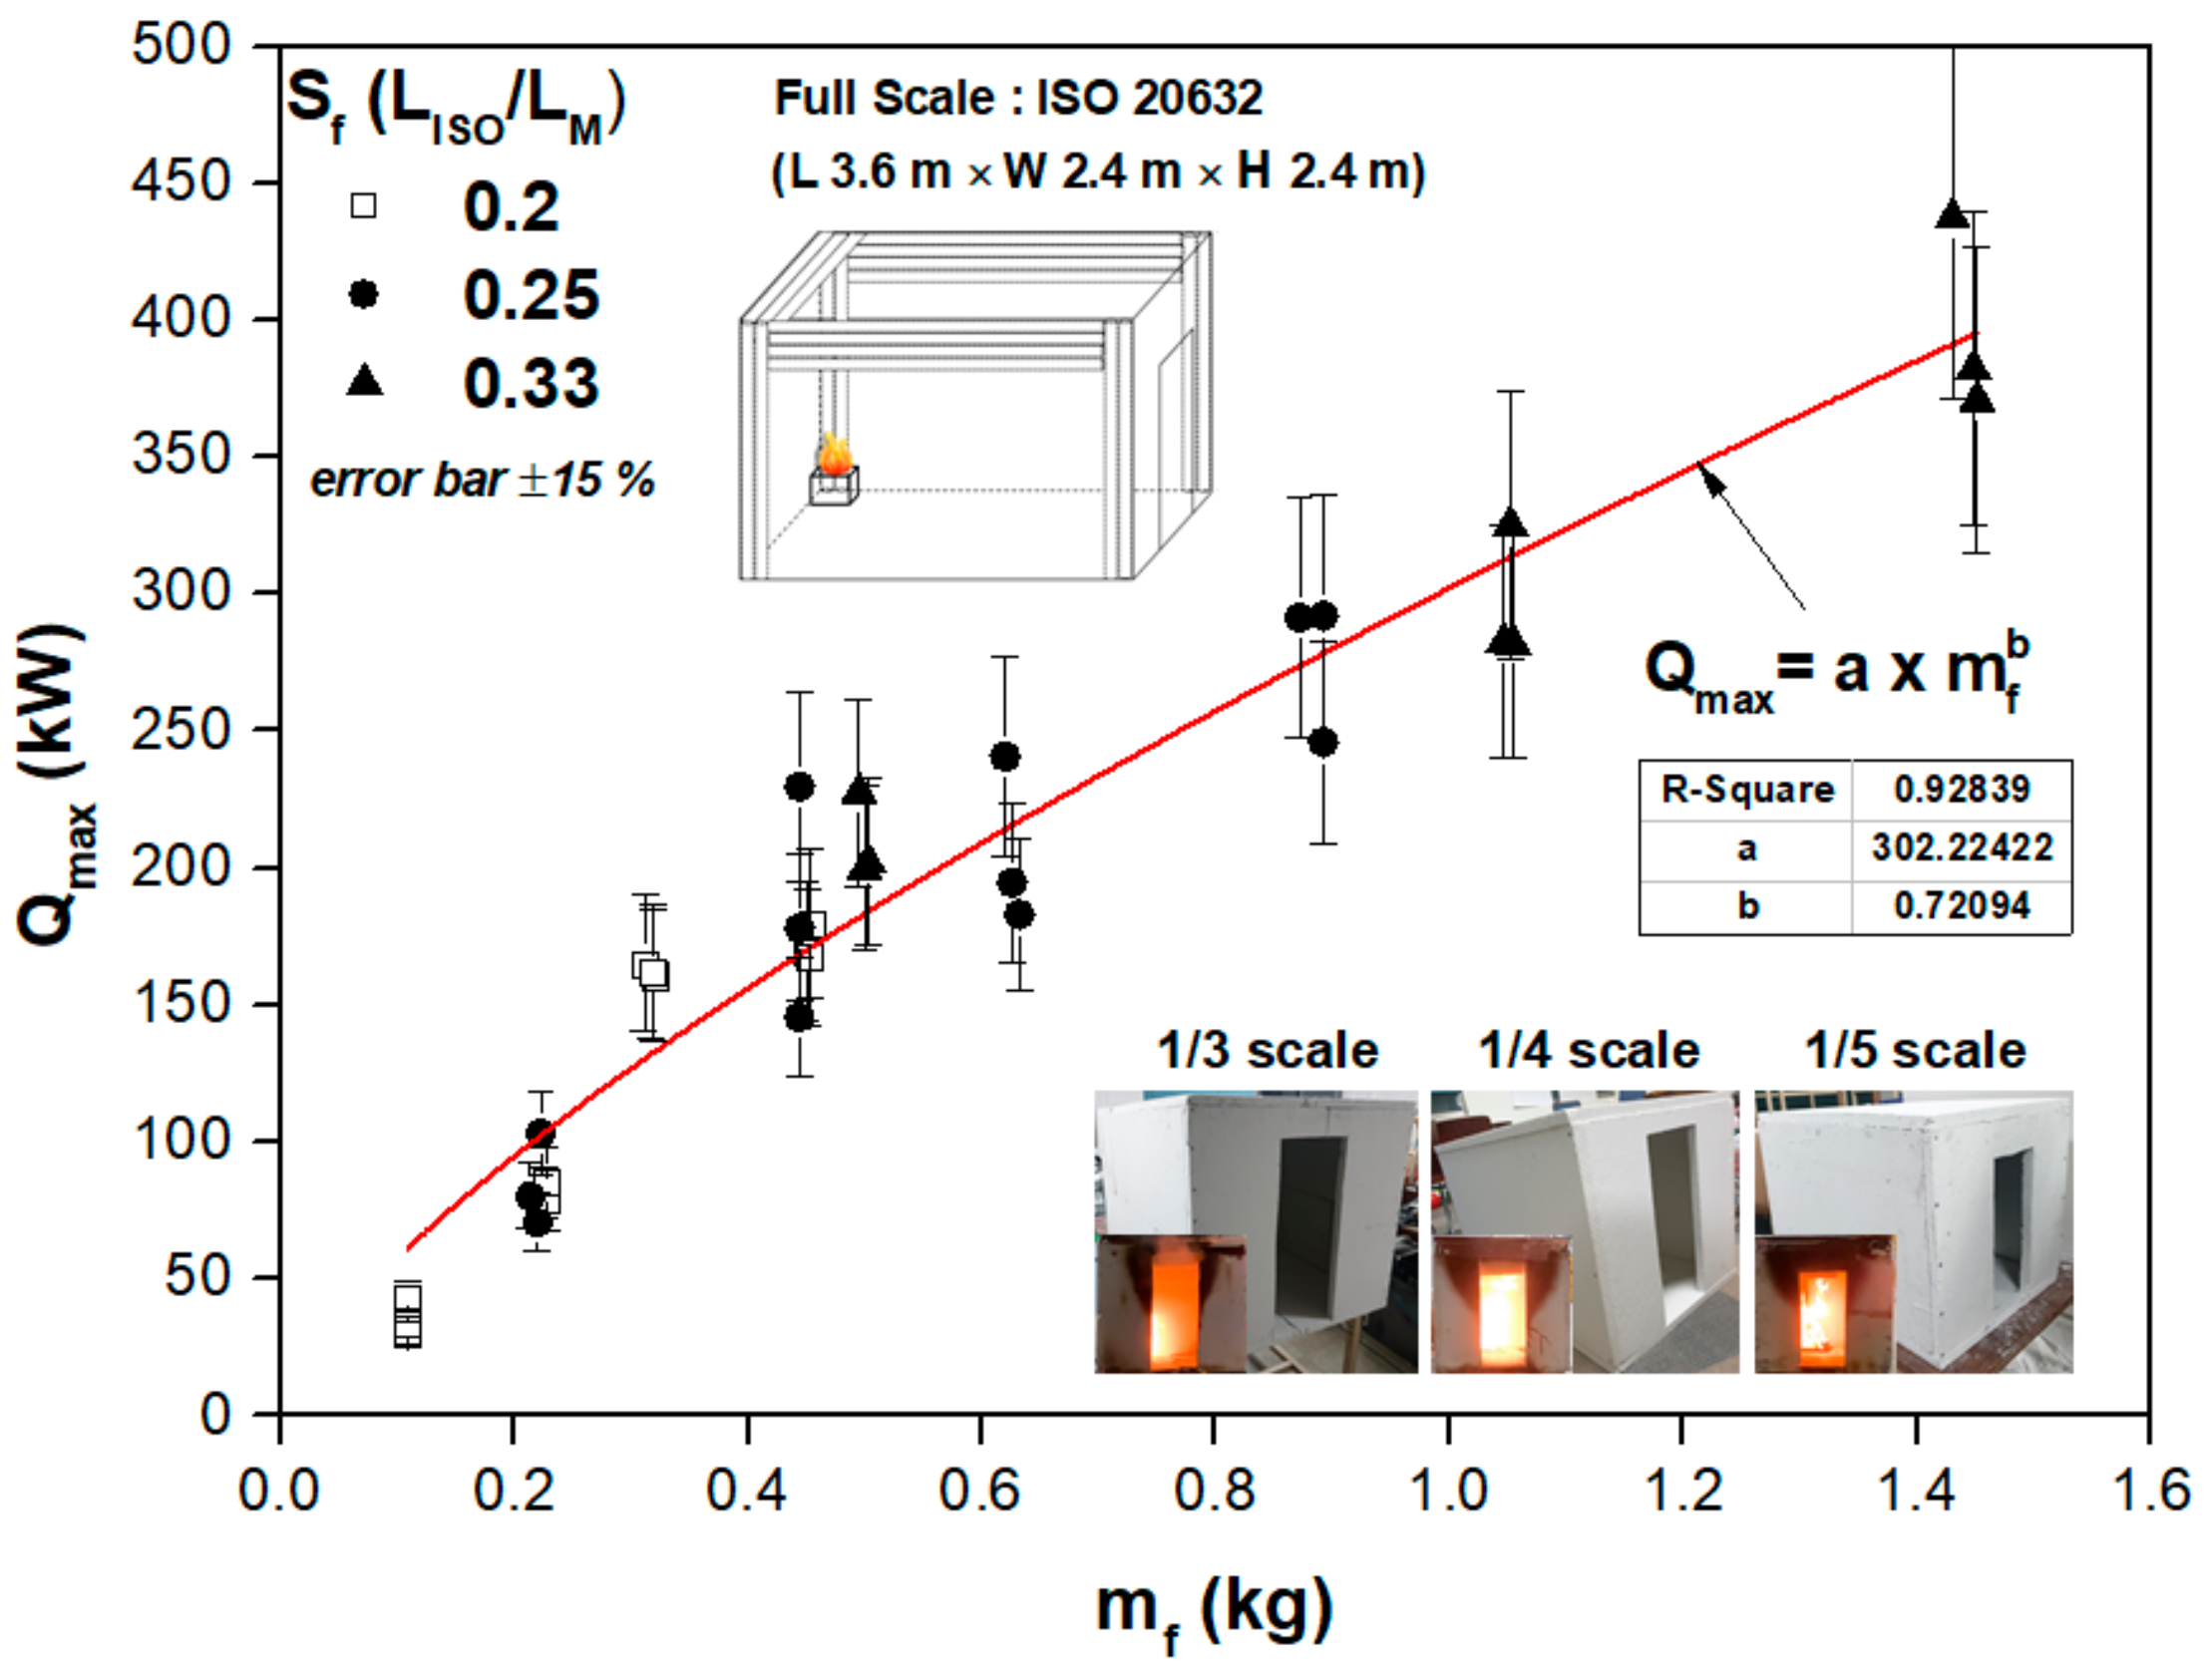
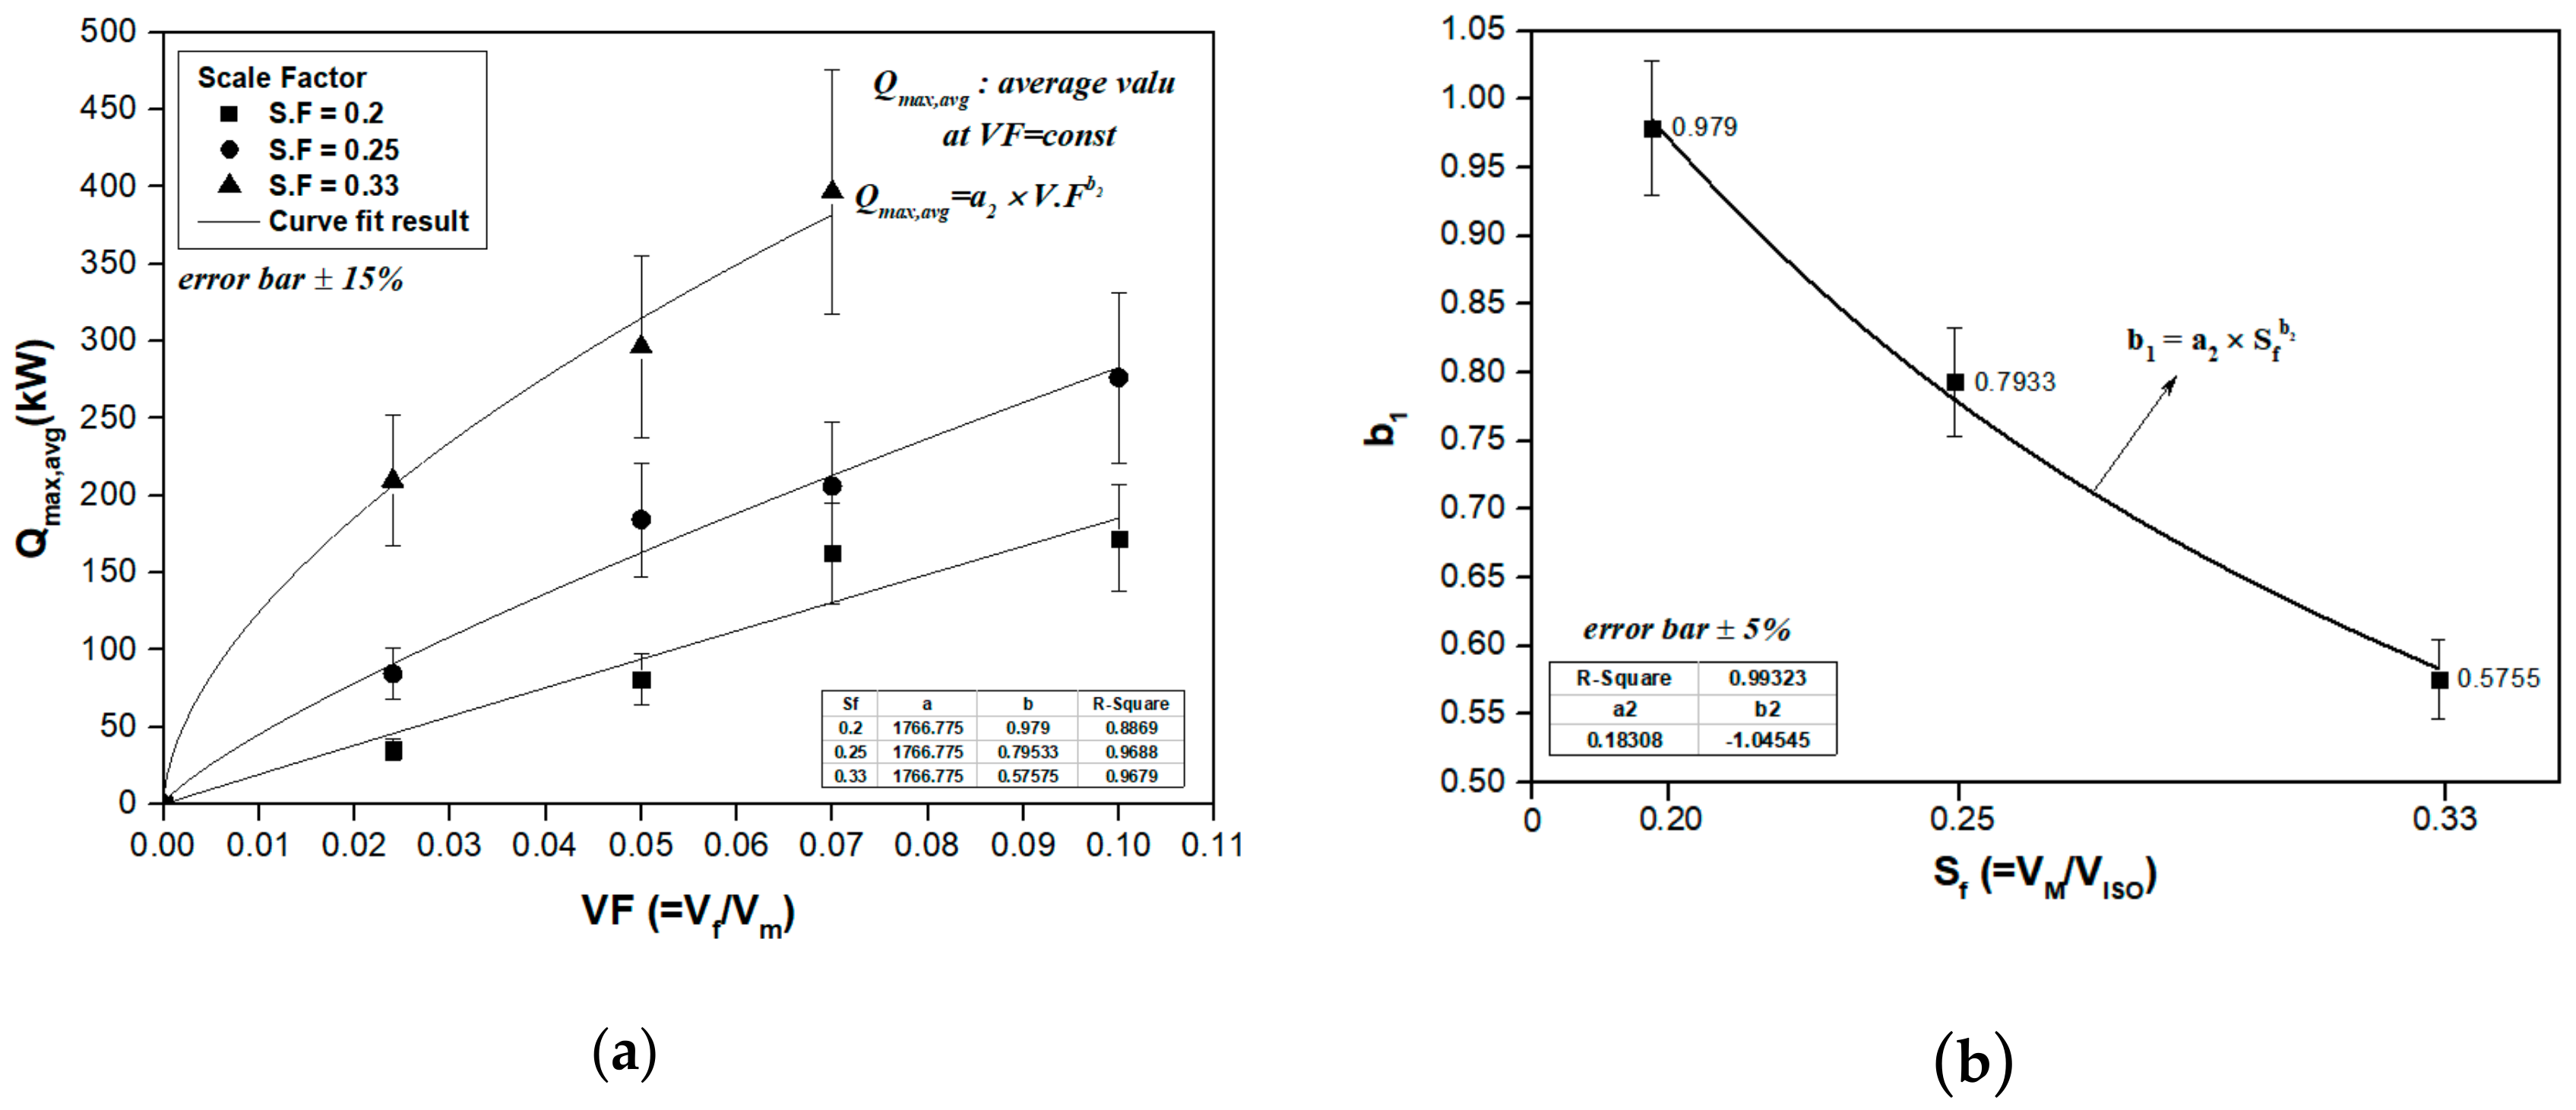
3.3. Analysis of the Maximum Heat Release Rate, Qmax

The values of Qmax and Δmf for Sf = 1/3, 1/4, and 1/5 and VF = 0.024, 0.05, 0.07, and 0.1 in Table 4 are plotted in Figure 8. The line marked in red can be obtain from the boundary condition, which is Qmax = 0 at Δmf = 0, as shown in the Equation (11).
Q max = a 1 × Δ m f b 1
The Δmf can be assumed that the initial mass of the pipe insulation since all completely burned during the experiments for each condition in Table 4. The simple expression foam of Qmax can be curve-fitted with Δmf, regardless of Sf, VF, and Qig in the case of a1 = 302.224 and b1 = 0.721 within ±15%. However, in the overall range of Δmf, the deviations between Equation (11) and the experiments were higher in accordance with the volume of compartment and the pipe insulation. Thus, the effects of Sf and VF on Qmax were investigated to obtain more accurate prediction.
Figure 9a shows the correlations between Qmax and VF for Sf = 1/3, 1/4, and 1/5. As shown in the figure, Qmax intends to increase in proportional to VF as denoted in Equation (12).
Q max , p r e = a 2 ( V F ) b 2
where Qmax,pre (kW), a2(kW), and b2 are the predictive value of the maximum heat release rate and the experimental constants, respectively. The mass loss is approximated in Equation (13).
Δ m f = V F × V M × ρ f
when a 2 is constant at 1766.78 of Equation (12), b 2 decreases with Sf as shown in Figure 9b. Thus, the experiment constant, b 2 can be curve-fitted as,
b 2 = 0.18308 × S f 1.04545
The predictions of Qmax and Δmf for the fixed values of the scale factor (Sf = 1/3, 1/4, and 1/5) and the volume fraction (VF = 0.024, 0.05, 0.07, and 0.1) were compared with the experiments as shown in Figure 10. The predictions at Δmf = 0.2 kg and 0.7 kg were higher about 15% than the experiments for Test #14, #15, and #18 in Table 4 due to the relatively high deviation of the averaged Qmax. On the other hand, the predictions at Δmf = 0.2 kg were about 15% lower than the experiments for Test#7 and #9 in Table 4. The main reason would be expected to take place from the combustion efficiency in accordance with the opening area [20]. However, it is confirmed that the total of 27 experiments and the predicted values were in good agreement within ±5%. Thus, Equation (12) indicates that the improved accuracy approximately 10% or more compared to Equation (11) since Sf and VF were considered. The limitation of the prediction should consider the experiment constants. The prediction of Qmax can be applicable in the case of establishing the database of various types of insulation.

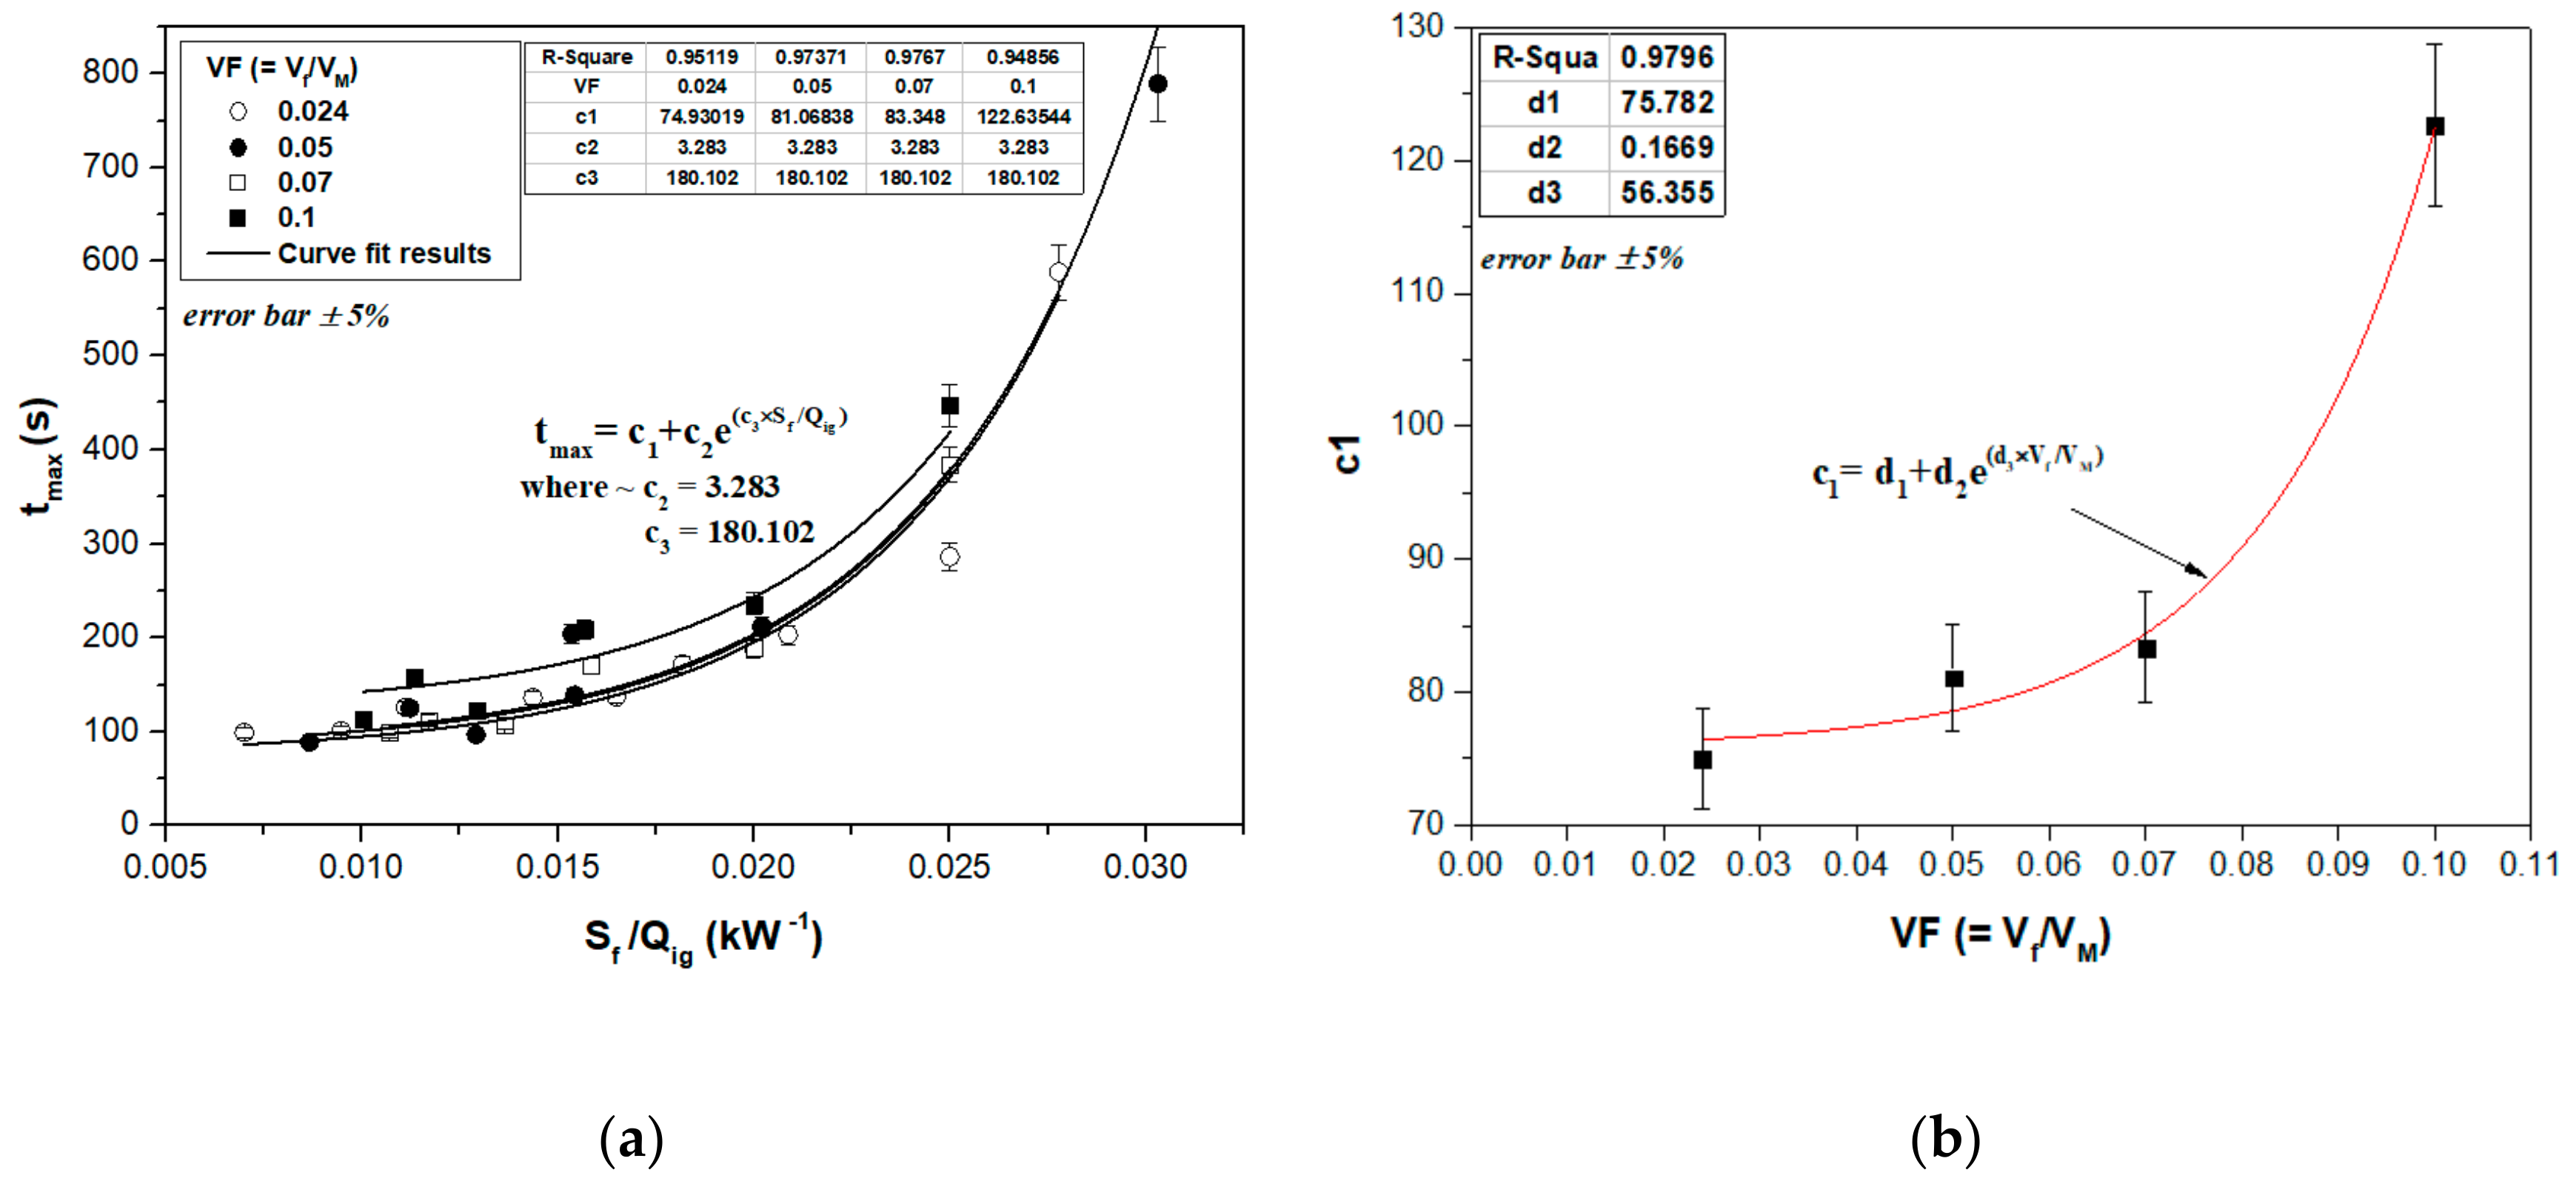
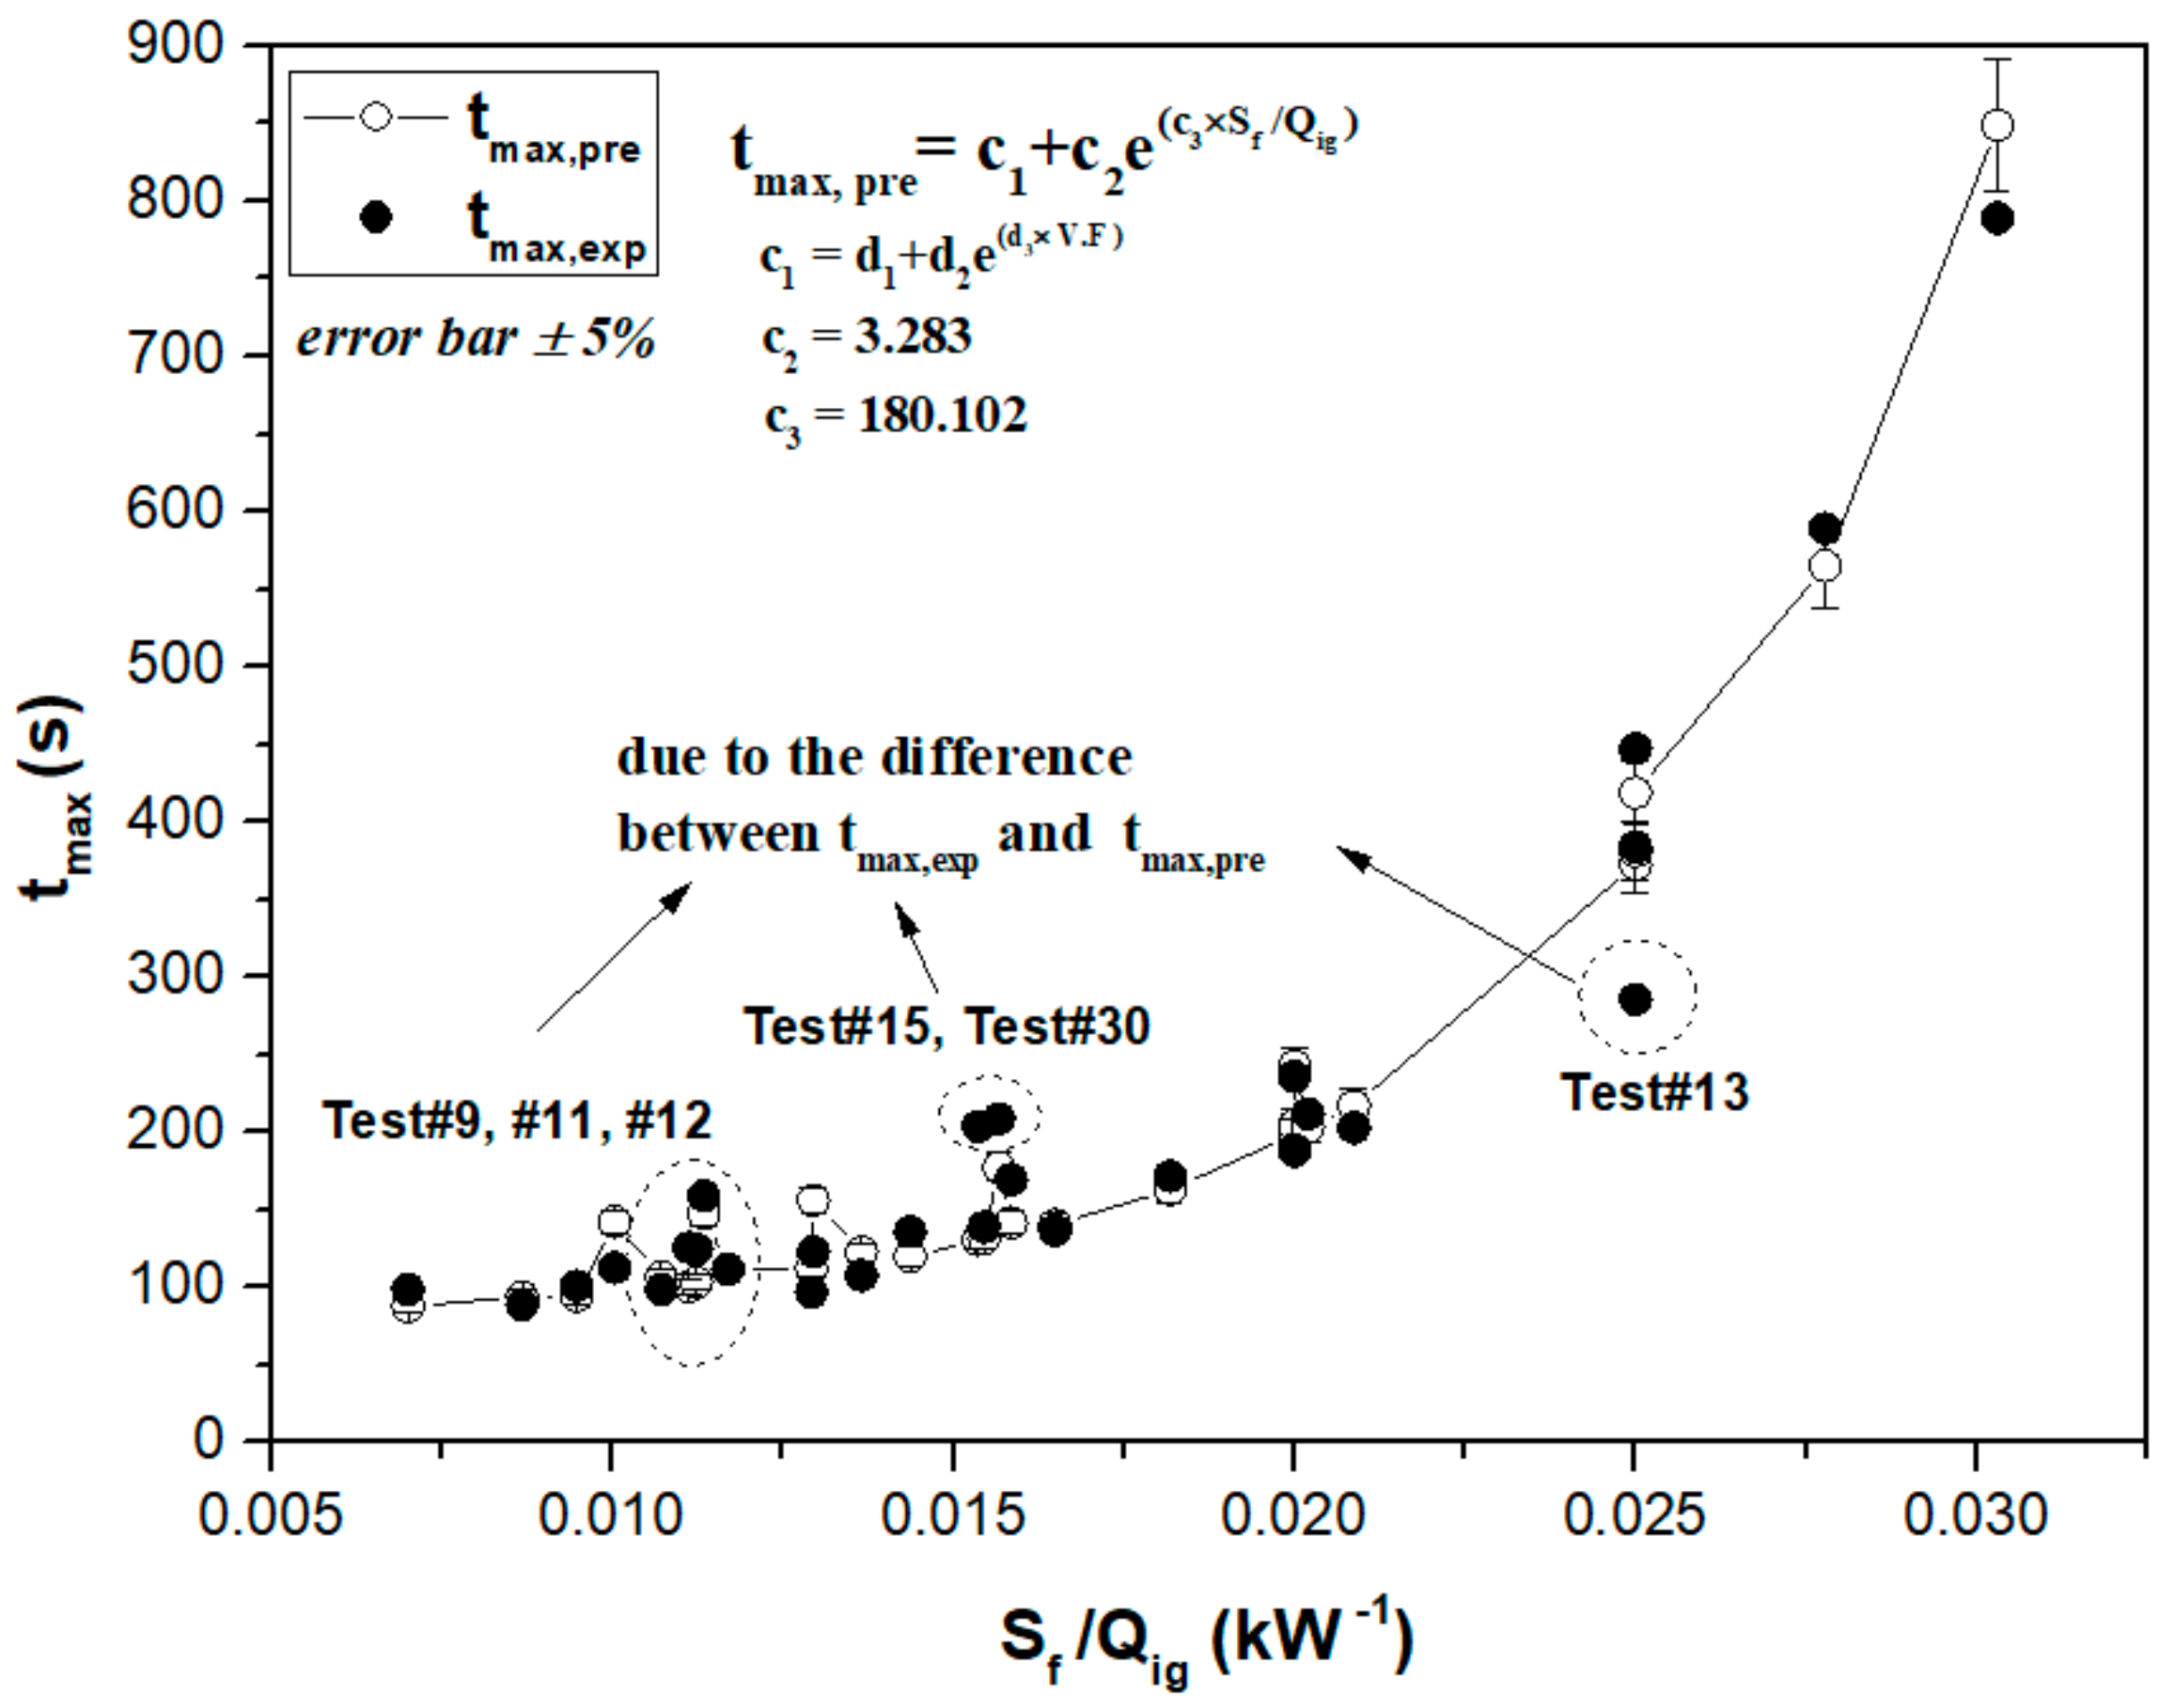
3.4. Analysis of the Time to Reach the Maximum Heat Release Rate, tmax

From the results in Table 2, as the volume of the compartment increased, the heating time of the surface temperature for the pipe insulation by convection and radiation was proportionally increased in the case of the fixed values of Qig and VF. In addition, when Qig increased, tmax was decreased since the surface area of the pipe insulation to reach reference temperature (Tr) rapidly increased. These relations can be functioned as,
t max ~ f ( S f / Q i g )
Figure 11a shows the relations between Sf/Qig and tmax in the case of VF = 0.024, 0.05, 0.07, and 0.1. The values of tmax, which was inversely proportional to Qig and proportional to Sf under the fixed value of VF, can be curve-fitted as,
t max , p r e = c 1 + c 2 × e ( c 3 × S f / Q i g )
where c1, c2, and c3 represent the experimental constants for the polyethylene foam pipe insulation. The values of c2 and c3 were found to have the constant with 3.283 and 180.102. In addition, the values of the experimental constant c1 were 74.93, 81.07, 83.35, and 122.64 when VF = 0.024, 0.05, 0.07, and 0.1 respectively, as shown in Figure 11b. Thus, it can be curve fitted as,
c 1 = d 1 + d 2 × e ( d 3 × V F )
where d1, d2, and d3 have a constant value of 75.782, 0.167, and 56.36, respectively.
The predictions of tmax and Sf/Qig for the fixed values of the scale factor (Sf = 1/3, 1/4, and 1/5) and the volume fraction (VF = 0.024, 0.05, 0.07, and 0.1) were compared with the experiments as shown in Figure 12. The predictions at Sf/Qig = 0.01, 0.015, and 0.024 kW−1 were about 20% deviation than the experiments for Test #5, #6, #11, #12, #13, #15, and #30 in Table 4 due to the heat loss by the leakage from the connection part in the compartment, the difference humidity or the relatively low surrounding temperature. The heat loss can cause the experiments of tmax that could be relatively delayed than the predictions of tmax. However, the total 23 of predictions were in good agreement with the experiments in the error range of ±5%. Therefore, as mentioned in Section 3.3, tmax can be applicable in the case of establishing the database of various types of insulation. As denoted in Equations (12) and (16), the predictions of Qmax and tmax were significantly correlated with Sf, VF, and Qig, which were the test conditions of fire resistance standard. It is noticeable that the values of FIGRA can be obtained without experiments for the polyethylene foam pipe insulation if the effects of the thermal properties of the compartment materials are determined.

3.5. Estimation of the Fire Growth Rate Index, FIGRA

According to EN13501-1, the fire-retardant grade can be divided as Grade A2 for FIGRA ≤ 0.16 kW/s, Grade B for 0.16 ≤ FIGRA ≤ 0.6 kW/s, Grade C for 0.6 ≤ FIGRA ≤ 1.5 kW/s, the Grade D for 0.6 ≤ FIGRA ≤ 7.5 kW/s, and Grade E for FIGRA ≥ 7.5 kW/s. Therefore, Equations (12) and (16) are substituted into Equation (5), and the prediction of FIGRA can be arranged as,
F I G R A p r e = a 2 ( V F ) b 2 c 1 + c 2 × e ( c 3 × S f / Q i g )
where FIGRApre means the prediction value of the fire growth rate index (FIGRA) considering the scale factor (Sf), the volume ratio (VF), and the ignition heat source (Qig).
Figure 13 shows the results of the comparisons between the predictions by Equation (18) and the experiments in Table 4. The predictions of Qmax for Test #15, #20, and #30 in Table 4 were about 11% higher than the experiments, while the predictions of tmax were about 16% lower than the experiments at FIGRA = 0.975 kW/s, 1.58 kW/s, and 2.40 kW/s. On the other hand, the predictions of Qmax for Test #7 and #8 in Table 4 were about 19% lower than the experiments, while the predictions of tmax were about 10% lower than the experiments at FIGRA = 0.63 kW/s and 1.05 kW/s. These results caused more than a 30% deviation of FIGRApre and FIGRA. It would be necessary to investigate the combustion efficiency and the surrounding temperature with environmental conditions to improve more accurate predictions. However, the final results shows that a total of 22 of the predictions were in good agreement with the experiments within ±15% since the predicted values of Qmax and tmax were satisfied with the experiments on the effects of Sf, VF, and Qig within ±5%. Especially, in the case of application of FIGRA of EN 13501-1, the polyethylene foam pipe insulation could have Grade B, C, or D in accordance with Sf, VF, and Qig.

4. Conclusions

In this study, the effects of the scale factor (Sf), the volume fraction (VF), and the ignition heat source (Qig) on the fire growth rate index (FIGRA) of polyethylene foam pipe insulation were systematically investigated. From the 33 experiments of the heat release rate of the pipe insulation, the maximum heat release rate (Qmax), and the time (tmax) to reach the maximum heat release rate were analyzed with the effective heat of combustion assumed to be the averaged value of 37,214 kJ/kg. The results of this study can be summarized as follows,
First, the values of Qmax maintained a constant value within the range of ±3.48% average and ±12.26% maximum regardless of Qig when the value of VF was fixed. While tmax decreased, which was inversely proportional to Qig. These results explain that the heat amount of the pipe insulation should be conserved regardless of the ignition.
Second, the correlations between the values of Qmax and tmax in accordance with the variation of the scale factor (Sf = 1/3, 1/4, and 1/5), the volume fraction (VF = 0.024, 0.05. 0.07, and 0.1), and the ignition heat source (Qig = 10 kW, 15 kW, and 20 kW) were presented. It is possible to quantify that Qmax intended to increase in proportional to VF and Sf regardless of Qig while tmax increased in proportion to Sf/Qig and VF. However, the limitation of the predictions was that the experiment coefficients should be determined with the thermal properties of the wall and the type of the pipe insulation.
Finally, FIGRA as defined in EN 13501-1 was evaluated using the prediction models of the Qmax and tmax. It was verified that a total of 22 experiments in Table 4 were in good agreement with the predictive values of FIGRA within ±15%. Especially, the fire-retardant grade for the polyethylene foam pipe insulation could have a Grade B, C, and D in accordance with the scale factor (Sf = 1/3, 1/4, and 1/5), volume fraction (VF = 0.024, 0.05, 0.07, and 0.1), and the ignition heat sources (Qig). Therefore, in case of establishing the database of various types of insulation, it can be expected that the prediction models could apply to evaluate the fire-retardant performance with dimensionless methods for FIGRA.

Author Contributions

Conceptualization, J.W.P., O.K.L. and W.J.Y.; methodology, W.J.Y.; software, J.W.P.; validation, J.W.P. and W.J.Y.; formal analysis, W.J.Y.; investigation, J.W.P., O.K.L.; resources, W.J.Y.; data curation, W.J.Y.; writing—original draft preparation, W.J.Y.; writing—review and editing, W.J.Y.; visualization, J.W.P.; supervision, J.W.P., O.K.L.; project administration, W.J.Y.; funding acquisition, W.J.Y. All authors have read and agreed to the published version of the manuscript. Please turn to the CRediT taxonomy for the term explanation. Authorship must be limited to those who have contributed substantially to the work reported.

Funding

This research was supported by the Field-oriented Support of Fire Fighting Technology Research and Development Program funded by the Ministry of Public Safety and Security (2018-NFA002-008-01020000-2019).

Acknowledgments

This research was funded by the National Fire Agency (Republic of Korea), grant number 2018-NFA002-008-01020000-2019.

Conflicts of Interest

The authors declare no conflict of interest. The funders had no role in the design of the study; in the collection, analyses, or interpretation of data; in the writing of the manuscript, or in the decision to publish the results.

References

  1. Kecebas, A. Determination of insulation thickness by means of exergy analysis in pipe insulation. Energy Convers. Manag. 2012, 58, 76–83. [Google Scholar] [CrossRef]
  2. Kayfeci, M.; Yabanova, I.; Kecebas, A. The use of artificial neural network to evaluate insulation thickness and life cycle costs: Pipe insulation application. Appl. Therm. Eng. 2014, 63, 370–378. [Google Scholar] [CrossRef]
  3. Kecebas, A.; Alkan, M.A.; Bayhan, M. Thermo-economic analysis of pipe insulation for district heating piping systems. Appl. Therm. Eng. 2011, 31, 17–18. [Google Scholar] [CrossRef]
  4. Mangs, S. Insulation Materials in District Heating Pipes: Environmental and Thermal Performance of Polyethylene Terephthalae and Polyurethane Foam; Chalmers University of technology: Göteborg, Sweden, 2005; pp. 1–2. [Google Scholar]
  5. Vega, A.; Yarahmadi, N.; Jakubowicz, I. Determination of the long-term performance of district heating pipes through accelerated ageing. Polym. Degrad. Stab. 2018, 153, 15–22. [Google Scholar] [CrossRef]
  6. Winkler-Skalna, A.; Łoboda, B. Determination of the thermal insulation properties of cylindrical PUR foam products throughout the entire life cycle using accelerated aging procedures. J. Build. Eng. 2020, 31, 101348. [Google Scholar] [CrossRef]
  7. Hilado, C.J.; Cumming, H.J. Fire Safety Aspects of Thermal Insulation. J. Therm. Insul. 1977, 1, 116–128. [Google Scholar] [CrossRef]
  8. Goldfarb, I.; Zinoviev, A. A study of delayed spontaneous insulation fires. Phys. Lett. A 2003, 311, 491–500. [Google Scholar] [CrossRef]
  9. Hidalgo, J.P.; Welch, S.; Torero, J.L. Performance criteria for the fire safe use of thermal insulation in buildings. Constr. Build. Mater. 2015, 100, 285–297. [Google Scholar] [CrossRef]
  10. Ye, L.; Meng, X.Y.; Ji, X.; Li, Z.M.; Tang, J.H. Synthesis and characterization of expandable graphite–poly (methyl methacrylate) composite particles and their application to flame retardation of rigid polyurethane foams. Polym. Degrad. Stab. 2009, 94, 971–979. [Google Scholar] [CrossRef]
  11. Xu, W.; Chen, R.; Du, Y.; Wang, G. Design water-soluble phenolic/zeolitic imidazolate framework-67 flame retardant coating via layer-by-layer assembly technology: Enhanced flame retardancy and smoke suppression of flexible polyurethane foam. Polym. Degrad. Stab. 2020, 176, 109152. [Google Scholar] [CrossRef]
  12. D’Alessandro, F.; Baldinelli, G.; Sambuco, S.; Rufini, A. Experimental assessment of the water content influence on thermo-acoustic performance of building insulation materials. Constr. Build. Mater. 2018, 158, 264–274. [Google Scholar] [CrossRef]
  13. Sundström, B. The Development of a European Fire Classification System for Building Products; Department of Fire Safety Engineering, Lund University: Lund, Sweden, 2007. [Google Scholar]
  14. European Committee for Standardization. EN ISO 11925-2 Reaction to Fire Tests—Ignitability of Building Products Subjected to Direct Impingement of Flame—Part 2: Single-Flame Source Test; European Committee for Standardization: Brussels, Belgium, 2010. [Google Scholar]
  15. European Committee for Standardization. EN ISO 13823 Reaction to Fire Tests—Building Products-building Products Excluding Floorings Exposed to the Thermal Attack by a Single Burning Item; European Committee for Standardization: Brussels, Belgium, 2002. [Google Scholar]
  16. European Committee for Standardization. EN ISO 13501-1 Reaction to Fire Tests—Fire Classification of Construction Products and Building Elements-Part 1: Classification using Test Data; European Committee for Standardization: Brussels, Belgium, 2002. [Google Scholar]
  17. NFPA. NFPA Standard 274: Standard Test Method to Evaluate Fire Performance Characteristics of Pipe Insulation; Technical Report; National Fire Protection Association: Quincy, MA, USA, 2013. [Google Scholar]
  18. European Committee for Standardization. EN ISO 13501-1 Reaction to Fire Tests—Small Room Test for Pipe Insulation Products or Systems; European Committee for Standardization: Brussels, Belgium, 2008. [Google Scholar]
  19. Janssens, M.L.; Huczek, J.; Sauceda, A. Development of a model of the ASTM E 84 Steiner tunnel test. Fire Saf. Sci. 2008, 9, 279–289. [Google Scholar] [CrossRef] [Green Version]
  20. Pretrel, H.; Bouaza, L.; Suard, S. Multi-scale analysis of the under-ventilated combustion regime for the case of a fire event in a confined and mechanically ventilated compartment. Fire Saf. J. 2020, 5, 103069. [Google Scholar] [CrossRef]
  21. Hernández, N.; Fuentes, A.; Reszka, P.; Fernández-Pello, A.C. Piloted ignition delay times on optically thin PMMA cylinders. Proc. Combust. Inst. 2019, 37, 3993–4000. [Google Scholar] [CrossRef]
  22. Leisted, R.R.; Sørensen, M.X.; Jomaas, G. Experimental study on the influence of different thermal insulation materials on the fire dynamics in a reduced-scale enclosure. Fire Saf. J. 2017, 93, 114–125. [Google Scholar] [CrossRef] [Green Version]
  23. You, W.J.; Park, J.W.; Sin, J.Y.; Park, H.G.; Ohk, K.L. Analysis of the Maximum Heat Release Rate in Accordance with the Test Method of the Flame Retardant Performance for Pipe Insulation. Fire Sci. Eng. 2020, 34, 18–25. [Google Scholar] [CrossRef]
  24. Ohk, K.L.; Nam, D.G.; Jang, H.Y. Evaluation of the Reaction-to-fire Performance of Pipe Insulation Material using Small Room Test. Fire Sci. Eng. 2019, 33, 1–8. [Google Scholar]
  25. McGrattan, K.; Klein, B.; Hostikka, S.; Floyd, J. Fire Dynamics Simulator (Version 5), User’s Guide; NIST Special Publication; NIST: Gaithersburg, MD, USA, 2010; pp. 56–57. [Google Scholar]
  26. Quintiere, J.G. Fundamentals of Fire Phenomena; John Wiley & Sons: West Sussex, UK, 2006; pp. 96–133. [Google Scholar]
  27. Tewarson, A.; Jiang, F.H.; Morikawa, T. Ventilation controlled combustion of polymers. Combust. Flame 1993, 95, 151–169. [Google Scholar] [CrossRef]
  28. Madrigal, J.; Guijarro, M.; Hernando, C.; Diez, C.; Marino, E. Effective heat of combustion for flaming combustion of Mediterranean forest fuels. Fire Technol. 2011, 47, 461–474. [Google Scholar] [CrossRef]
  29. Al-Ghouti, M.; Al-Degs, Y.; Mustafa, F. Determination of hydrogen content, gross heat of combustion, and net heat of combustion of diesel fuel using FTIR spectroscopy and multivariate calibration. Fuel 2010, 89, 193–201. [Google Scholar] [CrossRef]
  30. Lyon, R.E.; Walters, R.N. Pyrolysis combustion flow calorimetry. Anal. Appl. Pyrolysis 2004, 71, 27–46. [Google Scholar] [CrossRef]
  31. Minakshi, M.; Visbal, H.; Mitchell, D.R.; Fichtner, M. Bio-waste chicken eggshells to store energy. Dalton Trans. 2018, 47, 16828–16834. [Google Scholar] [CrossRef] [PubMed]
  32. Minakshi, M.; Barmi, M.; Mitchell, D.R.; Barlow, A.J.; Fichtner, M. Effect of oxidizer in the synthesis of NiO anchored nanostructure nickel molybdate for sodium-ion battery. Mater. Today Energy 2018, 10, 1–14. [Google Scholar] [CrossRef]
  33. Lyon, R.E. An integral method of nonisothermal kinetic analysis. Thermochim. Acta 1997, 297, 117–124. [Google Scholar] [CrossRef]
  34. Walters, R.N.; Hackett, S.M.; Lyon, R.E. Heats of combustion of high temperature polymers. Fire Mater. 2000, 24, 245–252. [Google Scholar] [CrossRef]
  35. Bundy, M.F.; Hamins, A.P.; Johnsson, E.L.; Kim, S.C.; Ko, G.; Lenhert, D.B. Measurements of Heat and Combustion Products in Reduced-Scale Ventilation-Limited Compartment Fires; Technical Note (NIST TN) -1483; National Institute of Standards and Technology: Gaithersburg, MD, USA, 2007; pp. 114–116. [Google Scholar]
  36. Van Krevelen, D.W. Some basic aspects of flame resistance of polymeric materials. Polymer 1975, 16, 615–620. [Google Scholar] [CrossRef]
  37. Filipczak, R.; Crowley, S.; Lyon, R.E. Heat release rate measurements of thin samples in the OSU apparatus and the cone calorimeter. Fire Saf. J. 2005, 40, 628–645. [Google Scholar] [CrossRef]
Figure 1. Schematic diagram of heat transfer and the heat release rate of the pipe insulation in a compartment fire.
Energies 13 03644 g001
Figure 2. Schematic diagram and pictures of the test conditions and the experiment method.
Energies 13 03644 g002
Figure 3. (a) Calibration results of heat release rate (HRR) using propane burner and (b) comparison of the theoretical and measured HRR.
Energies 13 03644 g003
Figure 4. (a) Calibration results of TGA using calcium oxalate and (b) the results of TGA for material properties of the test sample (polyethylene foam).
Energies 13 03644 g004
Figure 5. The results of the heat release rate with the variations of the ignition heat source for volume fraction 0.024 and scale factor 0.33.
Energies 13 03644 g005
Figure 6. Experiment results of the heat release rate vs. ignition heat source for 0.33, 0.25, and 0.2 of the scale factor with a volume fraction of 0.024, 0.05, 0.07, and 0.1. (a) Test#1–Test#3. Heat release rate vs. time (Sf = 0.2, VF = 0.024, Qig = 11.00 kW, 21.10 kW, 28.54 kW); (b) Test#4–Test#6. Heat release rate vs. time (Sf = 0.2, VF = 0.05, Qig = 10.00 kW, 15.47 kW, 23.05 kW); (c) Test#7, Test#9. Heat release rate vs. time (Sf = 0.2, VF = 0.07, Qig = 10.00 kW, 18.65 kW); (d) Test#10–Test#12. Heat release rate vs. time (Sf = 0.2, VF = 0.1, Qig = 10.00 kW, 15.45 kW, 19.92 kW); (e) Test#13–Test#15. Heat release rate vs. time (Sf = 0.25, VF = 0.024, Qig = 10.00 kW, 15.16 kW, 22.47 kW); (f) Test#17–Test#18. Heat release rate vs. time (Sf = 0.25, VF = 0.05, Qig = 16.18 kW, 22.25 kW); (g) Test#19–Test#21. Heat release rate vs. time (Sf = 0.25, VF = 0.07, Qig = 10.00 kW, 15.77 kW, 21.36 kW); (h) Test#22–Test#24. Heat release rate vs. time (Sf = 0.25, VF = 0.1, Qig = 10.00 kW, 15.95 kW, 22.03 kW); and (i) Test#28–Test#30. Heat release rate vs. time (Sf = 0.33, VF = 0.05, Qig = 11.00 kW, 16.50 kW, 21.69 kW).
Energies 13 03644 g006
Figure 7. The results of the effective heat of combustions with volume fraction 0.024, 0.05, 0.07, and 0.1 for scale factor 1/3, 1/4, and 1/5.
Energies 13 03644 g007
Figure 8. Experiment results of the maximum heat release rate vs. fuel mass loss with scale factors (Sf = 1/3, 1/4, and 1/5) and volume fraction (VF = 0.024, 0.05, 0.07, and 0.1).
Energies 13 03644 g008
Figure 9. (a) Averaged maximum HRR vs. volume fraction for Sf = 0.2, 0.25, and 0.33 and (b) the curve-fit results of experiment coefficient b1 vs. scale factor for Sf = 0.2, 0.25, and 0.33.
Energies 13 03644 g009
Figure 10. Comparison of the maximum heat release rate of experiments and predictions with mass loss.
Energies 13 03644 g010
Figure 11. (a) Maximum time vs. Sf/Qig for 0.024, 0.05, 0.07, and 0.1 of the volume fraction and (b) the curve-fit results of experiment coefficient c1 vs. volume Fraction.
Energies 13 03644 g011
Figure 12. Comparison of the maximum time of experiments and predictions with Sf/Qig.
Energies 13 03644 g012
Figure 13. The comparison of the predictions and experiment of the fire growth rate index with scale factors (Sf = 1/3, 1/4, and 1/5), volume fraction (VF = 0.024, 0.05, 0.07, and 0.1), and ignition heat sources (Qig).
Energies 13 03644 g013
Table 1. Test conditions investigated by ISO 20632 and NFPA 274.
ContentsISO 20632NFPA 274Test Conditions
Volume of Compartment
(m3)
VISO = 20.76 m3VM,NFPA = 0.78 m3VM,1/3 = 0.768 m3
VM,1/4 = 0.324 m3
VM,1/5 = 0.165 m3
Scale Factor (-)11/3 ( = 0.33)1/3 ( = 0.33), ¼ ( = 0.25), 1/5 ( = 0.20)
Volume of Insulation
(m3)
Vf,iso = 0.51 m3Vf,NFPA = 0.055 m3Vf,1/5 = 0.004 m3, 0.008 m3, 0.019 m3, 0.008 m3
Vf,1/4 = 0.016 m3, 0.038 m3, 0.012 m3, 0.023 m3
Vf,1/3 = 0.053 m3, 0.017 m3, 0.032 m3
Volume Fraction
(-)
VF = 0.024VF = 0.07VF = 0.024, 0.05, 0.07, 0.1
Ignition (kW) and Time (s)Qig,1 = 100 kW for 600 sQig,1 = 20 kW for 180 sQig = 10 kW, 15 kW, 20 kW for tfinal = 600 s
Qig,2 = 300 kW for 600 sQig,2 = 70 kW for 420 s
Table 2. Specification of the experiment apparatus of the cone-calorimeter.
MeasurementSpecification
Duct TemperatureK-Type Wire, Range: −200–1000 °C
DAQVoltage: 20 mV to 100 V, 1–5 V F.S., 20 channels, Accuracy: ±0.1%
Duct Size & BlowerLength: 5 m, Diameter: 0.2 m, Fan capacity: 3 hp
O2 AnalyzerOutput: 4–20 mA, Range: 0.7–1.2 bar, Model: OXYMAT 61
Pressure SensorOutput: 0–10 V, Range: 1250 Pa, Model: MS-311
Mass Flow ControllerFuel: CH4, C3H8, Output: 0–5 VDC, Range: 200 LPM, Model: TSC-145
Pressure TransmitterOutput: 0–20 mA, Range: 0–20 bar, Model: PSC-E-B-A-P-G
Table 3. Thermal properties of the polyethylene foam (PE) test sample.
PropertiesValuesPropertiesValues
Reference Temperature, (K)744Heat of Combustion, (kJ/kg)42,660
Activation Energy (kJ/kmole)1.19 × 10−5Density (kg/m3)26
Pre-exponential Factor (1/s)1.05 × 10−6Specific Heat (kJ/kg-°C)2.31
Table 4. Test conditions and summarized results of experiments.
Test Num.Test ConditionsResults of Experiment
S f V M V f VF Δ m f Q ˙ i g Q ˙ f Δ m c , e f f Q ˙ max t max
(-)(m3)(m3)(-)(kg)(kW)(kJ)(kJ/kg)(kW)(s)
#10.20.1650.004 0.024 0.109 11.00 379534,817 30.23 172
#20.20.1650.004 0.0240.109 21.10 379734,833 33.47 101
#30.20.1650.004 0.0240.109 28.54 377934,672 42.63 99
#40.20.1650.008 0.050 0.227 10.00 747732,938 79.09 188
#50.20.1650.008 0.050 0.227 15.47 857637,778 78.96 97
#60.20.1650.008 0.050 0.227 23.05 691330,455 85.23 89
#70.20.165 0.012 0.070 0.312 10.00 11,84737,972 165.25 189
#80.20.1650.012 0.070 0.320 14.64 10,78533,702 160.78 N/A
#90.20.1650.012 0.070 0.318 18.65 11,28235,479 162.03 142
#100.20.1650.01650.10.450 10.00 17,34438,541 169.34 236
#110.20.1650.01650.10.454 15.45 18,48240,708 179.98 123
#120.20.1650.01650.10.452 19.92 16,43636,362 167.22 113
#130.250.3240.008 0.024 0.223 10.00 826037,042 103.18 286
#140.250.3240.008 0.0240.214 15.16 766035,797 80.16 137
#150.250.3240.008 0.0240.220 22.47 910141,366 70.60 126
#160.250.3240.016 0.050 0.444 10.00 18,95942,699 178.05 N/A
#170.250.3240.016 0.050 0.444 16.18 14,961 33,696 145.56 139
#180.250.3240.016 0.050 0.444 22.25 17,763 40,006 229.68 125
#190.250.3240.023 0.070 0.626 10.00 22,223 35,500 194.57 384
#200.250.3240.023 0.070 0.632 15.77 23,994 37,964 183.09 170
#210.250.3240.023 0.070 0.620 21.36 24,962 40,261 240.65 112
#220.250.3240.032 0.10.892 10.00 35,515 39,815 245.92 447
#230.250.3240.032 0.10.892 15.95 32,812 36,785 291.99 209
#240.250.3240.032 0.10.872 22.03 33,095 37,953 269.13 159
#250.330.7680.019 0.024 0.495 12.00 19,455 39,303 227.52 589
#260.330.7680.019 0.0240.500 15.98 20,547 41,095 199.78 203
#270.330.7680.019 0.0240.503 23.20 18,974 37,722 202.00 136
#280.330.7680.038 0.050 1.052 11.00 44,035 41,859 325.05 789
#290.330.7680.038 0.050 1.046 16.50 37,700 36,042 282.23 212
#300.330.7680.038 0.050 1.054 21.69 39,344 37,328 282.02 204
#310.330.7680.053 0.070 1.448 13.57 49,677 34,307382.10 N/A
#320.330.7680.053 0.070 1.430 17.69 54,897 38,389437.19 N/A
#330.330.7680.053 0.070 1.451 21.83 50,609 34,878370.69 N/A

