Article

A Numerical Analysis of the Fire Characteristics after Sprinkler Activation in the Compartment Fire

1
School of Mechanical Engineering, Chung-Ang University, Seoul 06974, Korea
2
School of Transportation Engineering, Hanoi University of Science and Technology, Hanoi 100000, Vietnam
3
Fire Insurers Laboratories of Korea, Gyeonggi-do 469-881, Korea
*
Author to whom correspondence should be addressed.
Energies 2020, 13(12), 3099; https://doi.org/10.3390/en13123099
Submission received: 27 April 2020 / Revised: 11 June 2020 / Accepted: 12 June 2020 / Published: 15 June 2020
(This article belongs to the Special Issue Engineering Fluid Dynamics 2019-2020)

Abstract

:
Understanding fire characteristics under sprinkler spray is valuable for performance-based safety design. However, fire characteristics during fire suppression by sprinkler spray has seldom been studied in detail. In order to present a fire suppression model by sprinkler spray and determine the fire characteristics after sprinkler activation in a compartment, a numerical analysis was conducted using a fire dynamics simulator (FDS). A simple fire suppression model by sprinkler spray was calibrated by comparing ceiling temperatures from experimental data. An extinguishing coefficient of 3.0 was shown to be suitable for the fire suppression model. The effect of sprinkler spray on the smoke layer during fire suppression was explained, revealing a smoke logging phenomenon. In addition, the smoke, which spread under the influence of the sprinkler spray, was also investigated. The temperature, velocity, and mass flow rate of the smoke layer through the doorway was significantly reduced during fire suppression compared to a free burn case.

Graphical Abstract

1. Introduction

In Korean regulations, automatic sprinkler systems are required in buildings and factories to control a fire. Applications of sprinkler systems in the building are to suppress the fire and prevent the fire spread from one compartment to another. As a result, it can restrict the untenable conditions caused by smoke hazards and extend the available safe egress time when a fire occurs in the building. Extensive research has been conducted to improve the design and efficiency of sprinkler systems for many years, especially using computational fluid dynamics (CFD) modelling, which can simulate the interaction of water with fire environments and has been widely used and become a powerful tool with many advantages.
Computational fluid dynamics can provide details on an analysis of the interaction between the fire environment and water sprays. The numerical analysis can be completed with a less expensive cost and consumed time and can be used in combination with experimental work to improve technical design for water spray systems. Various numerical studies on the interaction between water spray and fire plume have been reported. The primary concerns are related to extinguishing times and the minimum water flow rate to extinguish the fire. Novozhilow et al. [1] developed a CFD model of burning rate and extinction in fires by water sprinklers. The extinguishing rates were modeled by calculating the heat transfer and temperature at the solid surface when the sprinklers were in operation. The extinction time was compared to experimental data and found to be in satisfactory agreement. They also developed a CFD model to predict extinguishment times of an array of wood slats by sprinkler water. The wood pyrolysis rate modeled by Arrhenius’s reaction was fully coupled with the gas phase model, and the spray was treated in Lagrangian fashion. The extinguishment times were reasonably close to those measured from experiments [2]. Nam [3] investigated the trajectory capacity of water spray from fast response sprinklers into heptane fire via numerical simulations. The simulation was a combination of the water spray model and the free burn fire model. The fire was modeled to avoid complicated chemical combustion by defining prescribed fire source. The results from the simulations compared reasonably well with experimental measurements in terms of actual delivered densities. Hua et al. [4] introduced a numerical approach to investigate the effect of water spray characteristics on a fire plume. The chemical combustion used the Arrhenius reaction to present fire extinction by water. In the results, a solid cone pattern and a finer water droplet size of the water spray was more effective in extinguishing fires. The flow rate of the water spray had a certain critical value for suppressing a specific fire.
Other studies on the effects of water spray on fire environments without considering fire suppression have also been conducted. O’grady and Novozhilov [5] used the Fire Dynamic Simulator (FDS) version 4 software to present the effect of the water spray of a sprinkler on the ceiling jet. The numerical results of two different flow rates were validated to free burn fire tests including a 1.5 MW steady-state fire. The relative errors were 7–8% for velocity and 10–15% for the temperature [5]. Cunfeng Zhang and Wanki Chow [6] used the FDS code to investigate the interaction of the sprinkler spray and the smoke layer. The cooling effect of the spray and drag force of water particles was analyzed. As a result, the temperature of the smoke layer decrease was almost linear to the working pressure of the sprinkler systems. Chen et al. [7] discussed the cooling effect of water spray systems in experimental and numerical analyses. Although the flame continued after activating sprinkler due to the lack of the suppression model, the cooling effects by the water spray in a room test within 120 s were obvious. Zhi Tang et al. [8] presented the effect of water spray on the fire smoke layer inside a hood by FDS simulation. The influence of the water spray characteristics on the downward smoke displacement due to the fact of drag and cooling was analyzed in detail. Other applications of sprinkler modeling were also used in the suppression of rack storage [9] and conveyor belt fires [10].
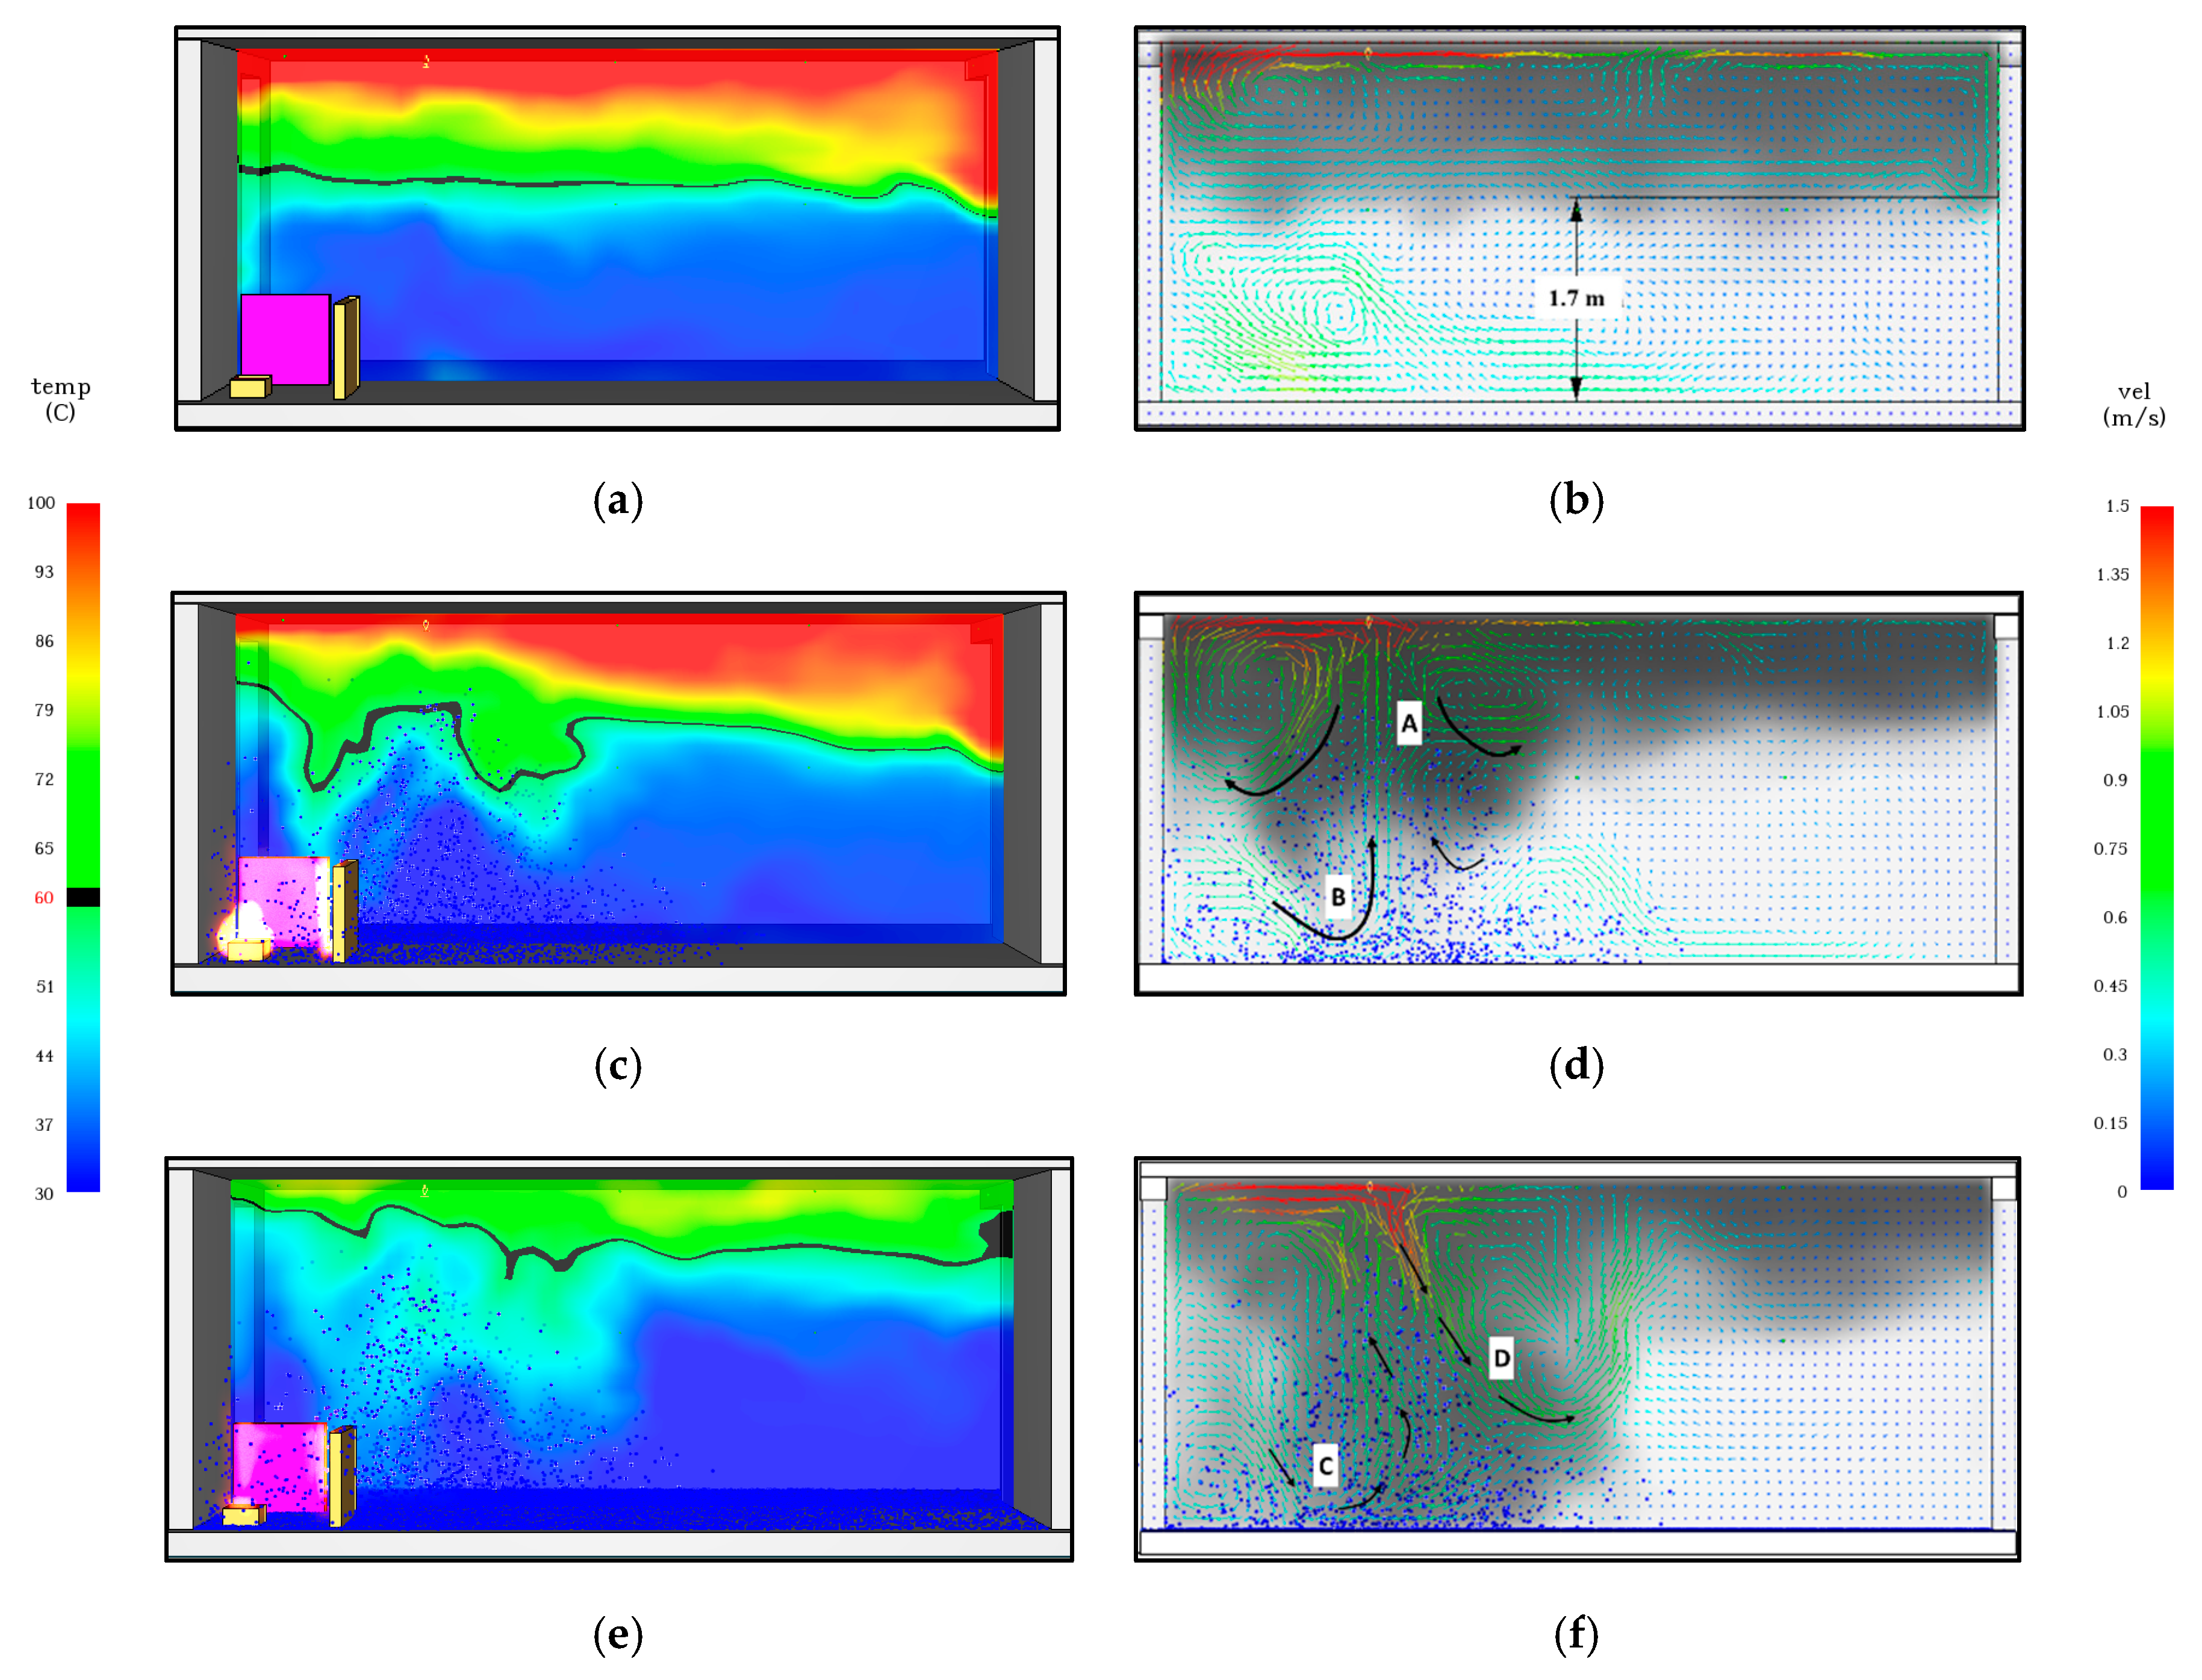
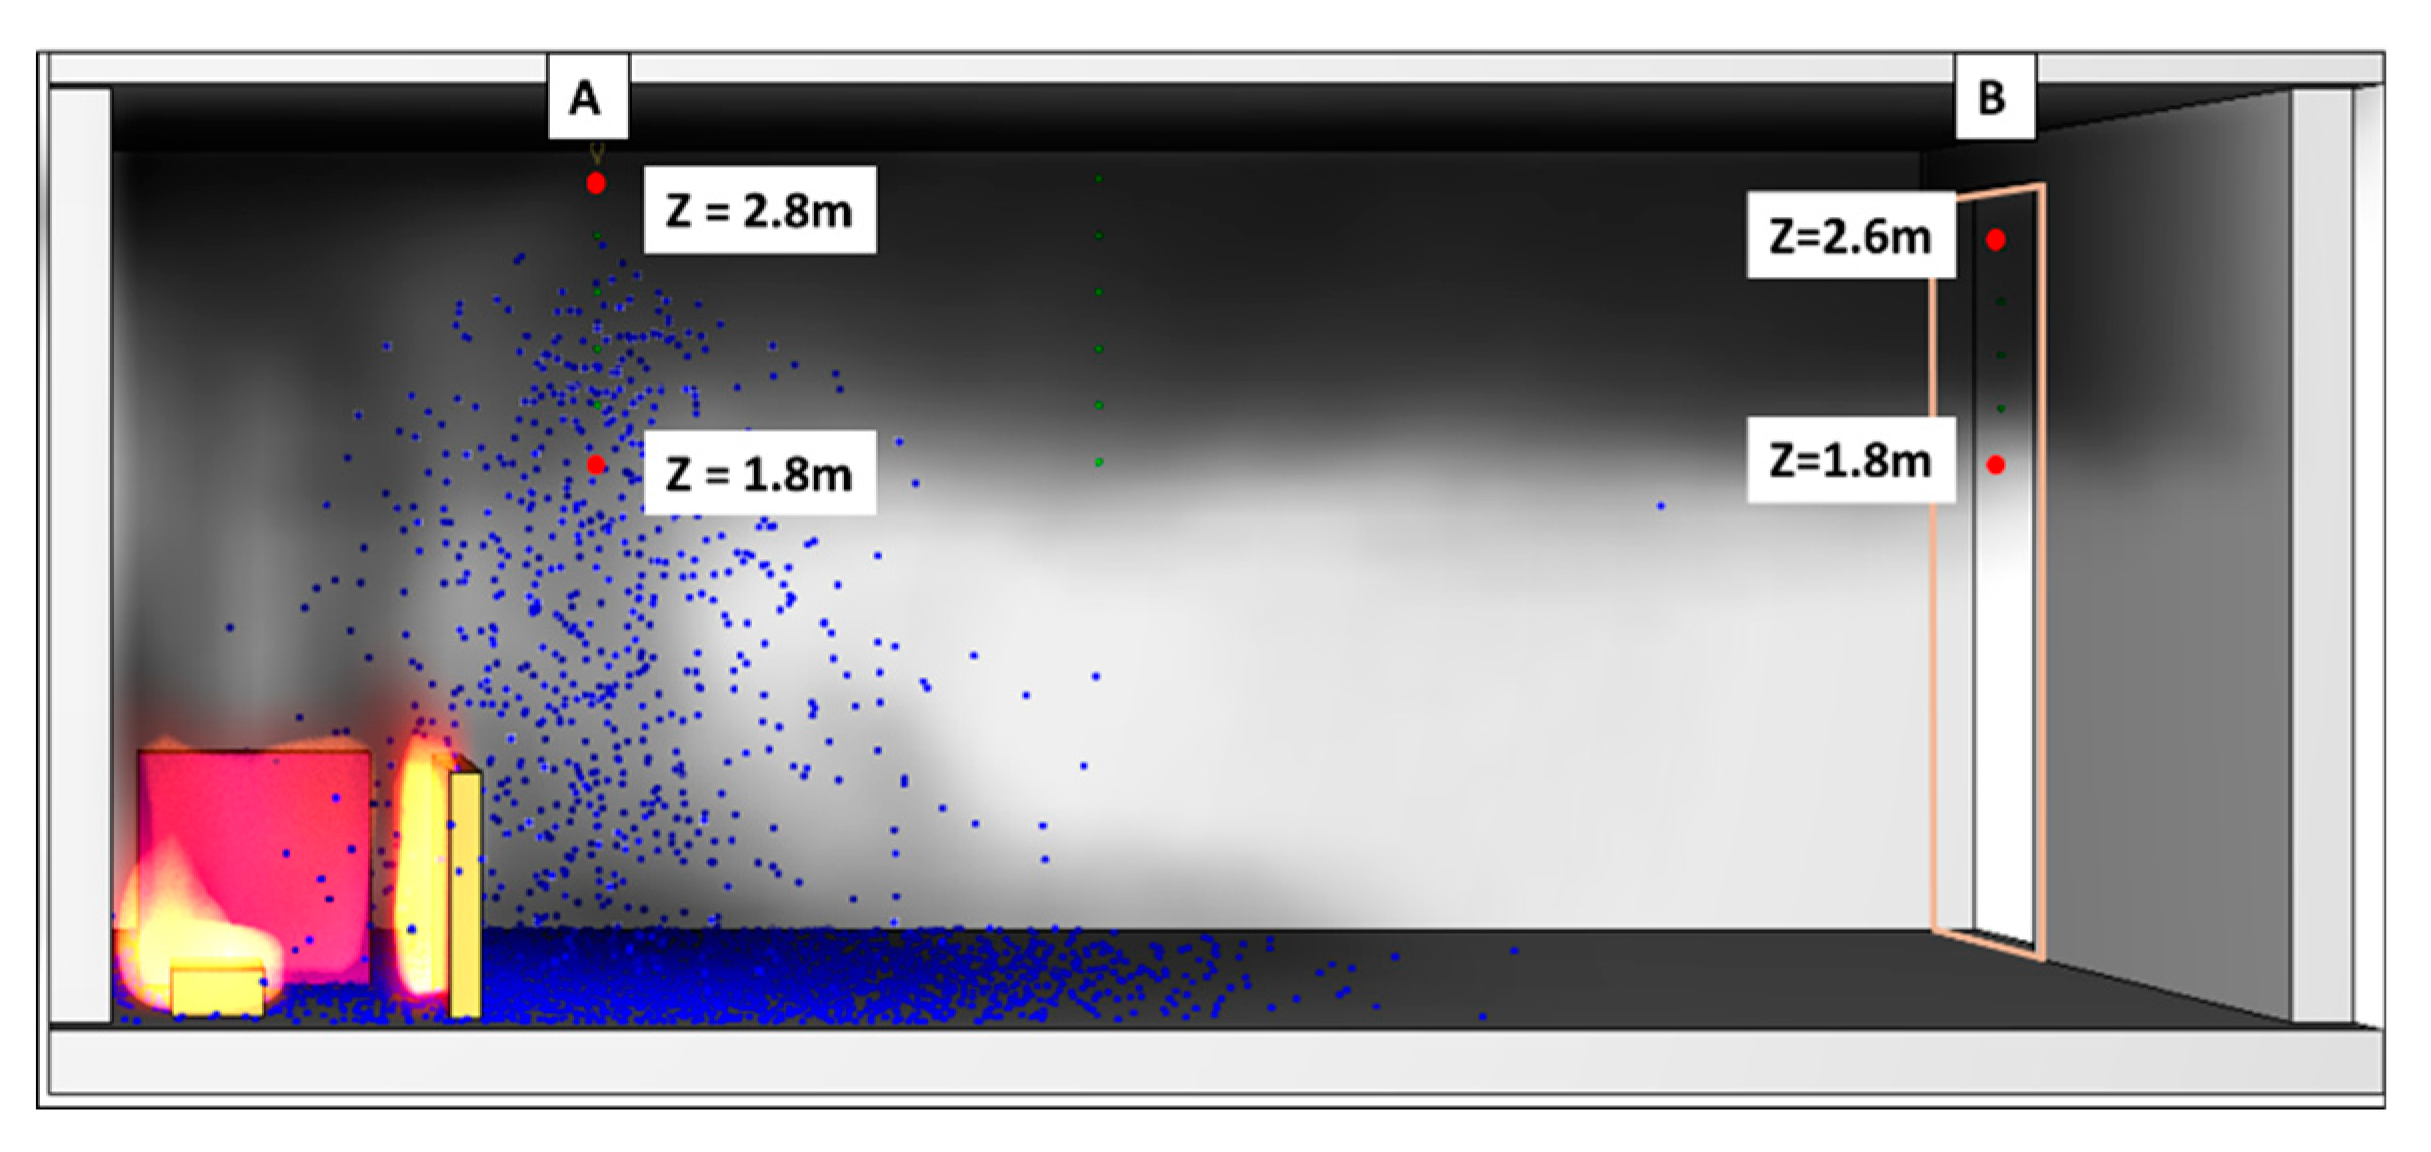
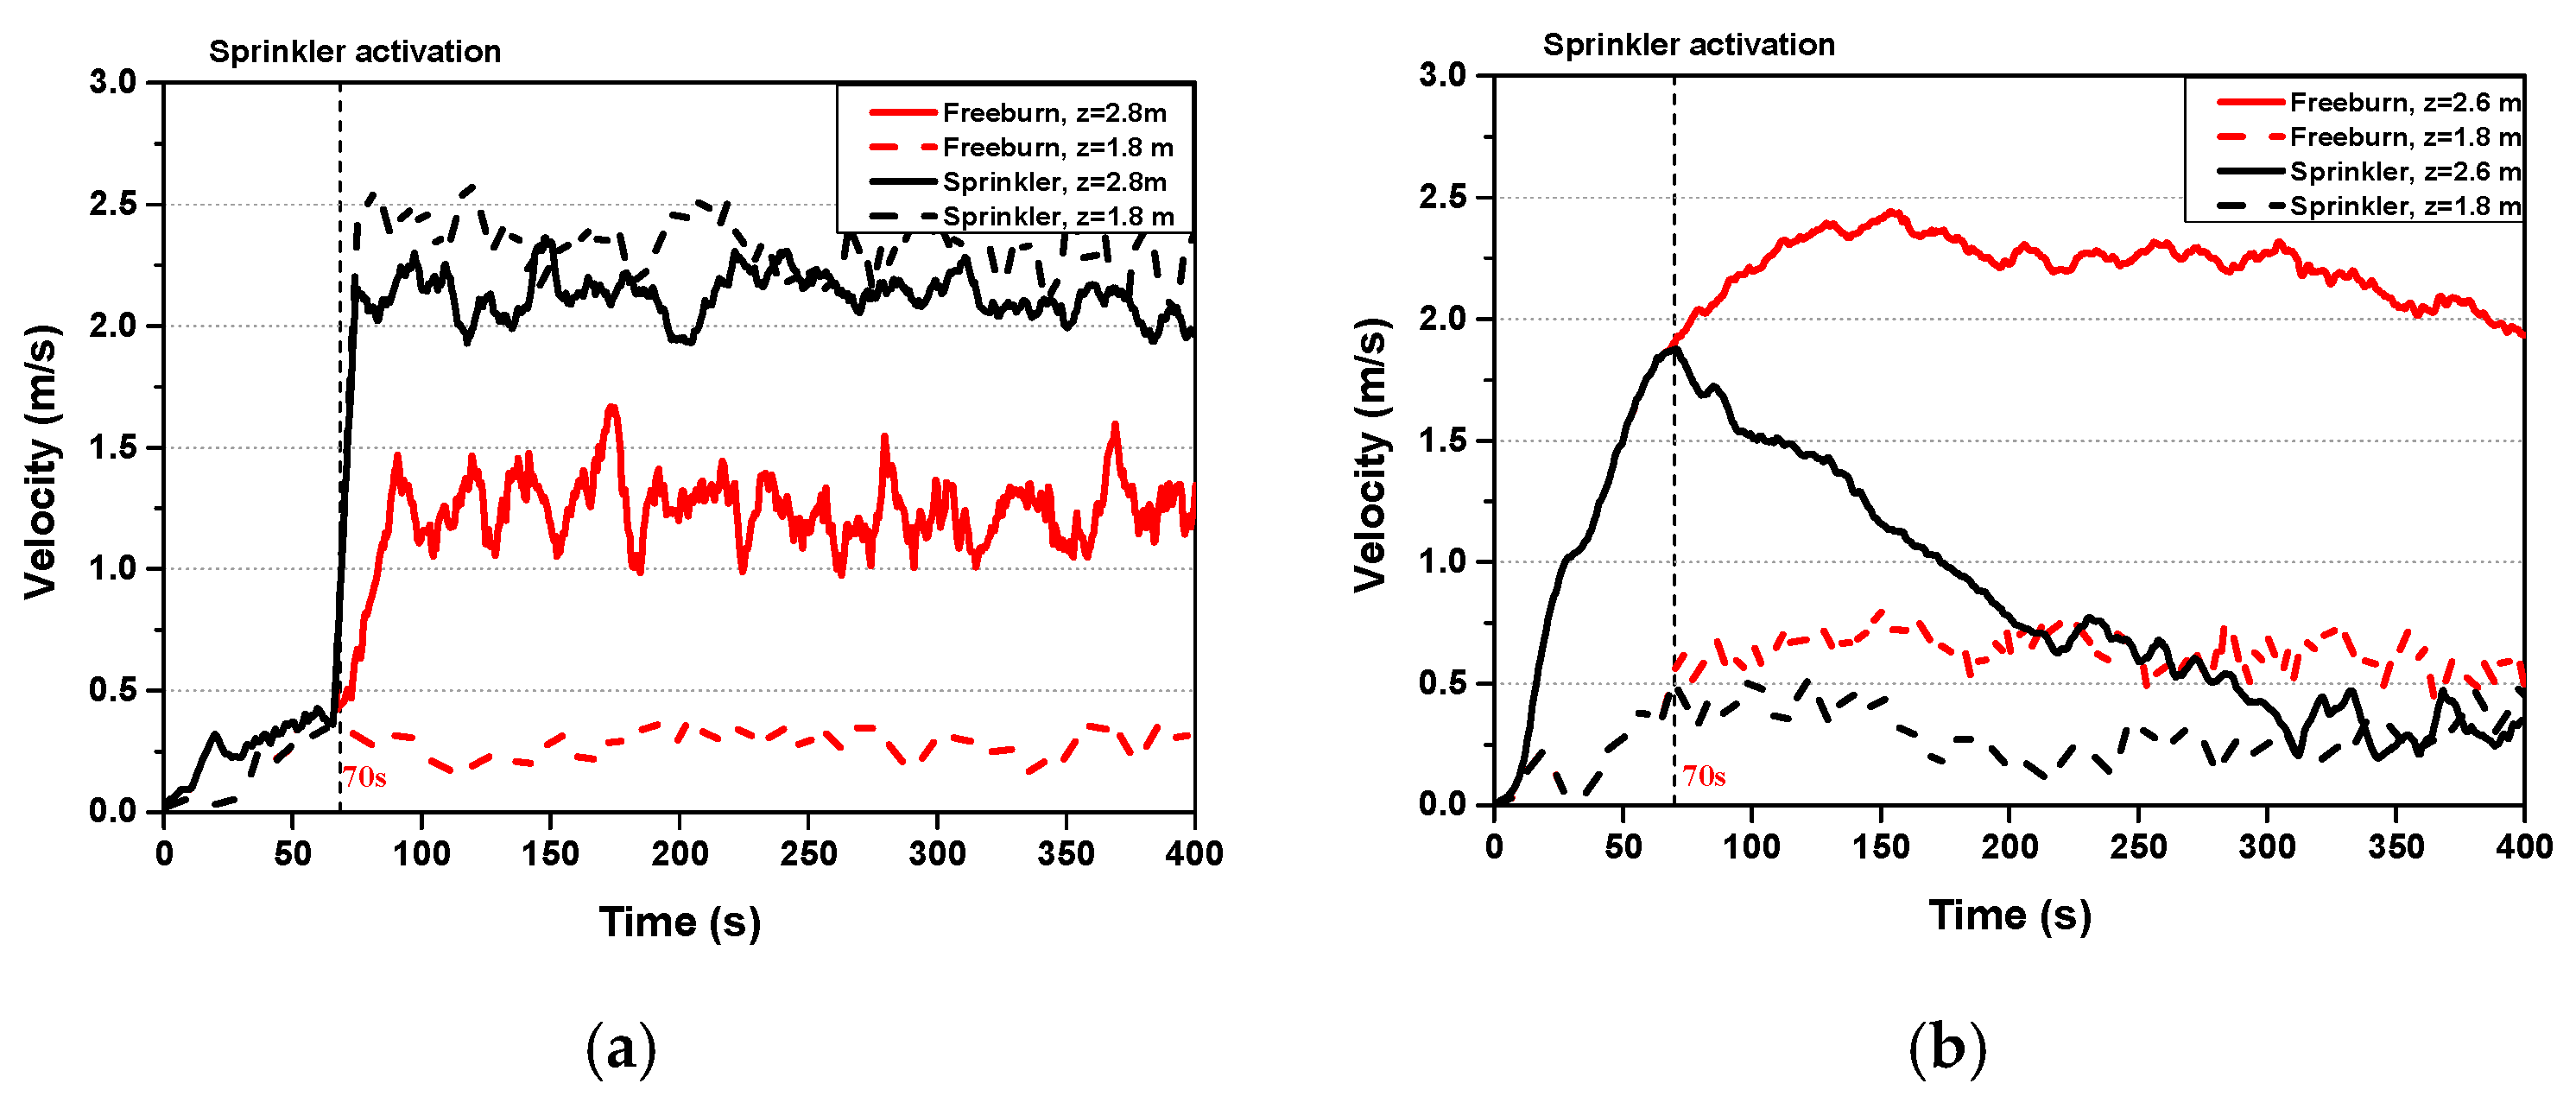
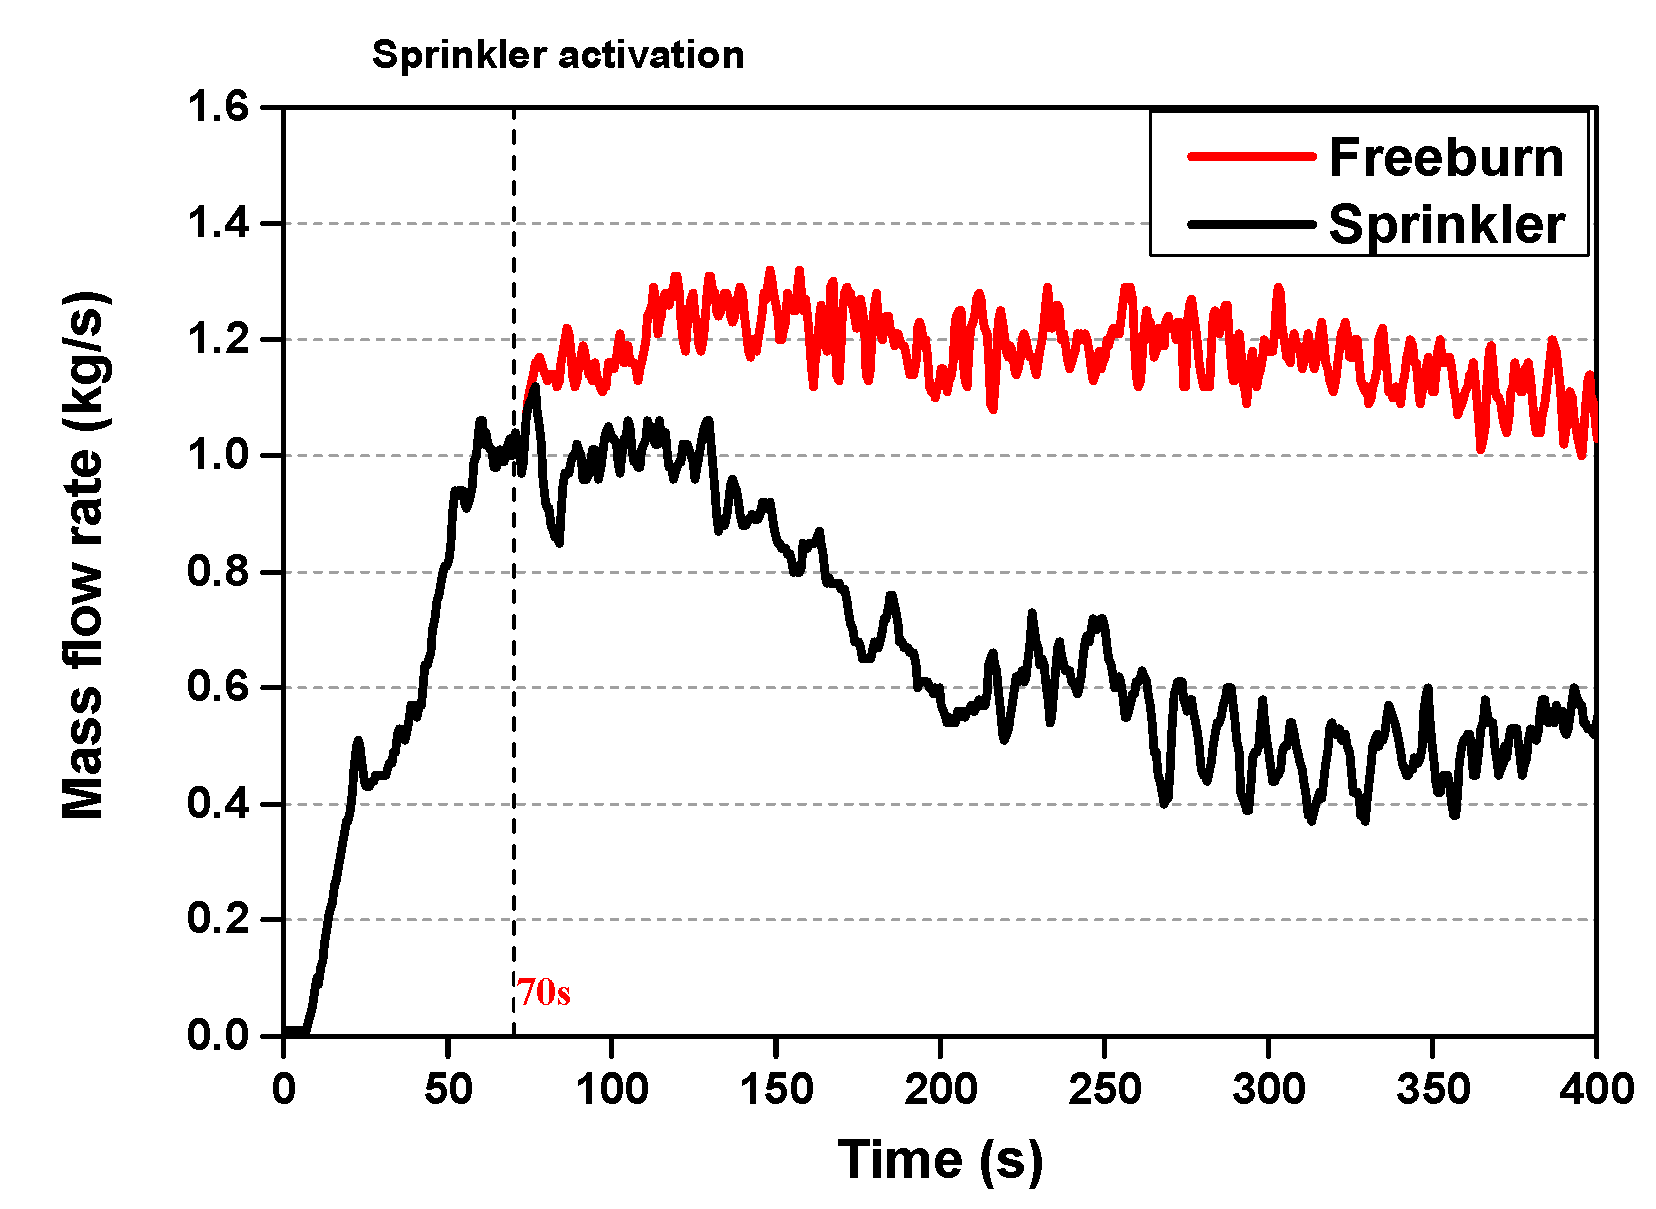
When the water droplets encounter to a fire source, the water is not only cooling the burning surface and surrounding air, but it also impacts the chemical reaction rate of solid fuel. Simultaneously, water droplets also significantly affect the smoke movement by its trajectory. Meanwhile, the complex Arrhenius reaction model is usually used to present chemical combustion. Therefore, when adding fire extinction by a water spray, the numerical simulation is more complicated. Hence, it is necessary for a study that includes the phenomena above to better understand fire characteristics under water spray with a simple fire suppression model. In this present study, fire characteristics after sprinkler activation in a compartment were investigated by numerical analysis in FDS 6.7.0. The mathematical equation of the fire suppression model was introduced in FDS. Experimental work was conducted to collect data related to the heat release rate and ceiling temperature. Based on the experimental data, the numerical simulations proceeded to calibrate the fire suppression model by comparison to the ceiling temperature. Then, the calibrated model was used to investigate the characteristics of the smoke movement during fire suppression. In addition, the smoke spread was analyzed in terms of temperature, velocity, mass flow, and was compared to a case of free burn.

2. Fire Dynamics Simulator and Fire Suppression Model by Water

Fire Dynamics Simulator v. 6.7.0 (FDS) [11,12] was used to simulate the fire suppression in this study. The FDS is a computational fluid dynamics (CFD) model of fire-driven fluid flow. A form of the Navier–Stokes equation was applied for low-speed, thermally-driven flow such as smoke and heat transport from fires. The partial derivatives of the conservation equations of mass, momentum, and energy were approximated as finite differences, and the solution was updated in time on a three-dimensional, rectilinear grid. The combustion model was based on the mixing-limited, infinitely fast reaction of lumped species, called eddy dissipation concept (EDC) model. Thermal radiation was computed using a finite volume technique on the same grid as the flow solver. Water droplets can absorb and scatter thermal radiation. For calculation of absorption coefficients, a gray band model, RAD-CAL was implemented. Lagrangian particles were used to represent the liquid droplets. The mass, momentum, and energy transfer from the Lagrangian particles to gas flow were treated sufficiently by source term in the conservation equation. The model in FDS was successfully tested and validated for a variety of fire problems, natural convective flows, smoke movement [13,14], and water-based fire suppression [15].
The fire suppression by a water spray involving multiple physical phenomena adds complications to CFD. The fire suppression by water was first introduced by Yu et al. [16] and applied to the FDS simulation by Hamins and McGrattan [12] as a fire suppression model. When the water droplets drop into burning surfaces, the water is cooling the surface and the surrounding gas, and it is also changing the pyrolysis rate of the solid fuel. A liquid droplet hits a solid horizontal surface in FDS, it is assigned a random horizontal direction and moves at a fixed velocity until it reaches the edge, at which point it drops straight down at the same fixed velocity. While attached to the burning surface, the water droplet forms a thin film that transfers heat to the solid, and heat and mass to the gas by evaporating. In the FDS model, the cooling of unburned surfaces and the reduction in the Heat Release Rate (HRR) are computed locally. However, the exponential nature of fire suppression by water is observed both locally and globally; thus, the local heat release rate per unit area (kW/m2) can be expressed in the following equation:
q ˙ ( t ) = q ˙ 0 ( t ) e k ( t ) d t
where q ˙ 0 ( t ) is the user-specified heat release rate per unit area of fuel (kW/m2) when no water droplets are applied, and k ( t ) is a linear function of the local water mass per unit area, m w ( t ) , in units of kg/m2, which is expressed as:
k ( t ) = α m w " ( t )                         1 / s
where α is the extinguishing coefficient and is obtained experimentally in units of m
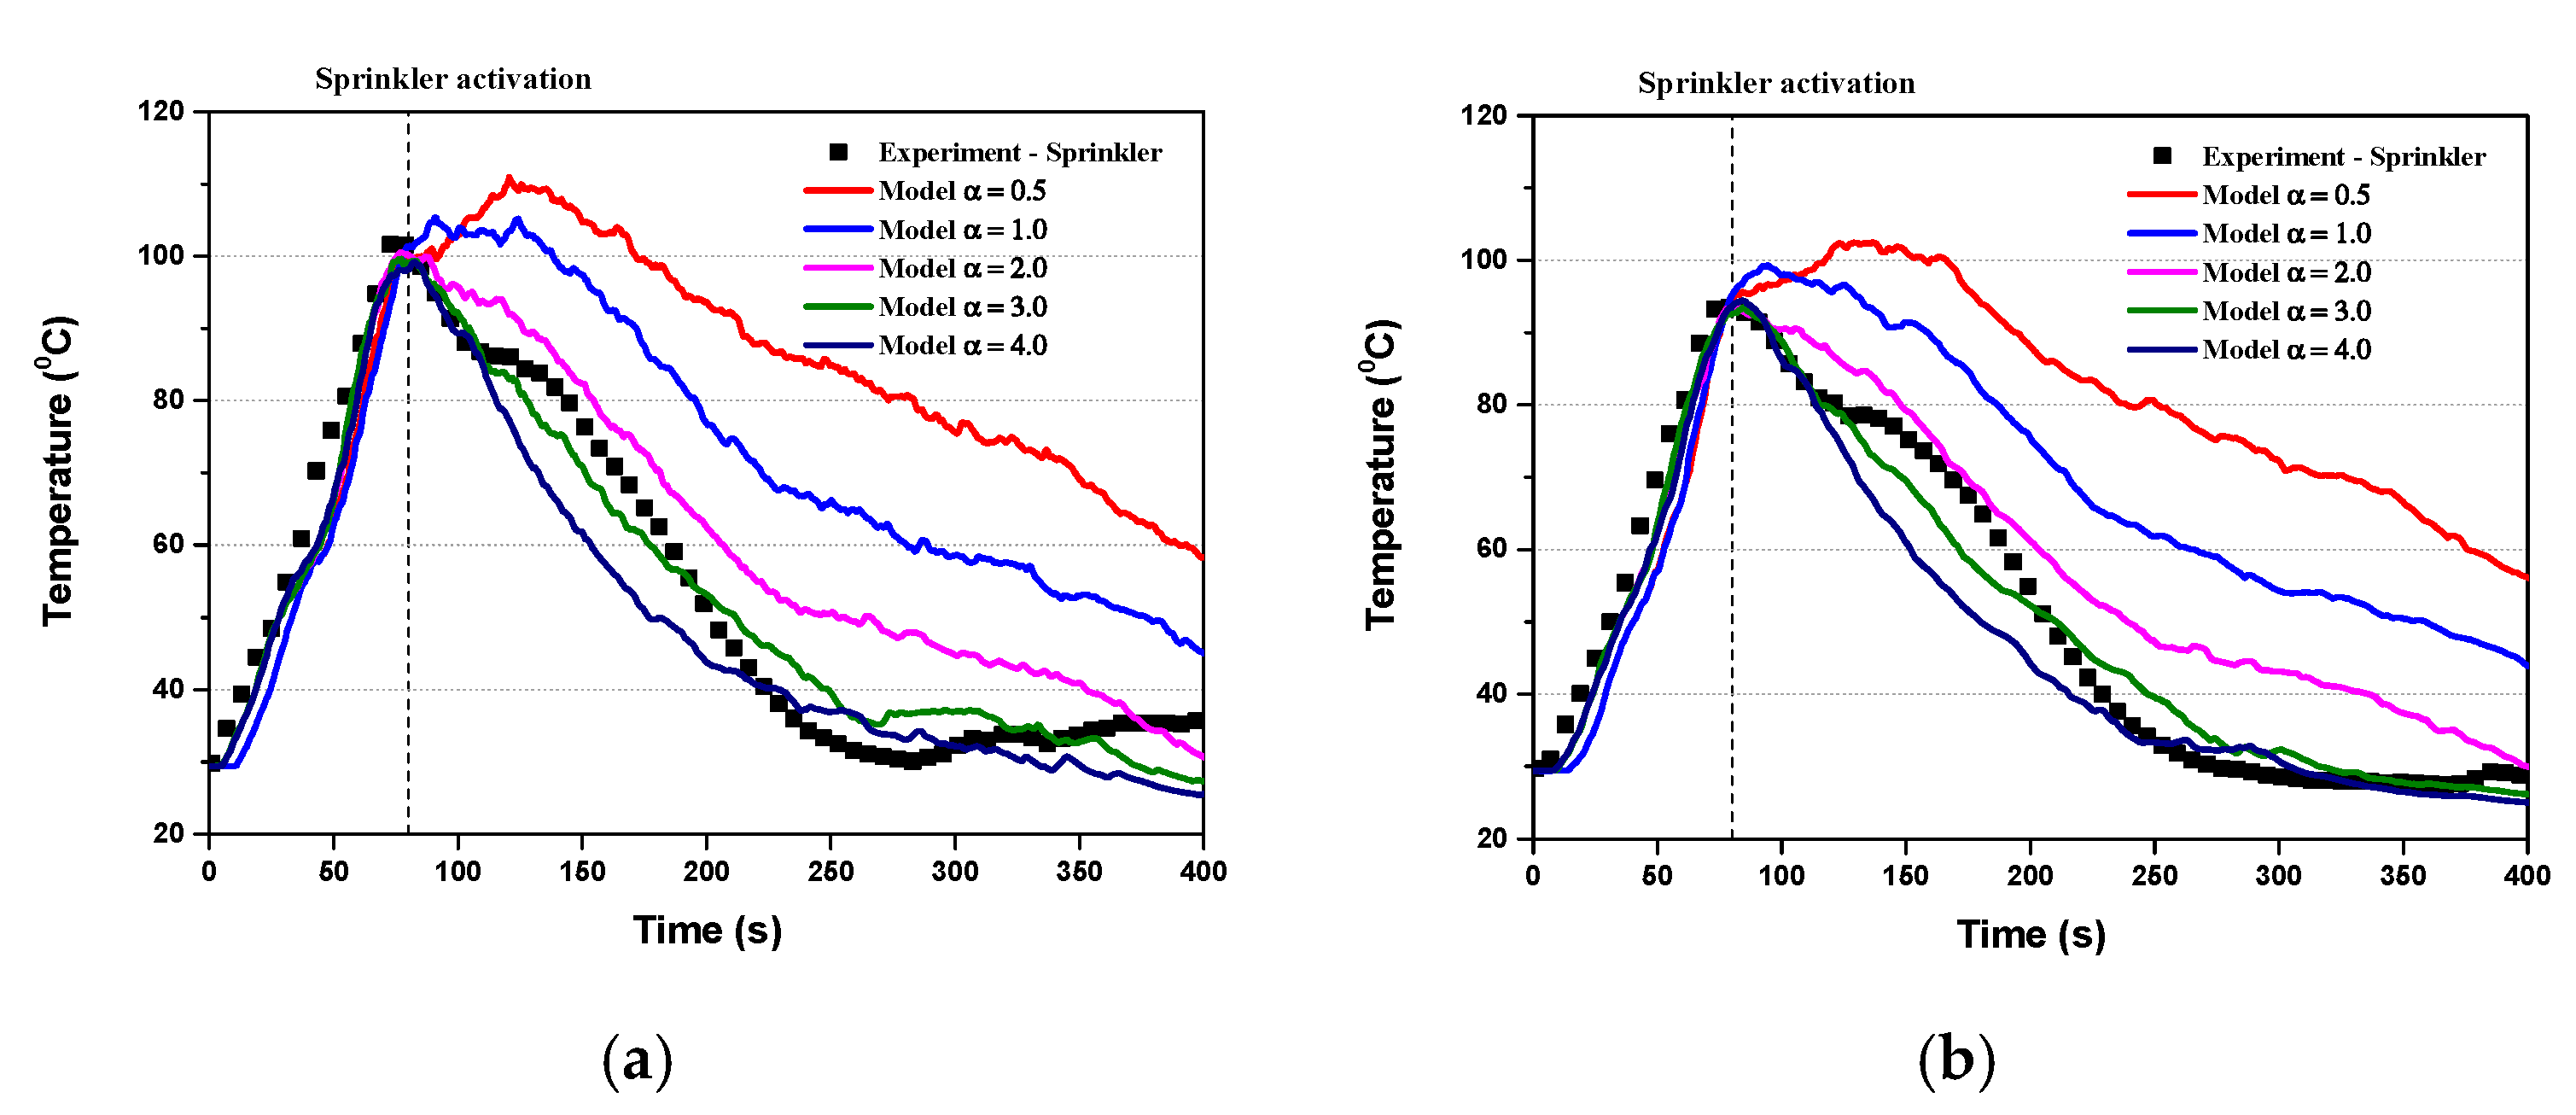
2/(kg·s). The extinguishing coefficient is dependent on the material properties of the solid fuel and its geometrical configuration. In order to obtain the optimal α value, simulations were performed for calibration by comparison of the ceiling temperature. The detail will be discussed in the next section.

3. Experiment Setup

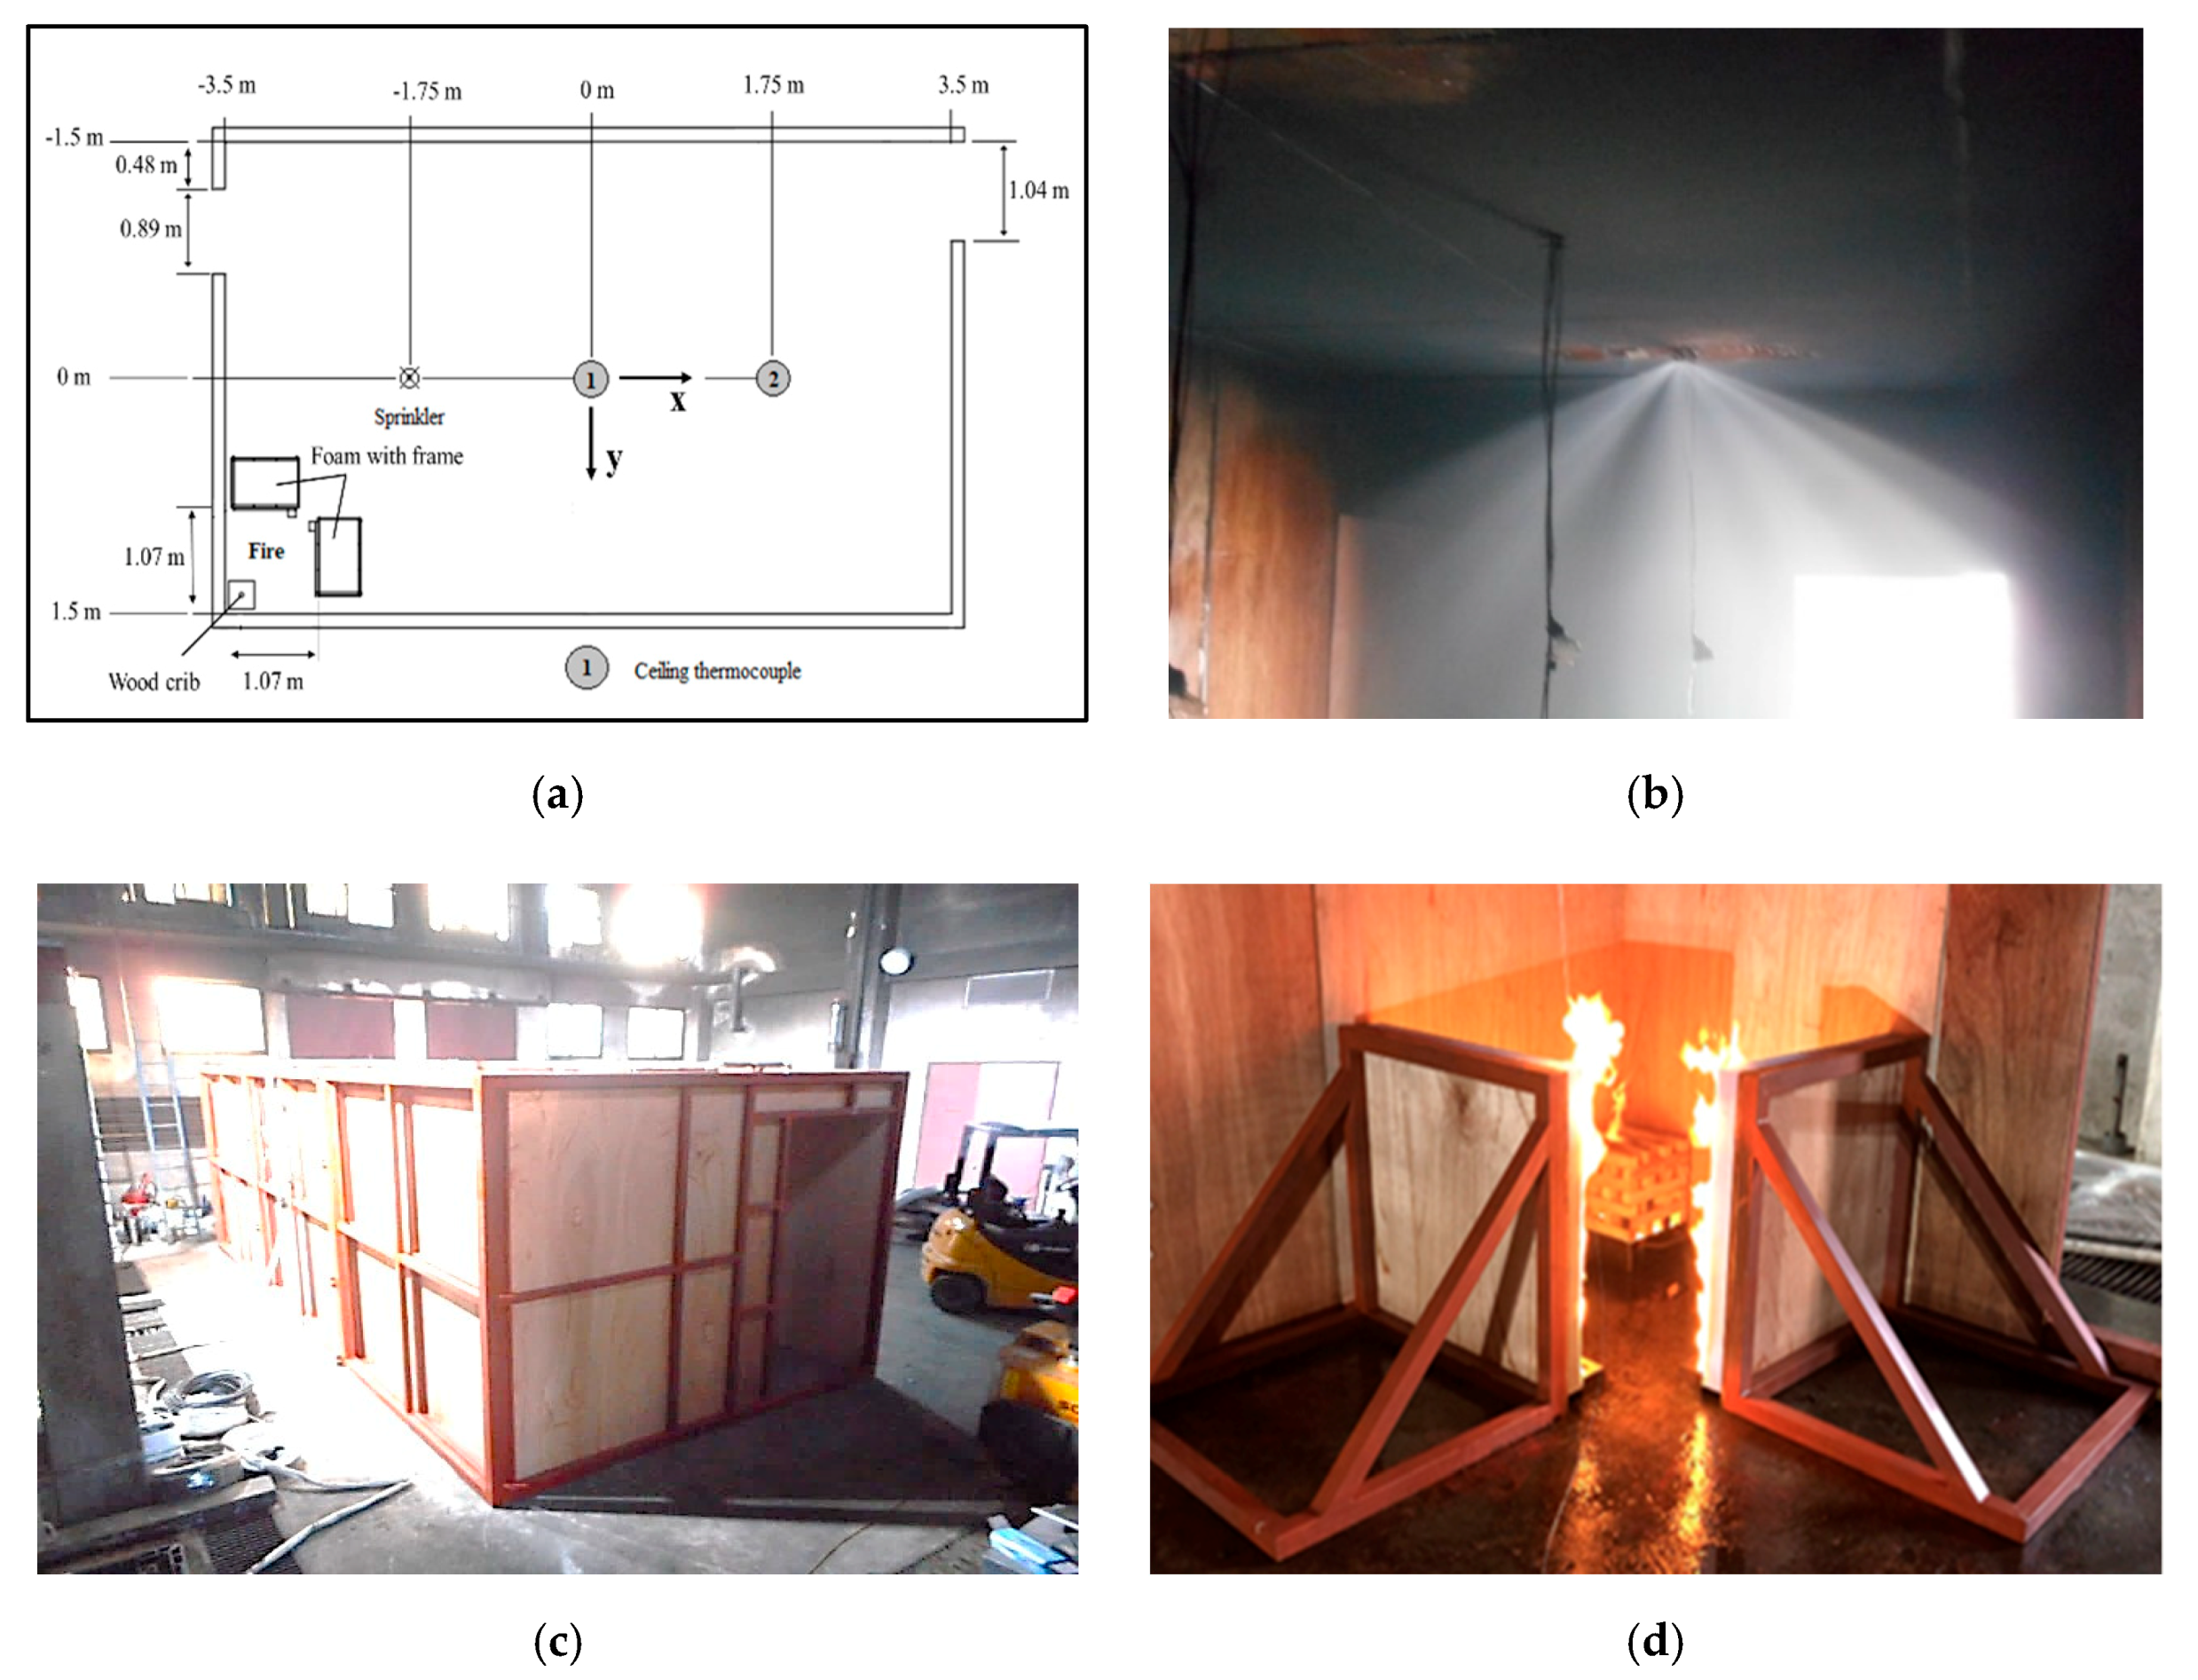
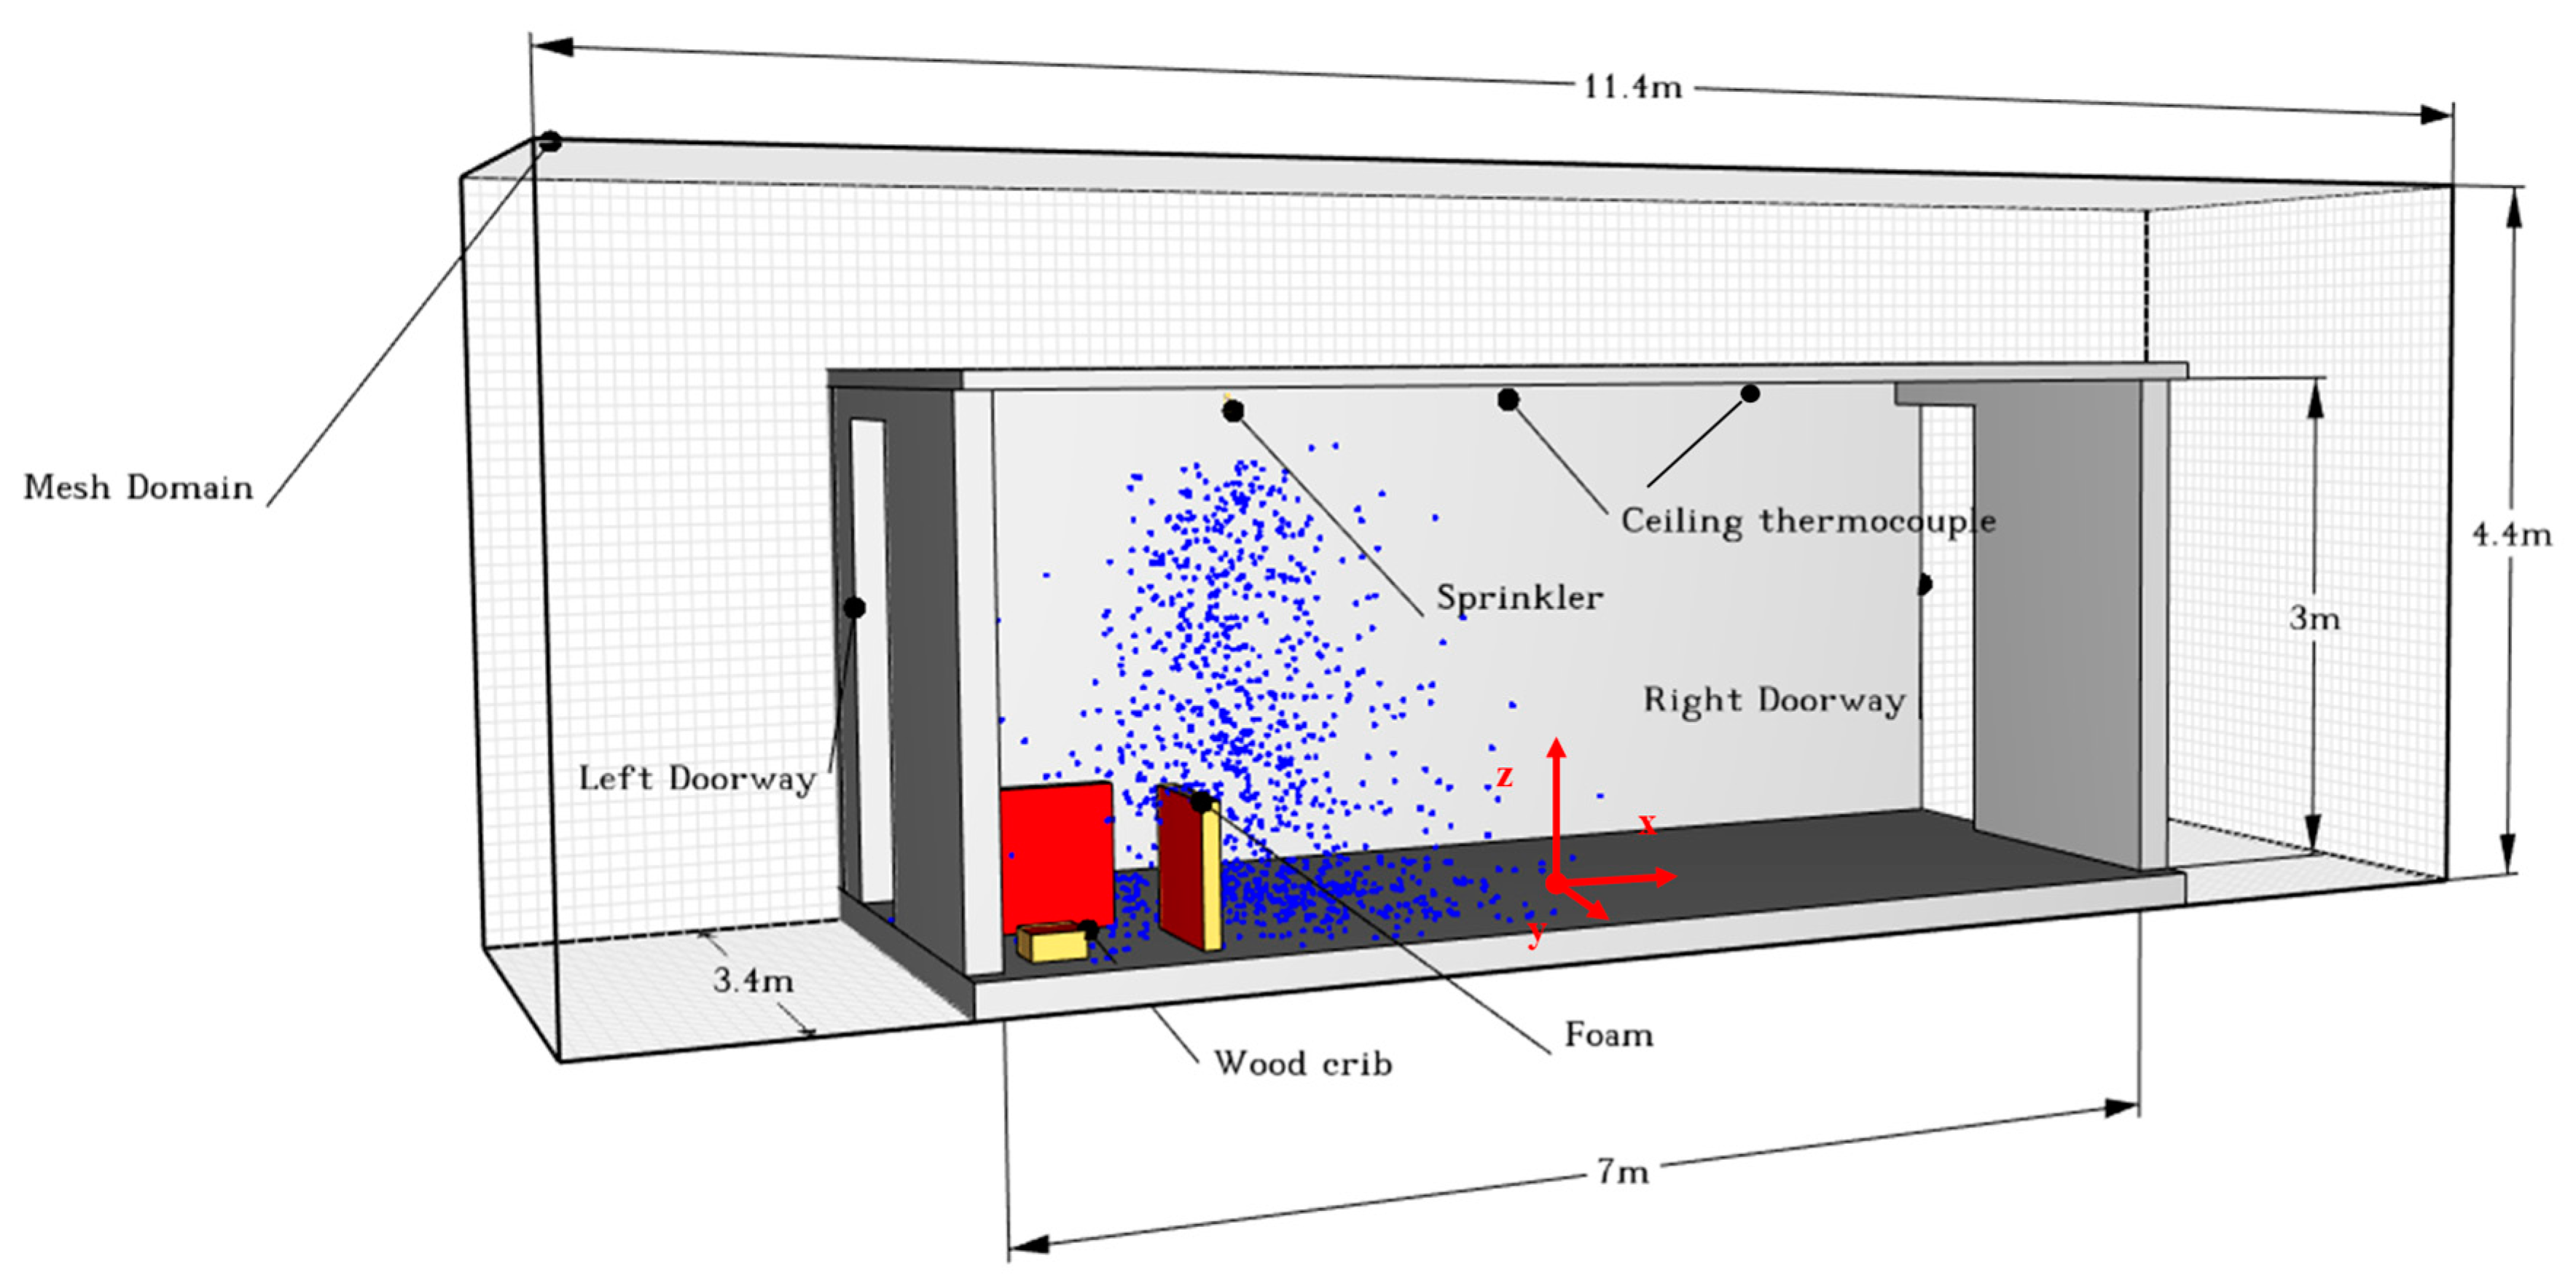
In order to obtain data for calibrating the suppression model, a fire experiment was conducted in a compartment using a water sprinkler. The measurement used to collect ceiling temperature in a compartment. The compartment had dimensions of 3 m (W) × 7 m (L) × 3 m (H) coved by gypsum board in the ceiling, plywood walls, and a concrete floor. Two doorways on opposite walls provided for ventilation. The left doorway was 0.89 m (width) × 2.8 m (height), and the right doorway was 1.04 m (width) × 2.8 m (height) (Figure 1). A pendant water sprinkler was installed 76 mm below the ceiling. The manufacturer supplied the glass bulb sprinkler with an activation temperature of 68 °C and a K-factor of K = 50 Lpm/bar0.5. The operation pressure was 1 bar. The spray angle of 10 to 80 degrees was estimated by image analysis. Two K-type thermocouples (range: −200 to +1000 °C, accuracy is ±1 °C) were installed 76 mm from the ceiling to measure the temperature. The ceiling temperature data were recorded by a portable data logger, a midi LOGGER GL240, every second (the measurement accuracy: 0.05% for the K-type thermocouple).
The fire source consisted of a wood crib and polyether foam, described in detail in ISO 6182-10 [17]. The wood crib, with dimensions of 305 mm × 305 mm × 152 mm, was made with fir lumber of 3 kg and ignited by a pan of heptane. The pure polyether foam of 810 mm × 760 mm × 76 mm was ignited by cotton wicks soaked in heptane. The polyether foam glued to a thick plywood backing and assembled to a steel frame for support. The fire source was placed in the corner of the compartment. The wood crib was positioned 5 mm from each wall (Figure 1a,d).
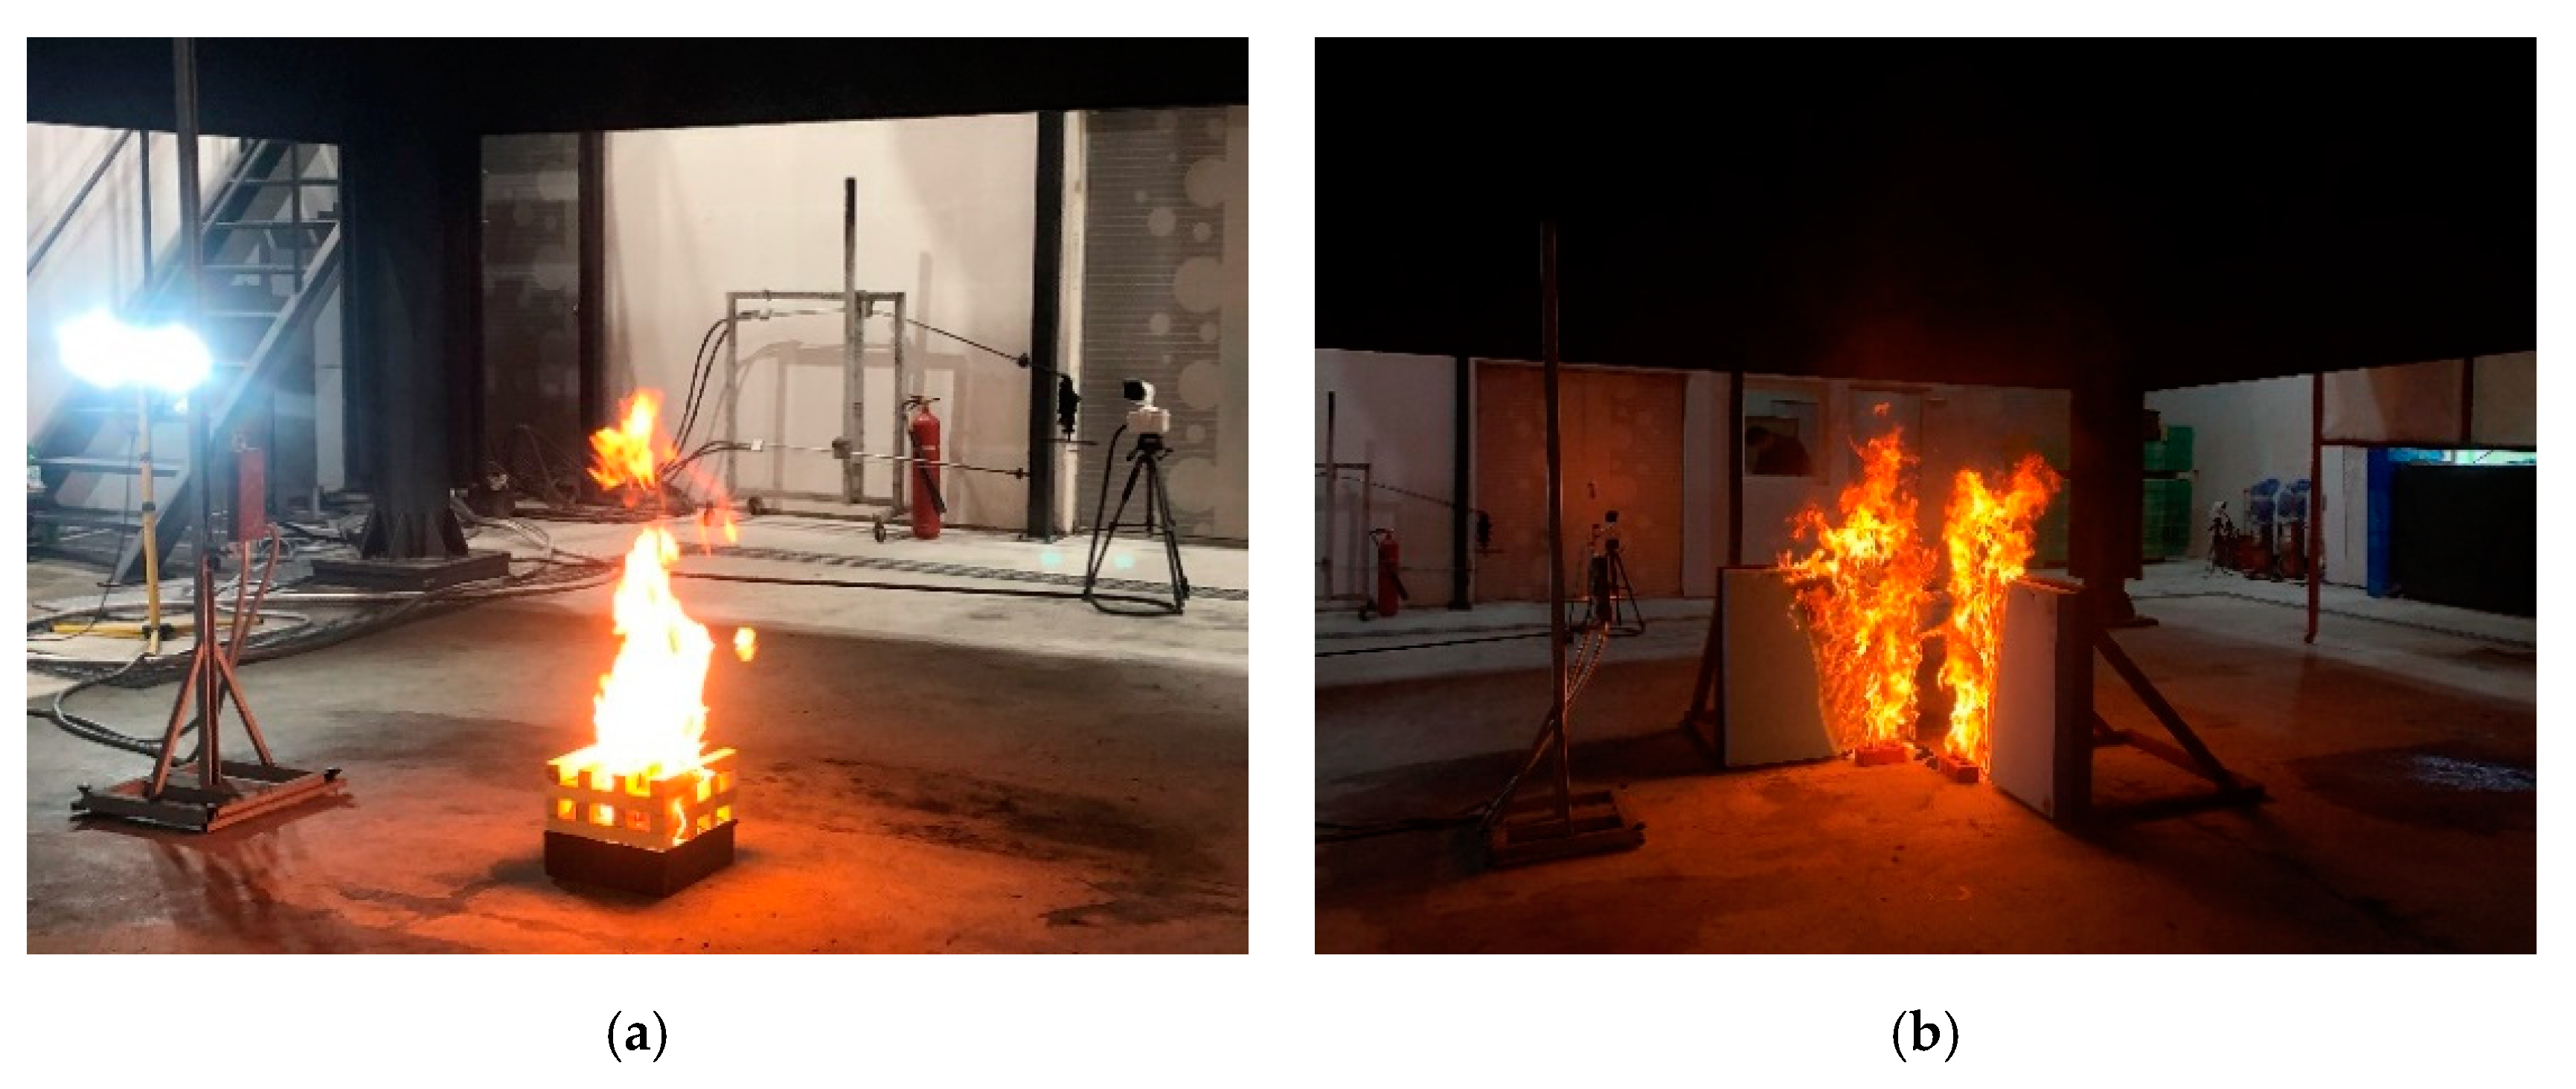
The heat release rate of the fire source could not be determined directly during the compartment fire experiment. Therefore, the HRR measurement was conducted separately without the effect of sprinkler spray. Figure 2 shows the wood crib and polyether foam were burnt individually under a large-scale calorimeter (LSC), applicable up to 3 MW (ISO 13784-1), to determine the unsteady heat release rate. The principle of LSC is that it is based on the amount of heat released from a burning sample and is proportional to the amount of oxygen consumed during the combustion. The dimensions and weight of the wood crib and polyether foam were the same in the compartment test.
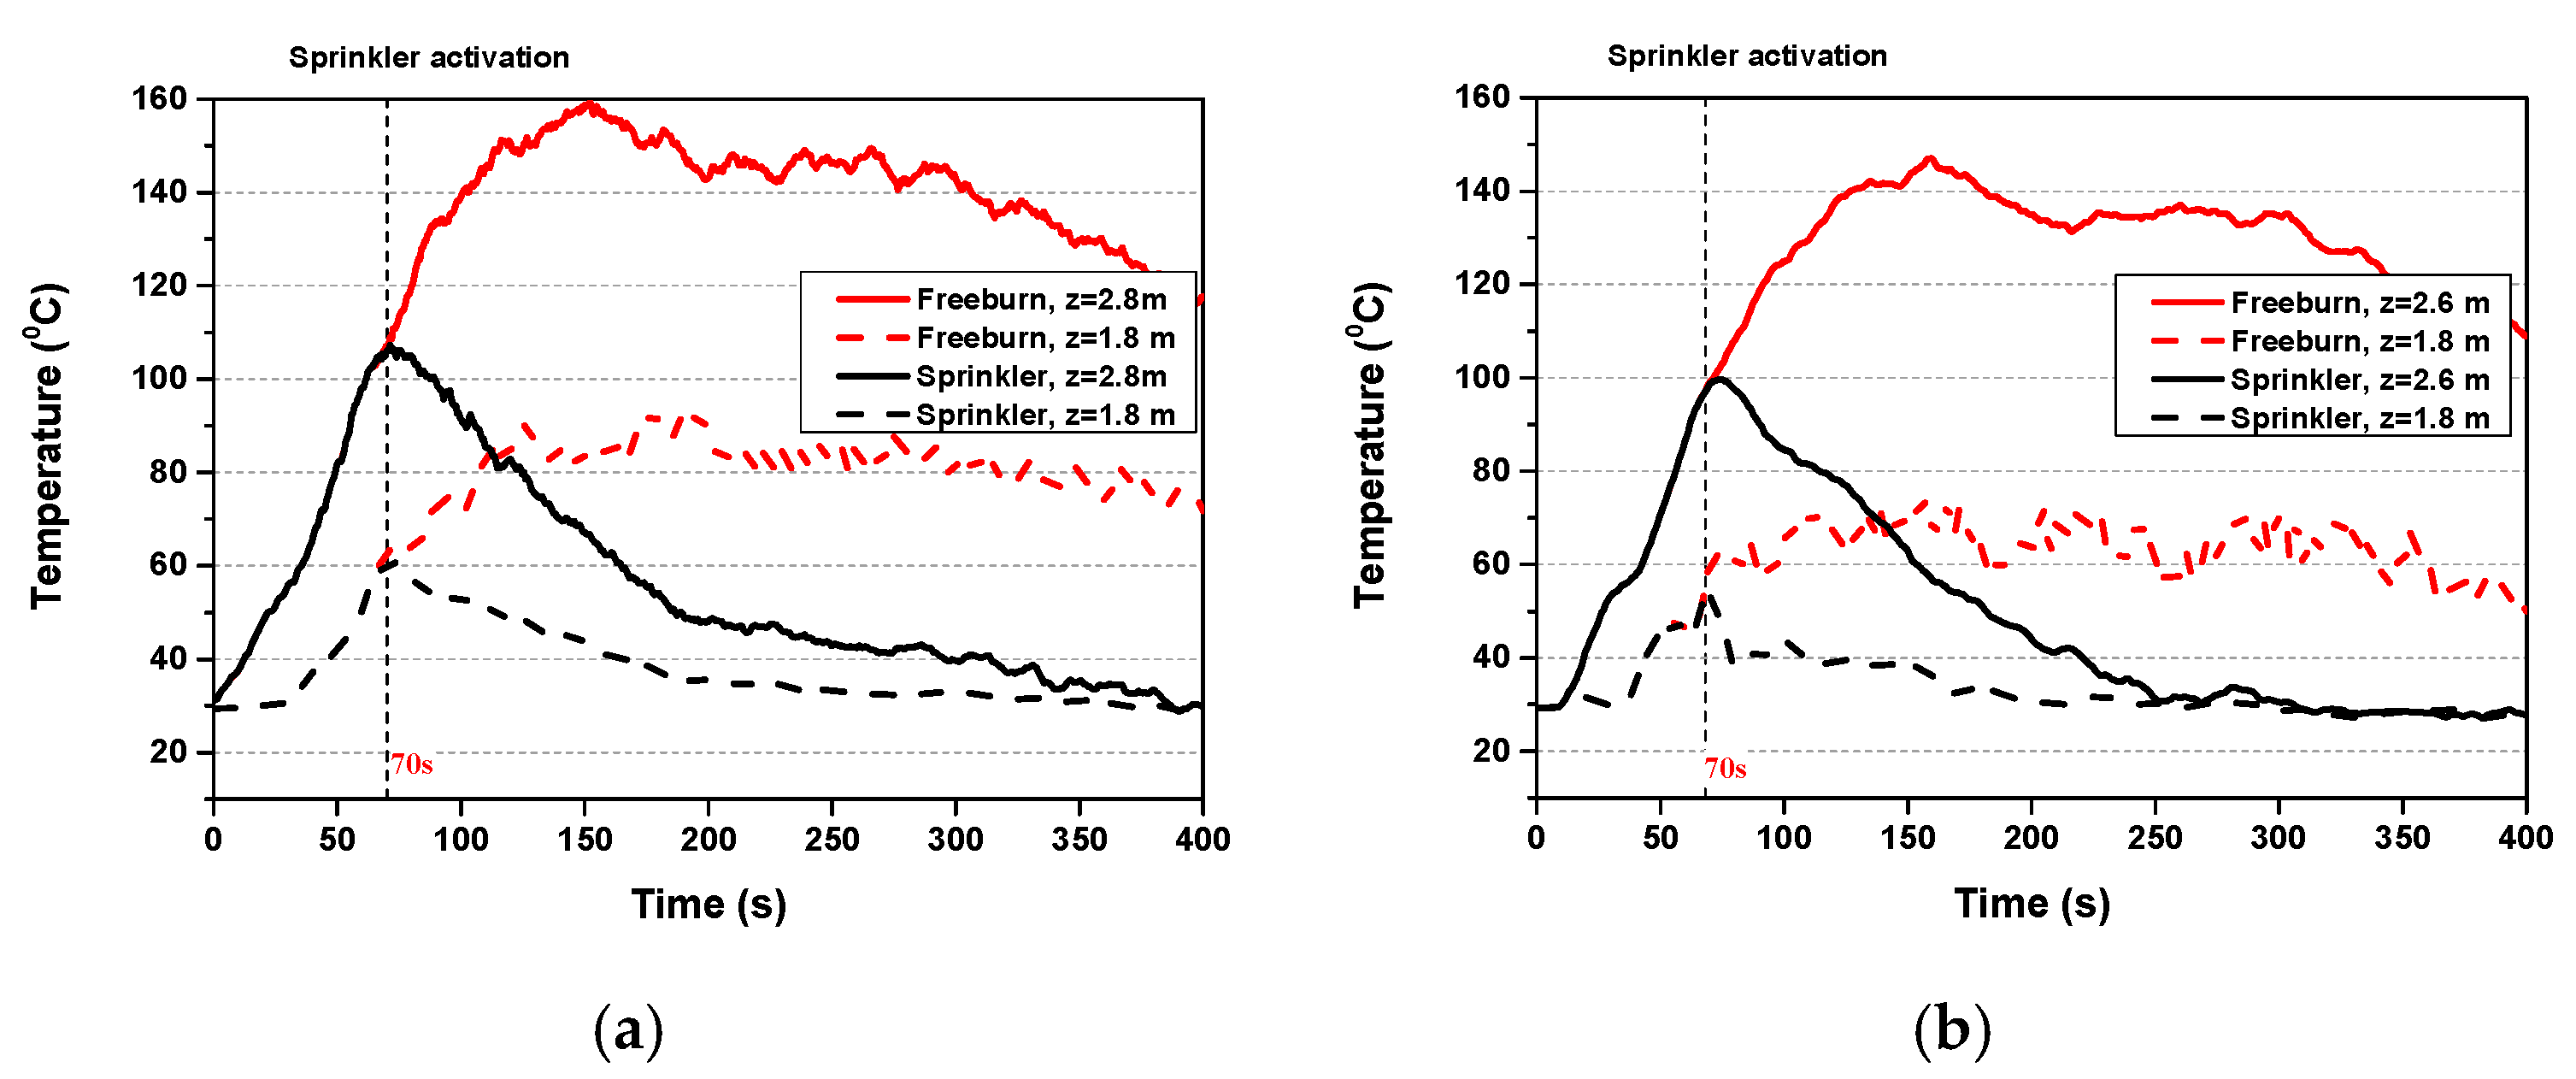
The experimental results of HRR in the free burn and ceiling temperature in the compartment fire equipped with a sprinkler are shown in Figure 3.

4. Numerical Detail

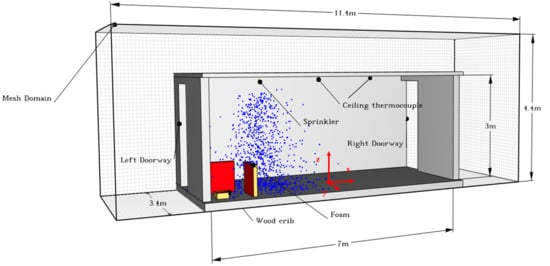
Figure 4 shows the computational domain coved the compartment test with dimensions of 3.4 m (W) × 11.4 m (L) × 4.4 m (H). The compartment geometry was made based on experiments. The wood crib and polyether foam modeled simple obstructions of the same dimension in the experiment. The fire source presented as burner with a specified heat release rate per unit area (HRRPUA) in units of kW/m2. The HRR assigned to the top surface of the wood crib and interior surface of polyether foam (red surface, Figure 2). Sprinkler and ceiling thermocouples were installed in the same location in the experiment. The boundary conditions assigned “OPEN” for the computational domain, and “ADIABATIC” to the wall and floor. The ambient temperature was 29 °C, in agreement with the experiments. A Cartesian coordinate system indicated at the center of the compartment for convenience in the analysis.
In order to model a fire suppression correctly, numerical sprinkler spray parameters need to be specified in detail. Those parameters include the water flow rate, droplet diameter, initial droplet velocity, spray angle, and offset distance. Because of the limit of apparatus, there was a lack of data on sprinkler spray in the experimental report. Therefore, the necessary estimations have been made based on the experimental work and various studies reported in the literature [18,19].
The water flow rate of any sprinkler can be calculated based on the K-factor and pipe pressure by the equation:
m ˙ = K p
where m ˙ is the water flow rate in L/min, K is the K-factor for the sprinkler L/(min.bar0.5) which can be obtained from the manufacturer and p is the pressure of the pipe in Bar.
Water spray usually includes various sizes of spherical droplets. The cumulative volume fraction (CVF) is specifies the size distribution of water droplets. This function indicates the fraction of the total mass carried by droplets less than the given diameter. The CVF for a sprinkler spray is represented by a combination of log-normal and Rosin–Rammer distributions [12]:
F ( D ) = { 1 2 π 0 D 1 σ D exp ( [ ln ( D D v , 0.5 ) ] 2 2 σ 2 ) d D       ( D D v , 0.5 )     1 exp [ 0.693 ( D D v , 0.5 ) γ ]                                 ( D > D v , 0.5 )
where Dv,0.5 is the median volumetric droplet diameter, µm (i.e., half the mass is carried by droplets with diameters of Dv,0.5 or less), γ and σ are empirical constants equal to approximately 2.4 and 0.48, respectively [12]. The median droplet diameter, Dv,0.5, is estimated using the formula reported by Yu [19]:
D v , 0.5 D = C s p W e 1 / 3
W e = ρ d u d 2 D σ d
where D is the orifice diameter of the sprinkler. ρ d is the density of water in kg/m3, u d is the initial droplet velocity in m/s, and σ d is the water surface tension in N/m. Analysis of Sheppard’s [18] data provided an average value of C s p approximately 1.53 for sprinklers test.
Sheppard [18] used particle image velocimetry (PIV) and phase Doppler interferometry (PDI) to measure the initial droplet sizes and velocities for the various type of sprinklers. The initial droplet velocity had an average measurement at 0.6 of p / ρ d   . The PIV measurements were taken from the spray atomization length of 0.2 m from the sprinkler orifice, the distance at which no more droplet breaks up downstream from this point.
The angles of the spray were estimated from experimental work providing a 10–80° spray angle. The activation temperature was 68 °C. All sprinkler parameters are summarized in Table 1.
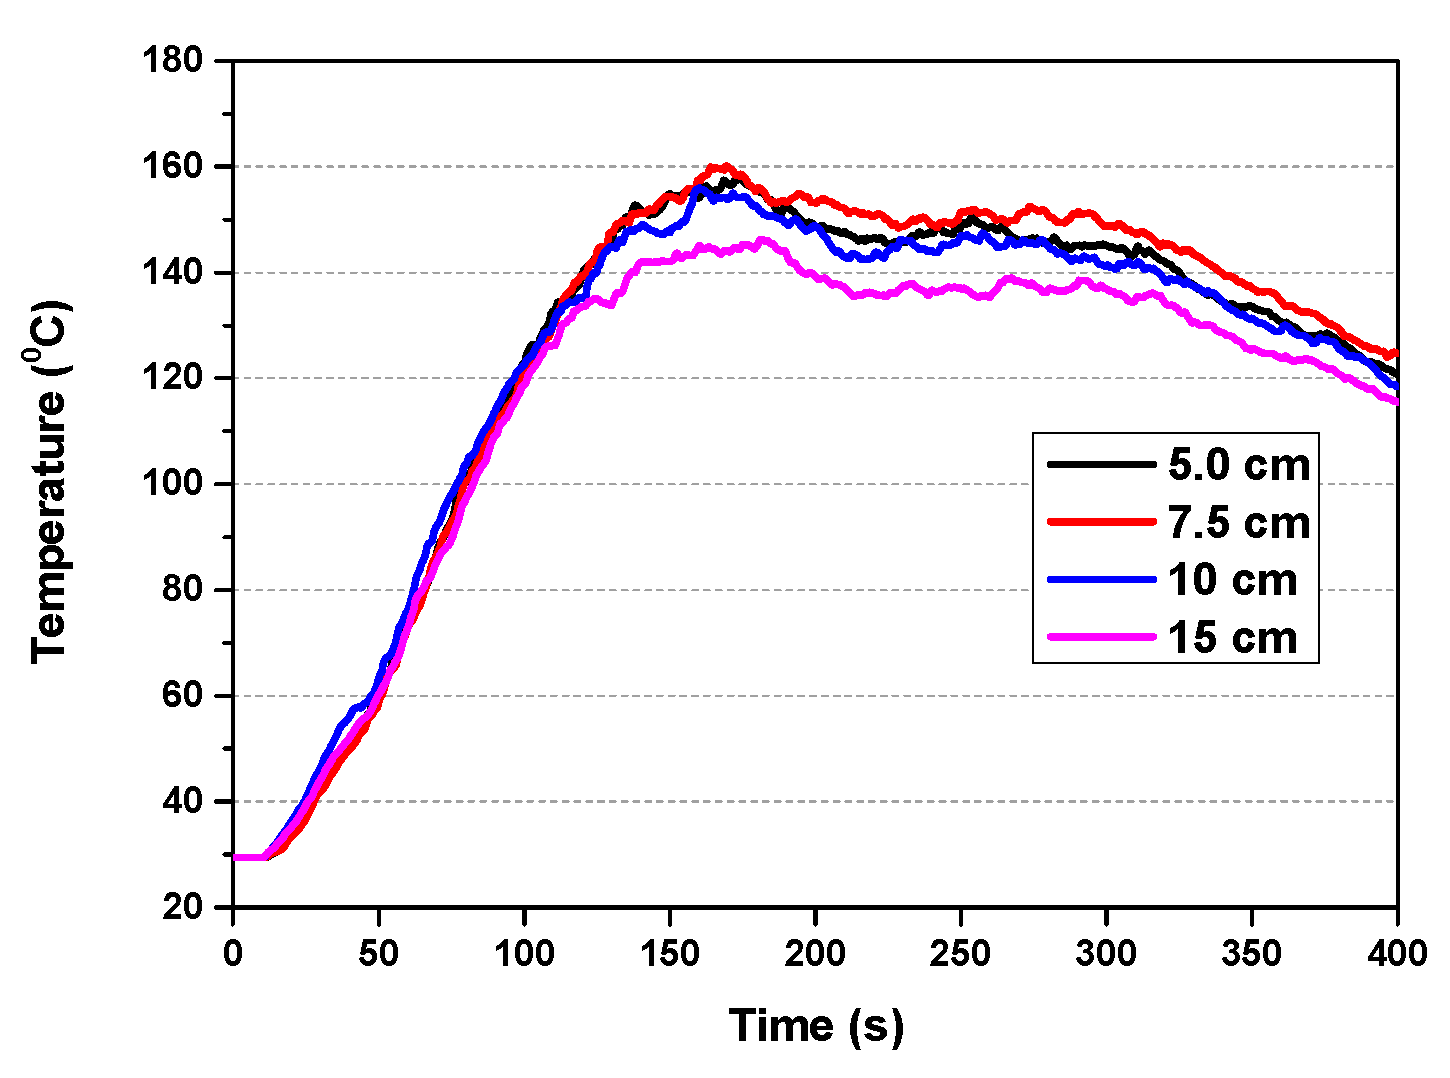
Grid size is important to verify in numerical simulation, because it directly influences results. In theory, a very small grid can give the accuracy of the calculation, but the time may be wasted unnecessarily. When the deviation between the neighboring results is small enough, the grid can be considered as an independent grid. Before applying the sprinkler simulation, the independent grid tests for the free burn (without sprinkler) were conducted. Figure 5 shows the temperature at point 1 in the compartment with four different grids (15 cm, 10 cm, 7.5 cm, 5 cm). The result of 15 cm had larger deviations than the results of 10 cm, 7.5 cm, and 5 cm. Therefore, the grid size of 10 cm was chosen in this paper. The grid selection was the same in the simulation of sprinkler interaction with a fire ceiling jet by O’Grady and Novozhilov [5].

5. Result and Discussion

5.1. Optimal Extinguishing Coefficient

The extinguishing coefficient is not determined by experimental correlation, as mention by Hamins and McGrattan [12]. Instead, the suppression model is calibrated to find the optimal extinguishing coefficient (α value) in this study. When sprinkler activation, the water of sprinkler strikes to fire source and make a reduction on the burning rate. The HRR reduction with a certain water distribution depends on the α value in Equations (1) and (2). In order to define the α value, the comparison of ceiling temperature is conducted.
Figure 6 shows the ceiling temperature over time measured in simulation with various α values and experimental data at points 1 and 2. As α value varies between 0.5 m2/(kg·s) and 4.0 m2/(kg.s), the ceiling temperature of numerical simulation decreases with an increasing extinguishing coefficient. Comparing ceiling temperature, the value of the extinguishing coefficient α = 3.0 m2/(kg·s) provides the best fit temperature between numerical and experimental data at both points. These comparisons demonstrate that the fire suppression model in FDS can capture the features of fire characteristics under the effect of sprinkler spray.
The effect of extinguishing coefficients on the HRR after activating sprinkler is shown in Figure 7. The HRR falls more instantly when sprinkler activates. The higher the alpha value, the greater the HRR decreases. As optimal α = 3.0, it was observed that HRR stops growing to 165 kW at 70 s and then reduces rapidly to 10 kW at 400 s. The suppression model was calibrated in the prediction of the HRR affected by a water spray. Therefore, this model can be used to investigate the fire characteristics in the compartment.

5.2. Temperature and Flow Field

Analysis of the temperature distribution and velocity field was necessary to understand the interaction between sprinkler spray and the smoke layer during fire suppression. The numerical view of the temperature and velocity field of the smoke layer during fire suppression is shown in Figure 8.
Figure 8a,c,e presents the temperature distribution with different times in the vertical plane y = 0 m. A smoke layer was formed under the ceiling and flowed out across the doors. Temperature contours showed the higher temperature distributed gradually from the bottom to the top and from left to right in the smoke layers (Figure 8a). There were great differences in temperature distribution when the sprinkler activated. Due to the reduction of HRR and the cooling effect on smoke, the temperature would decrease apparently over time. The hot layer rapidly reduced both the temperature value and the area as shown in Figure 8c,e.
The smoke movement and velocity vector with different times in the vertical plane y = 0 is shown in Figure 8b,d,f. There was a clear smoke layer at z = 1.7 m above the floor. Immediately, when the sprinkler was activated, the impact of the water spray on the smoke movement was observed. The smoke layer surrounding the sprinkler was entrained into the spray and flowed downward with the water spray due to the drag force (A). Smoke logging happened [20]. At that moment, fresh air entered into the inner water spray due to the buoyance force (B). The cone shape of the smoke logging was formed with symmetry right below the sprinkler location. The lower temperature due to the cooling and replacement of fresh air inside the smoke cone is clearly shown in Figure 8c.
After that, under the effect of the sprinkler spray, smoke logging combined with fresh air-entraining from the left doorway and swirled back inside the water spray (C). Simultaneously, it pushed the other side of the smoke logging to the right region, further away from the center sprinkler spray (D). The symmetrical cone of the smoke logging was broken; local smoke vortexes were formed. Smoke logging occurred more strongly, and it widely spreads towards the right doorway (Figure 8f).

5.3. Effect of Sprinkler Spray on Smoke Spread

In the event of a building fire, the smoke spread directly affects tenability criteria in the means of egress. The available safe egress time depends on how the smoke spreads from compartment to compartment more than considering the fire itself in many cases. Therefore, the ability to predict the impact of a sprinkler on the smoke spread from the compartment would be a valuable engineering tool for use with performance-based safety design. The smoke temperature, velocity, and mass flow out of the doorway are important factors in considering smoke spread during fire suppression.
The smoke movement has different behavior in different positions depending on the sprinkler spray region as well as the structure of the compartment. In order to investigate smoke spreading in detail, the numerical devices were measured inside the water spray region and the doorway, Figure 9. The numerical results of sprinkler case were compared to the case without the sprinkler, i.e., free burn.
Figure 10 shows the change in temperature over time with different locations: inside spray with the height of 2.8 m, 1.8 m (location A), and a centerline of the right doorway (location B) with the height of 2.6 m and 1.8 m in two cases of sprinkler and free burn. In the sprinkler case, the temperature of the smoke layer varied from 50 °C to 110 °C just before sprinkler activation at both locations. Due to the influence of water spray, the temperature of the smoke layer reduced rapidly to an ambient temperature after 200 s of activating the sprinkler. The slopes of the temperature at the locations A and B were similar, involving the reduction of HRR and cooling by water spray, whereas the smoke temperature varied from 60 °C to 160 °C over time in the free burn case. It is much higher than the sprinkler case.
Figure 11 illustrates the variation in terms of velocity at the same locations in temperature measurement. In location A, variation in smoke velocity became over 2 m/s with the sprinkler activation due to the direct effect of water spray. As observed, however, most smoke flows downward to the floor because of the smoke logging phenomenon. Therefore, smoke velocity reduction in the horizontal direction can be observed at the right doorway. The smoke velocity decreased immediately with sprinkler activation at location B, from 1.8 m/s to 0.5 m/s at 300 s. Whereas in the free burn case, the velocity of the smoke layer varied from 0.25 m/s to 1.3 m/s at location A. Due to the narrow geometry of the right doorway, the smoke velocity accelerated and varied from 0.5 m/s to over 2.0 m/s at location B (Figure 11b). It was much higher than the smoke velocity in the sprinkler case at the near ceiling.
The mass flow rate of the smoke layer flowing out was measured in the right doorway as shown in Figure 12. The sprinkler activation caused a significant reduction in the mass flow rate leaving the compartment. The mass flow rate reduced from 1.0 kg/s to 0.6 kg/s for 130 s after activating the sprinkler. The reasons were the reduction of HRR as well as smoke logging inside the compartment. Meanwhile, in the free burn case, the mass flow rate reached 1.2 kg/s at 100 s and kept almost constant afterward. It was more than twice that in the case of the sprinkler from 200 s.

6. Conclusions

A numerical study on the fire characteristics during fire suppression by a sprinkler was conducted using FDS. The following conclusions were made:
  • The extinguishing coefficient of 3.0 was chosen for the fire suppression model in this study. Under the effect of sprinkler spray, the HRR stopped growing at 165 kW at 70 s and then reduced rapidly to 10 kW at 400 s;
  • The hot upper layer rapidly reduced both the temperature value and the area of the layer during fire suppression. The smoke layer was formed with a symmetrical cone right below the sprinkler, revealing the smoke logging phenomena. Under the influence of sprinkler spray, the combination of smoke logging and fresh air-entraining from the left door pushed the smoke logging to occur strongly in the right region afterwards;
  • Heat Release Rate reduction and smoke logging phenomena inside the compartment presented a significant effect of the sprinkler spray on the smoke spread in the doorway. The temperature of the smoke layer through the doorway reduced to an ambient temperature of 200 s after activating the sprinkler. The smoke velocity inside the sprinkler spray could reach over 2 m/s. At the doorway, however, the smoke velocity reduced to 0.5 m/s at 300 s, much lower than the 2 m/s in the free burn case. The mass flow rate through the doorway in the sprinkler case reduced to half compared to the free burn case at 200 s;
  • The extinguishing coefficient in this study can be used as a first step trial for other researchers who want to apply the fire suppression model. However, the fire suppression model defined by the calibration method depends not only on the material properties and geometry of solid fuels but also on water spray distribution. Therefore, several important spray characteristics, such as water droplet size, spray angle, and initial velocity, need attention when referring to an extinguishing coefficient. Sensitive to these factors, we will further investigate.

Author Contributions

Conceptualization, H.T.K., J.T.K.; methodology, H.T.K., H.S.R.; software, H.T.K.; validation, H.T.K., J.T.K. and H.S.R.; formal analysis, H.T.K., J.H.K., H.S.R.; investigation, H.T.K., J.T.K.; resources, J.H.K.; data curation, H.T.K., J.H.K.; writing—original draft preparation, H.T.K., T.D.Q.; writing—review and editing, H.S.R.; supervision, H.S.R.; project administration, H.S.R. All authors have read and agreed to the published version of the manuscript.

Funding

This research was funded by the National Research Foundation of Korea (NRF) (NRF-2019R1F1A1061741), and Research and Development to Enhance Firefighting Response Ability (NFA002-007-01010002-2018).

Acknowledgments

This research was supported by Chung-Ang University Young Scientist Scholarship (CAYSS) Program.

Conflicts of Interest

The authors declare no conflict of interest.

References

  1. Novozhilov, V.; Harvie, D.; Green, A.R.; Kent, J.H. A computational fluid dynamic model of fire burning rate and extinction by water sprinkler. Combust. Sci. Technol. 1997, 123, 227–245. [Google Scholar] [CrossRef]
  2. Novozhilov, V.; Harvie, D.; Kent, J.; Apte, V.; Pearson, D. A computational fluid dynamics study of wood fire extinguishment by water sprinkler. Fire Saf. J. 1997, 29, 259–282. [Google Scholar] [CrossRef]
  3. Nam, S. Development of a computational model simulating the interaction between a fire plume and a sprinkler spray. Fire Saf. J. 1996, 26, 1–33. [Google Scholar] [CrossRef]
  4. Hua, J.; Kumar, K.; Khoo, B.C.; Xue, H. A numerical study of the interaction of water spray with a fire plume. Fire Saf. J. 2002, 37, 631–657. [Google Scholar] [CrossRef]
  5. O’Grady, N.; Novozhilov, V. Large eddy simulation of sprinkler interaction with a fire ceiling jet. Combust. Sci. Technol. 2009, 181, 984–1006. [Google Scholar] [CrossRef]
  6. Zhang, C.; Chow, W.K. Numerical studies on the interaction of sprinkler and smoke layer. Procedia Eng. 2013, 62, 453–462. [Google Scholar] [CrossRef] [Green Version]
  7. Chen, Y.; Su, C.; Tseng, J.; Li, W. Experimental and numerical analysis of the cooling performance of water spraying systems during a fire. PLoS ONE 2015, 10, e0118306. [Google Scholar] [CrossRef] [PubMed] [Green Version]
  8. Tang, Z.; Fang, Z.; Sun, J.; Beji, T.; Merci, B. Computational fluid dynamics simulations of the impact of a water spray on a fire-induced smoke layer inside a hood. J. Fire Sci. 2018, 36, 380–405. [Google Scholar] [CrossRef] [Green Version]
  9. Wang, Y.; Meredith, K.; Zhou, X.; Chatterjee, P.; Xin, Y.; Chaos, M.; Ren, N.; Dorofeev, S. Numerical simulation of sprinkler suppression of rack storage fires. Fire Saf. Sci. 2014, 11, 1170–1183. [Google Scholar] [CrossRef]
  10. Yuan, L.; Smith, A.C. Numerical modeling of water spray suppression of conveyor belt fires in a large-scale tunnel. Process Saf. Environ. Prot. 2015, 95, 93–101. [Google Scholar] [CrossRef] [PubMed] [Green Version]
  11. McGrattan, K.B.; Forney, G.P. Fire Dynamics Simulator User’s Guide, 6th ed.; NIST Special Publication 1019: Gaithersburg, MD, USA, 2018. [Google Scholar]
  12. McGrattan, K.; Baum, H.R.; Rehm, R.G.; Hamins, A.; Forney, G.P. Fire Dynamics Simulator-Technical Reference Guide, 6th ed.; NIST Special Publication 1018-1: Gaithersburg, MD, USA, 2018. [Google Scholar]
  13. Hietaniemi, J.; Hostikka, S.; Vaari, J. FDS Simulation of Fire Spread—Comparison of Model Results with Experimental Data; VTT Technical Research Centre of Finland: Espoo, Finland, 2004. [Google Scholar]
  14. Rinne, T.; Hietaniemi, J.; Hostikka, S. Experimental Validation of the FDS Simulations of Smoke and Toxic Gas Concentrations; VTT Technical Research Centre of Finland: Espoo, Finland, 2007; ISBN 9789513866174. [Google Scholar]
  15. Vaari, J.; Hostikka, S.; Sikanen, T.; Paajanen, A. Numerical Simulations on the Performance of Waterbased Fire Suppressions Systems; VTT Technical Research Centre of Finland: Espoo, Finland, 2012; ISBN 9789513878825. [Google Scholar]
  16. Yu, H.; Lee, J.; Kung, H.; Brown, W. Suppression of rack-storage fires by water. Fire Saf. Sci. 1994, 4, 901–912. [Google Scholar] [CrossRef] [Green Version]
  17. ISO. ISO 6182-10:2006 Fire Protection-Automatic Sprinkler Systems—Part 10: Requirements and Test Methods for Domestic Sprinklers; ISO: Geneva, Switzerland, 2006. [Google Scholar]
  18. Sheppard, D. Spray Characteristics of Fire Sprinklers. Ph.D. Thesis, Northwestern University, Evanston, IL, USA, 2002. [Google Scholar]
  19. You, H.Z. Investigation of spray patterns of selected sprinklers with the fmrc drop size measuring system. Fire Saf. Sci. 1986, 1, 1165–1176. [Google Scholar] [CrossRef] [Green Version]
  20. Bullen, M.L. The effect of a sprinkler on the stability of a smoke layer beneath a ceiling. Fire Technol. 1977, 13, 21–34. [Google Scholar] [CrossRef]
Figure 1. Detailed drawings of the compartment in the experiment: (a) test compartment layout; (b) sprinkler spray; (c) test compartment; and (d) fire source.
Energies 13 03099 g001
Figure 2. Independent measurement of heat release rate for (a) the wood crib and (b) polyether foam.
Energies 13 03099 g002
Figure 3. Experiment results: (a) heat release rate in the free burn and (b) ceiling temperature in the compartment with sprinkler activation.
Energies 13 03099 g003
Figure 4. 3D schematic view of the compartment modeling.
Energies 13 03099 g004
Figure 5. Ceiling temperature at point 1 with different grid size without sprinkler activation.
Energies 13 03099 g005
Figure 6. Variation of ceiling temperature with different extinguishing coefficients: (a) Point 1 and (b) Point 2.
Energies 13 03099 g006
Figure 7. Variation of heat release rate for different extinguishing coefficients.
Energies 13 03099 g007
Figure 8. Temperature distribution and vector field of the smoke layer in vertical plane y = 0 m: (a) temperature distribution before sprinkler activation, 70 s; (b) velocity field before sprinkler activation, 70 s; (c) temperature distribution after sprinkler activation, 100 s; (d) velocity field after sprinkler activation, 100 s; (e) temperature distribution at 150 s; (f) velocity field at 150 s.
Energies 13 03099 g008
Figure 9. The location of numerical devices to investigate smoke spread in the compartment.
Energies 13 03099 g009
Figure 10. Variation in the temperature at (a) location A; (b) location B.
Energies 13 03099 g010
Figure 11. Variation in the velocity at (a) location A and (b) location B.
Energies 13 03099 g011
Figure 12. Variation in the mass flow rate of the smoke layer through the right doorway.
Energies 13 03099 g012
Table 1. Sprinkler parameters and estimated sprinkler spray parameters.
Sprinkler ParameterValue
Flow rate50 L/min
Velocity6.01 m/s
Droplet size954 µm
Atomization distance0.2 m
Angles10–80°
Activation temperature68 °C

