Article

Heat Exchanger Sizing for Organic Rankine Cycle

School of Mechanical and Design Engineering, University of Portsmouth, Portsmouth PO1 3DJ, UK
*
Author to whom correspondence should be addressed.
Energies 2020, 13(14), 3615; https://doi.org/10.3390/en13143615
Submission received: 6 May 2020 / Revised: 8 July 2020 / Accepted: 9 July 2020 / Published: 14 July 2020
(This article belongs to the Special Issue Applications for the Organic Rankine Cycle)

Abstract

:
Approximately 45% of power generated by conventional power systems is wasted due to power conversion process limitations. Waste heat recovery can be achieved in an Organic Rankine Cycle (ORC) by converting low temperature waste heat into useful energy, at relatively low-pressure operating conditions. The ORC system considered in this study utilises R-1234yf as the working fluid; the work output and thermal efficiency were evaluated for several operational pressures. Plate and shell and tube heat exchangers were analysed for the three sections: preheater, evaporator and superheater for the hot side; and precooler and condenser for the cold side. Each heat exchanger section was sized using the appropriate correlation equations for single-phase and two-phase fluid models. The overall heat exchanger size was evaluated for optimal operational conditions. It was found that the plate heat exchanger out-performed the shell and tube in regard to the overall heat transfer coefficient and area.

1. Introduction

With the continuous increase in global population over the past decade, energy demand is estimated to increase at an average rate of 1.3% annually [1]. Historically, finite non-renewable sources such as coal, oil and natural gas were considered a solution to meeting energy demands. However, the over-use of these resources has resulted in the emission of greenhouse gases into the atmosphere causing severe consequences to the environment such as global warming. It is vital for alternative solutions and technologies to be introduced to reduce and prevent further damage to the environment.
At a time when global energy consumption is predicted to increase by almost 50% between 2018 and 2050 [2], nearly 200 countries throughout the world signed up to the Paris Agreement on climate change to limit temperature increases to 1.5 °C, thus requiring significant reductions in CO2 emissions [3]. There has been a growth in renewable energy generation, such as wind [4] and solar power [5]. However, to fully address the two conflicting requirements of higher energy demand and reduced CO2 emissions, it is also important to achieve maximum efficiency from the energy which is used. Low-grade waste heat alone accounts for at least 50% of the total heat generated in industry [6] and has been shown to represent 9.5% of all industrial energy consumption in the EU [7]. In conventional power generation systems, approximately half the resources are wasted as a result of power conversion limitations. Waste heat recovery, therefore, provides economic and environmental benefits as it encourages greater overall efficiency, which consequently leads to lower demand for the resources required for power generation and lower CO2 emissions.
The Organic Rankine Cycle (ORC) is a power cycle with an organic working fluid which uses a low-grade heat source to generate power. There is a range of Waste Heat Recovery (WHR) applications where ORCs can be applied, for example, within industrial processes [6] and IC engines [8]. In order to utilise this energy successfully, an appropriate working fluid has to be selected [9]. The working fluid is the medium that enables the conversion of heat energy to electrical energy through expansion in a turbine/expander. Over the years there have been countless studies investigating the impact working fluid characteristics have on the overall ORC performance [10]. Due to the abundance of low grade heat sources, many researchers focused on working fluids suitable for temperature ranges such as 100 °C to 250 °C [11], 90 °C to 120 °C [12] and approximately 125 °C [13]. Darvish et al. [14] analysed energy and exergy changes for different working fluids in a regenerative ORC using a heat source of 120 °C. They found that, from the fluids investigated, R134a (HFC) and iso-butane (HC) were the optimum fluids with exergy efficiency values of 21.3% and 21.9%, respectively. However, R134a has a GWP of 1300 and iso-butane has safety implications relating to flammability. Alternatively, R1234yf (HFO) has been suggested as a viable replacement for R134a with similar thermodynamic properties and performance in low to medium grade heat sources [15].
A crucial component within a WHR-ORC system is the heat exchanger. Due to the nature of the heat source, the impact of the heat exchanger should be taken into consideration [16]. The two most common types of heat exchangers are Plate Heat Exchangers (PHX) and Shell and Tube Heat Exchangers (STHX). A PHX is comprised of a sequence of parallel metal plates which are used to transfer heat between two fluids. Over the years research has investigated a variety of methods to improve the design of PHXs such as pinch point analysis [17] and genetic algorithms [18]. Zhu and Zhang [19] conducted a study to improve PHXs for geothermal heating used within four districts in China. A computer program used a process flow diagram in order to optimize existing PHX designs by adjusting the number of flow paths and channels. For each of the four districts the computer program successfully produced an improved design with a lower heat transfer area requirement. Methods of this nature have the capability to consider a wide range of design options to subsequently improve PHX design. Further improvements to PHX performance can be achieved by considering parameters, such as the corrugation angle [20] and port configuration as well as working conditions [21].
Shell and tube heat exchangers consist of a bundle of tubes within a cylindrical shell. The shell is a pressure vessel which contains one fluid and the bundle of tubes transport the other fluid. The main differences between heat exchangers is the configuration of the system, and, ultimately, this depends on the application of the heat exchanger and the design requirements. Tube arrangement and geometry must be optimised to ensure the flow of the tube side fluid is suitable. The arrangement of the tube bundle is generally square or triangular. A square arrangement simplifies maintenance and cleaning, and due to the pattern it reduces pressure drops for the shell side fluid, whereas a triangular pattern gives a robust configuration [22]. Shell and tube heat exchangers are among the most common due to their ability to operate over a range of pressures and temperatures [23]. Similar to PHX, previous research has investigated a variety of methods to improve STHX design, such as an algorithm for cost-based optimisation [24], a computational fluid dynamics-based design [25] and genetic algorithm optimization [26].
Despite the substantial research regarding heat exchanger design, only a small proportion of studies investigated the implementation of a heat exchanger within an ORC system [27]. Imran et al. [28] used a Non-dominated Sorting Genetic Algorithm-II method with minimizing the pressure drop and cost as the objective functions. Zheng et al. [29] experimented on the influence different plate heat exchanger designs have on the performance of an ORC. A test rig was built to allow switchable plate heat exchanger combinations for the evaporator and the condenser. A key finding indicated the condenser heat transfer area had a smaller impact on the performance of the ORC compared to the evaporator heat transfer area. Walraven et al. [30] conducted a study to assess how the integration of PHXs in Organic Rankine cycles differs to the integration of the STHX. The total cycle efficiency was calculated for a number of working fluids for both the PHX and the STHX with varied heat transfer areas. It was found that for lower heat transfer areas, the ORC integrated with PHXs would have a greater output than for ORC’s integrated with shell-and-tube heat exchangers. Many researchers have also stated improved performance with plate type heat exchangers due to compactness when compared to STHXs [31]. A fuzzy multi-criteria design optimisation and screening methodology was conducted by Xu et al. [32] The candidate heat exchangers investigated were PHX and STHX within the ORC. Both types of heat exchangers were modelled in order to calculate their size and heat transfer coefficients. Additional thermodynamic factors, such as network output, thermal efficiency and exergy efficiency were also considered and calculated for comparison. The selection of the best heat exchanger was determined by three objective functions, thermal efficiency, specific investment cost and heat exchanger area per unit power output. When considering the heat transfer efficiency based on the heat transfer area of the heat exchangers individually, on average, PHXs outdo STHXs. However, when incorporating the overall system performance, STHXs offer certain advantages in terms of a lower cost and higher operating temperatures and pressures.
Utilisation of ORCs to generate power output from low-grade waste heat, provides an approach which is free from CO2 emissions and fuel costs and thus increases the overall efficiency and reduces the need for conventional power generation with its associated cost and CO2 emissions. It, therefore, provides environmental advantages in reducing our carbon footprint and, at the same time, provides financial incentives to adopt the technology. As with all technologies which are being developed with a view to decreasing CO2 emissions, the manufacture and construction of ORCs comes at a cost in terms of resources, CO2 emissions and upfront expenditure.
Here we consider the operation of the ORC, and, in particular, the different heat exchangers that are required in the process, to investigate the minimum sizing requirements. This will ensure that ORCs can be constructed with minimum physical and financial resources, as well as reducing the carbon footprint involved with manufacture, thus maximising the advantages that can be achieved through ORC implementation.

2. Materials and Methods

Configuration of the ORC is shown in Figure 1. The working fluid selected in this study is R1234yf, a fourth generation refrigerant (GWP < 1, ASHRAE Safety Group A2L), suitable for low temperature applications [33]. Following [34], hot water at 150 °C from an industrial process was used as the heat source and chilled water at 5 °C was the cooling liquid. Saturated liquid state was assumed at the condenser outlet at 20 °C, and maximum cycle temperature was taken as 130 °C. Evaporation pressures of 10, 15 and 20 bar were considered. Efficiency of compression and expansion were assumed to be 85% and 90%, respectively. The thermodynamic properties of the working fluid were determined using REFPROP.
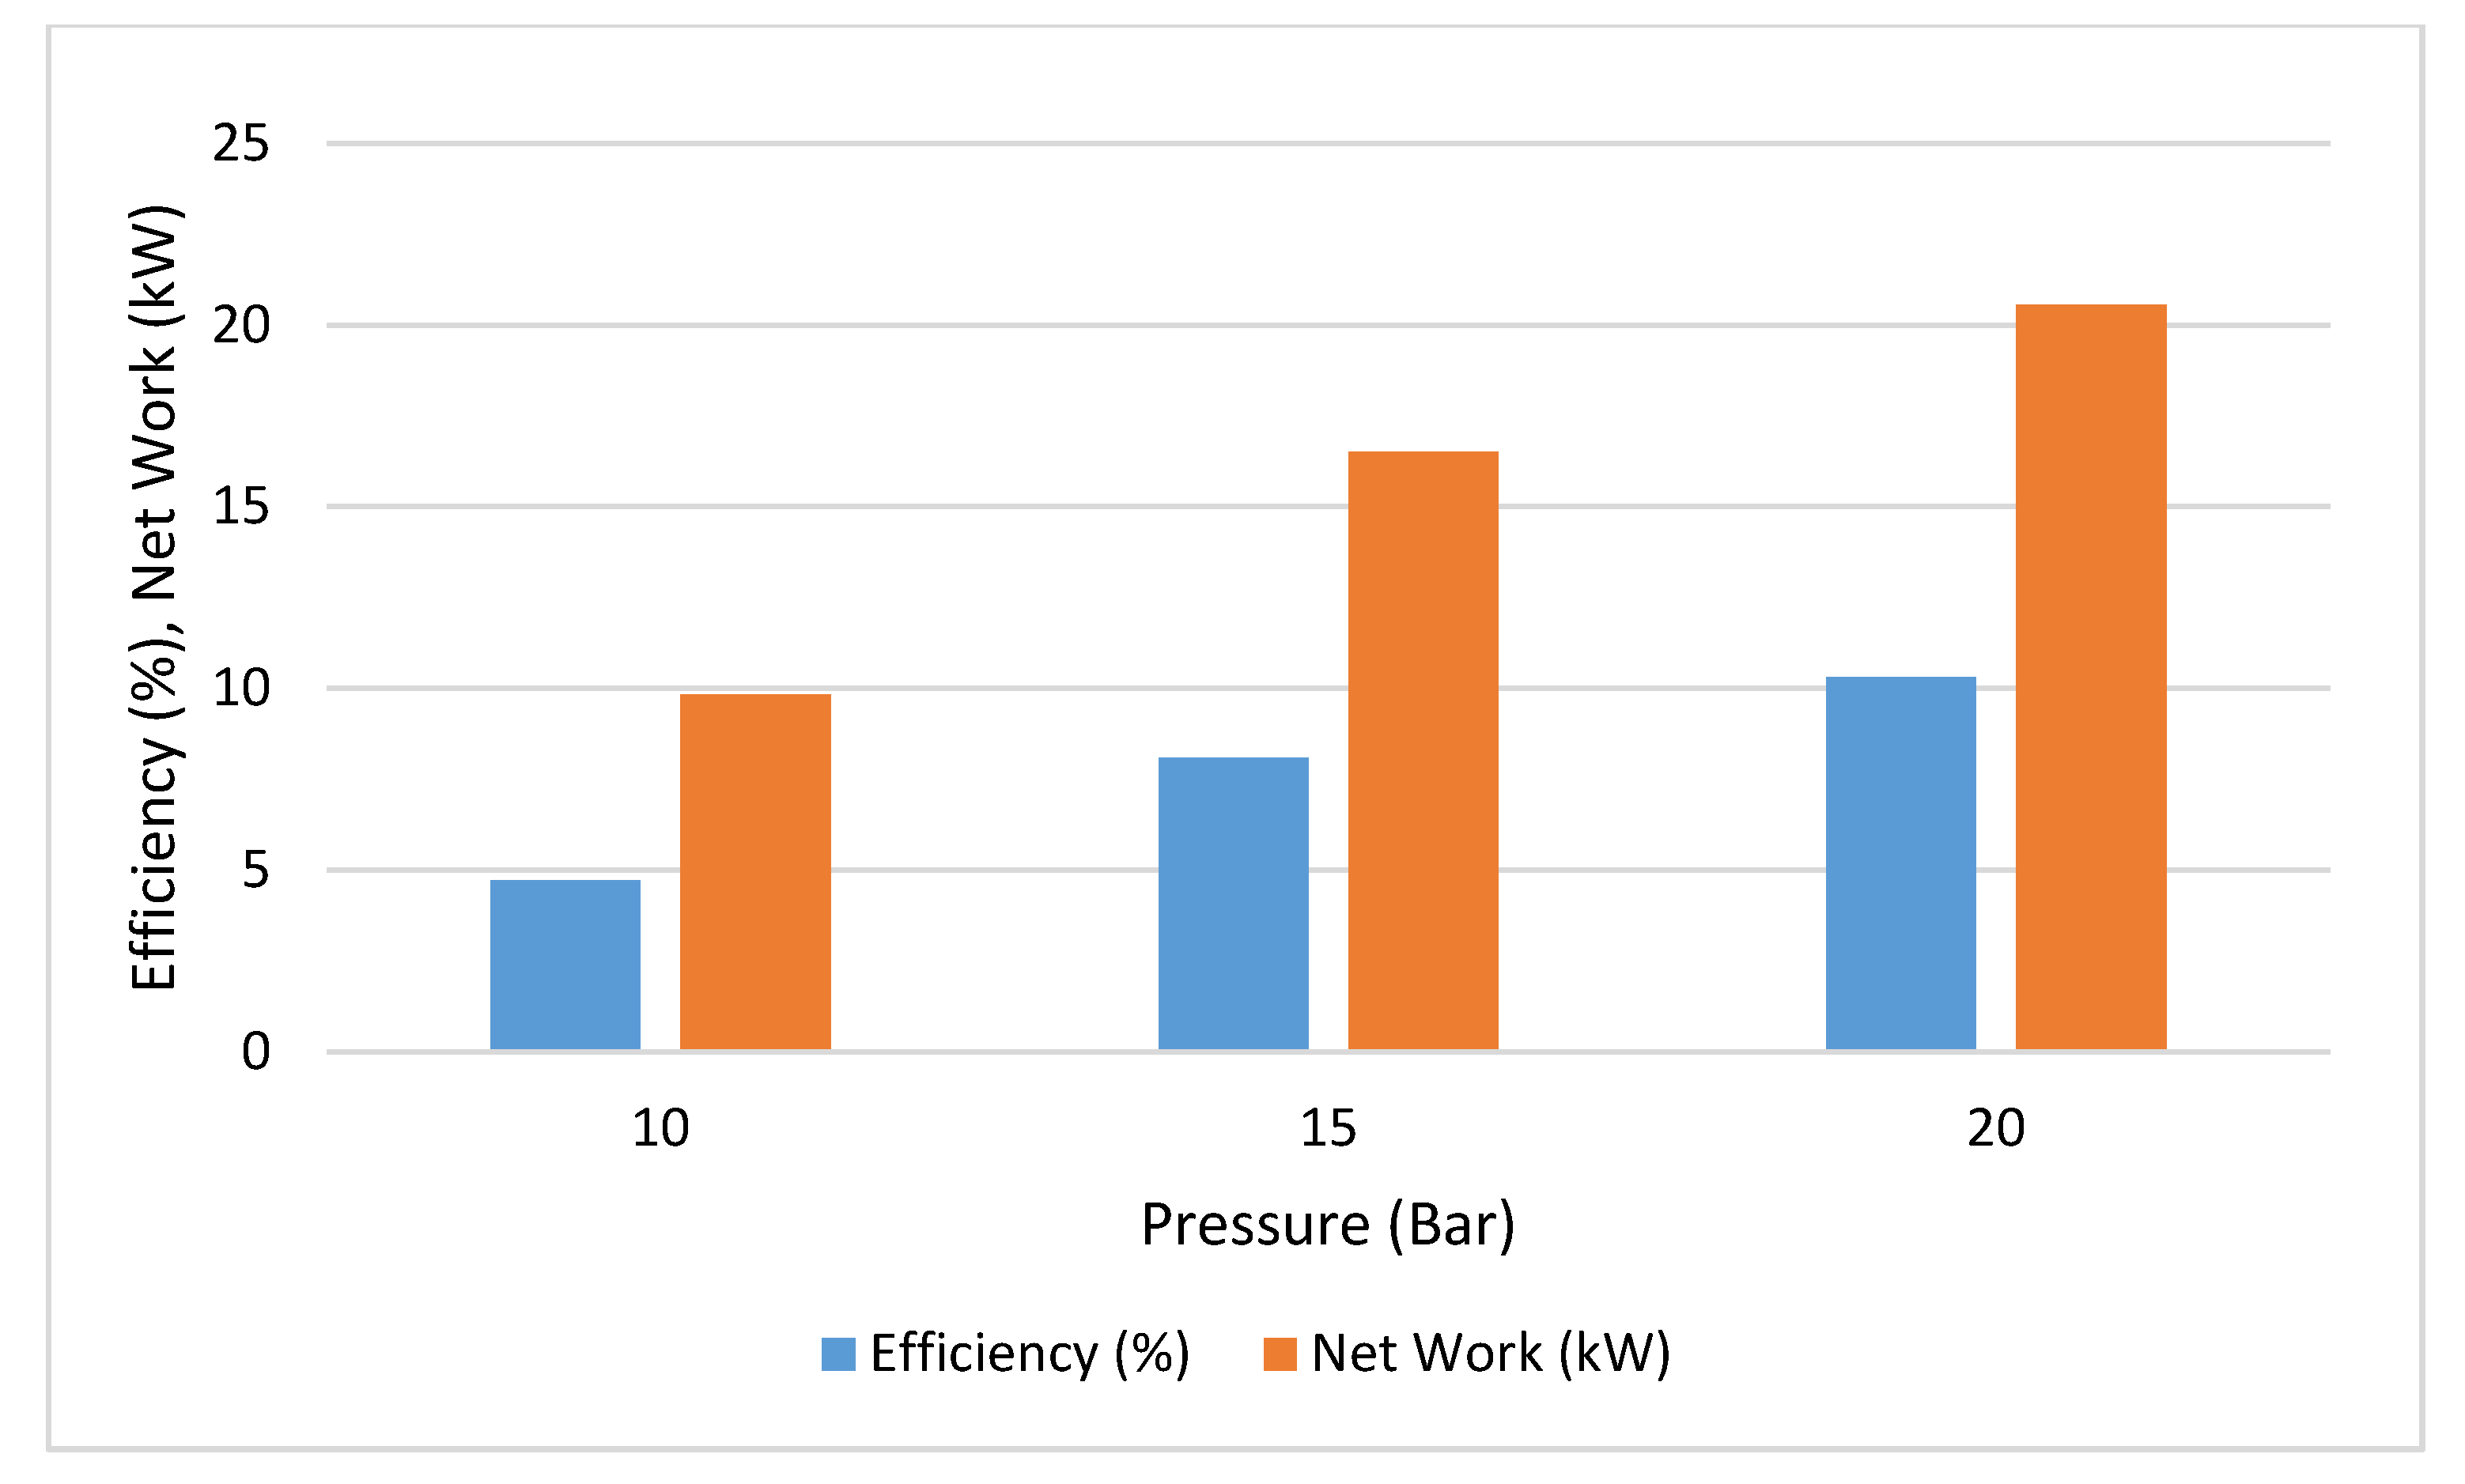
Figure 2 shows the Temperature-Entropy diagram for the ORC with R-1234yf working fluid for evaporator pressures of 10, 15 and 20 bar, along with the hot and cold sources. The pinch point temperature for the evaporator was set at 20 K, while the pinch point for the condenser was set at 5 K. The mass flow rate for R-1234yf was set at 0.8 kg/s and the required flow rates of the hot fluids were calculated from the energy balance as 0.50/0.52/0.54 kg/s for 10/15/20 bar, respectively. The flow rate of the cold fluid was calculated as 2.85 kg/s for all cycle variations. The efficiency and the net work output for the Rankine cycle at the three evaporator pressures considered (10, 15 and 20 bar), is shown in Figure 3. As expected, increasing the pressure produces a higher net work output and a corresponding increase in the efficiency.
The total heat exchanger area (A) was calculated as a sum of relevant subsection areas (Ai), shown in Figure 1, as
A = iAi = i (Qi LMTDi/Uoi)
where the summation is over i = 1, 2, 3 at the hot end, corresponding to the preheater, evaporator and superheater; and over i = 1, 2 at the cold end, corresponding to the precooler and condenser. LMTD is the log mean temperature difference, Q is the heat transfer rate and Uo is the overall heat transfer coefficient for each component. These are calculated by the methods discussed below where the single-phase equations can be applied to either the liquid or the vapour state of the refrigerant, with the appropriate thermodynamic properties.

2.1. Plate Heat Exchanger

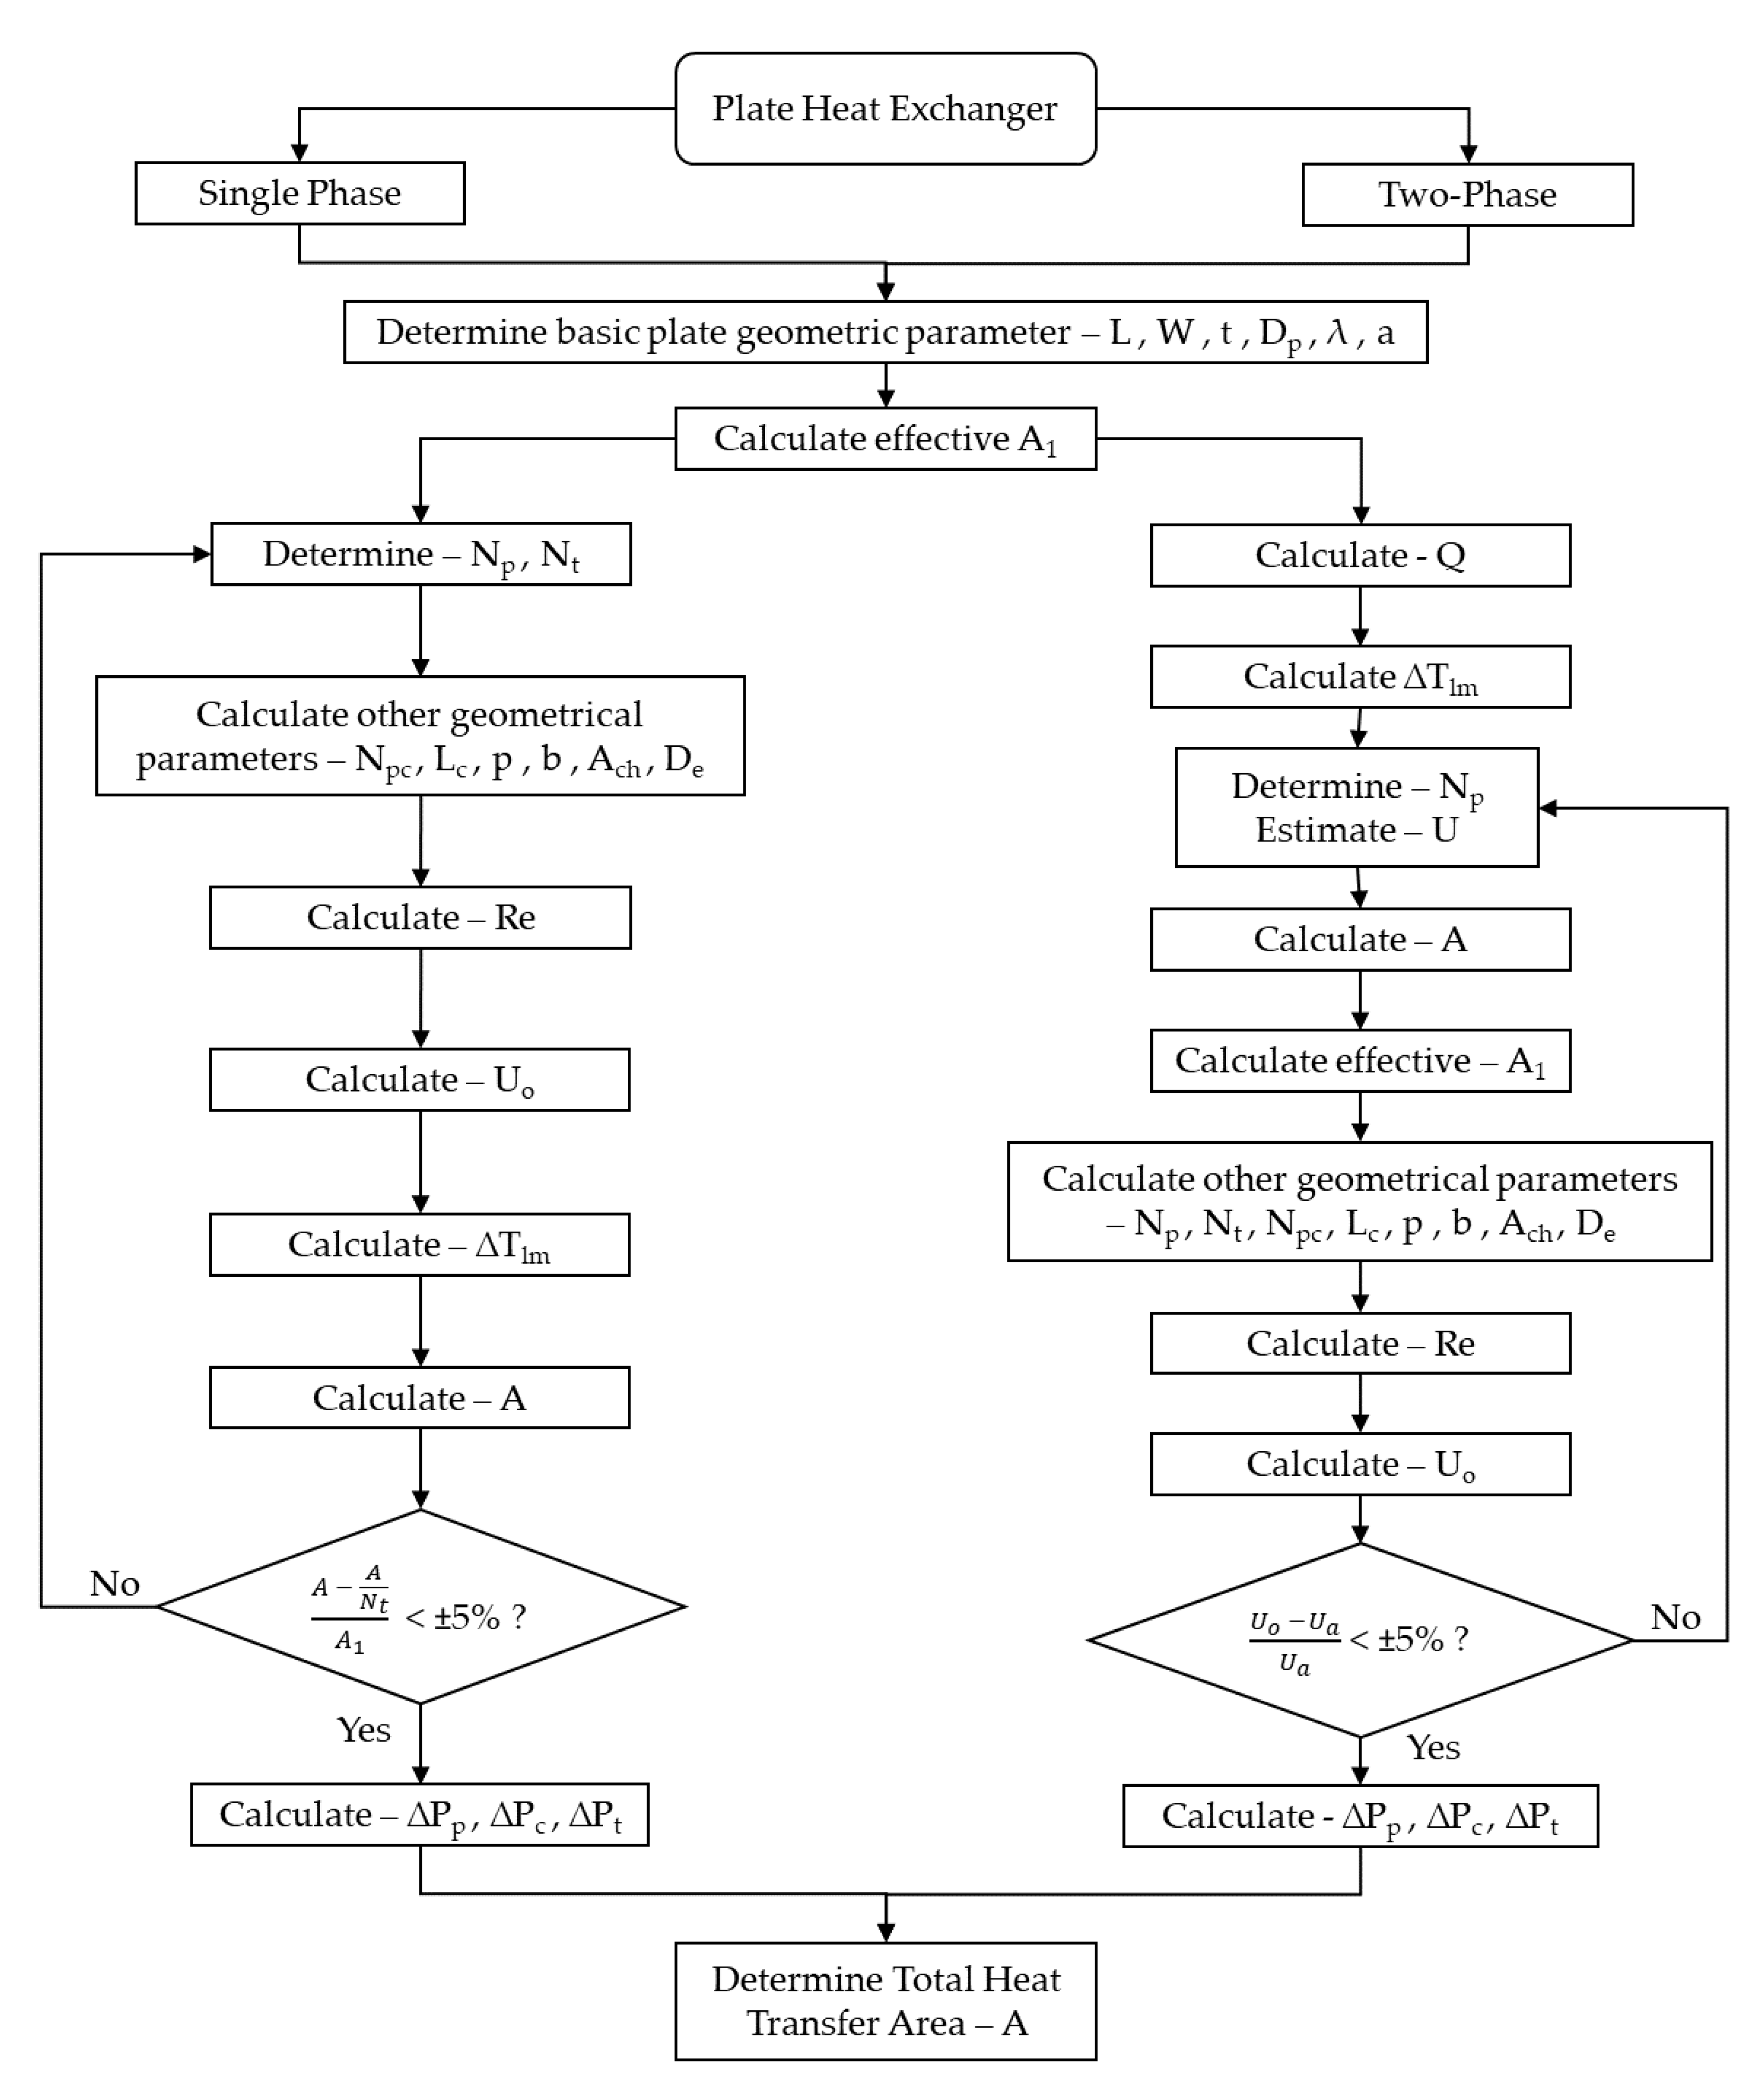
The flow chart in Figure 4 outlines the methodology used to size the PHXs for the single- and two-phase subsections.
The PHX design method was adapted from Gebremariam’s methodology [35]. The general geometrical parameters are given in Table 1.
Heat transfer constants Ch and n, and pressure loss constants Kp and m, dependent on the corrugation angle (β) and the Reynolds number, and values for pressure drop calculation were taken from [37]. The mass flow per channel, Gc and the Reynolds number were determined using Equations (2)–(4), where Ach is the channel flow area, De is the equivalent channel diameter and Ncp is the number of channels per pass:
Gc = /(Ach Ncp)
De = 2 b/Φ
Re = Gc De/µ
where mean channel spacing, b, and plate pitch, p, are given by:
b = pt
p = Lc/Nt
and are determined through the iteration in Figure 4.
An initial estimate is made for the number of passes and plates and the overall heat transfer coefficient (Uo) is determined using Equations (7) and (8) [37]:
h = [k Ch Ren ((Cp µ)/k)1/3 (µh/µc)0.17]/De
1/Uo = 1/hc + t/k + 1/hh
If the percentage difference is greater than 5% between the estimated overall heat transfer coefficient and the calculated overall heat transfer coefficient, the number of passes and plates are continuously altered until the error is less than 5%.
The two-phase design method stems from the methodology outlined by Rohmah et al. [38]. The governing equations are the same as for the single phase, with Reynolds number expressions Equations (9) and (10):
upc = /(ρ Ncp Ach)
Re = (ρ upc De)/µ
Nu = 0.26 * Re0.65 * Pr0.4 * (µ/µwall)0.14
where upc is the channel velocity.
The PHX pressure drop is considered using the method in Mota, Carvalho and Ravagnani [37].
Ptotal = ∆Pc + ∆Pp
Pc = (2 f Lv Np Gc2)/(ρ De)
Pp = (1.4 Gp2)/(2 ρ)
where the port mass velocity is:
Gp = (4 )/(π Dp2)

2.2. Shell and Tube Heat Exchanger

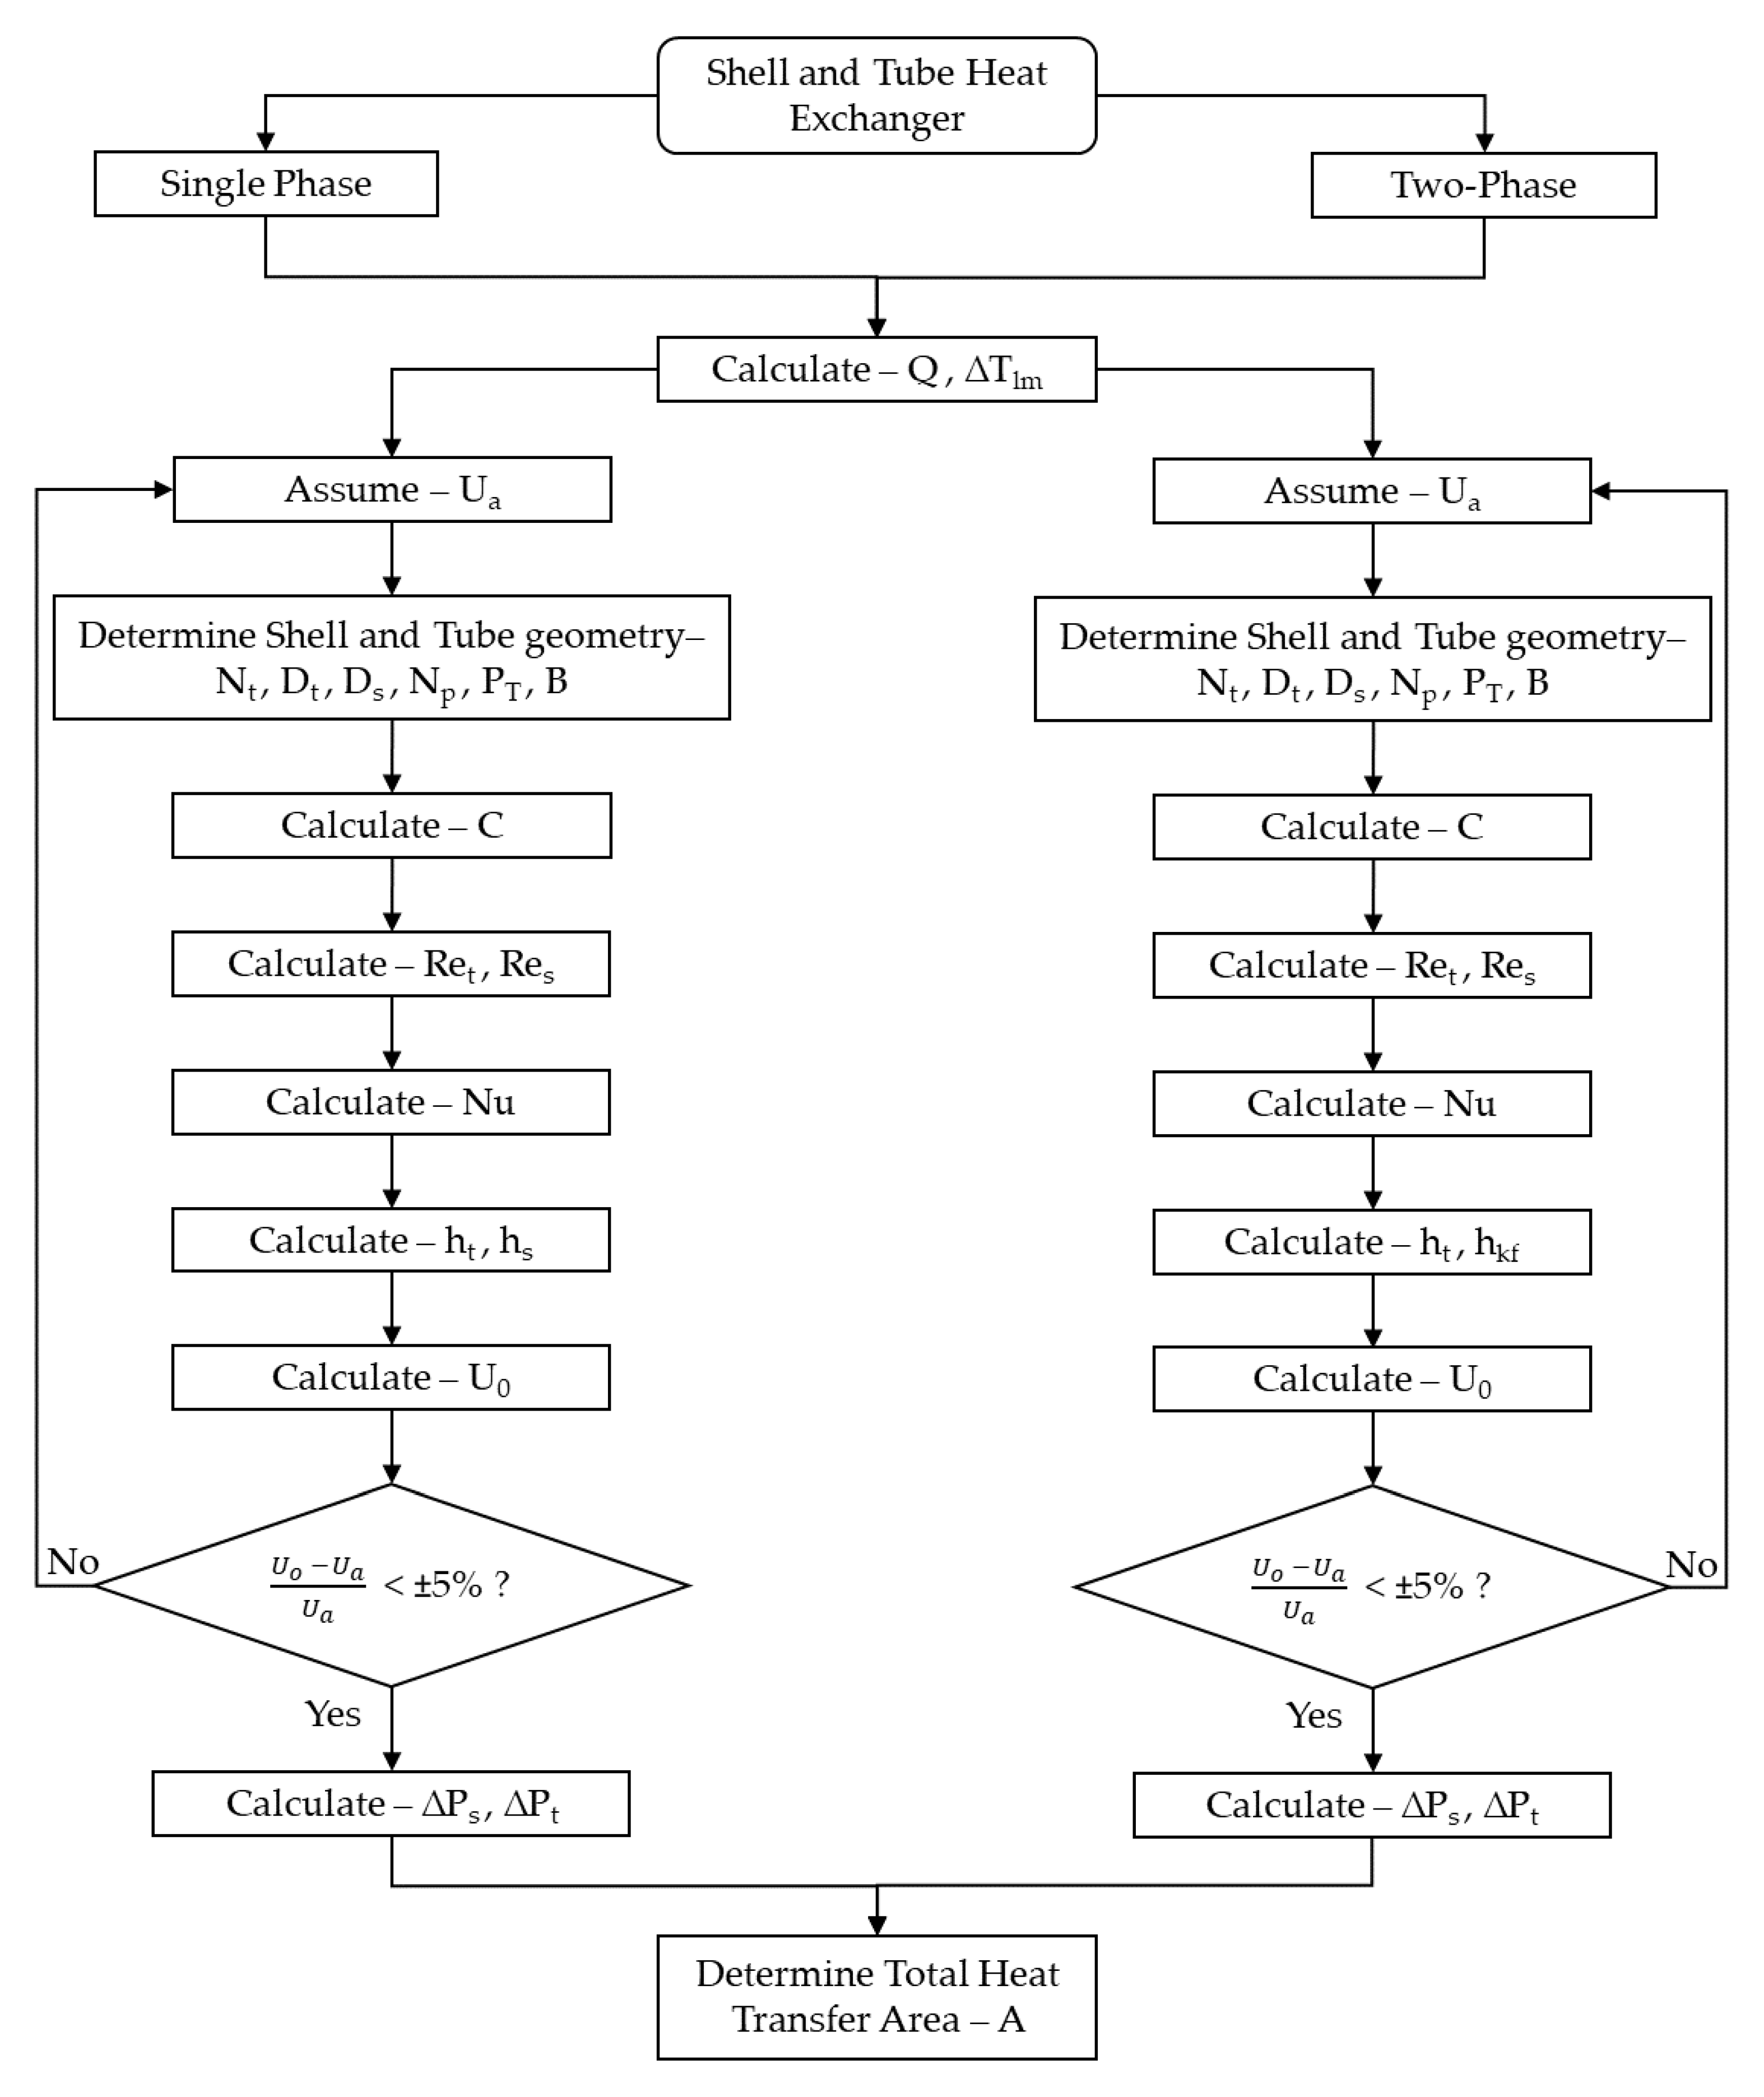
The design method for sizing the STHX was modified from Kern [39], illustrated by Figure 5. The first assumption for the overall heat transfer coefficient (U) was 500 W/m2K. In-line arrangement was considered. Tube diameters and baffle spacing were chosen from ASTM/ASME standards; tube pitch and clearance were calculated based on the methodology in [22]. The shell diameter was determined using the tube sheet layouts from literature [39]. The general geometrical parameters are given in Table 2. The method considers that the working fluid occupies the shell and water occupies the tube for all designs.
The Reynolds number for the shell and tube was found using Equations (16) and (17) for the tube and Equations (18)–(21) for the shell [22,39].
ut = (4 t (Np/Nt))/(π ρt Dt2)
Ret = (ρt ut Dt)/µt,
De = 4 * (PT2 − ((π/4) Do2))/(π Do),
as = C B Ds/PT
Gs = s/as
Res = De Gs/µs
Nusselt number and heat transfer coefficients were calculated for turbulent flow using Equations (22)–(25) [22]:
Nut = 0.023 Re0.8 Prt0.4
Nus = c (a/b)P Resm Prc1/3 (Prc/Prs)0.25
ht = Nut kt/Dt
hs = Nus ks/De
Correlations for the turbulent two-phase uses Equations (26)–(28) which are valid for 1500 < Re < 15,000:
hf = 0.021 Ref0.8 Pr0.43 ks/De
hkf = hf (1 + x (ρl/ρg − 1))0.5
where x is the dryness fraction, which is taken as the mean of end values.
Finally, the pressure drops can be determined considering the pressure drop across the tubes and shell. Equations (29)–(31) represent the correlations used for the tube side, considering frictional losses and return losses.
Pt,f = f (L/d) (ρ u2/2)
Pt,r = 4 (u2/(2 g)) ρ Np
Pt = ∆Pt,f + ∆Pt,r
As with the PHX, an iterative process is followed until the percentage difference is less than 5% between the estimated overall heat transfer coefficient and the calculated overall heat transfer coefficient. The shell side pressure drop was calculated using an approach by Peters, Timmerhaus and West [40].

3. Results/Discussion

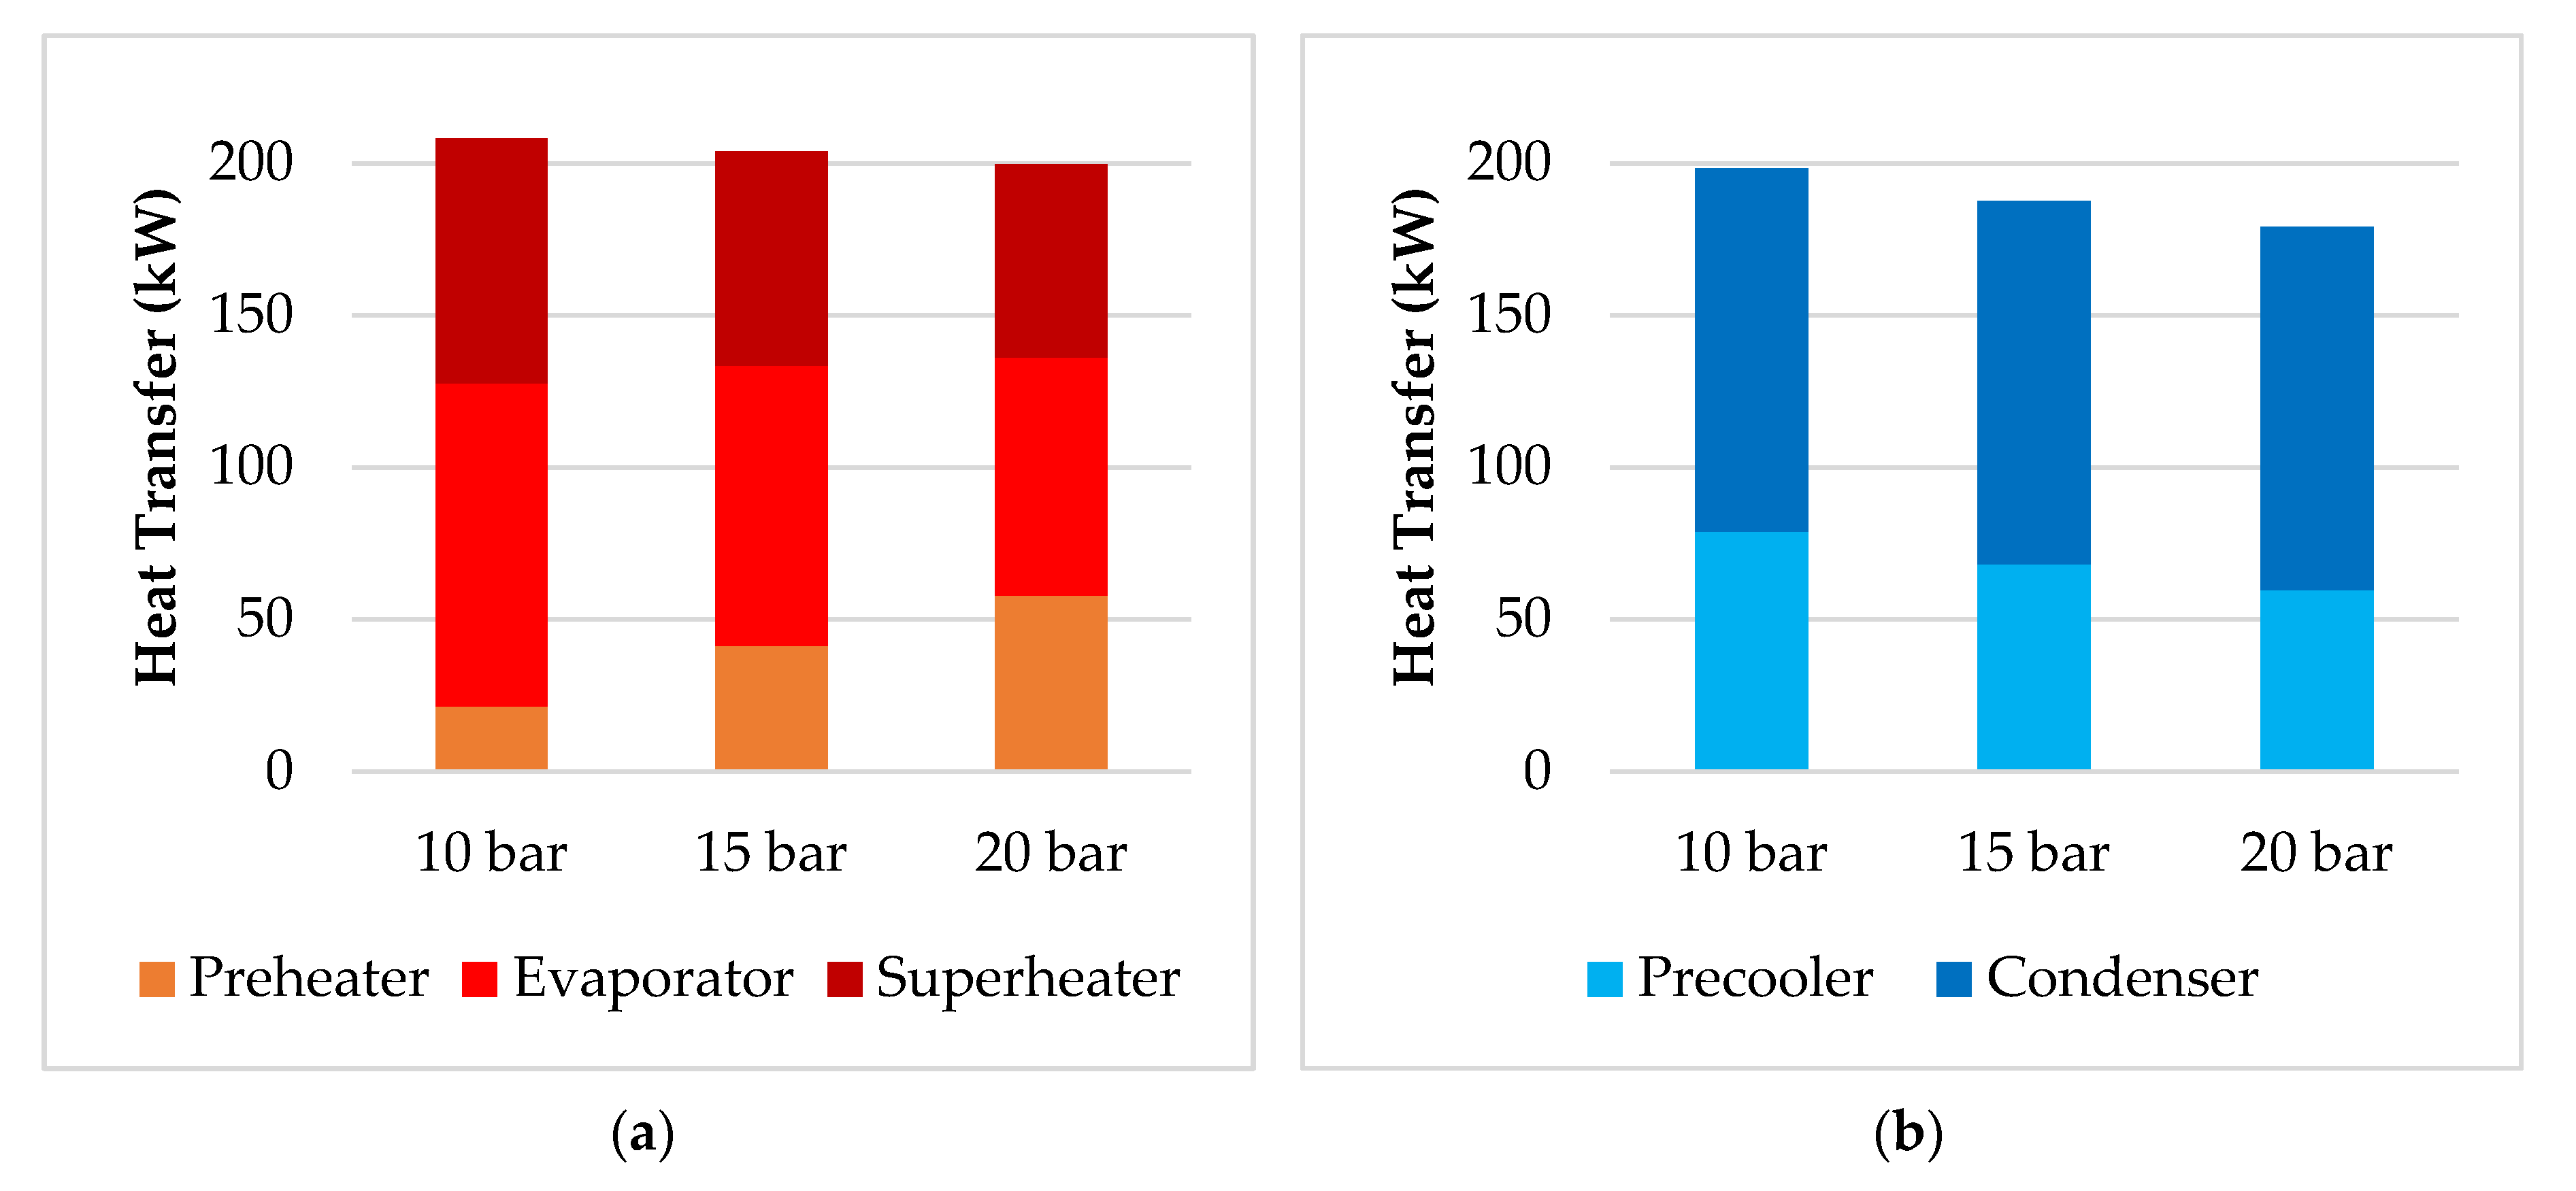
Figure 6 shows the heat transfer requirements in each component of the hot and cold heat exchangers. It is evident that increasing the pressure changes the energy transfer requirements in the different components of the heat exchangers. At the hot end there is an increase in the heating required in the preheater section as the pressure is increased, while there is a decrease in the heating required in the superheat section. At the cold end, the heat transfer within the condenser is independent of pressure and in the precooler the heat transfer requirements reduce with increased evaporator pressure. Additionally, as the pressure increases, there is a marked decrease in the heat transfer rate in the evaporator section due to the narrowing of the saturating curve with pressure, seen in Figure 2.
The corresponding surface areas, required to produce the heat transfer requirements detailed in Figure 6a,b, are presented in Table 3 and in Figure 7a for the PHX and Figure 7b for the STHX, respectively.
Figure 7 and Table 3 show the areas for both the heat exchangers. The surface area is influenced by the required heat transfer rate and also by the temperature of both the refrigerant and the water, both of which vary with pressure in each section of the heat exchanger.
Considering first the PHX. At the hot end first, the surface area of the superheater section is observed to decrease with increased pressure, as might be expected from the reduction in the heat transfer rate in Figure 6a. In the evaporator section there is also a small decrease in the surface area as the pressure increases over the range considered, which is again in line with the reduced heat transfer rate in Figure 6a. The surface area of the preheater section increases with pressure as does the heat transfer rate in Figure 6a. This suggests that the heat transfer rate is the main component in determining the surface area of each section; however, the temperature variation also influences the results in such a way that the maximum total surface area is largest for the 15 bar configuration. Overall, there is only a small change in the hot heat exchanger surface area, for the much larger increase in efficiency and net work which can be achieved by increasing the pressure.
As seen in Table 3 and Figure 6b, the cold end surface area through the condenser is independent of pressure due to the heat transfer rate and the temperature of both fluids also being independent. The only change is in the precooler where the area reduces with pressure due to the reduced heat transfer rate. This is echoed in the total area for the cold end.
The main features observed for the PHX in Figure 7 are also evident for the STHX. However, in terms of the total surface area of the hot heat exchanger, there is an increase in area with pressure despite the total heat transfer rate decreasing. This is due to the varying temperatures in each section, as observed in Figure 2.
The most significant difference between the two heat exchangers is the required surface area, which is significantly smaller for the PHX. At 20 bar, where the Rankine cycle is most efficient and produces the highest net work, the required surface area is 40% larger, in the STHX, at the hot end and 66% larger at the cold end. This agrees with previous research identifying that PHXs have a lower heat transfer area requirement than shell and tube systems [11,14].
Pressure losses will occur in the heat exchangers, which will affect the shape of the cycles in Figure 2, and also the details of the heat exchangers, as well as the net work and efficiency of the cycle. The size of the losses depends on the dimensions of the heat exchanger and so cannot be determined prior to the sizing calculation. It is, therefore, interesting to consider the magnitude of these losses and how they affect the performance of the cycle. This is presented in Table 4 which shows the total pressure drop over the preheater, evaporator and superheater, and also the percentage change in the net work and efficiency of the cycle. The largest difference occurs at 10 bar in the PHX, where the pressure drop causes a reduction in the net work and the efficiency by approximately 2%, which is relatively negligible. At the higher pressures, the effect is smaller and no greater than 0.5%. For the STHX the losses are smaller, and the calculated net work and efficiency changes are comparable with the accuracy of the calculations. The pressure drop in the PHX depends most strongly on the port diameter, Dp. Increasing this would reduce the pressure drop and the associated reduction in net work and efficiency. In both cases the pressure drops, for the parameters selected in this study, are small and have a negligible effect on the performance, even at 10 bar. The lower losses for the STHX should not be viewed as an advantage over the PHX since the design parameters can be adjusted to reduce the pressure drop if required.

4. Conclusions

The sizing of heat exchangers has been considered for an R1234yf ORC operating between a hot water reservoir at 150 °C and a cold water reservoir at 5 °C for evaporator pressures of 10, 15 and 20 bar, which cover the typical operating range of the cycle. The 20 bar system had the highest efficiency (10.3%) and also produced the highest net work (20.55 kW for a refrigerant mass flow rate of 2.85 kg/s). Based on this ORC, with the three different evaporator pressures, calculations were performed to find the minimum area requirements for the five associated heat exchangers (preheater, evaporator and superheater at the hot end and precooler and condenser at the cold end). These calculations were performed for Plate Heat Exchangers and Shell and Tube Heat Exchangers.
The heat transfer rate in each heat exchanger was seen to change as the evaporator pressure was changed from 10 bar, through 15 bar, to 20 bar, with a decrease in the heating rate required in the superheater, evaporator and precooler and an increase in the preheater. Details of the surface area requirements were also calculated and presented. At the different pressures, the required area changes due to the associated heat transfer rates and also the differing temperatures of both the water and the working fluid. The results show that the heat transfer rate is the main component in determining the surface area of each section; however, the temperature variation also has an effect: for example, the area of the STHX evaporator is smaller at 10 bar than at 15 bar. As well as the specific details of each heat exchanger, it was shown that that there is only a small change in the heat exchanger surface area as the evaporator pressure is increased, compared to the much larger increase in efficiency and net work. The PHX was seen, at each of the pressure levels considered, to have a lower area requirement of almost 40% at the cold end and slightly over 25% at the hot end.

Author Contributions

Conceptualization, J.B. and J.R.; Methodology, J.B. and J.R.; Software, J.B.; Formal Analysis, J.B., J.M.B. and J.R.; Investigation, J.B., J.M.B. and J.R.; Data Curation, J.B. and J.M.B.; Writing-Original Draft Preparation, J.B.; Writing-Review & Editing, J.B., J.M.B. and J.R.; Visualization, J.B. and J.M.B.; Supervision, J.M.B. and J.R.; Project Administration, J.R. All authors have read and agreed to the published version of the manuscript.

Funding

J.B.’s PhD was partially funded by Business Edge Ltd., Waterlooville, UK.

Conflicts of Interest

The authors declare no conflict of interest.

Nomenclature

AArea (m2)
AchChannel flow area (m2)
bMean Channel Spacing (m)
BBaffle spacing (m)
CTube clearance (m)
DeEquivalent channel diameter (m)
DpPort Diameter (m)
DoExternal Tube Diameter (m)
DtInternal Tube Diameter (m)
DsShell Diameter (m)
GcMass flow per channel (kg/m2s)
GpPort mass velocity (kg/m2s)
kThermal Conductivity (W/mK)
LEffective Length (m)
LcCompressed Plate Pack Length (m)
LhHorizontal Port Distance (m)
LvVertical Port Distance (m)
Mass flow rate (kg/s)
NcpNumber of channels per pass (-)
NpNumber of passes (-)
NtNumber of tubes (-)
pPlate Pitch (m)
QHeat transfer rate (kJ/s)
tPlate Thickness (m)
upcChannel velocity (m/s)
UOverall heat transfer coefficient (W/m2K)
WEffective Width (m)
Greek letters
βCorrugation Angle
λCorrugation Wavelength
ΦSurface Enlargement Factor
Subscripts
ccold side
eequivalent
ffrictional
hhot side
iinternal
oexternal
rreturn
sshell
ttube

References

  1. IEA. World Energy Outlook 2019; IEA: Paris, France, 2019.
  2. U.S. Energy Information Administration. International Energy Outlook 2019; U.S. Department of Energy: Washington, DC, USA, 2019.
  3. Rogelj, J.; Schaeffer, M.; Meinshausen, M.; Knutti, R.; Alcamo, J.; Riahi, K.; Hare, W. Zero emission targets as long-term global goals for climate protection. Environ. Res. Lett. 2015, 10, 105007. [Google Scholar] [CrossRef]
  4. Wu, X.; Hu, Y.; Li, Y.; Yang, J.; Duan, L.; Wang, T.; Adcock, T.; Jiang, Z.; Gao, Z.; Lin, Z.; et al. Foundations of offshore wind turbines: A review. Renew. Sustain. Energy Rev. 2019, 104, 379–393. [Google Scholar] [CrossRef] [Green Version]
  5. Kannan, N.; Vakeesan, D. Solar energy for future world: A review. Renew. Sustain. Energy Rev. 2016, 62, 1092–1105. [Google Scholar] [CrossRef]
  6. Shi, L.; Shu, G.; Tian, H.; Deng, S. A review of modified Organic Rankine cycles (ORCs) for internal combustion engine waste heat recovery (ICE-WHR). Renew. Sustain. Energy Rev. 2018, 92, 95–110. [Google Scholar] [CrossRef]
  7. Papapetrou, M.; Kosmadakis, G.; Cipollina, A.; La Commare, U.; Micale, G. Industrial waste heat: Estimation of the technically available resource in the EU per industrial sector, temperature level and country. Appl. Therm. Eng. 2018, 138, 207–216. [Google Scholar] [CrossRef]
  8. Zhai, H.; An, Q.; Shi, L.; Lemort, V.; Quoilin, S. Categorization and analysis of heat sources for organic Rankine cycle systems. Renew. Sustain. Energy Rev. 2016, 64, 790–805. [Google Scholar] [CrossRef]
  9. Wang, E.; Zhang, H.; Fan, B.; Ouyang, M.; Zhao, Y.; Mu, Q. Study of working fluid selection of organic Rankine cycle (ORC) for engine waste heat recovery. Energy 2011, 36, 3406–3418. [Google Scholar] [CrossRef]
  10. Bao, J.; Zhao, L. A review of working fluid and expander selections for organic Rankine cycle. Renew. Sustain. Energy Rev. 2013, 24, 325–342. [Google Scholar] [CrossRef]
  11. Petr, P.; Raabe, G. Evaluation of R-1234ze(Z) as drop-in replacement for R-245fa in Organic Rankine Cycles—From thermophysical properties to cycle performance. Energy 2015, 93, 266–274. [Google Scholar] [CrossRef] [Green Version]
  12. Ziviani, D.; Dickes, R.; Quoilin, S.; Lemort, V.; De Paepe, M.; Van Den Broek, M. Organic Rankine cycle modelling and the ORCmKit library: Analysis of R1234ze (Z) as Drop-in Replacement of R245fa for Low-Grade Waste Heat Recovery. In Proceedings of the 29th International Conference on Efficiency, Cost, Optimization, Simulation and Environmental Impact of Energy Systems, Portoroz, Slovenia, 19–23 June 2016; pp. 1–13. [Google Scholar]
  13. Yang, J.; Ye, Z.; Yu, B.; Ouyang, H.; Chen, J. Simultaneous experimental comparison of low-GWP refrigerants as drop-in replacements to R245fa for Organic Rankine cycle application: R1234ze(Z), R1233zd(E), and R1336mzz(E). Energy 2019, 173, 721–731. [Google Scholar] [CrossRef]
  14. Darvish, K.; Ehyaei, M.; Atabi, F.; Rosen, M. Selection of optimum working fluid for organic rankine cycles by exergy and exergy-economic analyses. Sustainability 2015, 7, 15362–15383. [Google Scholar] [CrossRef] [Green Version]
  15. Moles, F.; Navarro-Esbrí, J.; Peris, B.; Mota-Babiloni, A.; Mateu-Royo, C. R1234yf and R1234ze as alternatives to R134a in Organic Rankine Cycles for low temperature heat sources. Energy Procedia 2017, 142, 1192–1198. [Google Scholar] [CrossRef]
  16. Feru, E.; Willems, F.; Rojer, C.; Jager, B.; Steinbuch, M. Heat exchanger modeling and identification for control of Waste Heat Recovery systems in diesel engines. In Proceedings of the American Control Conference, Washington, DC, USA, 16–19 June 2013; pp. 2860–2865. [Google Scholar]
  17. Konur, O.; Saatcioglu, O.; Korkmaz, S.; Erdogan, A.; Colpan, C. Heat exchanger network design of an organic Rankine cycle integrated waste heat recovery system of a marine vessel using pinch point analysis. Int. J. Energy Res. 2020. [Google Scholar] [CrossRef]
  18. Ozkol, I.; Komurgoz, G. Determination of the optimum geometry of the heat exchanger body via a genetic algorithm. Numer. Heat Transf. Part A Appl. 2005, 48, 283–296. [Google Scholar] [CrossRef]
  19. Zhu, J.; Zhang, W. Optimization design of plate heat exchangers (PHE) for geothermal district heating systems. Geothermics 2004, 33, 337–347. [Google Scholar] [CrossRef]
  20. Khan, T.; Khan, M.; Chyu, M.; Ayub, Z. Experimental investigation of single phase convective heat transfer coefficient in a corrugated plate heat exchanger for multiple plate configurations. Appl. Therm. Eng. 2010, 30, 1058–1065. [Google Scholar] [CrossRef]
  21. Nilpueng, K.; Wongwises, S. Experimental study of single-phase heat transfer and pressure drop inside a plate heat exchanger with a rough surface. Exp. Therm. Fluid Sci. 2015, 68, 268–275. [Google Scholar] [CrossRef]
  22. Edwards, J.E. Design and Rating of Shell and Tube Heat Exchangers; P & I Design Ltd.: Teesside, UK, 2008. [Google Scholar]
  23. Li, Y.; Jiang, X.; Huang, X.; Jia, J.; Tong, J. Optimization of high-pressure shell-and-tube heat exchanger for syngas cooling in an IGCC. Int. J. Heat Mass Transf. 2010, 53, 4543–4551. [Google Scholar] [CrossRef]
  24. Nasr, M.; Polley, G. An algorithm for cost comparison of optimized shell-and-tube heat exchangers with tube inserts and plain tubes. Chem. Eng. Technol. Ind. Chem. Plant Equip. Process Eng. Biotechnol. 2000, 23, 267–272. [Google Scholar] [CrossRef]
  25. Arjun, K.; Gopu, K. Design of shell and tube heat exchanger using computational fluid dynamics tools. Res. J. Eng. Sci. 2014, 3, 8–16. [Google Scholar]
  26. Selbaş, R.; Kızılkan, O.; Reppich, M. A new design approach for shell-and-tube heat exchangers using genetic algorithms from economic point of view. Chem. Eng. Process. Process Intensif. 2006, 45, 268–275. [Google Scholar] [CrossRef]
  27. Park, B.; Usman, M.; Imran, M.; Pesyridis, A. Review of Organic Rankine Cycle experimental data trends. Energy Convers. Manag. 2018, 173, 679–691. [Google Scholar] [CrossRef]
  28. Imran, M.; Usman, M.; Park, B.S.; Kim, H.J.; Lee, D.H. Multi-objective optimization of evaporator of organic Rankine cycle (ORC) for low temperature geothermal heat source. Appl. Therm. Eng. 2015, 80, 1–9. [Google Scholar] [CrossRef]
  29. Zheng, X.; Luo, X.; Luo, J.; Chen, J.; Liang, Y.; Yang, Z.; Chen, Y.; Wang, H. Experimental investigation of operation behavior of plate heat exchangers and their influences on organic Rankine cycle performance. Energy Convers. Manag. 2020, 207, 112528. [Google Scholar] [CrossRef]
  30. Walraven, D.; Laenen, B.; D’haeseleer, W. Comparison of shell-and-tube with plate heat exchangers for the use in low-temperature organic Rankine cycles. Energy Convers. Manag. 2014, 87, 227–237. [Google Scholar] [CrossRef] [Green Version]
  31. Pandya, N.; Shah, H.; Molana, M.; Tiwari, A. Heat transfer enhancement with nanofluids in plate heat exchangers: A comprehensive review. Eur. J. Mech. B Fluids 2020, 81, 173–190. [Google Scholar] [CrossRef]
  32. Xu, J.; Luo, X.; Chen, Y.; Mo, S. Multi-criteria design optimization and screening of heat exchangers for a subcritical ORC. Energy Procedia 2015, 75, 1639–1645. [Google Scholar] [CrossRef] [Green Version]
  33. Yamada, N.; Mohamad, N.; Kien, T. Study on thermal efficiency of low- to medium-temperature organic Rankine cycles using HFO−1234yf. Renew. Energy 2012, 41, 368–375. [Google Scholar] [CrossRef]
  34. Zhang, X.; Wu, L.; Wang, X.; Ju, G. Comparative study of waste heat steam SRC, ORC and S-ORC power generation systems in medium-low temperature. Appl. Therm. Eng. 2016, 106, 1427–1439. [Google Scholar] [CrossRef]
  35. Gebremariam, A. Gasketed Plate Type Heat Exchanger Design Software; Turku University of Applied Sciences: Turku, Finland, 2016. [Google Scholar]
  36. Soni, N.; Patel, J. Effect of corrugation angle on performance evaluation of plate type heat exchangers. Int. J. Adv. Res. Innov. Ideas Educ. 2017, 3, 1376–1381. [Google Scholar]
  37. Mota, F.; Carvalho, E.; Ravagnani, M. Modeling and Design of Plate Heat Exchanger. In Heat Transfer Studies and Applications; IntechOpen: Rijeka, Croatia, 2015; ISBN 978-953-51-2146-6. [Google Scholar]
  38. Rohmah, N.; Pikra, G.; Purwanto, A.; Pramana, R. The effect of plate spacing in plate heat exchanger design as a condenser in organic Rankine cycle for low temperature heat source. Energy Procedia 2015, 68, 87–96. [Google Scholar] [CrossRef] [Green Version]
  39. Kern, D.Q. Process Heat Transfer; Tosho Printing Co., Ltd.: Tokyo, Japan, 1983. [Google Scholar]
  40. Peters, M.; Timmerhaus, K.; West, R. Plant Design and Economics for Chemical Engineers, 5th ed.; McGraw-Hill Education: New York, NY, USA, 2003. [Google Scholar]
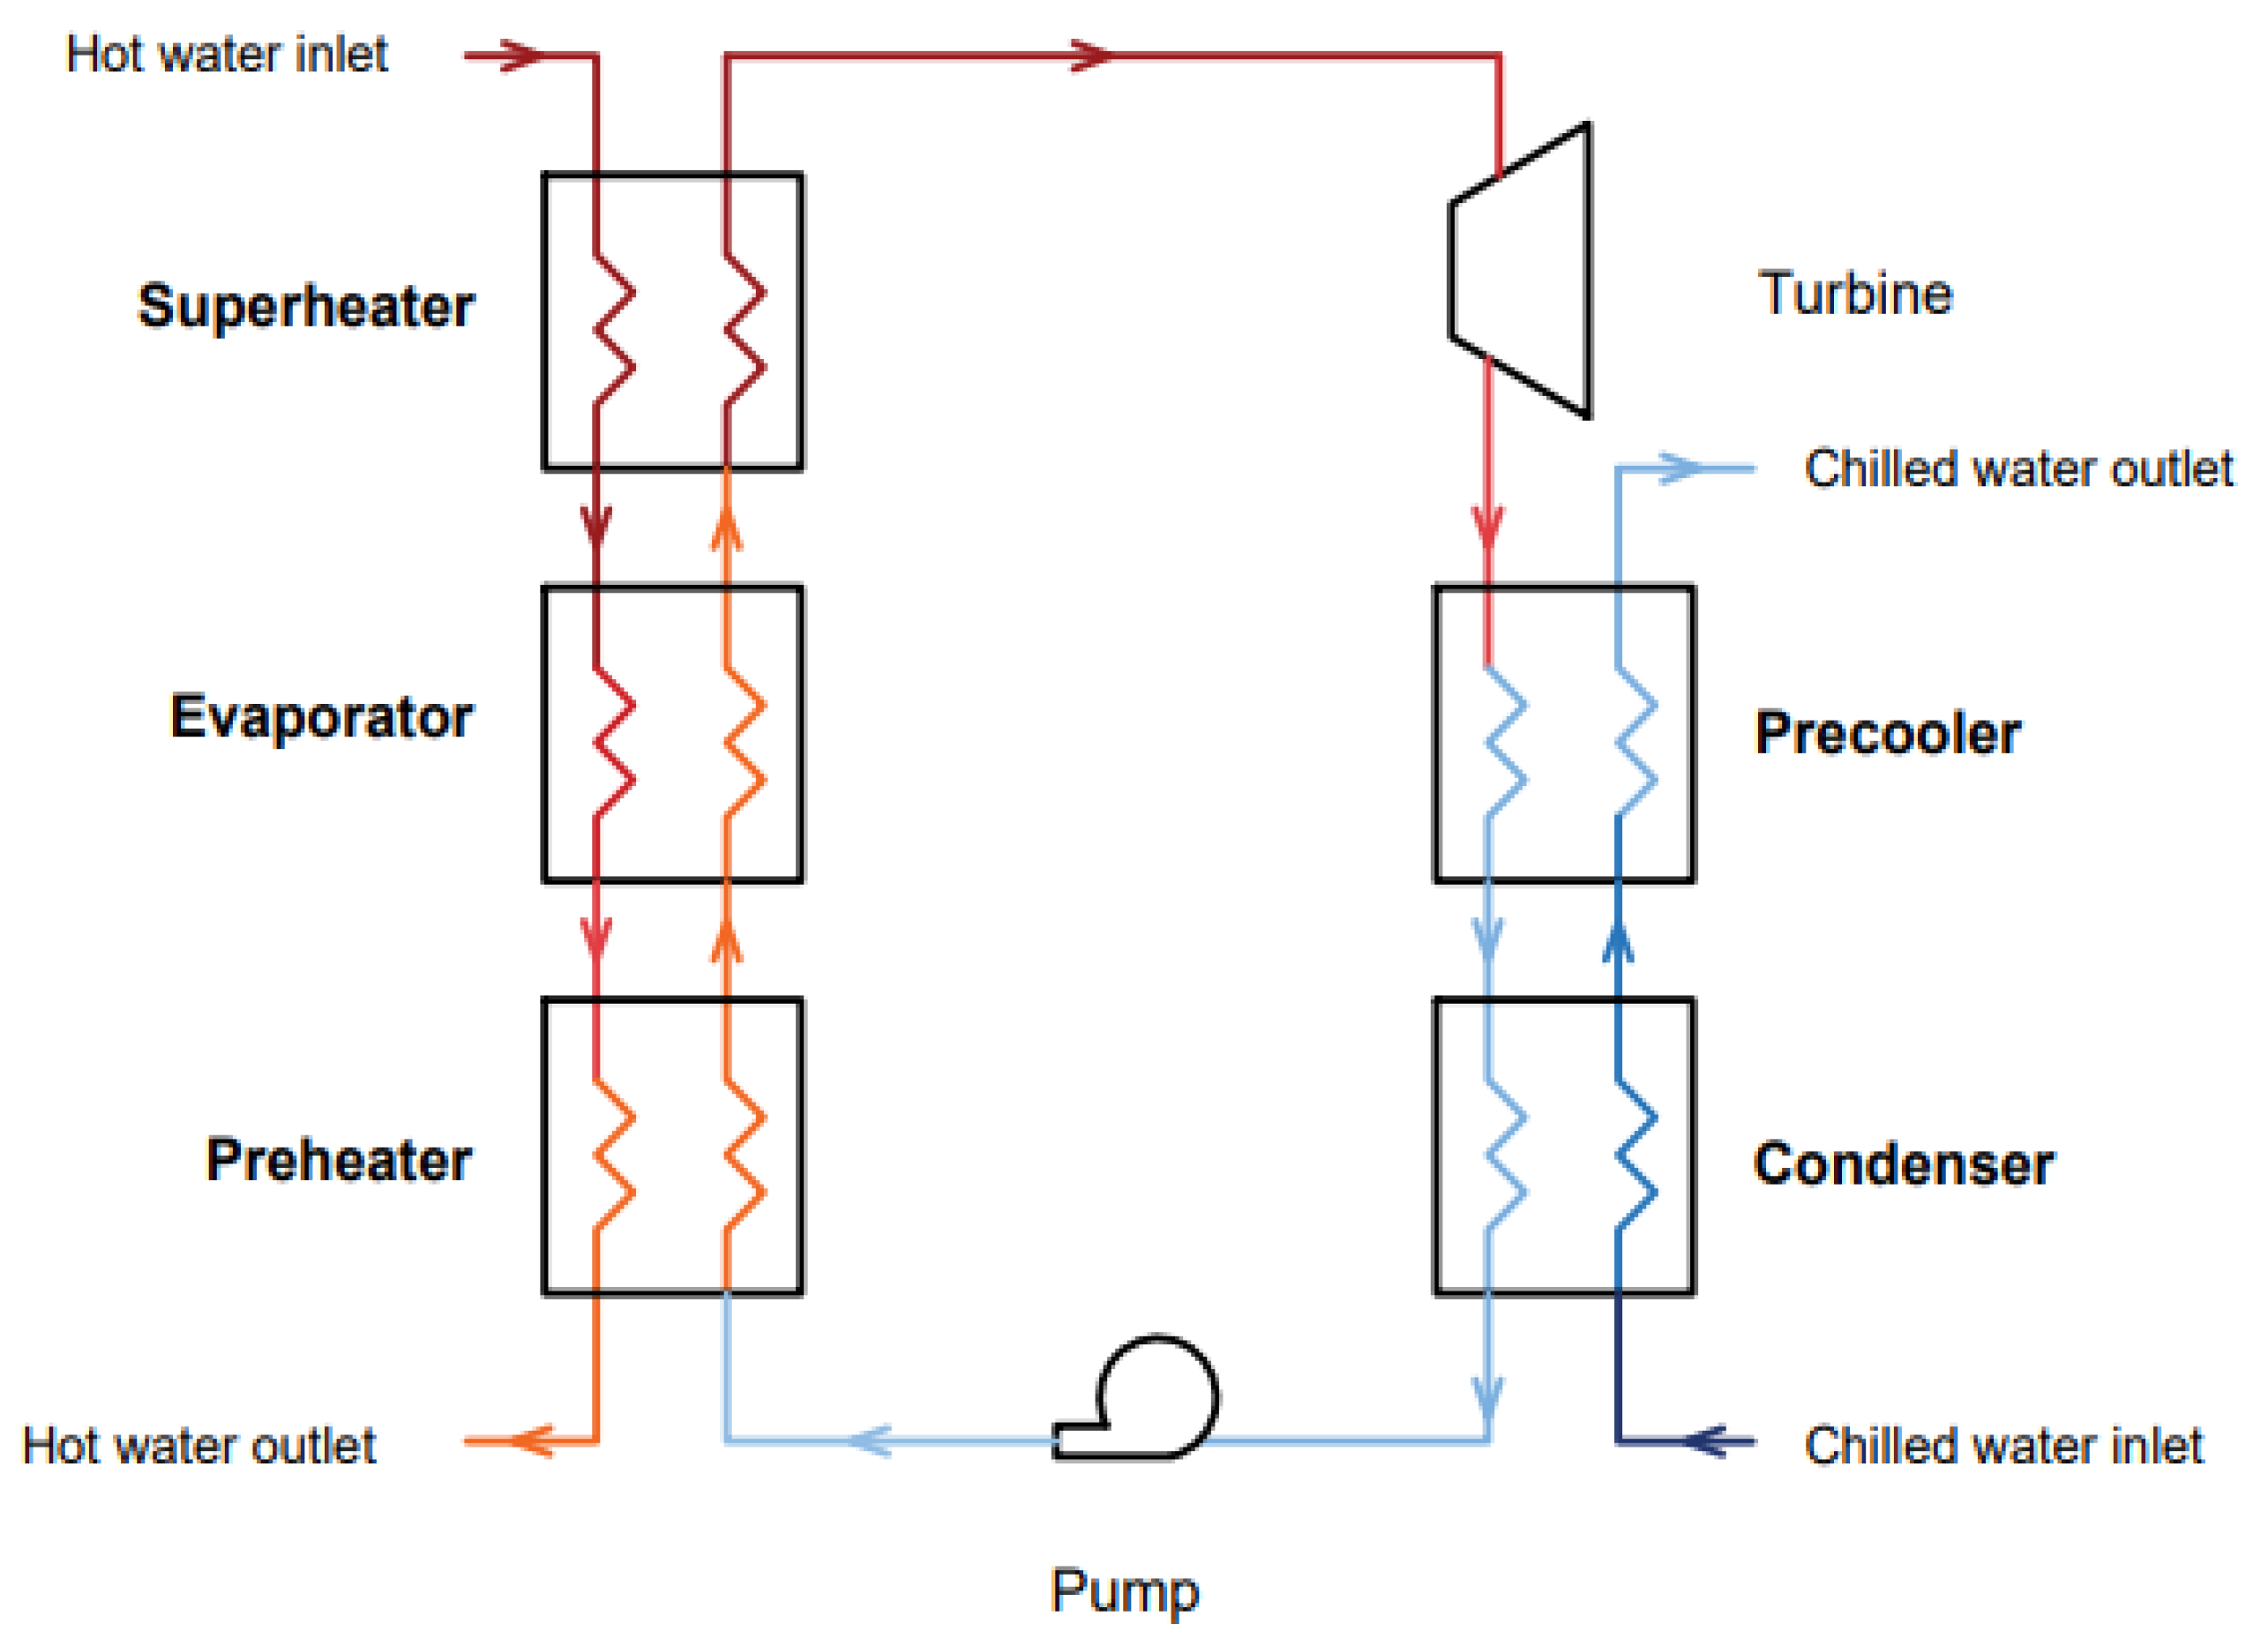
Figure 1. Organic Rankine Cycle (ORC) configuration with heat exchanger sections.
Energies 13 03615 g001
Figure 2. Temperature-Entropy chart for the three Rankine cycles and the corresponding details of the circulating water (hot HX, cold C).
Energies 13 03615 g002
Figure 3. Efficiency and net work output from the Rankine cycles at 10, 15 and 20 bar.
Energies 13 03615 g003
Figure 4. Design method flow chart for Plate Heat Exchanger (PHX) sizing for the single phase and two-phase options.
Energies 13 03615 g004
Figure 5. Design method flow chart for shell and tube heat exchanger sizing for the single phase and two-phase options.
Energies 13 03615 g005
Figure 6. Heat transfer rate in the (a) hot and (b) cold heat exchangers for 10 bar, 15 bar and 20 bar evaporator pressures.
Energies 13 03615 g006
Figure 7. Heat transfer surface area for the (a) hot and (b) cold end.
Energies 13 03615 g007
Table 1. Nominal plate geometrical parameters [36].
Geometrical ParametersSymbolValueUnit
Effective LengthL0.4m
Effective WidthW0.2m
Plate Thicknesst0.001m
Port DiameterDp0.018m
Vertical and Horizontal Port DistanceLv/Lh0.01/0.02m
Corrugation Wavelengthλ0.009m
Corrugation Angleβ60°
Compressed Plate Pack LengthLc0.3m
Surface Enlargement FactorΦ1.25
Stainless Steel Thermal Conductivityk16W/mK
Table 2. The assumed overall geometric parameters for the shell and tube heat exchanger.
Geometrical ParametersSymbolValueUnit
Internal Tube DiameterDt0.019m
Shell DiameterDs0.203m
Number of TubesNt24
Number of Tube PassesNp2
Square Pitch LengthPT0.238m
Tube ClearanceC0.005m
Baffle SpacingB0.305m
Table 3. Surface areas for each component of the PHXs and STHXs with evaporator pressures of 10, 15 and 20 bar.
Pressure (bar)Surface Area (m2)
PreheaterEvaporatorSuperheaterPrecoolerCondenser
PHX102.604.825.048.0013.21
153.664.604.827.7313.21
204.304.174.537.2813.21
STHX102.397.017.229.3725.46
153.907.376.538.8625.46
204.887.266.018.5925.46
Table 4. Pressure drop in the heat exchangers and the corresponding reduction in net work and efficiency.
Pressure (bar)Pressure Drop (kPa)Net Work Change (%)Efficiency Change (%)
PHX1011.002.082.12
157.290.490.51
205.400.190.21
STHX100.410.080.08
150.380.030.03
200.340.010.01