Article

Analysis of Microwave Thermal Stress Fracture Characteristics and Size Effect of Sandstone under Microwave Heating

1
School of Resource and Safety Engineering, Central South University, Changsha 410083, China
2
Asteroid Mineral Resources Research Center, Central South University, Changsha 410083, China
*
Author to whom correspondence should be addressed.
Energies 2020, 13(14), 3614; https://doi.org/10.3390/en13143614
Submission received: 28 April 2020 / Revised: 8 July 2020 / Accepted: 10 July 2020 / Published: 14 July 2020

Abstract

:
Microwave-induced rock fracture is one of the promising approaches of achieving non-blasting continuous mining and assisted mechanical rock breaking. It is of great theoretical and practical significance to study the temperature effect and fracture characteristics of rocks of different sizes under microwave heating; however, there are few studies in this field. Microwave heating of φ 50 × 100 mm, φ 50 × 50 mm, and φ 50 × 25 mm sandstone samples with different heating powers and times was performed to measure the temperature of the sample, the microwave energy absorbed, the mass, and the P-wave velocity before and after heating. The results show suppress that (i) under the same heating conditions, the mass difference and the temperature increase range of φ 50 × 100 mm and φ 50 × 50 mm samples are larger than that of the φ 50 × 25 mm samples; (ii) the wave velocity change rate and the damage factor of samples increase with the increase of heating power and time; (iii) different size specimens have different crack- propagation modes. The main crack of φ 50 × 100 mm specimens usually starts from the middle of the height of the specimen; for the φ 50 × 50 mm specimens, it usually starts from the middle or bottom-end surface of the specimen height; the main crack of φ 50 × 25 mm specimens starts from the vertical surface of the specimen. With an increase in the heating time, the length and width of the main crack continuously increase and secondary cracks are generated. The fracture mode of the sample is also related to the size of the sample. The fracture mode can be divided into three parts: melt fracture, thermal-expansion fracture, and secondary thermal-expansion fracture. The relationship between the sample temperature and the absorbed microwave energy is approximately linear.

1. Introduction

The mechanized continuous mining of hard rock in mines of metal ores is a future mining trend and has been applied in some local hard rock areas of mines. Continuous cutting ore rock equipment is used to replace the traditional blasting-based metal ore mining process. The process is simple, dilution loss is small, efficiency is high, and the safety will also be greatly improved. Although mechanical rock breaking mining equipment and technologies, such as Tunnel Boring Machine (TBM) and cantilever mining machines have been practically used to some extent, when the hardness coefficient of the rock is greater than 8, cutter wear, cutting efficiency, and cost increase sharply. For many years, people have been exploring methods and techniques for assisting mechanical rock breaking to solve the above problems and have carried out a lot of research. These rock breaking methods include water jet, carbon dioxide blasting, microwave rock breaking, and laser rock breaking [1,2,3,4]. Microwave heating has attracted widespread attention due to its characteristics of selective, rapid, and overall heating [5]. Existing studies have also shown that the use of microwaves to break hard rocks can reduce the wear of mechanical cutters and improve rock drilling efficiency [6,7], so microwave-assisted mechanical rock breaking is also considered to be one of the most promising emerging rock breaking methods.
An extended scientific literature exists regarding the damage of rocks under microwave heating. Peinsitt [8] studied the changes in the heating rate and P-wave velocity of dry and saturated sandstone (φ 50 × 50 mm, i.e., diameter 50 × height 50 mm) under microwave heating. The results show that the heating rate of saturated sandstone is faster than dry sandstone, and cracks and fractures are more likely to occur than dry sandstone. Hu et al. [9] used nuclear magnetic resonance technology to study the effect of microwave heating on the pore structure of shale (φ 25 × 50 mm). The number of mesopores and macropores increased and the number of micropores decreased. Wang et al. [10] studied the effect of microwave heating on the porosity, permeability, structure, and pore-size distribution of tight sandstone. He et al. [11] studied the thermal damage effect of diorite (25 × 25 × 25 mm) under microwave heating; the sample was heated to 500 °C and began to break, and at 700 °C completely disintegrated, and the possible causes of diorite thermally affected fractures were discussed. Lu et al. [3,12] studied fracture effect and mechanical characteristics of basalt (φ 50 × 100 mm and φ 50 × 50 mm) under microwave heating, and proposed two fracture modes of rock-surface fracture and drilling fracture under microwave action. Qin and Dai [13], Ali and Bradshaw [14,15], and Jones et al. [16,17] used PFC(Particle Flow Code), FLAC(Fast Lagrangian Analysis of Continua), and other numerical simulation software to study the thermal damage of mineral particles by microwave heating. The results show that power density, mineral form, and size affect the number of microcracks inside the ore; the larger the particle size, the higher the efficiency, and heating at high power density can reduce energy input and shorten time. Hartlieb et al. [18] conducted experiments and numerical simulations on microwave-heated basalt (φ 50 × 50 mm), and concluded that when the tensile stress exceeds the tensile strength, cracks are generated and are not restricted by mineral components, whose development is controlled by macro-temperature gradients and sample geometry. Toifl et al. [19,20] used finite-difference-time-domain (FDTD) simulations to study numerical simulations of granite (80 × 80 × 80 mm) under different radiation parameters, showing that changes in temperature and stress fields mainly depend on radiation parameters. Li et al. [21] used COMSOL Multiphysics to perform a full-coupling thermodynamic simulation, and studied the microscale stress–strain variation of a pegmatite sample (φ 50 × 100 mm) under microwave thermal load. H. Satish [22] used finite element simulations to simulate microwave heating of a calcareous rock to determine the temperature profiles and thermal stresses at different microwave heating times and powers, and measured the temperature and strength of blast samples before and after microwave heating. However, none of the above studies considered the size effect of microwave heating rocks.
Here, microwave heating tests were performed on sandstone samples of different sizes by using a special microwave rock breaking system, and the temperature effects, crack propagation, and fracture characteristics of different size samples were obtained. Further, the heating power was monitored in real time to calculate the absorbed microwave energy and obtain the relationship between temperature and energy of different sizes.

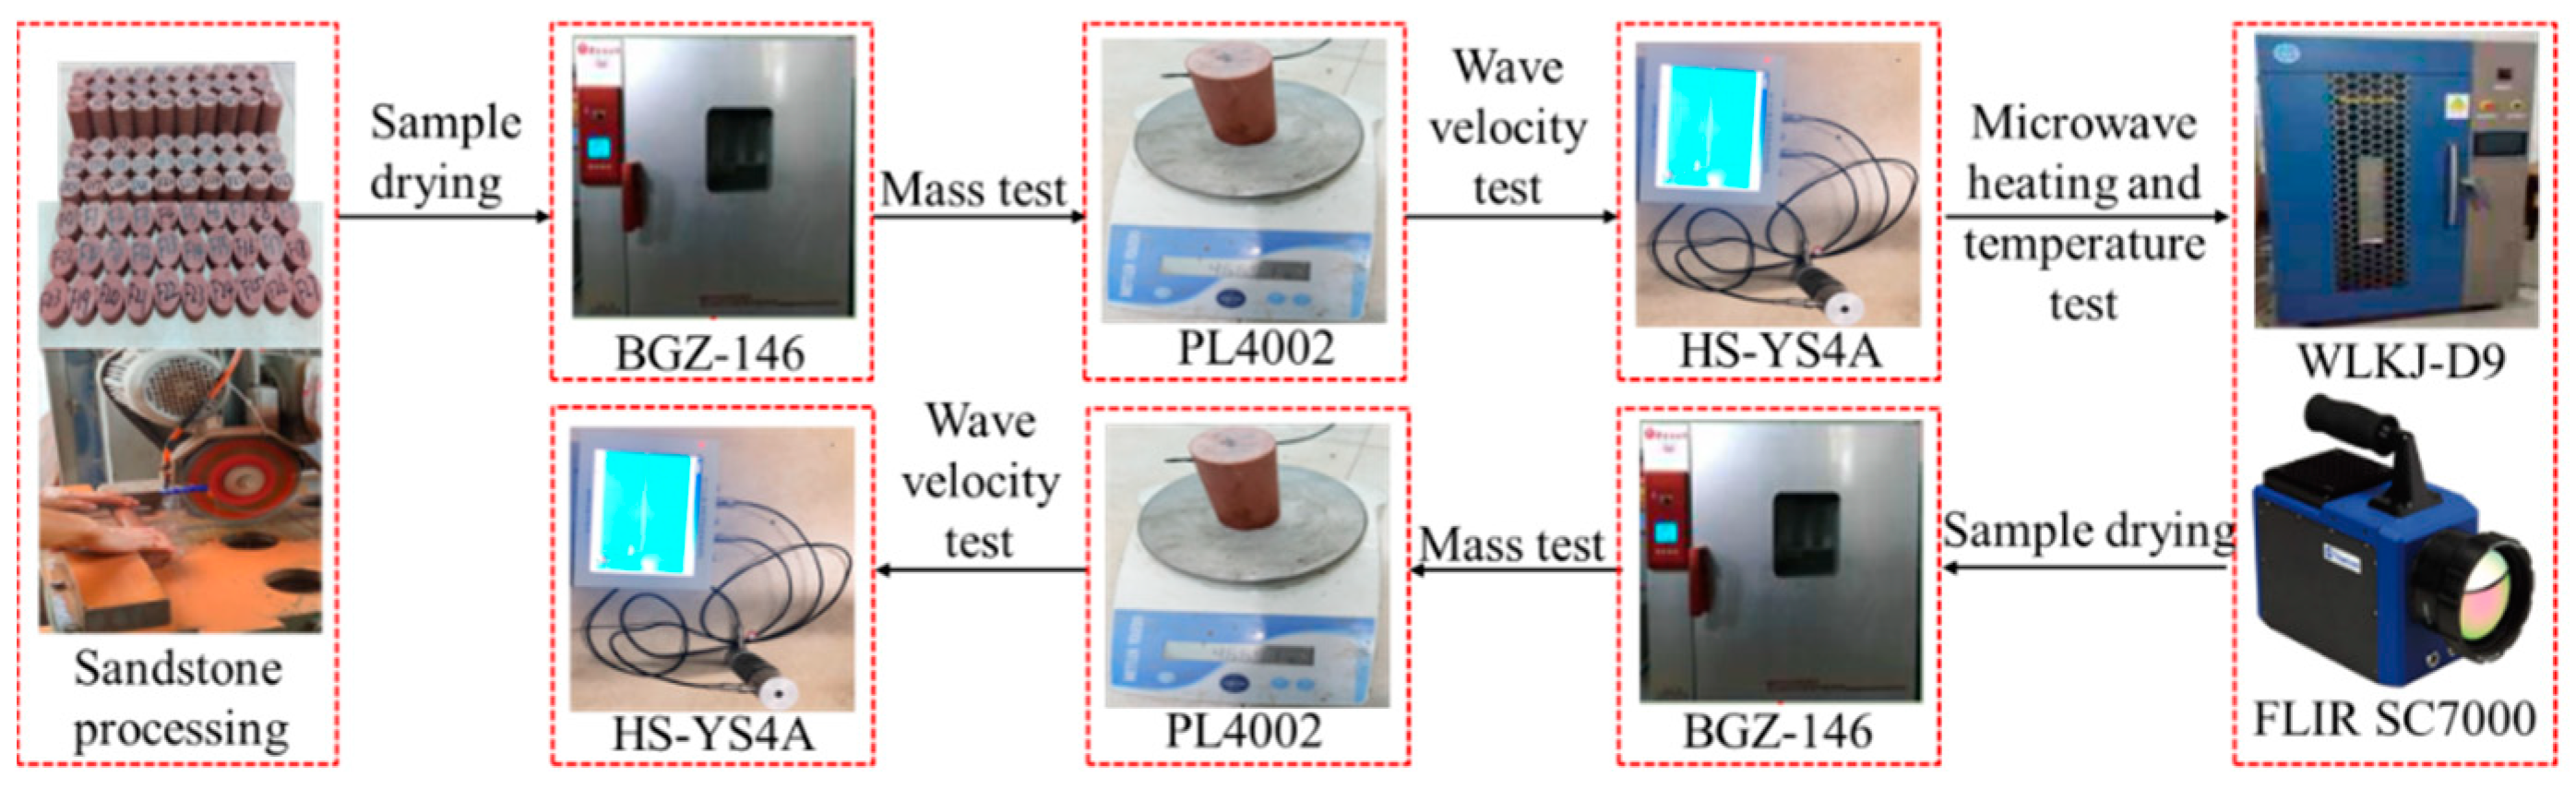
2. Samples, Equipment, and Test Methods

2.1. Rock Samples

The test adopts sandstone samples (from Hunan, China) with dimensions of φ 50 × 100 mm, φ 50 × 50 mm, and φ 50 × 25 mm. The sample components mainly comprised quartz, feldspar, calcite, hematite, chlorite, and mica, which can be identified by XRD test (Table 1), and listed the microwave absorption characteristics of minerals based on previous studies [13,17,23]. The thermal conductivity and heating flow values are respectively 1.302–2.895 (W/(m·K)) and 1.5 HFU(Heat Flow Unit). The samples were placed in a drying box at 105 °C for 48 h before and after heating, and then the mass and P-wave velocity tests were performed to remove large discrete samples.

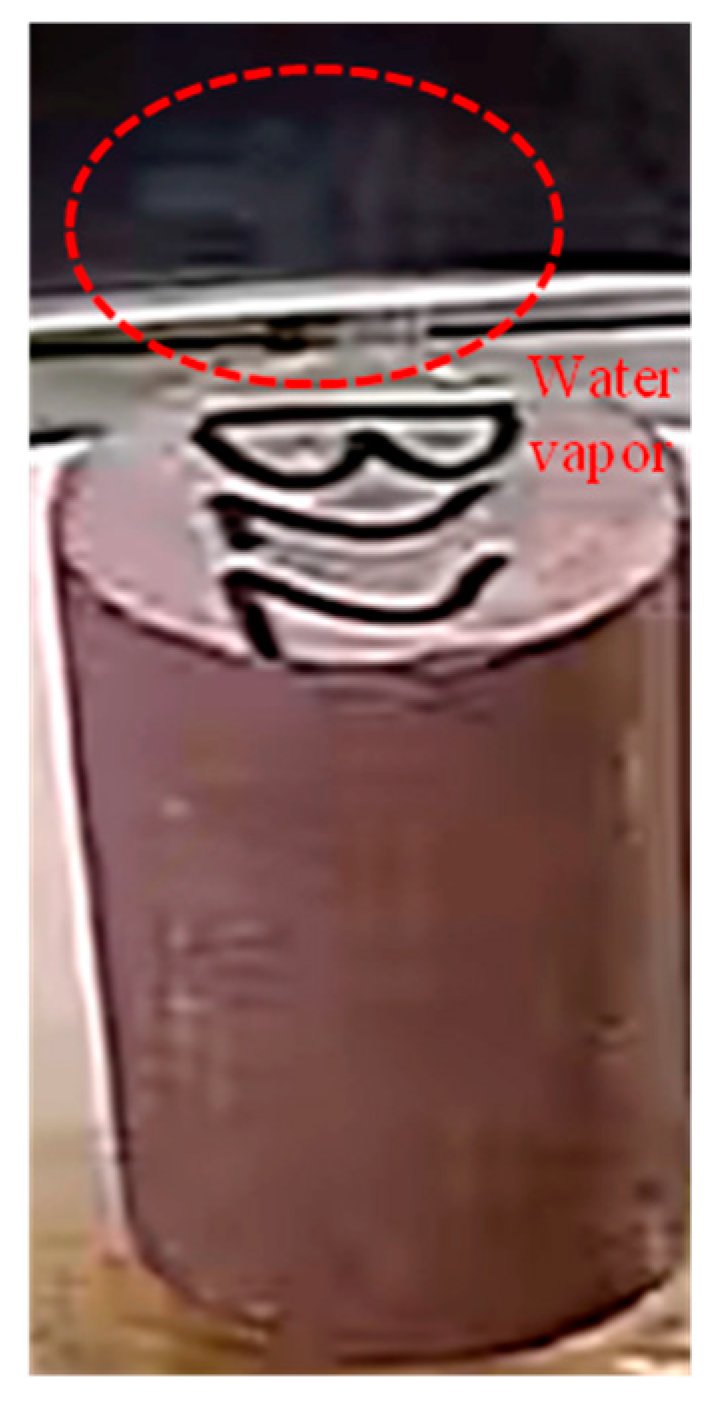
2.2. Microwave Heating Test

The sample was heated by a WLKJ-D9 professional industrial microwave oven (Figure 1). The microwave system uses a multimode resonant cavity with a frequency of 2450 MHz. Its structure mainly includes microwave generator, microwave heating cavity, microwave power test system, monitoring system, control and data acquisition system, and heat extraction system. During the test, the same microwave feed port was used. Through the pre-experiment of different heating power and time, the parameters of obvious microwave heating effect are selected. So the heating power was 1 kW, 2 kW, and 4 kW, and the heating time was 200 s, 400 s, and 600 s (corresponding to total energy of 200 kJ, 800 kJ, 2400 kJ), respectively. Three samples were used for each heating condition for a total of 81 samples, and the initial heating temperature was 25 °C.

2.3. Temperature Test

After the microwave heating of the sample, a FLIR SC7000 infrared thermal imager was used to perform a temperature test (i.e., the surface temperature test of the sample, and the following temperature was the surface temperature) to obtain a cloud map of the sample temperature and allow it to cool to room temperature.

2.4. P-Wave Velocity Test

Before and after the microwave heating, the sample was tested with P-wave velocity using the HS-YS4A rock acoustic wave parameter tester, and the change of the P-wave velocity of the sample before and after the test was obtained. The test equipment and process are shown in Figure 2.

3. Test Results

3.1. Sample Quality

It can be seen from Figure 3 that the difference in sample mass (mass before heating minus mass after heating) increases with increasing power and time, that is, the mass of the sample after microwave heating is smaller than the mass of the sample before heating. Under different heating powers and times, the sample quality difference changes. When the heating power is the same, the longer the heating time, the larger the sample quality difference; when the heating time is constant, the higher the power, the larger the sample quality difference because the total energy received is greater. In addition, under the same heating conditions, the change in mass difference between samples of different sizes also varies. The change in mass difference of φ 50 × 100 mm and φ 50 × 50 mm samples in same power and time is greater than that of φ 50 × 25 mm samples. It is worth noting that when the sample undergoes melt fracture during heating, its mass changes the most, reaching a maximum of 3.77 g. The reasons for the change in sample quality under microwave heating are as follows: (1) The bound water and structural water inside the sample continuously evaporate during microwave heating [24], as seen in Figure 4; (2) The physical and chemical changes of the mineral composition of the sample at a high temperature are shown in Figure 11. Some water molecules (i.e., OH bounded to minerals or hydroxyl-compounds) such as feldspar, mica vaporized at temperature greater than 400 °C; such as quartz change their structure at temperature >573 °C).

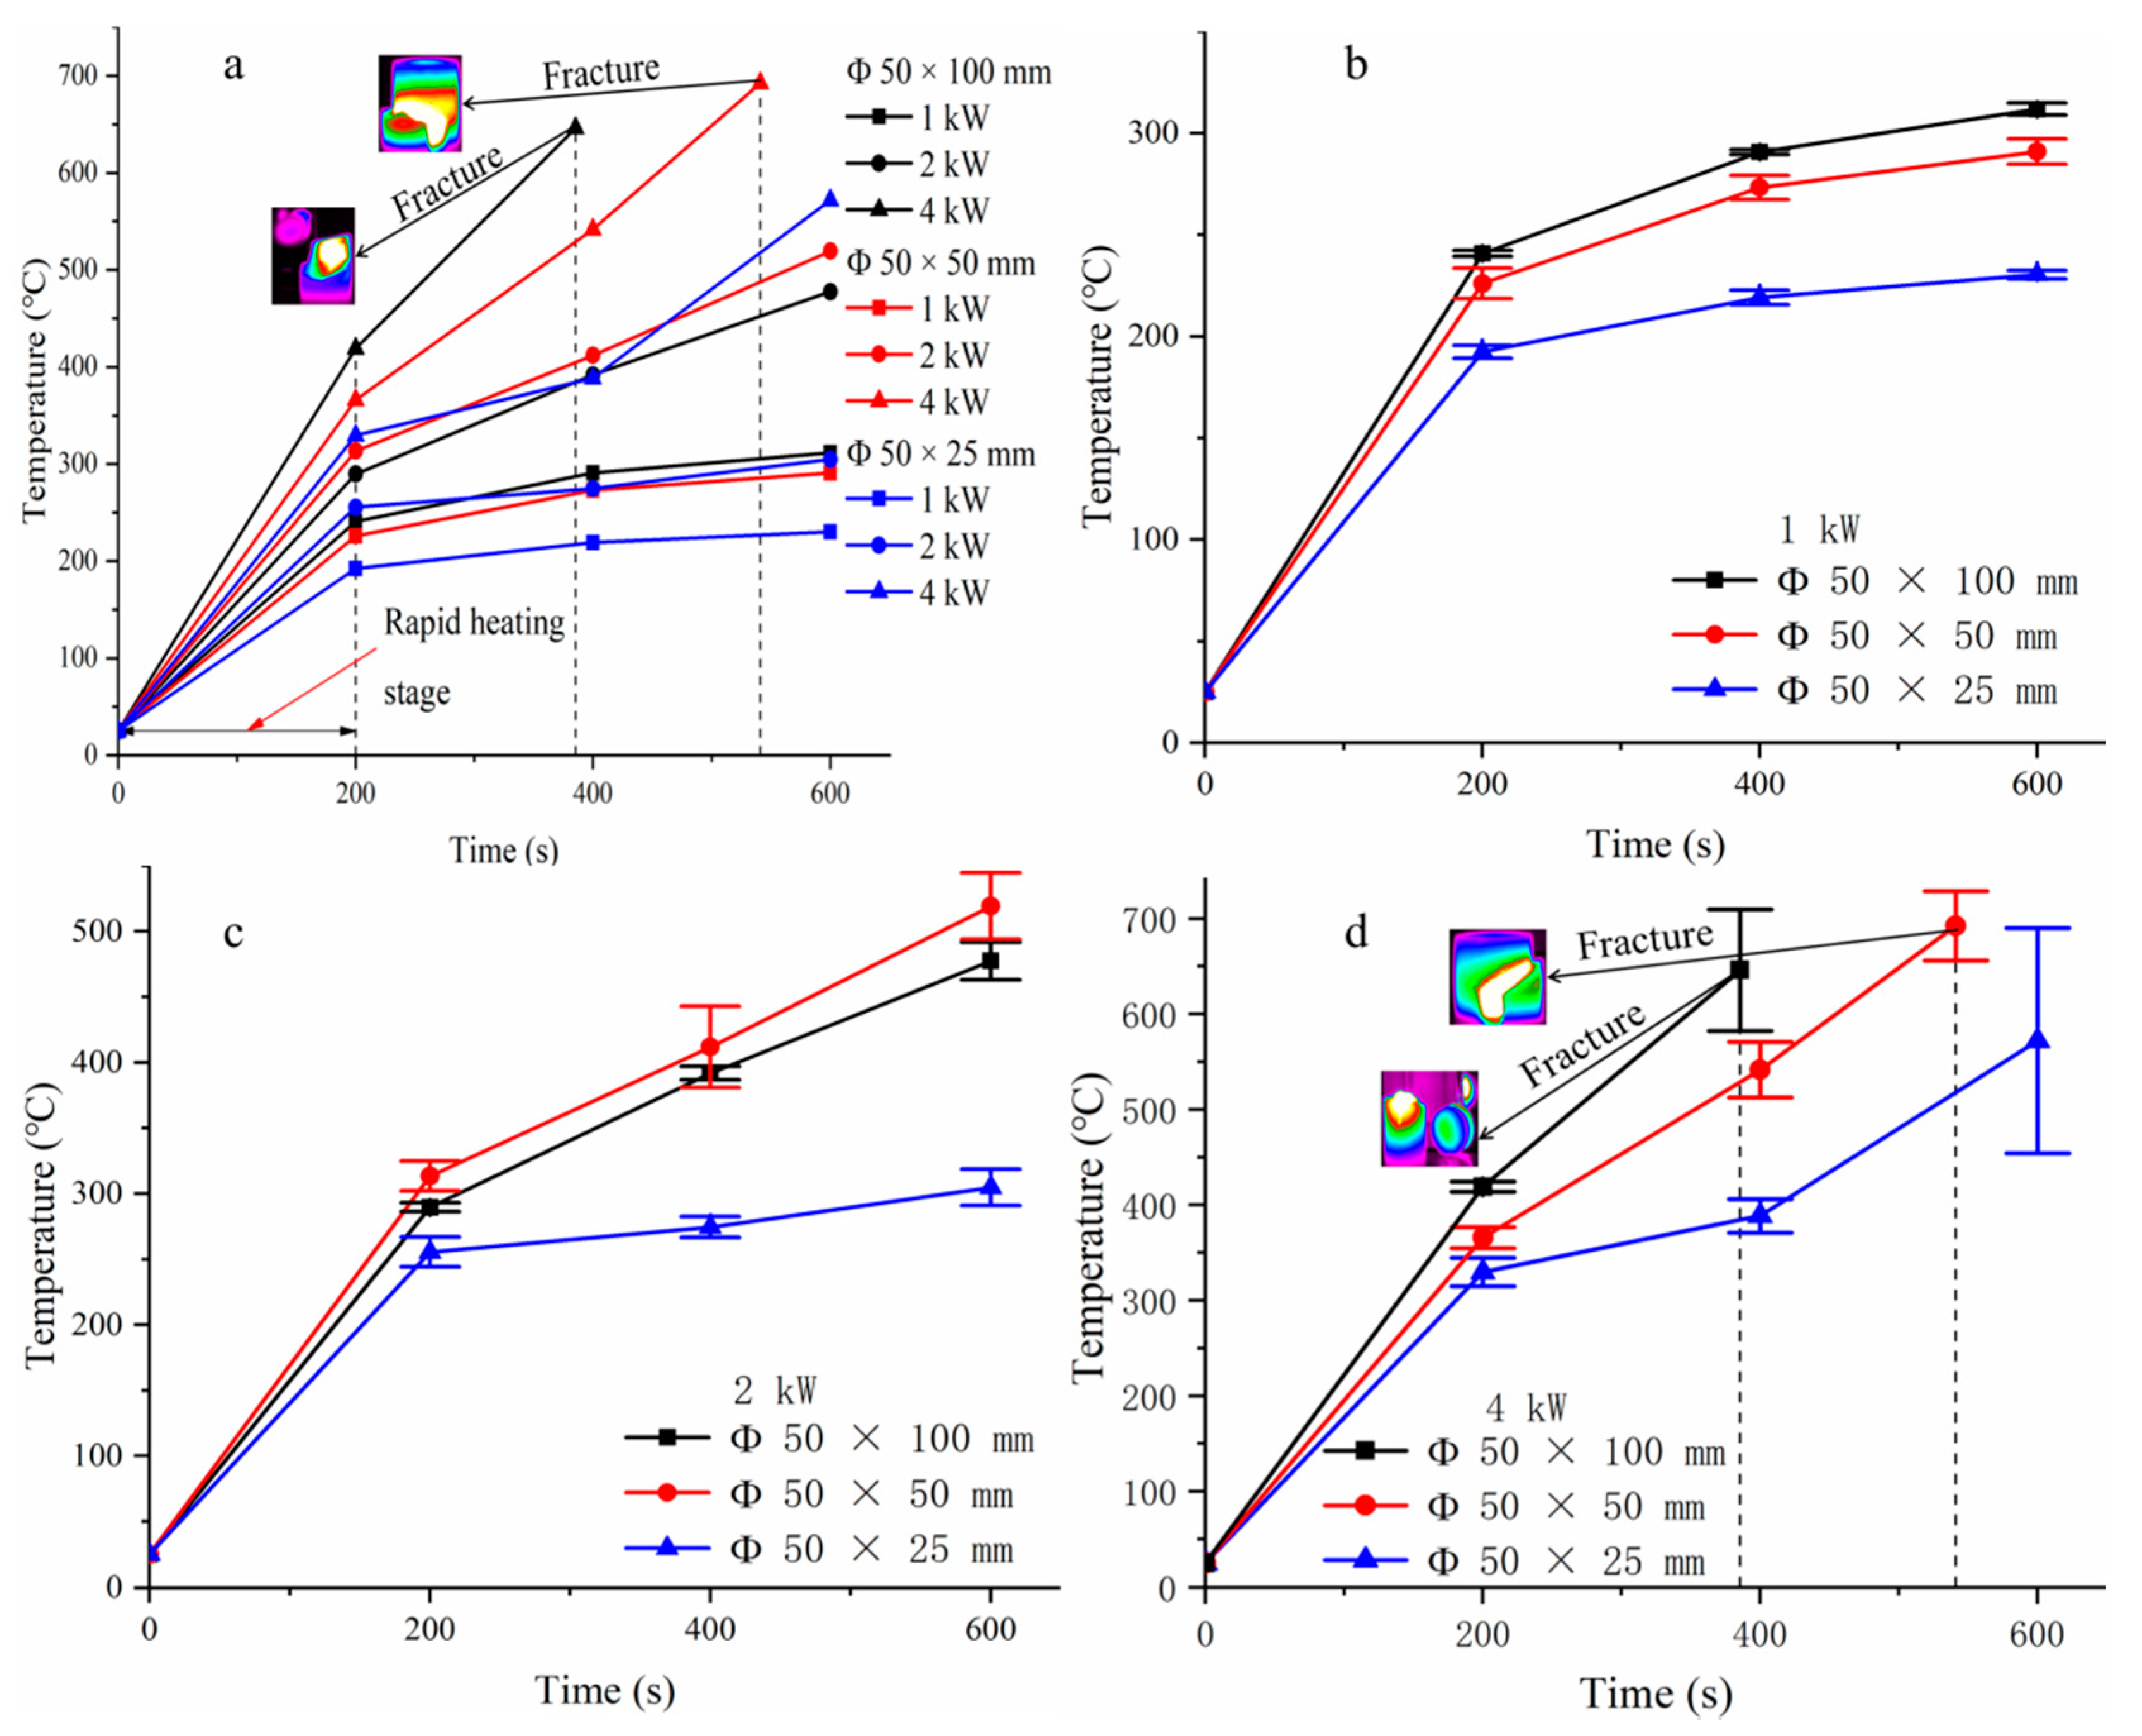
3.2. Sample Temperature

The temperature of the sample varies with power and time, as shown in Figure 5, and the temperature increases with increasing power and time (i.e., total energy received). When the heating power is the same value, the heating rate of the sample is faster in the first 200 s. When the heating time is the same value, the temperature value increases with the increase of power value. When the sample is heated to fracture, its temperature value reaches a maximum value, which can be as high as 692.43 °C.
The temperature values of different size samples also vary under the same heating conditions (Figure 5b–d). The temperature value of the φ 50 × 100 mm sample and the φ 50 × 50 mm sample is greater than that of the φ 50 × 25 mm sample. When the power is 1 kW and 4 kW, the temperature of the φ 50 × 100 mm sample is greater than that of the φ 50 × 50 mm sample, and when the power is 2 kW, the temperature of the φ 50 × 50 mm sample is greater than that of the φ 50 × 100 mm sample. It shows that the temperature change of the sample has size effect.
When the heating power is 4 kW, the fracture time and temperature of the sample are also different (d in Figure 5). The φ 50 × 100 mm sample is fractured when heated to about 385.5 s, and the fracture temperature is 645.91 °C. The φ 50 × 50 mm sample is fractured when it is heated to about 541 s, and the fracture temperature is 692.43 °C, but the φ 50 × 25 mm sample does not fracture when it is heated for 600 s, and the final temperature is 572.02 °C. It is shown that the time required for the specimen to fracture is related to the size of the specimen because of its different capacity of expansion, and when the specimen diameter is the same, the length is approximately larger, and the fracture time is shorter. It is due to the fact that (i) microwave energy does not penetrate identically in small and large specimen; (ii) microwave energy losses are greater for small than for large specimen; (iii) microwave energy reflects my the surface of the specimen. Therefore, microwave heating of larger size rock can achieve better crushing effect in the practice of underground mining.

3.3. P-Wave Velocity of the Sample

After microwave heating, the internal structural conditions and material properties of the sample undergo physical and mechanical changes. The distribution of cracks in the sample is complex, so that the ultrasonic waves undergo refraction and diffraction during the propagation process, and the wave velocity and energy passing through the sample will also change accordingly. Therefore, the magnitude of the wave velocity can reflect the degree of internal damage of the sample after microwave heating.
The wave velocity change rate and damage factor D [25] are calculated using the following formula:
Δ V V 0 = V 0 V V 0 × 100 % ,
D = 1 ( V V 0 ) 2
where V0 and V are P-wave velocity before and after heating, respectively.
It can be seen from Figure 6 that the change law of the wave velocity change rate and damage factor with time and power is basically consistent. With the increase of power and time, the wave velocity change rate and damage factor of the sample also gradually increased, reaching 55% and 0.79, respectively. Taking φ 50 × 25 mm as an example, when the heating power of the sample is 4 kW, the wave velocity change rate and damage factor for 600 s are 1.84 times and for 200 s are 1.65 times, respectively. When the heating time is 600 s, the wave velocity change rate and damage factor of 4 kW are 2.33 times and for 1 kW 2.15 times, respectively. It can be seen that high-power heating is more conducive to reducing the P-wave velocity of the sample and causing internal damage to the sample.

3.4. Specimen Crack Propagation and Fracture Characteristics

3.4.1. Specimen Crack Propagation Characteristics

As shown in Figure 7, taking the sample D27 of φ 50 × 50 mm as an example, the real-time crack propagation characteristics of the sample under microwave heating are as follows: When the sample is initially heated, there are no macroscopic cracks on the surface. When the power is 4 kW and it is heated for 230 s, cracks appear on the surface of the sample. With the increase of time, the cracks continue to expand and form secondary cracks. When heated for 538 s, melting inside the sample can be observed, and then the sample fractures.
The crack propagation characteristics of some typical samples are shown in Figure 8; different sizes of samples have different propagation modes. The main crack of the φ 50 × 100 mm sample starts to crack from the middle of the height of the sample, and then expands along the surface of the sample to form a ring-shaped crack at an angle to the horizontal plane. At the same time, the crack gradually expanded along the vertical direction to the top and bottom of the specimen, and then the crack continued to expand on the horizontal surface of the top and bottom of the specimen. At the same time, the main crack began to branch and form secondary cracks, and eventually formed a through-the-sample crack. The φ 50 × 50 mm sample has two crack growth modes, the first being similar to the crack propagation mode of the φ 50 × 100 mm specimen. The second crack propagation mode starts from the bottom-end surface of the specimen, and extends along the bottom-end surface to the bottom boundary, and then expands in the vertical direction. The vertical cracks spread to a certain degree and begin to form a ring-shaped crack that is horizontal and at an angle to the horizontal plane, and eventually expands to the top of the specimen. The crack of the φ 50 × 25 mm specimen starts to crack from the vertical surface of the specimen, and continuously extends to the upper and lower-end surfaces of the specimen along the vertical direction, and secondary cracks occur on the vertical surface and the upper and lower-end surfaces.
The crack growth of the specimen is also related to power and time. Taking a φ 50 × 50 mm sample as an example, when the heating power is 2 kW, the crack length and number of samples with a heating time of 600 s is greater than the number of samples with a heating time of 400 s. When the heating time is 600 s, the number and length of specimen cracks with a heating power of 4 kW are greater than the samples with a heating power of 2 kW. Increasing the power and time of heating can cause more cracks in the sample. In addition, φ 50 × 100 mm and φ 50 × 50 mm samples are more likely to crack than φ 50 × 25 mm samples under the same heating conditions, which is consistent with the temperature change of the samples under microwave heating (Figure 5).

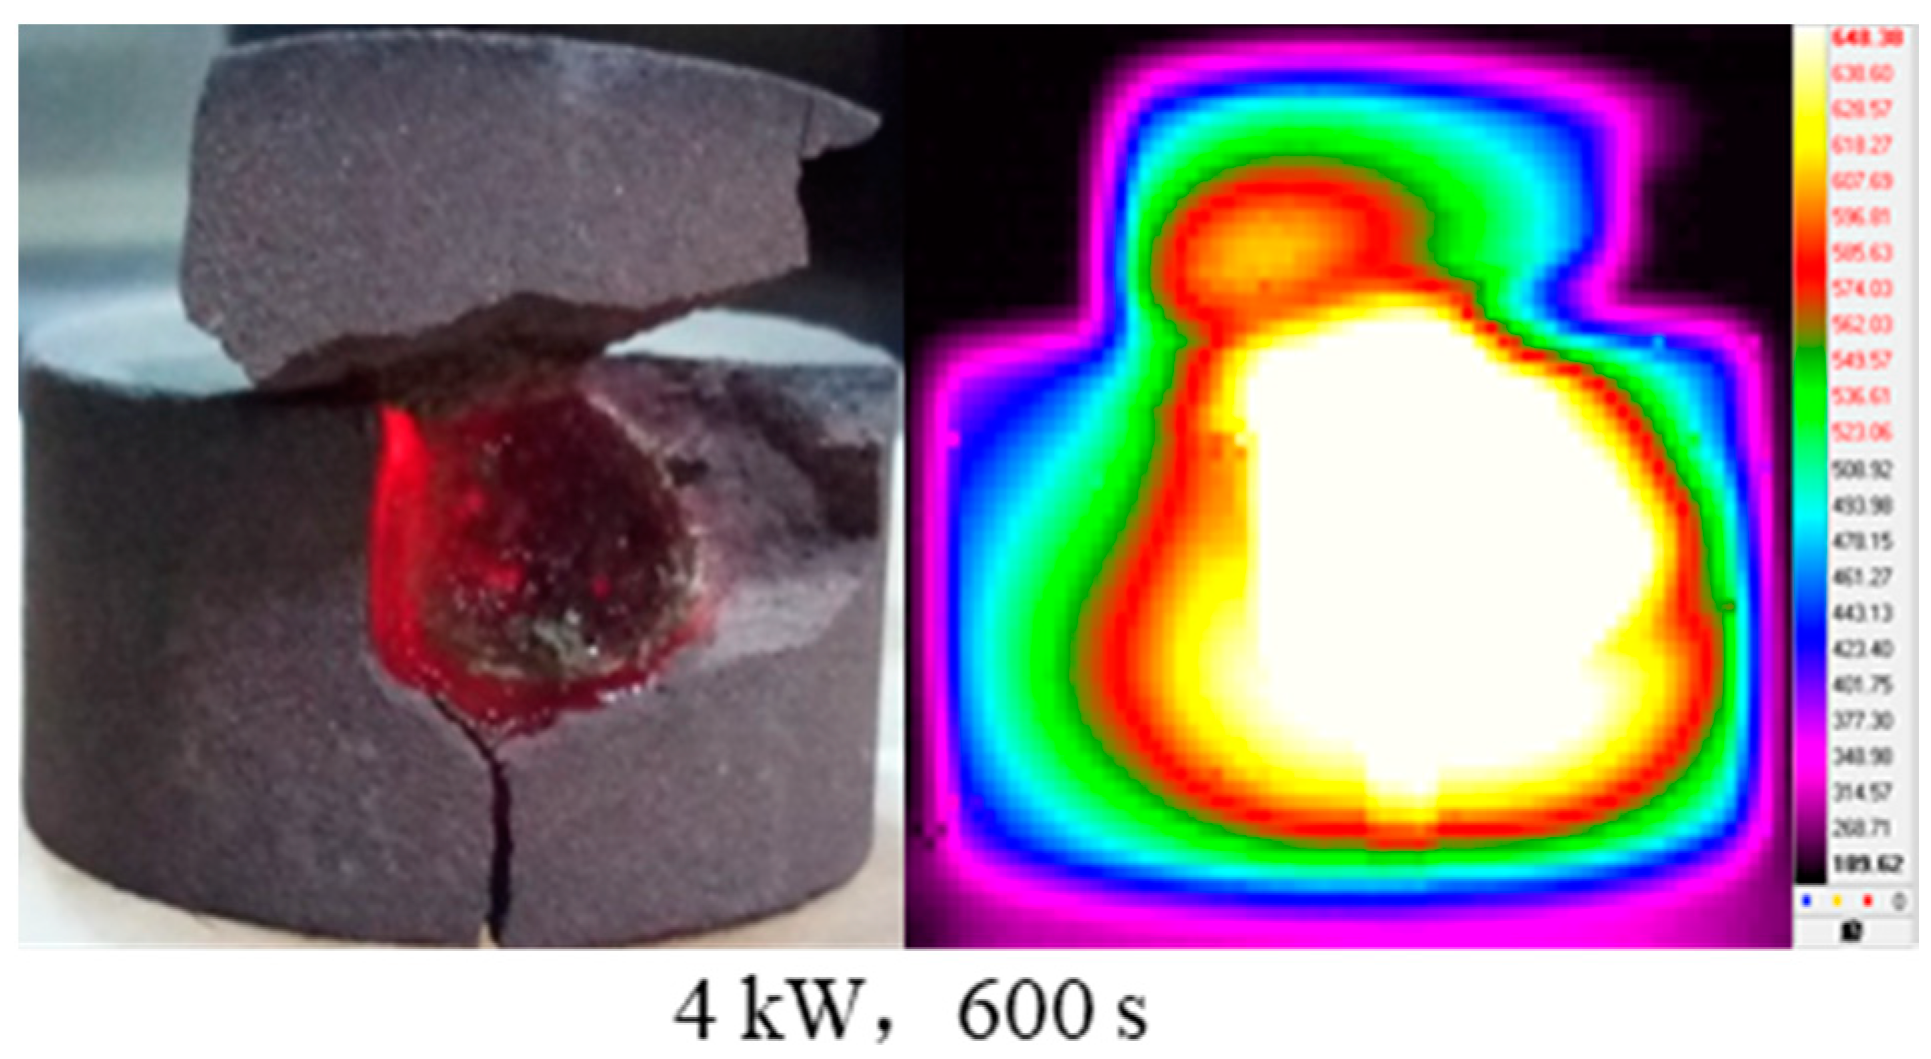
3.4.2. Specimen Fracture Characteristics

(1) Sample fracture mode and temperature
As shown in Figure 9, different sizes of specimens have different fracture modes. The φ 50 × 100 mm specimen is broken into two parts from the middle of the specimen, and the φ 50 × 50 mm specimen is fractured into two parts along the vertical direction from the top of the specimen. In the φ 50 × 25 mm sample, local rock blocks at the top of the sample fractured and protruded. From the infrared thermal imaging chart, it can be seen that the temperature of the molten hematite inside the sample is the highest, up to 706.01 °C; with the hematite as the center, the temperature gradually decreases outward.
The instant the sample fractures, that is, when the molten hematite first contacts the air, the molten hematite produces a bright flame (Figure 10). Jerby and Shoshani [26] observed the same phenomenon in microwave heating of basalt. After the heating was stopped, the flame extinguished immediately, and the molten hematite appeared red, and gradually cooled in the natural environment from red to black.
(2) Analysis of sample molten minerals
The partially cooled fractured specimens are shown in Figure 11. One common feature of all fractured specimens is that they contain molten hematite. After cooling, the smelting hematite can be roughly divided into three parts: (1) the hematite mineral after melting and cooling is approximately spherical, and the interior is hollow (f) or hollowed out (g), showing black, uneven surface with stomata, and a certain strength; (2) quartz, feldspar, calcite, and other minerals carried by molten hematite are wrapped around hematite (b–d, f–h) or integrated with hematite (a, e, i); (3) thin-walled deposits formed by mineral cooling. These thin-walled deposits are located in the periphery of minerals such as quartz. They are mainly composed of dark-green thin-walled deposits and off-white thin-walled deposits (b, d, f).
(3) Schematic diagram of sample fracture mode
As shown in Figure 12, the sample melt fracture mode can be divided into three types: (1) melt fracture (a). Hematite is located in the middle boundary area of the sample. Under microwave heating, hematite melts and flows to the sample boundary, forming molten minerals in the boundary area, and the upper part of the sample generates a torque force under the action of gravity to fracture the sample; (2) thermal-expansion fracture (b–d). Hematite is located in the center of the sample. Under microwave heating, hematite rapidly heats up and melts to generate thermal-expansion force. Cracks are generated inside the sample and continue to spread to the surface of the sample to form a through crack, and eventually the sample is completely broken; (3) local thermal-expansion and fracture (e). Hematite is located in the sample boundary area. Under microwave heating, hematite rapidly heats up and the thermal-expansion force generated by melting causes the sample to form a local through crack, and eventually the sample is partially cracked.

4. Analysis and Discussion

4.1. Effect of Energy on Sample Temperature

Lu et al. [12] used microwave incident energy to calculate the relationship between the fracture and energy consumption of basalt samples, and ignored the microwave energy reflected from rock samples. This test uses a power meter to monitor the incident power and reflected power during microwave heating in real time, and then calculates the microwave energy absorbed by the sample. The calculation formula is as follows:
P 0 = P 1 P 2
W = 0 t P 0 d t
where P0—power absorbed by the sample; P1—incident power which is the set heating power; P2—power reflected by the sample (power meter in microwave equipment records P2 per second); W—microwave energy absorbed by the sample; t—heating time.
As shown in Figure 13, the microwave energy absorbed by the sample is approximately linear with the temperature. The fitting degree of the relationship between energy and temperature of different size samples is not the same. The fitting degree of the φ 50 × 100 mm sample and the φ 50 × 50 mm sample is greater than that of the φ 50 × 25 mm sample. The fitting degree of the relationship between temperature and energy is less than 1 for two main reasons: (1) minerals with strong absorbing ability in the sample are randomly distributed in the sample, and the temperature at different positions of the measurement sample is also different; (2) part of the energy absorbed by the sample increases the temperature, and the other part is used to generate and propagate internal cracks in the sample.

4.2. Effect of Energy on Damage Factor

As shown in the Figure 14, the fitting curves of energy and damage factor of different size specimens are different. Among them, the fitting degree of φ 50 × 50 mm sample is the highest, up to 0.93, while the fitting degree of φ 50 × 100 mm and φ 50 × 25 mm samples is low. It is mainly due to the individual differences and sizes of the samples, and the most important thing is that the energy absorbed by the samples is different.

4.3. Fracture Mechanism of Samples under Microwave Heating

Rock samples continuously absorb energy under microwave heating to increase their temperature, decrease the P-wave velocity, crack generation and propagation, and ultimate fracture. This is due to the different microwave absorption capacity and thermal expansion of different minerals in the rock. Minerals generally have different linear expansion coefficients in different directions. Minerals with strong absorptive capacity provide heat, and minerals with a high thermal coefficient of expansion provide thermal-expansion force [12]. Along the temperature gradient and thermal-expansion force inside the sample, intergranular cracks and transgranular cracks are generated. These cracks divide the mineral combination into mineral granules. As the heating time continues to increase, melting occurs at the corners of the hematite particles, and then a molten film surrounding the particles is formed [27,28,29]. The number of molten mineral particles is continuously increasing to form molten slurry. The molten slurry carries surrounding mineral particles flowing along the cracks and generates thermal-expansion force, increasing the length and width of the cracks, causing macro cracks and fractures in the sample. In addition, mineral crystals can be divided into an elastic expansion stage, a plastic expansion deformation stage, and a thermal cracking deformation stage with increasing temperature. When the temperature exceeds the crystal’s ultimate expansion temperature, thermal cracking due to excessive expansion and loss of heat-carrying capacity [30] make cracks and melting more prone to occur in the sample.

5. Conclusions

By studying and analyzing the mass, temperature, P-wave velocity, crack propagation, and fracture mode of rocks of different sizes under microwave heating, the following conclusions are drawn:
(1)
microwave heating of rock samples of different sizes has different heating effects. Under the same heating conditions, the mass difference and temperature increase range of φ 50 × 100 mm and φ 50 × 50 mm samples are larger than that of φ 50 × 25 mm samples;
(2)
different size specimens have different crack-propagation modes. The main crack of φ 50 × 100 mm specimens usually starts from the middle of the height of the specimen; the main crack of φ 50 × 50 mm specimens usually starts from the middle or bottom-end surface of the specimen height; the main crack of the φ 50 × 25 mm specimen starts to crack from the vertical surface of the specimen. As the heating time increases, the crack length and width also increase;
(3)
different sizes of specimens have different fracture modes (Only sandstone with the same mineral composition). The φ 50 × 100 mm sample fractured from the middle of the sample into two sections, the φ 50 × 50 mm sample fractured from the top of the sample into two parts in an approximately vertical direction, and φ 50 × 25 mm specimens have fractured bumps on the local rock blocks at the top of the specimens;
(4)
the microwave energy absorbed by the sample is approximately linear with the temperature. The more microwave energy absorbed by the sample, the higher the temperature, the greater the sample mass difference, the greater the P-wave velocity change rate and damage factor, the more developed the crack network, and the shorter the fracture time.

Author Contributions

Conceptualization, F.G. and Y.S.; Formal analysis, F.G., Y.S., and K.Z.; Investigation, F.G. and Y.S.; Methodology, F.G. and Y.S.; Writing—original draft, Y.S. All authors have read and agreed to the published version of the manuscript.

Funding

This work was supported by the National Natural Science Foundation of China (Grant No. 51474252; 51774323), and graduate students of Central South University explored and innovated independently (Grant No. 2019zzts664).

Conflicts of Interest

The authors declare no conflict of interest.

References

  1. Gao, F.; Tang, L.; Zhou, K.; Zhang, Y.; Ke, B. Mechanism Analysis of Liquid Carbon Dioxide Phase Transition for Fracturing Rock Masses. Energies 2018, 11, 2909. [Google Scholar] [CrossRef] [Green Version]
  2. Khan, N.; Abas, N.; Kalair, A. Pulsed and Continuous Wave (CW) Lasers in the Oil, Gas, Coal and Ignition Industries. Lasers Eng. 2015, 30, 137–157. [Google Scholar]
  3. Lu, G.M.; Feng, X.T.; Li, Y.H.; Zhang, X.W. The Microwave-Induced Fracturing of Hard Rock. Rock Mech. Rock Eng. 2019, 52, 3017–3032. [Google Scholar] [CrossRef]
  4. Lu, Y.Y.; Huang, F.; Liu, X.C.; Ao, X. On the failure pattern of sandstone impacted by high-velocity water jet. Int. J. Impact Eng. 2015, 76, 67–74. [Google Scholar] [CrossRef]
  5. Chen, T.T.; Dutrizac, J.E.; Haque, K.E.; Wyslouzil, W.; Kashyap, S. The Relative Transparency of Minerals to Microwave Radiation. Can. Metall. Q. 1984, 23, 349–351. [Google Scholar] [CrossRef]
  6. Hassani, F.; Nekoovaght, P.M.; Gharib, N. The influence of microwave irradiation on rocksfor microwave assisted underground excavation. J. Rock Mech. Geotech. Eng. 2016, 8, 1–15. [Google Scholar] [CrossRef] [Green Version]
  7. Hassani, F.; Radziszewski, P.; Ouellet, J.; Nokkent, M.; Nekoovaght, P. Microwave Assisted Drilling and Its Influence on Rock Breakage A Review. In Proceedings of the ISRM International Symposium—5th Asian Rock Mechanics Symposium, Tehran, Iran, 24–26 November 2008. [Google Scholar]
  8. Peinsitt, T.; Kuchar, F.; Hartlieb, P.; Moser, P.; Kargl, H.; Restner, U.; Sifferlinger, N.A. Microwave heating of dry and water saturated basalt, granite and sandstone. Int. J. Min. Miner. Eng. 2010, 2, 18–29. [Google Scholar] [CrossRef]
  9. Hu, G.Z.; Sun, C.; Huang, J.X.; Xu, G.; Zhu, J.Q. Evolution of Shale Microstructure under Microwave Irradiation Stimulation. Energy Fuels 2018, 32, 11467–11476. [Google Scholar] [CrossRef]
  10. Wang, H.C.; Rezaee, R.; Saeedi, A. Preliminary study of improving reservoir quality of tight gas sands in the near wellbore region by microwave heating. J. Nat. Gas Sci. Eng. 2016, 32, 395–406. [Google Scholar] [CrossRef] [Green Version]
  11. He, L.P.; Chen, Y.; Zeng, J.S.; Hu, Q.J.; Shao, D.D.; Zhang, H.B.; Lu, X.R. The thermal damaging process of diorite under microwave irradiation. Frat. Integrita Strut. 2019, 47, 65–73. [Google Scholar] [CrossRef]
  12. Lu, G.M.; Feng, X.T.; Li, Y.H.; Hassani, F.; Zhang, X.W. Experimental Investigation on the Effects of Microwave Treatment on Basalt Heating, Mechanical Strength, and Fragmentation. Rock Mech. Rock Eng. 2019, 52, 2535–2549. [Google Scholar] [CrossRef]
  13. Like, Q.; Jun, D. Analysis on the growth of different shapes of mineral microcracks in microwave field. Frat. Integrita Strut. 2016, 342–351. [Google Scholar] [CrossRef] [Green Version]
  14. Ali, A.Y.; Bradshaw, S.M. Quantifying damage around grain boundaries in microwave treated ores. Chem. Eng. Process. 2009, 48, 1566–1573. [Google Scholar] [CrossRef]
  15. Ali, A.Y.; Bradshaw, S.M. Bonded-particle modelling of microwave-induced damage in ore particles. Miner. Eng. 2010, 23, 780–790. [Google Scholar] [CrossRef]
  16. Jones, D.A.; Kingman, S.W.; Whittles, D.N.; Lowndes, I.S. Understanding microwave assisted breakage. Miner. Eng. 2005, 18, 659–669. [Google Scholar] [CrossRef]
  17. Jones, D.A.; Kingman, S.W.; Whittles, D.N.; Lowndes, I.S. The influence of microwave energy delivery method on strength reduction in ore samples. Chem. Eng. Process. 2007, 46, 291–299. [Google Scholar] [CrossRef]
  18. Hartlieb, P.; Leindl, M.; Kuchar, F.; Antretter, T.; Moser, P. Damage of basalt induced by microwave irradiation. Miner. Eng. 2012, 31, 82–89. [Google Scholar] [CrossRef]
  19. Toifl, M.; Hartlieb, P.; Meisels, R.; Antretter, T.; Kuchar, F. Numerical study of the influence of irradiation parameters on the microwave-induced stresses in granite. Miner. Eng. 2017, 103, 78–92. [Google Scholar] [CrossRef]
  20. Toifl, M.; Meisels, R.; Hartlieb, P.; Kuchar, F.; Antretter, T. 3D numerical study on microwave induced stresses in inhomogeneous hard rocks. Miner. Eng. 2016, 90, 29–42. [Google Scholar] [CrossRef]
  21. Li, J.L.; Kaunda, R.B.; Arora, S.; Hartlieb, P.; Nelson, P.P. Fully-coupled simulations of thermally-induced cracking in pegmatite due to microwave irradiation. J. Rock Mech. Geotech. Eng. 2019, 11, 242–250. [Google Scholar] [CrossRef]
  22. Satish, H. Exploring Microwave Assisted Rock Breakage for Possible Space Mining Application. Master Thesis, McGill University, Montreal, QC, Canada, 2005. [Google Scholar]
  23. Lu, G.M.; Li, Y.H.; Hassani, F.; Zhang, X.W. The influence of microwave irradiation on thermal properties of main rock-forming minerals. Appl. Therm. Eng. 2017, 112, 1523–1532. [Google Scholar] [CrossRef]
  24. Sun, Q.; Zhang, Z.; Xue, L.; Zhu, S. Physico-mechanical properties variation of rock with phase transformation under high temperature. Chin. J. Rock Mech. Eng. 2013, 32, 935–942. [Google Scholar]
  25. Zhao, H.; Yin, G.; Chen, L. Experimental study on effect of temperature on sandstone damage. Chin. J. Rock Mech. Eng. 2009, 28, 2784–2788. [Google Scholar]
  26. Jerby, E.; Shoshani, Y. Localized microwave-heating (LMH) of basalt—Lava, dusty-plasma, and ball-lightning ejection by a miniature volcano. Sci. Rep. 2019, 9, 1–15. [Google Scholar] [CrossRef]
  27. Jin, Z.-M.; Green, H.W.; Zhou, Y. Melt topology in partially molten mantle peridotite during ductile deformation. Nature 1994, 372, 164–167. [Google Scholar] [CrossRef]
  28. Zeng, J.S.; Hu, Q.; Chen, Y.; Shu, X.; Chen, S.; He, L.; Tang, H.; Lu, X. Experimental investigation on structural evolution of granite at high temperature induced by microwave irradiation. Mineral. Petrol. 2019, 113, 745–754. [Google Scholar] [CrossRef]
  29. Zhu, W.L.; Gaetani, G.A.; Fusseis, F.; Montesi, L.G.J.; De Carlo, F. Microtomography of Partially Molten Rocks: Three-Dimensional Melt Distribution in Mantle Peridotite. Science 2011, 332, 88–91. [Google Scholar] [CrossRef] [Green Version]
  30. Ming, L. Research on Rupture Mechanisms of Coal Measures Sandstone under High Temperature and Impact Load. Ph.D. Thesis, China University of Mining and Technology, Beijing, China, 2014. [Google Scholar]
Figure 1. Schematic diagram of WLKJ-D9 professional industrial microwave oven.
Energies 13 03614 g001
Figure 2. Test equipment and flowchart.
Energies 13 03614 g002
Figure 3. Relationship between mass difference and heating power and time.
Energies 13 03614 g003
Figure 4. Evaporation of bound water and structural water in the sample.
Energies 13 03614 g004
Figure 5. Relationship between sample temperature and power, time and size effect of temperature change. (a-Relationship between temperature and time, power and size; b-The relationship between temperature and time of samples with different sizes at 1kW; c-The relationship between temperature and time of samples with different sizes at 2kW; d-The relationship between temperature and time of samples with different sizes at 4kW).
Energies 13 03614 g005
Figure 6. Relationship between wave velocity change rate and damage factor with power and time for samples of different sizes. (Note: fractured samples were not tested for P-wave velocity). (From top to bottom, the three pictures show the relationship between wave velocity change rate and damage factor of φ 50 × 100 mm, φ 50 × 50 mm and φ 50 × 25 mm specimens with power and time.).
Energies 13 03614 g006aEnergies 13 03614 g006b
Figure 7. Real-time monitoring of crack propagation of φ 50 × 50 mm specimen.
Energies 13 03614 g007
Figure 8. Crack propagation characteristics of typical samples; (1:1 sketch of real crack sample).
Energies 13 03614 g008
Figure 9. Infrared thermal image of specimen fracture.
Energies 13 03614 g009aEnergies 13 03614 g009b
Figure 10. Fracture moment of the specimen.
Energies 13 03614 g010
Figure 11. Cooling diagram of specimen fracture. 1—Hematite after melt cooling; 2—quartz, feldspar, calcite and other minerals; 3—thin-walled deposits formed by mineral cooling. ①—Dark-green thin-walled deposits; ②—off-white thin-walled deposits. (ad-φ 50 × 100 mm sample; eg-φ 50 × 50 mm sample; h,i-φ 50 × 25 mm sample).
Energies 13 03614 g011aEnergies 13 03614 g011b
Figure 12. Schematic diagram of specimen fracture mode. (a)—melt fracture (corresponds to a in Figure 11); (bd)—thermal-expansion fracture (corresponds to b–d,f in Figure 11); (e)—local thermal-expansion fracture (corresponds to e,g–i in Figure 11).
Energies 13 03614 g012
Figure 13. Relationship between microwave energy absorbed by the sample and temperature.
Energies 13 03614 g013
Figure 14. Relationship between microwave energy absorbed by the sample and damage factor.
Energies 13 03614 g014
Table 1. XRD composition analysis and mineral microwave absorption characteristics of sandstone.
MineralQuartzFeldsparCalciteHematiteChloriteMica
Content (%)57.5925.3811.382.791.631.23
Microwave absorbing propertiesVery weakWeakWeakStrongWeakWeak or medium

