Abstract
To contribute to the economic viability of waste heat recovery systems application based on the organic Rankine cycle (ORC) under real operation condition of natural gas engines, this article presents a thermoeconomic optimization results using the particle swarm optimization (PSO) algorithm of a simple ORC (SORC), regenerative ORC (RORC), and double-stage ORC (DORC) integrated to a GE Jenbacher engine type 6, which have not been reported in the literature. Thermoeconomic modeling was proposed for the studied configurations to integrate the exergetic analysis with economic considerations, allowing to reduce the thermoeconomic indicators that most influence the cash flow of the project. The greatest opportunities for improvement were obtained for the DORC, where the results for maximizing net power allowed the maximum value of 99.52 kW, with 85% and 80% efficiencies in the pump and turbine, respectively, while the pinch point temperatures of the evaporator and condenser must be 35 and 16 °C. This study serves as a guide for future research focused on the thermoeconomic performance optimization of an ORC integrated into a natural gas engine.
1. Introduction
The extensive use of industrial generation engines worldwide, the low efficiency (which does not exceed 42%), and the potential of the waste gases generated, makes this thermal machine a central research issue [1]. Several methods have been proposed to improve the efficiency of these engines. One has been the implementation of an organic Rankine cycle (ORC) as a waste heat recovery system from the exhaust gases, where the working fluids play an important role in the optimization study to obtain better performance in the process [2,3,4].
In a power generation system, several thermodynamic cycles were implemented for waste heat recoveries, such as the ORC, the Kalina cycle, and the steam Rankine cycle. The complex structure of the Kalina cycle, the operational requirement of the steam Rankine cycle such as the high operating pressures and high risk of erosion, means the ORC cycle has the advantage given its simplicity, high reliability, and easy maintenance, which uses organic fluids for its operation. In addition, ORC is more suitable for using low and moderate energies (coolant engines and exhaust gases, for example) than the Kalina cycle and the steam Rankine [5]. However, the different waste heat recovery configurations based on ORC cycle should be studied to be optimized under a thermoeconomic point of view for a particular heat source. Lion et al. [6] present a complete thermodynamic study of a Winterthur Gas & Diesel’s marine diesel engine, which is alow-speed 6 MW of power, using Ricardo Wave simulation software (2018.1, Ricardo UK Ltd, United Kingdom). The model was validated by comparing the results with experimental data, an exhaust gas recirculation low-pressure architecture was implemented to measure engine performance within the framework of international maritime organization Tier III regulations, where the data obtained from the simulation were the inputs used in a thermodynamic model implemented in engineering equation solver, capable of quantifying the performance of the ORC, of evaluating the viability of the proposed system. From the results, it is observed that about 5% of annual fuel consumption would be saved for the system without ORC since improving the efficiency would help to maximize the fuel economy. This research is limited to a thermodynamic study of several ORC architectures, but thermoeconomic indicators were not considered in detail.
Additionally, Liu et al. [7] proposed different modifications to the configurations of the ORC cycle and how to evaluate the performance of this cycle, where they presented ORC best practice, and with these proposed modifications a thermal efficiency of 18.57% was achieved, higher than the other models evaluated, thus the study provides to future researchers relevant information to evaluate the cost-benefit of each configuration and determine which direction to take for further improvements, but the optimal practical reported for the ORC systems applied only to diesel engines and the contribution presented in this research is oriented to industrial gas engines.
In order to increase the energy efficiency, different modifications have been proposed to the ORC architecture, several of the proposed improvements aim to optimize the temperature profile, where the organic working fluid follows the external heat source in order to reduce the exergy destroyed in the evaporator and thus increase the general second low efficiency of the system. One of the modifications to the architecture of this system is known as RORC, where research has been carried out to increase the efficiency of the cycle by 9.29%, and from the data obtained from these studies it can also be appreciated that both the RORC and the simple ORC (SORC) work better with drier fluids, where the efficiency of the cycle was also affected by the critical temperature [8,9,10]. These studies are limited to compare only the SORC and RORC cycles, and the double-stage ORC (DORC) study is not integrated with exhaust gases from a natural gas engine as a heat source.
In addition to these changes, more than one stage of the evaporation of the working fluid was added, where each stage has a different temperature and working pressure. This modification is considered in the DORC system, for this system was able to increase the efficiency with respect to SORC between 8.97% and 25% depending on the operating conditions described according to Braimakis et al. [11] and Yang et al. [12] investigations. However, this system has not been optimized and integrated to a GE Jenbacher engine type 6 as a bottoming cycle, and in thermoeconomic terms, some indicators of this thermal engine with ORC have not been studied in a real operational context, such as the leveled cost of energy (LCOE), the specific investment cost (SIC), and the payback period (PBP), which allow the technical and economic feasibility of this solution to be determined.
Huang et al. [13] studied the influence of exhaust heat distribution on the DORC performance of a waste heat recovery system. For this case study, two DORCs were used; both cycles had a high-temperature loop and a low-temperature loop. In one of these variations of the DORC both loops for heat recovery were implemented, while in the other only the high-temperature loop was used. For the high temperature working fluid candidates were water, methanol, toluene, R245fa, and pentane, and for the low only R143a was used. To measure the influence of the exhaust heat distribution on the equipment performance, the net power generated, exergetic efficiency, the heat transfer area of the heat exchangers (UA), and the unit electricity production cost of the system (EPC) were used as criteria, and from the results it was observed that only the high-temperature loop was used for heat recovery to obtain a net power (117.46 kW), energy efficiency (57.15%), UA (65.02 kW/K), and EPC (0.0532 $/kW h). In this research, there is not a comparative study between different configurations to determine the most effective cycle. For this reason, it is considered as a relevant study to evaluate and optimize different waste heat recovery configurations for a widely used industrial gas engine of 2 MW. Additionally, this result was not found in the bibliographic review.
The main contribution of this article is the analysis according to different parameters of the feasibility in the implementation of different ORC configurations in order to maximize the thermoeconomic indicator of the waste heat recovery cycle based on ORC from the exhaust gases of the 2 MW gas engine. In addition, the three configurations of ORC offer an opportunity to improve the global thermal efficiency of the engine with a payback period of fewer than 5 years, which represents novelty with respect to the literature presented.
2. Methodology
2.1. Description of the System
The analysis presented in this study aims to evaluate the GE Jenbacher engine type 6 (JMS 612 GS-N. L, General Electric, Austria), used for the generation of power, with an operating frequency of 60 Hz, regularly rotating to 1500 rpm. The engine structure is presented in Figure 1. This engine is installed in a plastic production company located in Colombia, this is without a Waste Heat Recovery (WHR) system, with an efficiency of 38.58%, whose value is within an average range of what is offered in Colombia. The engine is regulated by a throttle valve and a turbo bypass valve, provide a mixture of natural gas to the cylinders of the engine, this in order to operate at a minimum load of 1000 kW and a maximum load of 1982 kW, with a rate of air/fuel of 1.79 and 1.97, respectively, generating exhaust gases in each of its 12 cylinders, with a temperature ranging from 580 to 650 °C. These gases are expanded in the turbocharger turbines to obtain waste gases that are sent to the environment.
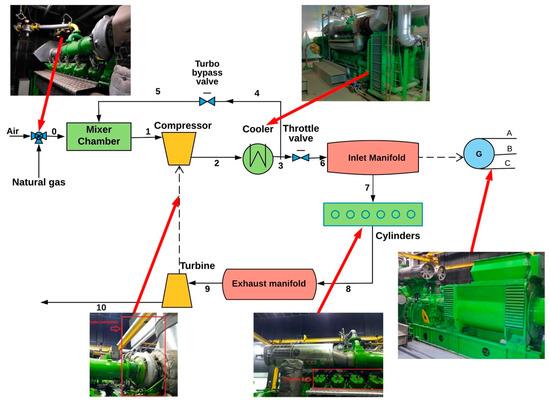
Figure 1.
Internal combustion gas engine scheme.
To take advantage of the thermal advantage available in these exhaust gases, the SORC, RORC, and DORC configurations were implemented to generate additional power, as shown in Figure 2 [5,14,15,16].
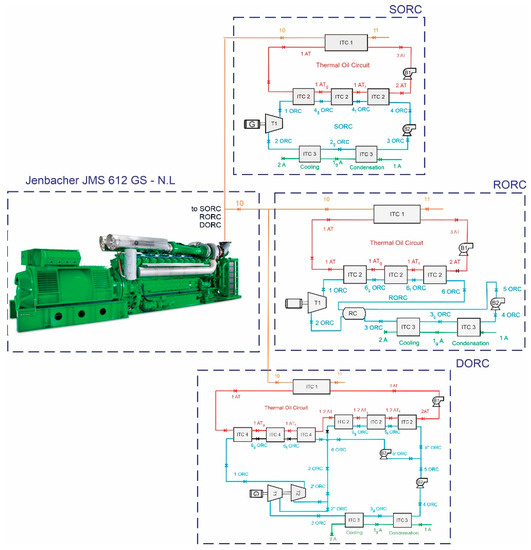
Figure 2.
Graphic representation of the different system configurations for heat recovery in exhaust gases.
The operating conditions and thermoeconomic analysis of the SORC, RORC, and DORC models were determined, as well as taking into account a secondary circuit of thermal oil for a real operating context of the analyzed engine. In the most frequent operating conditions, the inlet is gas flow (120 L/min), λ (1.784), engine revolutions (1842 rpm), gas pressure (1163.6 mbar), the throttle valve is open at 80%, while the turbo bypass valve is open at 9.1%, the gas is at a temperature of 389 °C, and the coolant temperature is 63.9 °C. The outputs for this engine are 1758 kW with an effective efficiency of 38.59%, the heat recovery efficiency of 40.78%, the heat removed from the exhaust gas is 514.85 kW, and the specific fuel consumption is 177.65 g/kWh [15].
2.2. Thermoeconomic Analysis
An energetic and exegetical analysis of the SORC, RORC, and DORC models was carried out as a waste heat recovery system [15]. Toluene was used as a working fluid, taking into account the good cost-benefit ratio that this offers for the system integrated with the engine gases. The parameters considered for the study of the system were isentropic efficiencies for the turbines of 80%, isentropic efficiencies for the pumps equal to 75% [17], the temperature of the cooling water in line 1A is 50 °C, pinch point of the condenser 15 °C, pinch point evaporator ITC2 and ITC4 (35 °C), and efficiency in the recuperator of 85% [17]. In the base case, the pressure ratio in B1 and B2 are 2.5 and 30, respectively, for the SORC and RORC models, while in the DORC pressure ratios of 11.09, 20, 20, for B1, B2, and B3 were used in that order.
All the equipment of the system was analyzed under the assumption that they were in a stable state, according to the law of conservation of mass, therefore, for the modeling of the WHR system, a mass balance presented in Equation (1) and an energy balance presented in Equation (2) were stated.
where m represents the mass flow, h represents the enthalpy of the working fluid, Q is the energy transferred by heat, and W is the power generated measured over time.
The specific physical exergy for all currents was calculated using Equation (3), for this case the changes of kinetic energy and potential were considered to have a negligible effect, so they were not considered within the analysis, while the chemical exergy presented in Equation (4), was only evaluated in the exhaust gas line.
where h0 and s0 were evaluated under reference conditions.
where R represents the universal count of gases, Xi represents the molar fraction of the gas. From the calculated exergy for all thermodynamic states, the exergy balance is shown in Equation (5) for each equipment of the WHR system was carried out.
where is the exergy of the flow at the input, is the exergy of the current at the output, is the exegetical destruction presented in each component.
As part of the analysis process, the economic impact was also taken into account. Therefore a total cost of production (TPC) analysis of the WHR system of the engine that generates exhaust gases through the different ORC configurations was performed. This analysis consists of estimating the total capital to be invested (TCI), as well as the operation and maintenance costs (O&M), as shown in Equation (6).
where the TCI of the heat recovery system is calculated using Equation (7) [18].
FCI represents the fixed investment costs of the thermal system, which quantifies the direct costs (DC) and associated indirect costs (IC), as shown in Equation (8).
The other costs are calculated by taking into account the start-up costs (SUC) represented by the start of the equipment, the initial capital of the thermal system (WC), the costs associated with the research and development of activities (LRD), in addition to the costs associated with the provision of funds during construction (AFUDC); all of this is shown in Equation (9).
The CD is the costs corresponding to the acquisition of equipment, piping accessories, equivalent to 31% of the TCI, installation, and assembly (which is equivalent to 20%), instrumentation and control (which is equivalent to 10%), and the electrical components and materials correspond to 11%, also taking into account the costs for civil adequacy which are estimated to be equivalent to 45%, finally the area work which consists of 10% for the heat exchanger, the pump, and the turbine. These data were related according to the power output of the turbine, the power of the pump, and the heat exchange area, taking into consideration the data supplied by the manufacturers and calculating the costs in dollars [19,20,21]. All this can be seen in Equation (10) for the turbine [19,21], Equation (11) for heat exchangers [20,21], and Equation (12) for the pump [19,21].
2.3. Thermoeconomic Indicator
Three parameters of the project’s economic performance were considered. The LCOE is the cost of generating electricity for the systems and determines the minimum selling cost of kWh to support the necessary investment, operation, and maintenance costs. This cost is calculated using Equation (13).
On the other hand, the SIC, a relationship commonly used as an objective function in thermoeconomic optimizations with ORC systems, is a cost-effectiveness indicator estimated with Equation (14), and it is defined as the relationship between the investment cost and the net power generated.
Another indicator the PBP, which is a criterion for evaluating profitability, refers to the time required for the amount invested in an asset that must be repaid by the net cash inflow and is calculated with Equation (15). All the economic constants used in the economic model are presented in Table 1 as follows.

Table 1.
Economic data considered in the exergo-economic model.
2.4. Particle Swarm Optimization (PSO)
Particle swarm optimization (PSO) is an evolutionary algorithm developed [27] based on artificial life and social psychology, as well as engineering and computer science. The particle swarm algorithm is an evolutionary calculation method for solving global optimizations, inspired by bird social behavior and fish growth, which describes each possible solution as a particle of the total population. That is, an individual particle has its own velocity and position vectors, as well as an individual aptitude value determined by the target function [28]. The flow chart of the PSO algorithm is presented in Figure 3.
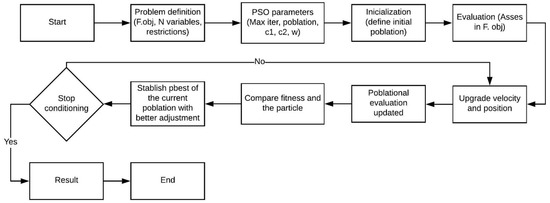
Figure 3.
Flow chart of the particle swarm optimization (PSO) algorithm.
The concept of particle swarm optimization is that each step changes the speed (i.e., accelerates) of each particle to its pBest (best location) and gBest (best global location) locations. Acceleration is weighted by a random term with separate random numbers generated for acceleration to pBest and gBest locations. Particle updates are performed according to Equations (16) and (17) [27].
where,
Equation (16) calculates a new velocity for each particle (potential solution) based on its previous velocity, the best location pbest has achieved so far, and the best global gBest location the population has achieved. Equation (17) updates the location of each particle (Xi) in the search region. The two random numbers r1, r2 in Equation (4) are generated independently in the range [0, 1].
Additionally, c1 and c2 are the acceleration constants in Equation (14) and characterize the weighting of the stochastic acceleration relations that ensure that each particle is directed towards the pbest and gBest positions. The cognitive parameter (c1) signifies the confidence that the particle has in itself, and the social parameter (c2) is the confidence that the particle has in the swarm. Therefore, the adjustment of these constants changes the dispersion and integration of particles in the system [28]. Low constant values allow particles to move away from target regions before they are removed, while high values result in abrupt movement beyond target regions [29].
The inertia weight w affects the convergence of PSO as it is used to control the exploration skills of the swarm, and can be calculated according to Equation (18). Large inertia weights allow wide speed upgrades that allow global exploration of design space, while small inertia weights concentrate speed upgrades in regions close to the design space [30]. In the present work, this version of the PSO algorithm is modified considering the following variable pondering [30].
In this case, the PSO algorithm had some reference parameters, which represent the optimization considerations of the case studies. Table 2 shows these parameters and the ranges used during the execution of the algorithm. In addition, the population values of the variables selected to calculate the target functions are shown.
Table 2.
Considerations in PSO algorithm.
The thermoeconomic optimization presented for each configuration was carried out considering parametric restrictions that define the functions to be optimized. The limit values were selected according to the operating conditions of the 2 MW Jenbacher natural gas engine. Additionally, the efficiency values were defined according to the thermodynamic restrictions of the working fluids in both the thermal circuit and the ORC to obtain a stable and safe operation.
Table 3 shows the ranges of variables used in SORC, RORC, and DORC optimization. These values were selected to guarantee the appropriate performance of the process, besides minimizing the destroyed exergy.
Table 3.
Ranges of decision variables in cycle configurations.
3. Results and Discussion
3.1. Parametric Study on Thermoeconomic Indicator
The results of the thermoeconomic indicators for the configurations studied are shown in Figure 4, Figure 5 and Figure 6. Although the DORC configuration uses two evaporating pressures to bring the temperature of the organic fluid closer to the thermal source and thus destroy less exergy, the best results are presented for the simple and recovery configuration. In detail, the LCOE and PBP of the RORC present a minimum of 0.1238 USD/kWh and 4.28 years at evaporation pressure of 3 MPa. However, these values increase with evaporation pressures greater than 3 MPa, since the turbine pressure ratio increases the cost of acquiring this equipment, as shown in Figure 4a–c.
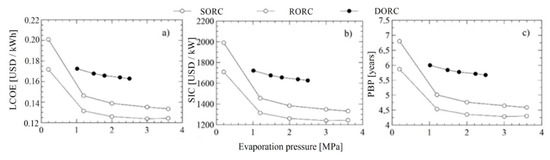
Figure 4.
Effect of evaporation pressure on thermoeconomic indicators, (a) leveled cost of energy (LCOE), (b) specific investment cost (SIC), and (c) payback period (PBP).
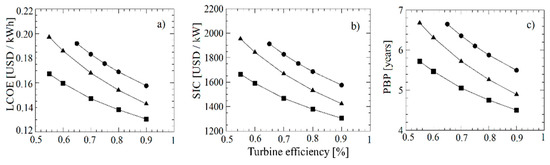
Figure 5.
Effect of turbine efficiency on thermoeconomic indicators, (a) LCOE, (b) SIC, and (c) PBP.
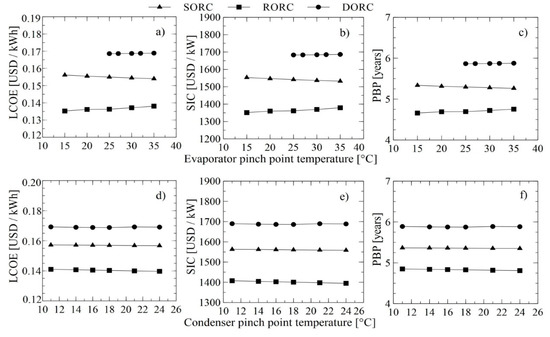
Figure 6.
Effect of evaporator and condenser pinch point temperature on thermoeconomic indicators; (a,d) LCOE, (b,e) SIC, and (c,f) PBP.
The least profitable cycle for all conditions evaluated is the DORC, as they present specific investment cost values between 1600 and 2000 USD/kWh, with the amortization period between 5 and 7 years, and the largest LCOE of 0.1919 USD/kW.
There is a 17.62% decrease in the ratio of total capital to be invested in the output power for the DORC, depending on the efficiency of the expander. However, these values do not exceed the values of the LCOE and the amortization period of the simple cycles and with recovery for the case of Toluene.
The LCOE and the SIC of the system have a smaller variation for the increase of the minimum temperature difference both in the evaporator from 15 to 35 °C, and in the condenser from 11 to 24 °C. The LCOE and the SIC of the system have a smaller variation with respect to the increase of the minimum temperature difference both in the evaporator from 15 to 35 °C, and in the condenser from 11 to 24 °C. However, the minimum values obtained for the configurations with recuperator (1351.19 and 1395.11 USD/kW), followed by the simple configuration (1532.17 and 1558.48 USD/kW) and finally the least attractive solution which is the double pressure (1683.19 and 1688.42 USD/kW). The SIC values are consistent with those obtained in engine waste heat recovery systems using ORC [31], where the ICS varies between 2700 and 5500 USD/kW for the different organic fluids, given that the systems proposed in the present research generate around 120 to 170 kW, while those reported by Quoilin et al. [31], only generate in their optimal condition 4.2 kW for n-butane in a geothermal application. The results are also consistent with the results presented in the thermoeconomic optimization proposed by Lecompte et al. [32] in the cogeneration process.
The behavior of economic indicators changing the turbine efficiency is reported in Figure 5a–c. This variation is a consequence of the fact that the cost of the equipment is higher for the turbine, where it represents more than 30% of the total capital to be invested, a percentage consistent with that calculated in other investigations [33,34], where the turbine costs 40.4% of the total cost in a geothermal power generation application. The efficiency of the turbine plays an important role in the percentage contribution to the total costs, reaching 78.6% and 72.5% of the total investment of the ORCs using acetone and cyclopentane for the use of waste heat using an axial turbine [35].
Figure 6a–c shows the influence of the evaporator pinch point temperature on the thermoeconomic indicator, where the higher the oil inlet temperature and the lower evaporator pinch, the greater both the total loss of process energy and the cost of destroyed evaporator exergy. The Pinch effect of the evaporator on the total loss of energy in various components such as the turbine, pump, and recuperator is very small since these are located prior to the evaporator. The effect of the condenser Pinch Point temperature on the thermoeconomic indicator is presented in Figure 6d–f, where this parameter has more effect on the evaporator in the simple configuration and condensers in the configurations with recuperator and double pressure, given the increase in the irreversibilities for heat transfer. The operating conditions of the recovery system will be discussed in more detail in the next optimization section, where it is proposed to minimize these indicators.
3.2. Optimization Method Selection
To select the optimization method, the convergence time obtained by optimizing each objective function in the thermoeconomic optimization problem was compared. The algorithms studied were the Repulsive Particle Swarm (RPS) [36], the Particle Swarm Optimization (PSO) [37], and the FMINCON function available as a complement in the MATLAB ® software (R2018b, MathWorks, Massachusetts, USA) [38]. The PSO algorithm presented the shortest computation times as shown in Table 4, with an average computational time of 14.2 min for the SORC considering all the objective functions and evaluated, which is 58.3% less than the solution with RPS, and 110.5% less than the solution obtained with the FMINCON function. This result with the PSO method was obtained using a particle number of 40, and a generation number of 30. This method emulates the behavior of flocks of birds and generates a population of candidate solutions, denoted as “particles,” and is based on the position and speed of these to look for the best global among the best local. On the other hand, the RPS algorithm, which is a variant of the PSO, also present good results but it requires more computational resources. This method does not have the tendency of best performance. However, it presents the repulsion and the best position of another randomly chosen particle, which makes it more robust than the PSO but with drawbacks in the recovery of the non-existence of solution. Finally, the longest time was presented for the FMINCON function, which is an optimization function belonging to the MathWorks mathematical software library, which satisfies limits in all iterations and is based on the Hessian of the objective function supported by the structure of the Lagrange multiplier.
Table 4.
Average computational time for different optimization methods.
3.3. Thermoeconomic Optimization
The three provisions were studied, and the four objective functions were considered. In addition, the study of the effect of population size and the maximum number of iterations on the convergence of the PSO algorithm for the thermoeconomic optimization of the different configurations is presented.
The results obtained from the thermoeconomic optimization of the three proposed configurations for the use of waste heat from the 2 MW natural gas generation engine are presented below. These results seek to contribute to the economic viability of applying these configurations to real industrial operation environments, due to the fact that improvement is obtained in the overall thermal efficiency of the generation engines that operate with natural gas, widely used for generation purposes in the industrial sector [39]. This improvement in efficiency also implies an improvement in economic indicators that allows investors to provide better payback periods, leveled energy costs, and greater recovered power.
For this purpose, a description of the implemented PSO algorithm with its considerations is presented initially. Next, the decision variables are presented with the restrictions considered in the multivariable optimization and, in addition, the results for each configuration under study. The four target functions are shown below:
- ,
- ,
- , and the objective energetic function to maximize is
- .
Finally, a comparative analysis is presented of the performance parameters that allow selecting the most profitable solution in the selected operating condition for the engine. For each configuration, the behavior of the performance parameters to obtain the optimal values were analyzed. Thus, the tendency of the parameters during the iteration of the PSO optimization was studied. From the results, the parameters with the greater influence in the final objective of the case studies are identified to manipulate the values that provide higher system performance.
3.3.1. SORC Optimization
The initial positions of the individual particles were randomly generated in the search space; however, the variation in population size allowed to guarantee the quality of the solution. Figure 7 shows that the best solutions for the four target functions were obtained for a particle number of 40 and a generation number of 30. Thus, for the SORC using toluene as an organic fluid, a maximum number of iterations or 30 generations with a population size of 10, 20, 30, and 40 was considered.
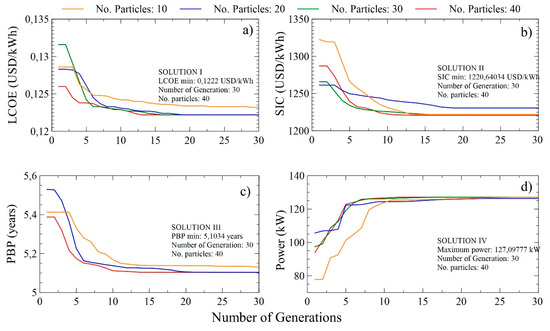
Figure 7.
Variation of the target function with the number of generations and particles for the simple organic Rankine cycle (SORC) system; (a) minimization of LCOE, (b) SIC, (c) PBP, and (d) power maximization.
The distributions of the parameters used for the optimization of the four target functions is presented, LCOE (Figure 7a–c), SIC (Figure 7d–f), PBP (Figure 7g–i), and power (Figure 7j–l) with a population of 10, which allows visualization of the evolutionary trend of the decision variables.
Figure 8 presents the distribution of the decision variables with the number of generations and a population of 10 for the optimized variables. The results of minimizing LCOE are shown in Figure 8a, where it reaches a minimum value of 0.1222 $USD/kWh, when the pump and turbine have an efficiency of 85% and 90%, respectively. Additionally, the pinch temperature of both the evaporator and the condenser should be 31.36 and 15 °C, respectively. During the minimization of the LCOE in the SORC, the turbine efficiency values increase linearly as the iterations pass to 10 and then remain stable, as reported in Figure 8a. For this case study, the pump efficiency values decrease and increase during evolution, indicating compensation in the optimization iterations. These results are associated with the greater relevance of the turbine efficiency over the thermoeconomic indicators, in comparison with the pump efficiency.
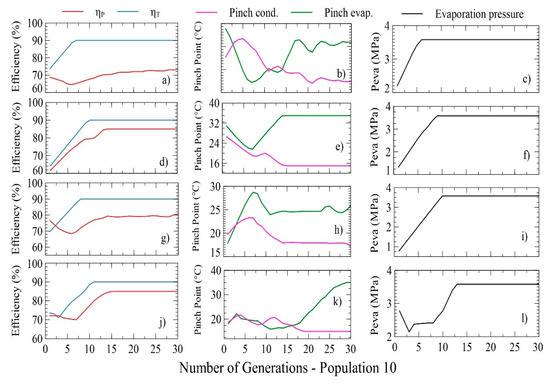
Figure 8.
Distribution of decision variables with the number of generations and a population of 10 for the minimization of LCOE (a–c); SIC (d–f); PBP (g–i) and power maximization (j–l) in the SORC.
The pinch point temperature of the condenser presents an oscillatory behavior until iteration 10, from which it decreases with a minimum amplitude as the optimization progresses, as shown in Figure 8b. Likewise, the evaporator pinch point temperature decreases from a value of 27.11 to 21.7 °C and then varies polynomially, to end with a value of 24.7 °C, while the evaporator pressure changes only in the first five iterations. These results show that the best LCOE values are obtained at the highest evaporating pressures, and there are different pinch temperature combinations of both the condenser and the evaporator, which satisfy the objective.
The results for the SORC are reported in Table 5, for the different objective functions studied where the optimum values of the parameters and the thermoeconomic indicators of the system are obtained. Based on the solutions obtained, a variation of the economic indicators less than or equal to 1% is indicated to achieve the maximization of power in the SORC in solution IV, which indicates that the costs per energy generated do not represent a problem to increase the power of the system, in addition, the thermal efficiency of the cycle increases only 2.8% in the process to maximize the power, which corresponds to only 0.1% greater than those obtained with other solutions.
Table 5.
Thermoeconomic optimization solution in the SORC.
3.3.2. Optimization RORC
Variations of the four target functions with the number of generations and under different particle numbers (10, 20, 30, 40) are shown in Figure 9, where the most cost-effective solution for each target is determined. Solutions I, II, III, IV are obtained with a total of 30 iterations and a different number of populations, which is why it is considered crucial to analyze the effect of this parameter on the performance of the PSO algorithm and, therefore, on the results obtained. In this study, for the RORC system with toluene, the recovery efficiency of 85% according to the operational conditions of the system was considered.
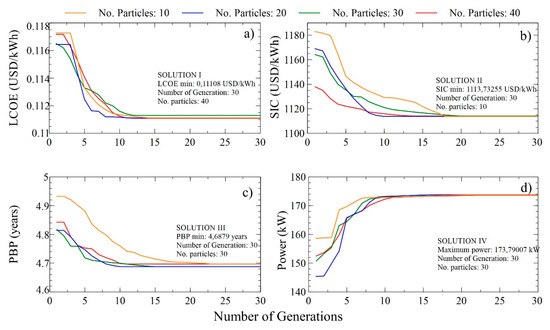
Figure 9.
Variation of the target function with the number of generations and particles for the regeneartive organic Rankine cycle (RORC) system; (a) minimization of LCOE, (b) SIC, (c) PBP, and (d) power maximization.
The results obtained during SIC minimization are shown in Figure 9b, which refers to solution II. In this case, the minimum value of the function is 1113.73 $USD/kWh during the 30 iterations and with a number of particles of 10. This solution contains the optimal ones for the objective variables as well as for the energetic and exergetic indicators of the system, which guarantee the fulfillment of the posed objective. Thus, the minimum SIC value is reached when the pump and turbine efficiencies are 85% and 90%, respectively. While the pinch point temperature of the evaporator and condenser must be 14.52 and 11 °C, respectively.
Figure 10 shows the distributions of the target variables used to optimize the four target functions, LCOE (Figure 10a–c), SIC (Figure 10d–f), PBP (Figure 10g–i), and power (Figure 10j–l) with a population of 10.
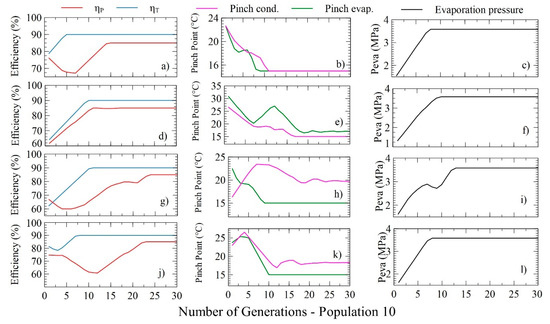
Figure 10.
Distribution of decision variables with the number of generations and a population of 10 for the minimization of LCOE (a–c); SIC (d–f); PBP (g–i) and power maximization (j–l) in the RORC.
The behavior of the pump and turbine efficiencies with increasing iterations is shown in Figure 10d, which shows a similar trend between the two. From iteration 10, both variables are stabilized, which indicates that the efficiencies of the rotating equipment significantly influence the function to be minimized, as shown in Figure 10b, where the SIC decreases from 1182.95 to 1129.2 $USD/kWh in the space of 0 to 10 iterations.
The pinch point temperature of the evaporator decreases linearly, as does the temperature of the condenser. However, it presents a peak in the space of 5 to 15 iterations, which indicates compensation for the possible optimal values. While, the pinch point temperature of the condenser does not show increases with the passage of iterations, as shown in Figure 10e. These results show that the best SIC values are obtained at the highest evaporating pressures which are stable after iteration 10 (Figure 10f), therefore, it is possible to affirm that the influence of the recuperator on the ORC system guarantees an increase in system efficiencies and a decrease in the temperature of the condenser and evaporator pinch.
Table 6 shows the values obtained for the RORC, including the energetic, exergetic, and thermoeconomic parameters of the system. Solutions I and III contain the minimum values of the four target functions and are therefore considered optimal solutions for the minimization of LCOE, SIC, PBP; however, it does not meet the objective of system power which is to maximize its value, as in solution IV where there is an increase of 0.08%. The maximum variation of LCOE (0%), SIC (0.06%), and PBP (0.16%) are very low, so the solutions obtained in the optimization are compatible, and there is no restriction with respect to thermoeconomic indicators. Table 6 shows the thermoeconomic optimization result of the RORC.
Table 6.
Thermoeconomic optimization solution in the RORC.
3.3.3. DORC Optimization
The variations of the target functions for different particles (10, 20, 30, 40) with respect to the number of iterations in the DORC system are shown in Figure 11. In this section, we seek to study the performance parameters in a DORC in order to optimize and choose the solution that provides a degree of improvement in the system. Solutions I, II, III, and IV correspond to the minimization of LCOE, SIC, PBP, and maximization of net power, respectively, and are obtained for 40 particles and 30 iterations.
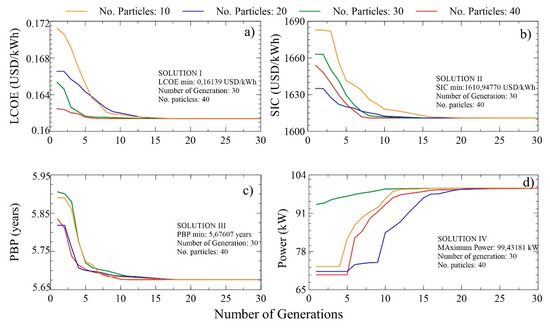
Figure 11.
Variation of the target function with the number of generations and particles for the double-stage ORC (DORC) system; (a) minimization of LCOE, (b) SIC, (c) PBP, and (d) power maximization.
The evolution of the target variables for each optimization case is presented in Figure 12, generated with 10 particles and a search space of 30. The results for maximizing the net power of the DORC system are shown in Figure 12d and correspond to a maximum value of 99.52 kW. In this case, the system must have 85% and 80% pump and turbine efficiencies, respectively. Similarly, the pinch point temperatures of the evaporator and condenser should be 35 and 16 °C.
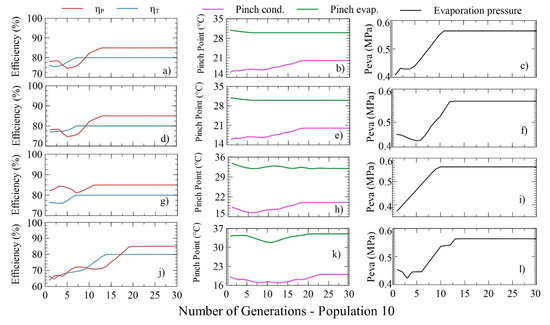
Figure 12.
Distribution of decision variables with the number of generations and a population of 10 for the minimization of LCOE (a–c); SIC (d–f); PBP (g–i) and power maximization (j–l) in the DORC.
The distribution of the target variables proposed to maximize the net power within the iterative space is shown in Figure 12j,l, in which the evolutionary trend of the pump and turbine efficiencies, the pinch point temperatures of both the evaporator and the condenser, and finally the evaporating pressure is visualized.
The variations of the efficiencies in the pump and turbine are polynomial, and their values increase with the increase in the number of generations, as illustrated in Figure 12j. The efficiency of the pump reaches its upper limit (85%) after iteration 20, whereas the efficiency of the turbine reaches its maximum value (80%) from iteration 15 since both variables are determinant for achieving maximum power.
Figure 10k shows that the evaporator pinch temperature presents small variations that tend to the upper limit, and the condenser pinch tends to the lower limit of its values, which indicates an operational restriction of the DORC in terms of heat transfer capacity, characteristic of its phenomenological characteristics. Figure 12l shows that the evaporation pressure increases step by step until iteration 15, after which the values remain stable at their upper limit, which indicates that the maximum power is carried out at higher evaporation pressures.
DORC thermoeconomic optimization values reported in Table 7 show that the LCOE and PBP do not present changes in their values, which indicates that these indicators will always be minimal due to the operational conditions of the system and/or the considerations made for the development of the PSO algorithm. However, the SIC and the power do present variations between their minimum and maximum values of 0.012% and 0.09%, respectively. To achieve this, the pinch point temperature of the evaporator presents an increase of 16.6%, while the other decision variables do not present variation between the solutions obtained, this being the parameter that allowed maximizing the net power.
Table 7.
Optimization solution in the DORC.
4. Conclusions
The results obtained during the minimization of the SIC in the RORC configuration allowed reaching a minimum value of 1113.73 $USD/kWh with 30 iterations and a number of particles of 10 by means of the PSO algorithm, with pump and turbine efficiencies of 85% and 90%, respectively. While, the pinch point temperature of the evaporator and condenser should be 14.52 and 11 °C, respectively. This result allows to have a reference value by integrating this configuration to the engine under study, and to achieve payback periods less than five years, which is a very attractive result for the current market and allows to project favorable scenarios for the implementation of this equipment at an industrial level, specifically in the waste heat recovery from natural gas thermal engines on an industrial scale.
The second configuration with the best performance was the SORC, whereby minimizing the LCOE with a minimum value of 0.1222 $USD/kWh, the pump and turbine have an efficiency of 85% and 90%, respectively. The best LCOE values are obtained at the highest evaporating pressures, and there are different pinch temperature combinations of both the condenser and the evaporator, which satisfy the objective. These indicators make it possible to evaluate both the viability and feasibility of implementing the SORC configurations in the different operating conditions of the engine.
The greatest opportunities for improvement were obtained for the DORC configuration, where the results for maximizing net power allowed the maximum value of 99.52 kW, with 85% and 80% efficiencies in the pump and turbine, respectively, while the pinch point temperatures of the evaporator and condenser must be 35 and 16 °C. Necessary research to increase the performance of the DORC and obtain better indicators is to investigate and evaluate other organic fluids in this configuration, whether pure or mixed, orienting them to increase the amount of heat absorbed in the evaporator and increase the enthalpy change in the turbine, with lower evaporation pressures to obtain better results in the thermoeconomic indicator.
The developed optimizations allowed to obtain favorable thermoeconomic indicators of the residual heat recovery system, that allow projecting its application in the Colombian Caribbean Coast, since under real scenarios of operation of the natural gas engine Jenbacher JMS 612 GS-N. L of 2 MW was obtained for the RORC, an LCOE (0.111 $USD/kWh), SIC (1113.73 $USD/kWh), PBP (4.68 years), and Power (173.79 kW). The primary purpose of the scope of this paper is to promote the rational use of energy in generation systems, through the comparative analysis of different configurations of waste heat recovery, which allow economic and energy savings if they are widely applied in the industry. However, it is not possible to determine if the implementation of this technology is consistent with environment preservation. Therefore, the need arises to conduct environmental impact assessment studies using different tools, such as life cycle analysis, to ensure the sustainability of these solutions.
Author Contributions
Conceptualization: G.V.O.; Methodology: G.V.O. and C.A.P.; Software: G.V.O., C.A.P., and J.D.F.; Validation: G.V.O., C.A.P. and J.D.F.; Formal Analysis: G.V.O., C.A.P. and J.D.F.; Investigation: G.V.O.; Resources: G.V.O. and J.D.F.; Writing—Original Draft Preparation: G.V.O., C.A.P.; Writing—Review and Editing: J.D.F. and C.A.P.; Funding Acquisition: G.V.O.
Funding
This work was supported by the Universidad del Atlántico, Universidad Francisco de Paula Santander, and the E2 Energía Eficiente S.A E.S.P. company.
Conflicts of Interest
The authors declare no conflict of interest.
Abbreviations
The following abbreviations are used in this manuscript:
| DORC | Double pressure Organic Rankine Cycle |
| ORC | Organic Rankine Cycle |
| RORC | Regenrative Organic Rankine Cycle |
| SORC | Simple Organic Rankine Cycle |
| WHR | Waste Heat Recovery |
| Nomenclature | |
| Specific heat at constant pressure [J/kg·K] | |
| Energy [J] | |
| Turbine efficiency [%] | |
| Pump efficiency [%] | |
| Specific exergy [kJ/kg] | |
| Specific enthalpy [kJ/kg] | |
| Mass flow rate [kg/s] | |
| Heat [J] | |
| Universal gas constant [atm·L/mol·K] | |
| Temperature [K] | |
| Time [s] | |
| Power [kW] | |
| Molar gas fraction | |
| Greek Letters | |
| Hours of operation per year | |
| Subscripts | |
| Destroyed | |
| in | Input |
| out | Output |
| G | Gases |
| VC | Control volume |
| o | Reference condition |
References
- Wang, H.; Zhang, H.; Yang, F.; Song, S.; Chang, Y.; Bei, C.; Yang, K. Parametric optimization of regenerative organic rankine cycle system for diesel engine based on particle swarm optimization. Energies 2015, 8, 9751–9776. [Google Scholar] [CrossRef]
- Javanshir, A.; Sarunac, N. Thermodynamic analysis of a simple Organic Rankine Cycle. Energy 2017, 118, 85–96. [Google Scholar] [CrossRef]
- Landelle, A.; Tauveron, N.; Haberschill, P.; Revellin, R.; Colasson, S. Organic Rankine cycle design and performance comparison based on experimental database. Appl. Energy 2017, 204, 1172–1187. [Google Scholar] [CrossRef]
- Huang, H.; Zhu, J.; Yan, B. Comparison of the performance of two different Dual-loop organic Rankine cycles (DORC) with nanofluid for engine waste heat recovery. Energy Convers. Manag. 2016, 126, 99–109. [Google Scholar] [CrossRef]
- Shi, L.; Shu, G.; Tian, L.; Deng, S. A review of modified Organic Rankine cycles (ORCs) for internal combustion engine waste heat recovery (ICE-WHR). Renew. Sustain. Energy Rev. 2018, 92, 95–110. [Google Scholar] [CrossRef]
- Lion, S.; Taccani, R.; Vlaskos, I.; Scrocco, P.; Vouvakos, X.; Kaiktsis, L. Thermodynamic analysis of waste heat recovery using Organic Rankine Cycle (ORC) for a two-stroke low speed marine Diesel engine in IMO Tier II and Tier III operation. Energy 2019, 183, 48–60. [Google Scholar] [CrossRef]
- Liu, P.; Shu, G.; Tian, H. How to approach optimal practical Organic Rankine cycle (OP-ORC) by configuration modification for diesel engine waste heat recovery. Energy 2019, 174, 543–552. [Google Scholar] [CrossRef]
- Braimakis, K.; Karellas, S. Energetic optimization of regenerative Organic Rankine Cycle (ORC) configurations. Energy Convers. Manag. 2018, 159, 353–370. [Google Scholar] [CrossRef]
- Braimakis, K.; Karellas, S. Integrated thermoeconomic optimization of standard and regenerative ORC for different heat source types and capacities. Energy 2017, 121, 570–598. [Google Scholar] [CrossRef]
- Javanshir, A.; Sarunac, N.; Razzaghpanah, Z. Thermodynamic analysis of a regenerative organic Rankine cycle using dry fluids. Appl. Therm. Eng. 2017, 123, 852–864. [Google Scholar] [CrossRef]
- Braimakis, K.; Karellas, S. Exergetic optimization of double stage Organic Rankine Cycle (ORC). Energy 2018, 149, 296–313. [Google Scholar] [CrossRef]
- Yang, F.; Cho, H.; Zhang, H.; Zhang, J. Thermoeconomic multi-objective optimization of a dual loop organic Rankine cycle (ORC) for CNG engine waste heat recovery. Appl. Energy 2017, 205, 1100–1118. [Google Scholar] [CrossRef]
- Huang, H.; Zhu, J.; Deng, W.; Ouyang, T.; Yan, B.; Yang, X. Influence of exhaust heat distribution on the performance of dual-loop organic Rankine Cycles (DORC) for engine waste heat recovery. Energy 2018, 151, 54–65. [Google Scholar] [CrossRef]
- Fontalvo, A.; Solano, J.; Pedraza, C.; Bula, A.; Quiroga, A.G.; Padilla, R.V. Energy, exergy and economic evaluation comparison of small-scale single and dual pressure organic Rankine cycles integrated with low-grade heat sources. Entropy 2017, 19, 476. [Google Scholar] [CrossRef]
- Valencia, G.; Fontalvo, A.; Cárdenas, Y.; Duarte, J.; Isaza, C. Energy and Exergy Analysis of Different Exhaust Waste Heat Recovery Systems for Natural Gas Engine Based on ORC. Energies 2019, 12, 2378. [Google Scholar] [CrossRef]
- Valencia, G.; Núñez, J.; Duarte, J. Multiobjective Optimization of a Plate Heat Exchanger in a Waste Heat Recovery Organic Rankine Cycle System for Natural Gas Engines. Entropy 2019, 21, 655. [Google Scholar] [CrossRef]
- Val, C.G.F.; Oliveira, S., Jr. Deep Water Cooled ORC for Offshore Floating Oil Platform Applications. Int. J. Thermodyn. 2017, 20, 229–237. [Google Scholar] [CrossRef]
- Bejan, A.; Tsatsaronis, G.; Moran, M.J. Thermal Design and Optimization, 1st ed.; John Wiley & Sons, Inc.: Hoboken, NJ, USA, 1996. [Google Scholar]
- El-emam, R.S.; Dincer, I. Exergy and exergoeconomic analyses and optimization of geothermal organic Rankine cycle. Appl. Therm. Eng. 2013, 59, 435–444. [Google Scholar] [CrossRef]
- Calise, F.; Capuozzo, C.; Carotenuto, A.; Vanoli, L. Thermoeconomic analysis and off-design performance of an organic Rankine cycle powered by medium-temperature heat sources. Sol. Energy 2014, 103, 595–609. [Google Scholar] [CrossRef]
- Zare, V. A comparative exergoeconomic analysis of different ORC configurations for binary geothermal power plants. Energy Convers. Manag. 2015, 105, 127–138. [Google Scholar] [CrossRef]
- Zhang, X.; Cao, M.; Yang, X.; Guo, H.; Wang, J. Economic Analysis of Organic Rankine Cycle Using R123 and R245fa as Working Fluids and a Demonstration Project Report. Appl. Sci. 2019, 9, 288. [Google Scholar] [CrossRef]
- Han, Z. Thermo-Economic Performance Analysis of a Regenerative Superheating Organic Rankine Cycle. Energies 2017, 10, 1593. [Google Scholar] [CrossRef]
- Baral, S.; Kim, D.; Yun, E.; Kim, K.C. Experimental and Thermoeconomic Analysis of Small-Scale Solar Organic Rankine Cycle (SORC) System. Entropy 2015, 17, 2039–2061. [Google Scholar] [CrossRef]
- Preißinger, M.; Brüggemann, D. Thermoeconomic Evaluation of Modular Organic Rankine Cycles for Waste Heat Recovery over a Broad Range of Heat Source Temperatures and Capacities. Energies 2017, 10, 269. [Google Scholar] [CrossRef]
- Tchanche, B. Low Grade Heat Conversion into Power Using Small Scale Organic Rankine Cycles. Ph.D. Thesis, Agricultural University of Athens, Athens, Greece, 2010. [Google Scholar]
- Pili, R.; Romagnoli, A.; Spliethoff, H.; Wieland, C. Techno-economic analysis of waste heat recovery with ORC from fluctuating industrial sources. Energy Procedia 2017, 129, 503–510. [Google Scholar] [CrossRef]
- Feng, Y.; Zhang, Y.; Li, B.; Yang, J.; Shi, Y. Comparison between regenerative organic Rankine cycle (RORC) and basic organic Rankine cycle (BORC) based on thermoeconomic multi-objective optimization considering exergy efficiency and levelized energy cost (LEC). Energy Convers. Manag. 2015, 96, 58–71. [Google Scholar] [CrossRef]
- Dong, Y.; Tang, J.; Xu, B.; Wang, D. An application of swarm optimization to nonlinear programming. Comput. Math. Appl. 2005, 49, 1655–1668. [Google Scholar] [CrossRef]
- Rao, R.V.; Patel, V.K. Thermodynamic optimization of cross flow plate-fin heat exchanger using a particle swarm optimization algorithm. Int. J. Therm. Sci. 2010, 49, 1712–1721. [Google Scholar] [CrossRef]
- Quoilin, S.; Declaye, S.; Tchanche, B.F.; Lemort, V. Thermo-economic optimization of waste heat recovery Organic Rankine Cycles. Appl. Therm. Eng. 2011, 31, 2885–2893. [Google Scholar] [CrossRef]
- Lecompte, S.; Huisseune, H.; Van den Broek, M.; De Schampheleire, S.; De Paepe, M. Part load based thermo-economic optimization of the Organic Rankine Cycle (ORC) applied to a combined heat and power (CHP) system. Appl. Energy 2013, 111, 871–881. [Google Scholar] [CrossRef]
- Cavallaro, F.; Zavadskas, E.K.; Streimikiene, D. Concentrated solar power (CSP) hybridized systems. Ranking based on an intuitionistic fuzzy multi-criteria algorithm. J. Clean. Prod. 2018, 179, 407–416. [Google Scholar] [CrossRef]
- Toffolo, A.; Lazzaretto, A.; Manente, G.; Paci, M. A multi-criteria approach for the optimal selection of working fluid and design parameters in Organic Rankine Cycle systems. Appl. Energy 2014, 121, 219–232. [Google Scholar] [CrossRef]
- Pierobon, L.; Nguyen, T.-V.; Larsen, U.; Haglind, F.; Elmegaard, B. Multi-objective optimization of organic Rankine cycles for waste heat recovery: Application in an offshore platform. Energy 2013, 58, 538–549. [Google Scholar] [CrossRef]
- Rahman, I.; Das, A.; Mankar, R.; Kulkarni, B. Evaluation of repulsive particle swarm method for phase equilibrium and phase stability problems. Fluid Phase Equilib. 2009, 282, 65–67. [Google Scholar] [CrossRef]
- Gill, M.; Kaheil, Y.; Khalil, A.; McKee, M.; Bastidas, L. Multiobjective Particle Swarm Optimization for Parameter Estimation in Hydrology. Water Resour. Res. 2006, 42. [Google Scholar] [CrossRef]
- Mathwork, “FMINCON Algorithms,” 2012. Available online: https://www.mathworks.com/help/optim/ug/choosing-the-algorithm.html (accessed on 2 April 2019).
- Valencia, G.; Duarte, J.; Isaza-Roldan, C. Thermoeconomic Analysis of Different Exhaust Waste-Heat Recovery Systems for Natural Gas Engine Based on ORC. Appl. Sci. 2019, 9, 4017. [Google Scholar] [CrossRef]


© 2019 by the authors. Licensee MDPI, Basel, Switzerland. This article is an open access article distributed under the terms and conditions of the Creative Commons Attribution (CC BY) license (http://creativecommons.org/licenses/by/4.0/).