Article

Water Adsorption Effect on Carbon Molecular Sieve Membranes in H2-CH4 Mixture at High Pressure

by
Maria L. V. Nordio
1,
José A. Medrano
1,
Martin van Sint Annaland
1,
David Alfredo Pacheco Tanaka
2,
Margot Llosa Tanco
2 and
Fausto Gallucci
1,*
1
Inorganic Membranes and Membrane Reactors, Sustainable Process Engineering, Department of Chemical Engineering and Chemistry, Eindhoven University of Technology, De Rondom 70, 5612 AP Eindhoven, The Netherlands
2
Energy and Environment, TECNALIA Basque Research and Technology Alliance (BRTA), Mikeletegi Pasealekua 2, 20009 San Sebastian-Donostia, Spain
*
Author to whom correspondence should be addressed.
Energies 2020, 13(14), 3577; https://doi.org/10.3390/en13143577
Submission received: 14 June 2020 / Revised: 30 June 2020 / Accepted: 6 July 2020 / Published: 11 July 2020
(This article belongs to the Special Issue Advances in Hydrogen Production and Hydrogen Separation)

Abstract

:
Carbon molecular sieve membranes (CMSMs) are emerging as promising solution to overcome the drawbacks of Pd-based membranes for H2 separation since (i) they are relatively easy to manufacture; (ii) they have low production and raw material costs; (iii) and they can work at conditions where polymeric and palladium membranes are not stable. In this work CMSMs have been investigated in pure gas and gas mixture tests for a proper understanding of the permeation mechanism, selectivity and purity towards hydrogen. No mass transfer limitations have been observed with these membranes, which represents an important advantage compared to Pd-Ag membranes, which suffer from concentration polarization especially at high pressure and low hydrogen concentrations. H2, CH4, CO2 and N2 permeation at high pressures and different temperatures in presence of dry and humidified stream (from ambient and water vapour) have been carried out to investigate the effect of the presence of water in the feed stream. Diffusion is the main mechanism observed for hydrogen, while methane, nitrogen and especially carbon dioxide permeate through adsorption-diffusion at low temperatures and high pressures. Finally, H2 permeation from H2-CH4 mixtures in presence of water has been compared at different temperatures and pressure, which demonstrates that water adsorption is an essential parameter to improve the performance of carbon molecular sieve membranes, especially when working at high temperature. Indeed, a hydrogen purity of 98.95% from 10% H2—90% CH4 was achieved. The main aim of this work is to understand the permeation mechanisms of CMSMs in different operating conditions and find the best conditions to optimize the separation of hydrogen.

1. Introduction

Although Pd-based membranes are particularly effective for hydrogen purification (thanks to their high permeance and selectivity), the high cost of these membranes has greatly limited their larger scale applications [1,2,3]. On the other hand, carbon molecular sieve membranes have been proven to be very effective for various applications to replace other traditional processes for the purpose of cost and energy saving. Carbon membranes are porous inorganic membranes prepared by thermal decomposition of polymeric precursors under inert conditions. For gas separation purposes, they were produced for the first time by Koresh and Soffer in the 1970s [4]. The sieving mechanism exhibited by these membranes on gas separation makes them also known as “carbon molecular sieve membranes” (CMSM) [5,6]. Since carbon layers by themselves are fragile, they are generally supported on a ceramic or metallic porous support [7], which provides increased mechanical resistance and thermal stability without decreasing the hydrogen permeance [8].
The properties that place the carbon membranes among the most promising membrane materials are their high temperature resistance and excellent chemical resistance to acids, hot organic solvents and alkaline baths. They are also rather easy to produce as fibres or flat sheets since much is known about how the pyrolysis conditions effect separation properties [9,10,11,12]. Thus, a carbon membrane can be tailored with a pore size giving excellent separation properties for a given gas mixture (high flux for permeating component and high selectivity for gas pairs). The membranes can be prepared as bundles of fibres and thus, modules may have a high packing density (m2/m3) for commercial applications.
Previous studies have shown that some degree of membrane performance is lost upon exposure to water vapour [13]. The vulnerability of CMSM to humidity is a complex phenomenon, considering the weak character of the water–carbon dispersion forces and the tendency of water molecules to form hydro gen bonds within the bulk phase. Water will initially adsorb onto hydrophilic sites, existing in the form of functional surface groups associated to non-carbon species. These sites are much more reactive than the atoms in the interior of the graphene sheets and chemisorb foreign elements. Once the first water molecule is adsorbed, adsorbate–adsorbate interactions will promote the adsorption of further molecules through hydrogen bonds [14]. As described by Llosa et al. [15], during the carbonization process the polymer precursor decomposes and gases are released leaving pores and high reactive carbons. When fresh membranes are exposed to air, water reacts with reactive places of the membrane (water chemisorption). As consequence, carbon containing oxygen groups are formed in the pores; these oxygen groups are hydrophilic producing the physical adsorption of water. Both phenomena reduce the effective size of the micropores. [15,16]. To better understand the permeation mechanism of gases in presence of humid stream is important for describing CMSM performance.
When describing the permeation of gases through these membranes, it is important to highlight that transport through CMSMs takes place according to a combination of three mechanisms [4,17,18]:
  • Knudsen diffusion occurs at high temperatures, where adsorption effects are attenuated and the permeance of pure gases through carbon membranes follows the molecular weight and temperature dependency expected for Knudsen diffusion, even though the pore size distribution lies demonstrably below 0.55 nm [18].
  • Selective surface diffusion is governed by selective adsorption of the larger non-ideal components on the pore surface, followed by surface diffusion of the adsorbed molecules along the pore. In this case, the driving force for the separation is governed by the different affinity of the diffusing components on the pores. This means that a large driving force can be attained even with a small partial pressure difference for the permeating component.
  • Molecular sieving is a separation based on molecular size caused by the passage of smaller molecules of a gas mixture through the pores while the larger molecules are retained. The pore size is usually within the range between 3–5 Å and molecular sieving is the preferred and dominating transport mechanism of these membranes. Therefore, they are commonly referred as CMSMs.
In other studies, it has been observed that, as the amount of adsorbed water in hydrophilic CMSMs increases, the capacity for other species is diminished, especially in the case of nitrogen and oxygen [16]. Based on the observed H2O sorption behaviour in microporous carbon adsorbents, adverse effects from humidity exposure on the performance of ultra-microporous membranes would be expected. In this manuscript, an approach is proposed to improve the performance of hydrogen separation via the exposition of carbon molecular sieve membranes to water.
This manuscript aims at giving more insight into the behaviour of CMSM for hydrogen recovery from natural gas grid lines and, in particular, to reveal the influence of ambient humidity on the dominant transport mechanism through these membranes, giving special attention to its influence on the selectivity and purity of the permeated H2. To do so, a wide range of operating conditions including high pressure operation and different gas mixtures and temperatures will be evaluated for membranes carbonized at different temperatures. In the next section, the membranes prepared for this work will be described, together with the experimental facilities and tests carried out. Afterwards, the results as a function of the different variables investigated in this work will be provided, discussed and supported with results obtained through different characterization techniques. Finally, the main outcomes will be summarized and recommendations for further research are given.

2. Experimental

2.1. Membrane Preparation

Two Al-CMSMs were prepared on alpha-alumina supports having 10 mm of diameter and 200 nm pore size by the method of one dip-dry-carbonization step reported before [15,19].
The composition of the dipping solution was as follows—novolac resin (13 wt%), formaldehyde (2.4 wt%), ethylenediamine (0.4 wt%), boehmite (as precursor of alumina 0.8 wt%) in N-methyl-2-pyrrolidone (NMP). The α-alumina tube was coated with this solution by dip-coating using a vacuum pump. The remaining precursor solution was placed in a Teflon dish to make unsupported composite films used for membrane characterization. Both supported and unsupported membranes were dried in an oven at 100 °C overnight. The tubular supported membranes were dried under continuous rotation inside an oven to guaranty thickness uniformity. The CMSMs were carbonized at 550 °C and 600 °C for two hours under a continuous flow of nitrogen, henceforth named as CMSM-550 and CMSM-600, respectively (see Figure 1). These membranes are 14.1 and 13.7 cm long and around 3 µm in thickness.

2.2. Permeation Setup and Experimental Tests

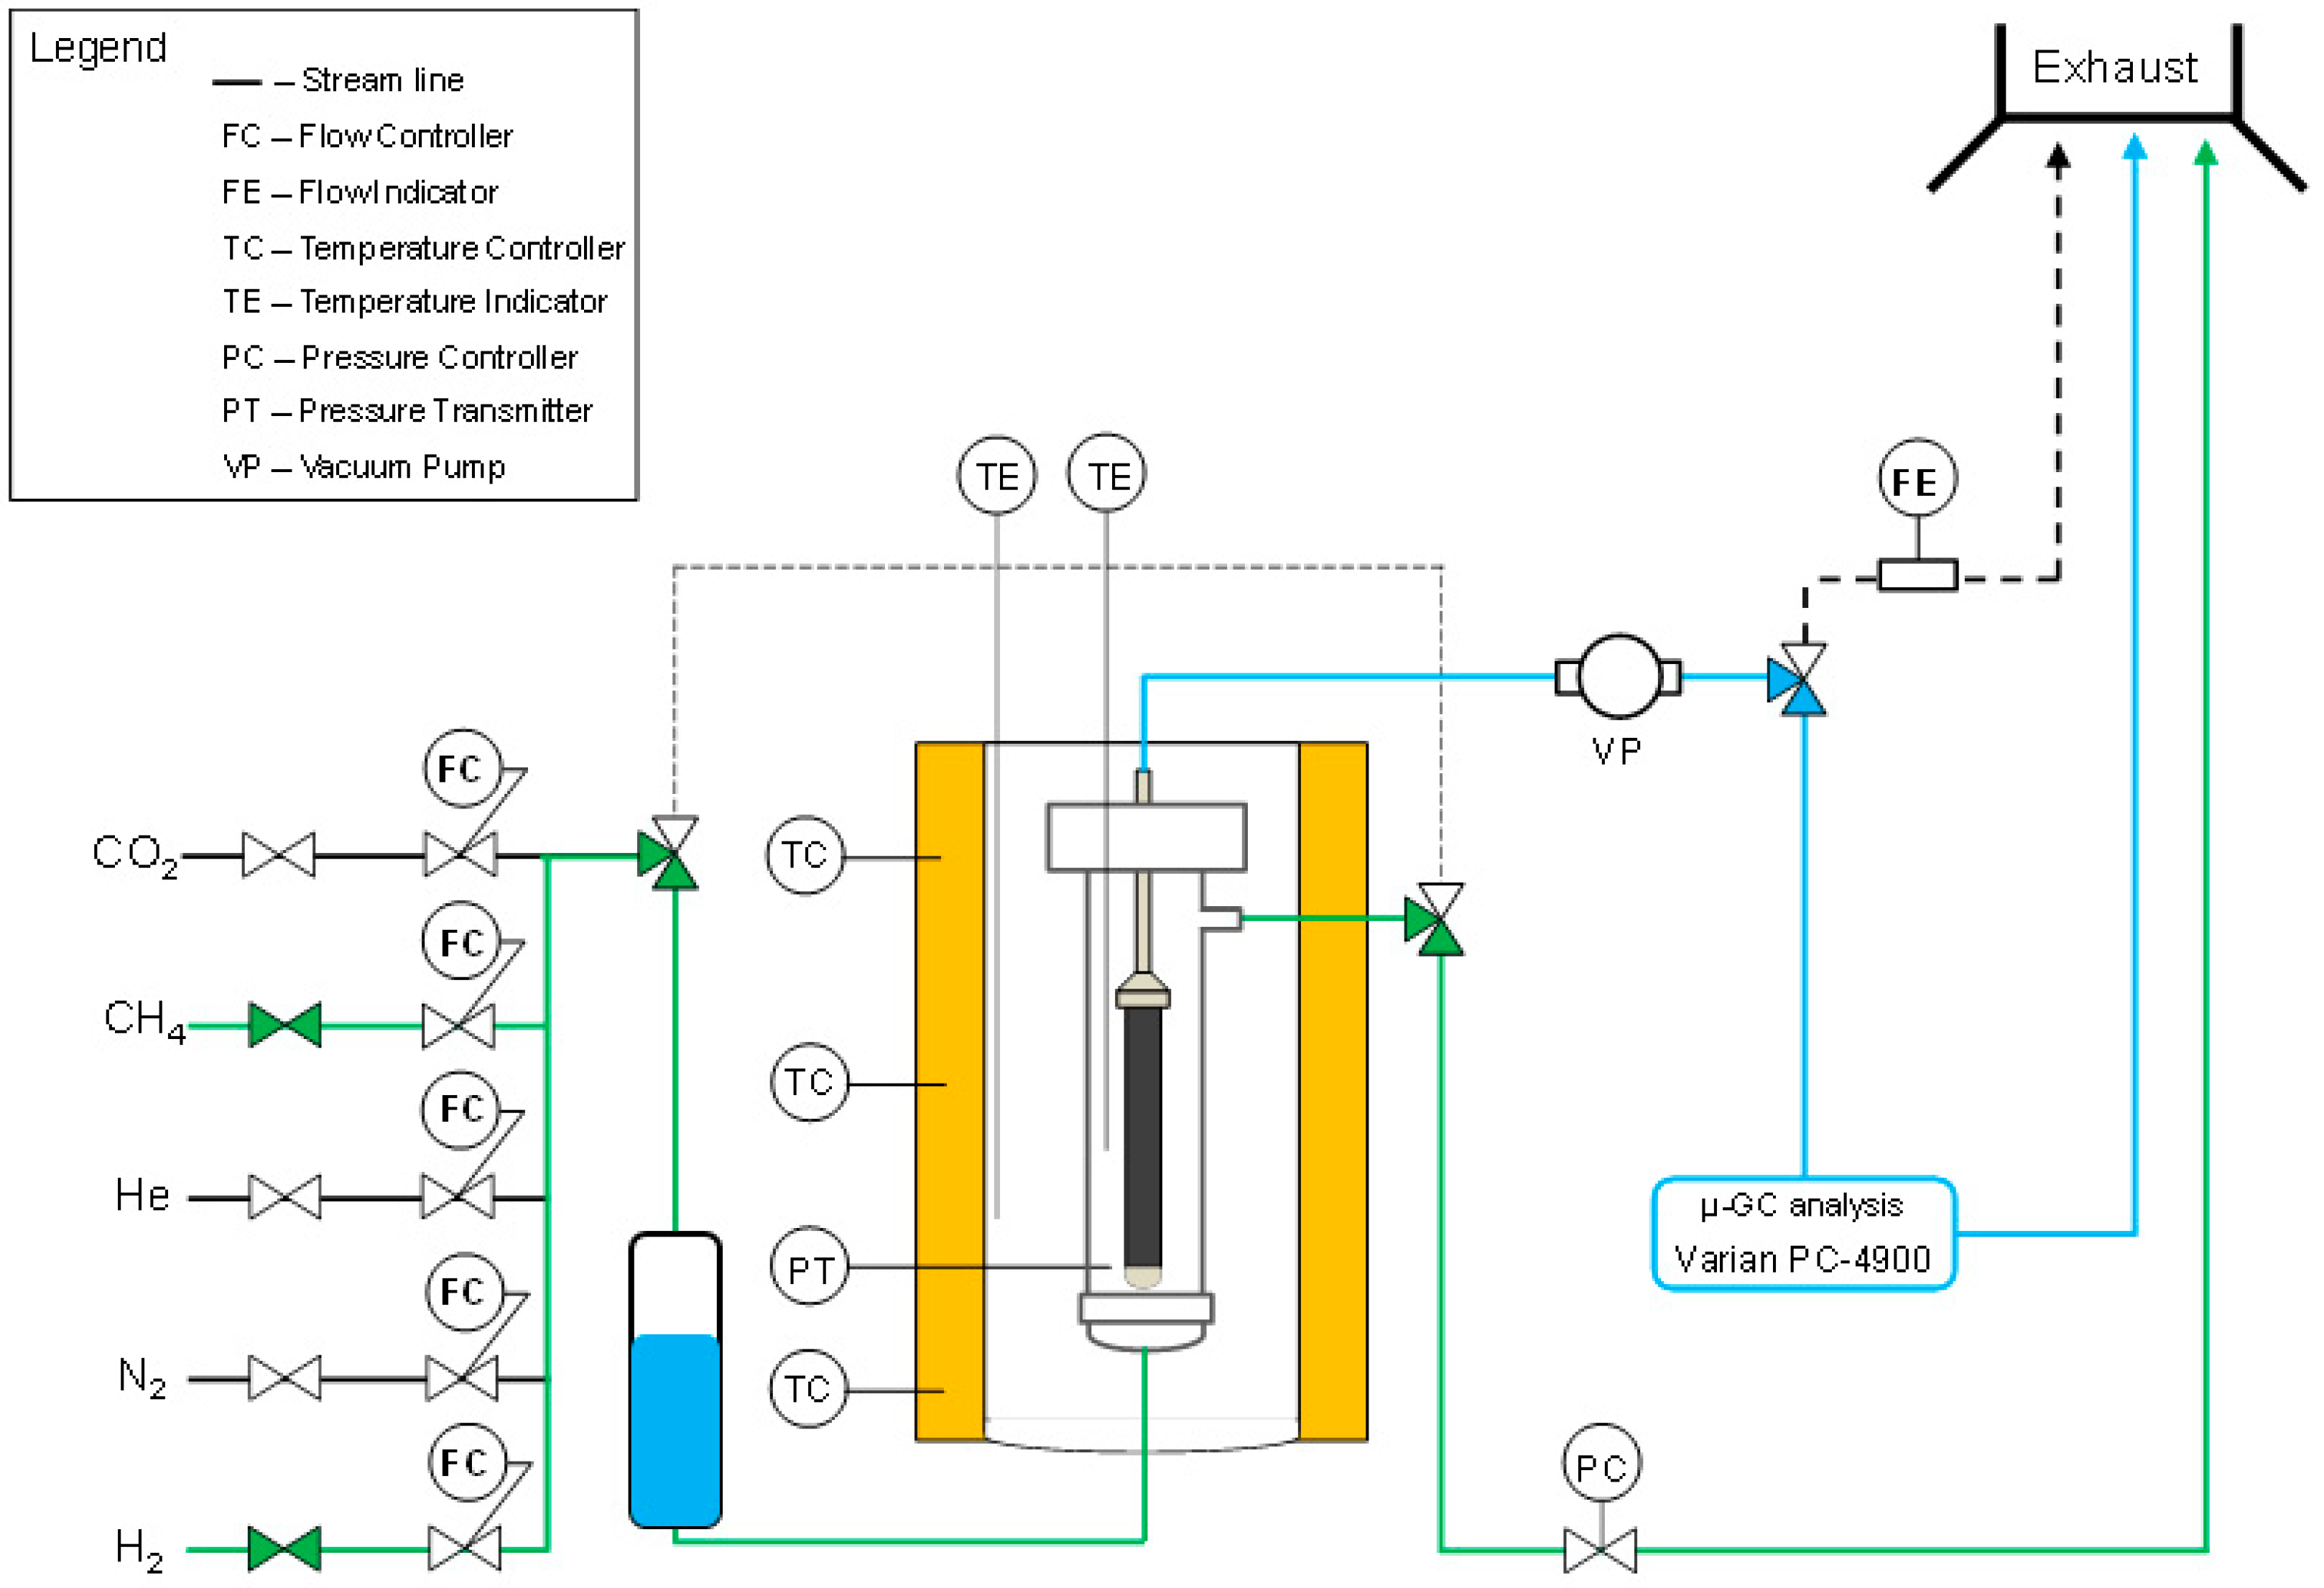
A schematic representation of the permeation setup is depicted in Figure 2. The gases are fed with mass flow controllers supplied by Brooks Instruments and enter in a cylindrical reactor with a diameter of 4.8 cm and 57.3 cm in length located inside an electrical oven.
The membrane is connected to the top flange of the reactor and process gases are fed to the shell side of the membrane from the bottom. The permeate side is at atmospheric pressure when pure gas tests are performed and at vacuum conditions when gas mixtures are investigated. The inlet pressure of the retentate side is controlled through a back-pressure regulator supplied by Bronkhorst (The Netherlands). A soap bubble flow meter from Horiba-Stec (Japan) is used to measure the permeate flow rate, while in a micro-GC Agilent 490 the hydrogen purity is analysed.
The membrane has been first heated up to a maximum temperature of 250 °C at a heating rate of 2 °C/min. Pure gas tests with H2, N2, CH4 and CO2 have subsequently been performed at 20, 50 and 70 °C at different pressures in the range between 1 and 40 bar. After these tests with dry gases, also experiments with humidified streams, to better understand the influence of water adsorption on the membrane surface during the permeation, have been carried out. In the case of humidified conditions, the gas is passed through a tank filled with water to saturate the gas stream before bringing it into contact with the membrane. The gas flow rate is measured by a bubble flow meter. The gas permeance is calculated based on the measured flow rate divided by the pressure difference and the membrane surface area. The selectivity is calculated as the ratio between the hydrogen flow rate and the contaminant flow rate.
H2-CH4, H2-N2 and H2-CO2 mixture tests have also been carried out at different hydrogen molar fractions and feed pressures. The inlet hydrogen concentration was varied between 10% and 70%, while the retentate total pressure was changed between 10 and 40 bar. A vacuum pump in the permeate side ensured a permeate pressure of 0.150 mbar. The permeated hydrogen and the permeated contaminant has been measured for all the experiments with a micro GC. Higher pressures in the permeate (up to 3 bar) were also applied to reveal whether mass transfer limitations play a role in the permeation behaviour. The hydrogen purity is calculated as the ratio between the permeated hydrogen flow rate and the sum between the permeated hydrogen flow rate and the permeated contaminant flow rate.
The following procedure was followed to obtain the powdered samples. The unsupported composite films are introduced in a quartz tube.
The quartz tube is placed inside an oven and 156 mL/min of N2 are fed to remove all the air. Once all the oxygen is removed from the tube, the polymeric sample is heated up to 100 °C with a heating rate of 5 °C/min and kept at this temperature for 15 min. Then the polymeric precursor is heated up from 100 °C to 550 °C with a heating rate of 1 °C/min and kept under these conditions for 2 h. In the next step, the oven is cooled down to room temperature. Finally, the sample is grinded until a powdered sample is obtained.
A scanning electron microscopy (SEM-Quanta 3D FEG) is a characterization technique that allows the evaluation of the morphology of a sample employing high-resolution magnified images. By means of this technique, the morphology and the carbon layer thickness deposited on the membrane support was determined. This analysis was performed once all the permeation experiments were carried, since for SEM a transversal cut of the membranes is needed. Since carbon membranes have a low electrical conductivity, a coating pre-treatment was required prior carrying out the SEM analysis.
One of the main properties of these membranes is the functionality, which comes from the polymer precursor. Hydroxyl and unsaturated groups are the main groups that are expected to be present in the membranes.
Fourier Transformed Infrared Spectroscopy (FTIR) is a powerful tool for both qualitative and quantitative analysis of molecule bonds. Moreover, the use of FTIR for carbon membrane analysis has been reported by several authors previously in the open literature [15,20].
FTIR is a technique used to obtain an infrared spectrum of absorption or emission of a solid, liquid or gas (in this case the sample is solid). The difference between FTIR and a dispersive spectrometer is that FTIR collects high-spectral-resolution data over a wide range, whereas a dispersive spectrometer measures the intensity over a narrow range of wavelengths at a time. This results in a better quantitative accuracy of the FTIR. This technique allows quantifying the bonds present in the sample. Specifically, hydroxyl groups, insaturations and carbonyl groups are the functionalities expected to be present in the samples. Experiments are carried out using an Agilent Cary 630 FTIR with a ZnSe Diffuse module for powder samples analysis. The membrane layers are previously ground and then diluted with KBr powder. The resulting mixture contains 5% (w/w) of carbon membrane material.
The final plots are obtained by subtracting the KBr spectrum to the diluted samples, normalizing the signal intensity for all plots and, finally, converting the absorbance into transmittance.
Thermal gravimetric analysis (TGA) is a characterization technique, which measures the mass of a sample over time as the temperature is varied. This analysis yields information related to physical and chemical phenomena such as adsorption, absorption, desorption, chemisorption and oxidative degradation, among others. In this project, TGA is used to generate information regarding the adsorption of different gasses onto the membrane sample surface [3,4]. This information is relevant for the description of the transport mechanism of the gases through the membrane.
This setup consists of a precision balance with a sample pan located inside a furnace in which a powdered sample of carbon membrane is placed. Once the furnace chamber is closed, the setup is programmed to pre-treat the sample to remove the water adsorbed from the atmosphere humidity. This pre-treatment consists of increasing the temperature up to 300 °C with a helium flow rate of 0.5 L/min, keeping the sample at these conditions for one hour. After this treatment, the system is cooled down to the temperature at which the TGA analysis is desired. At this point, the feed of helium is stopped and substituted by the gas that is to be analysed (CO2). Progressively, the pressure is increased up to 8 bar.
To understand the adsorption behaviour and type of isotherm in carbon membranes, which in turn can help to describe the dominant transport mechanisms depending on the operating conditions, the Dubinin-Astakhov equation [21] is used as reported by Equations (1) and (2). In their description, w represents the volume of adsorbate filling the micropores (cm3/g), at temperature T and P/P0, while w 0 is the maximum volume of adsorbent per adsorbed mass (cm3/g), β is the affinity coefficient of the characteristic curves, E 0 is the characteristic energy of adsorption, n is an equation parameter and A is the differential molar work of adsorption.
w = w 0 e x p [ ( A β E 0 ) n ]
A = R T l n ( P 0 P ) .
The reproducibility of the measures has been confirmed by measuring the hydrogen fluxes and purities at fixed conditions after drying and humidifying the membranes several times.

3. Results and Discussion

3.1. Pure Gas Tests

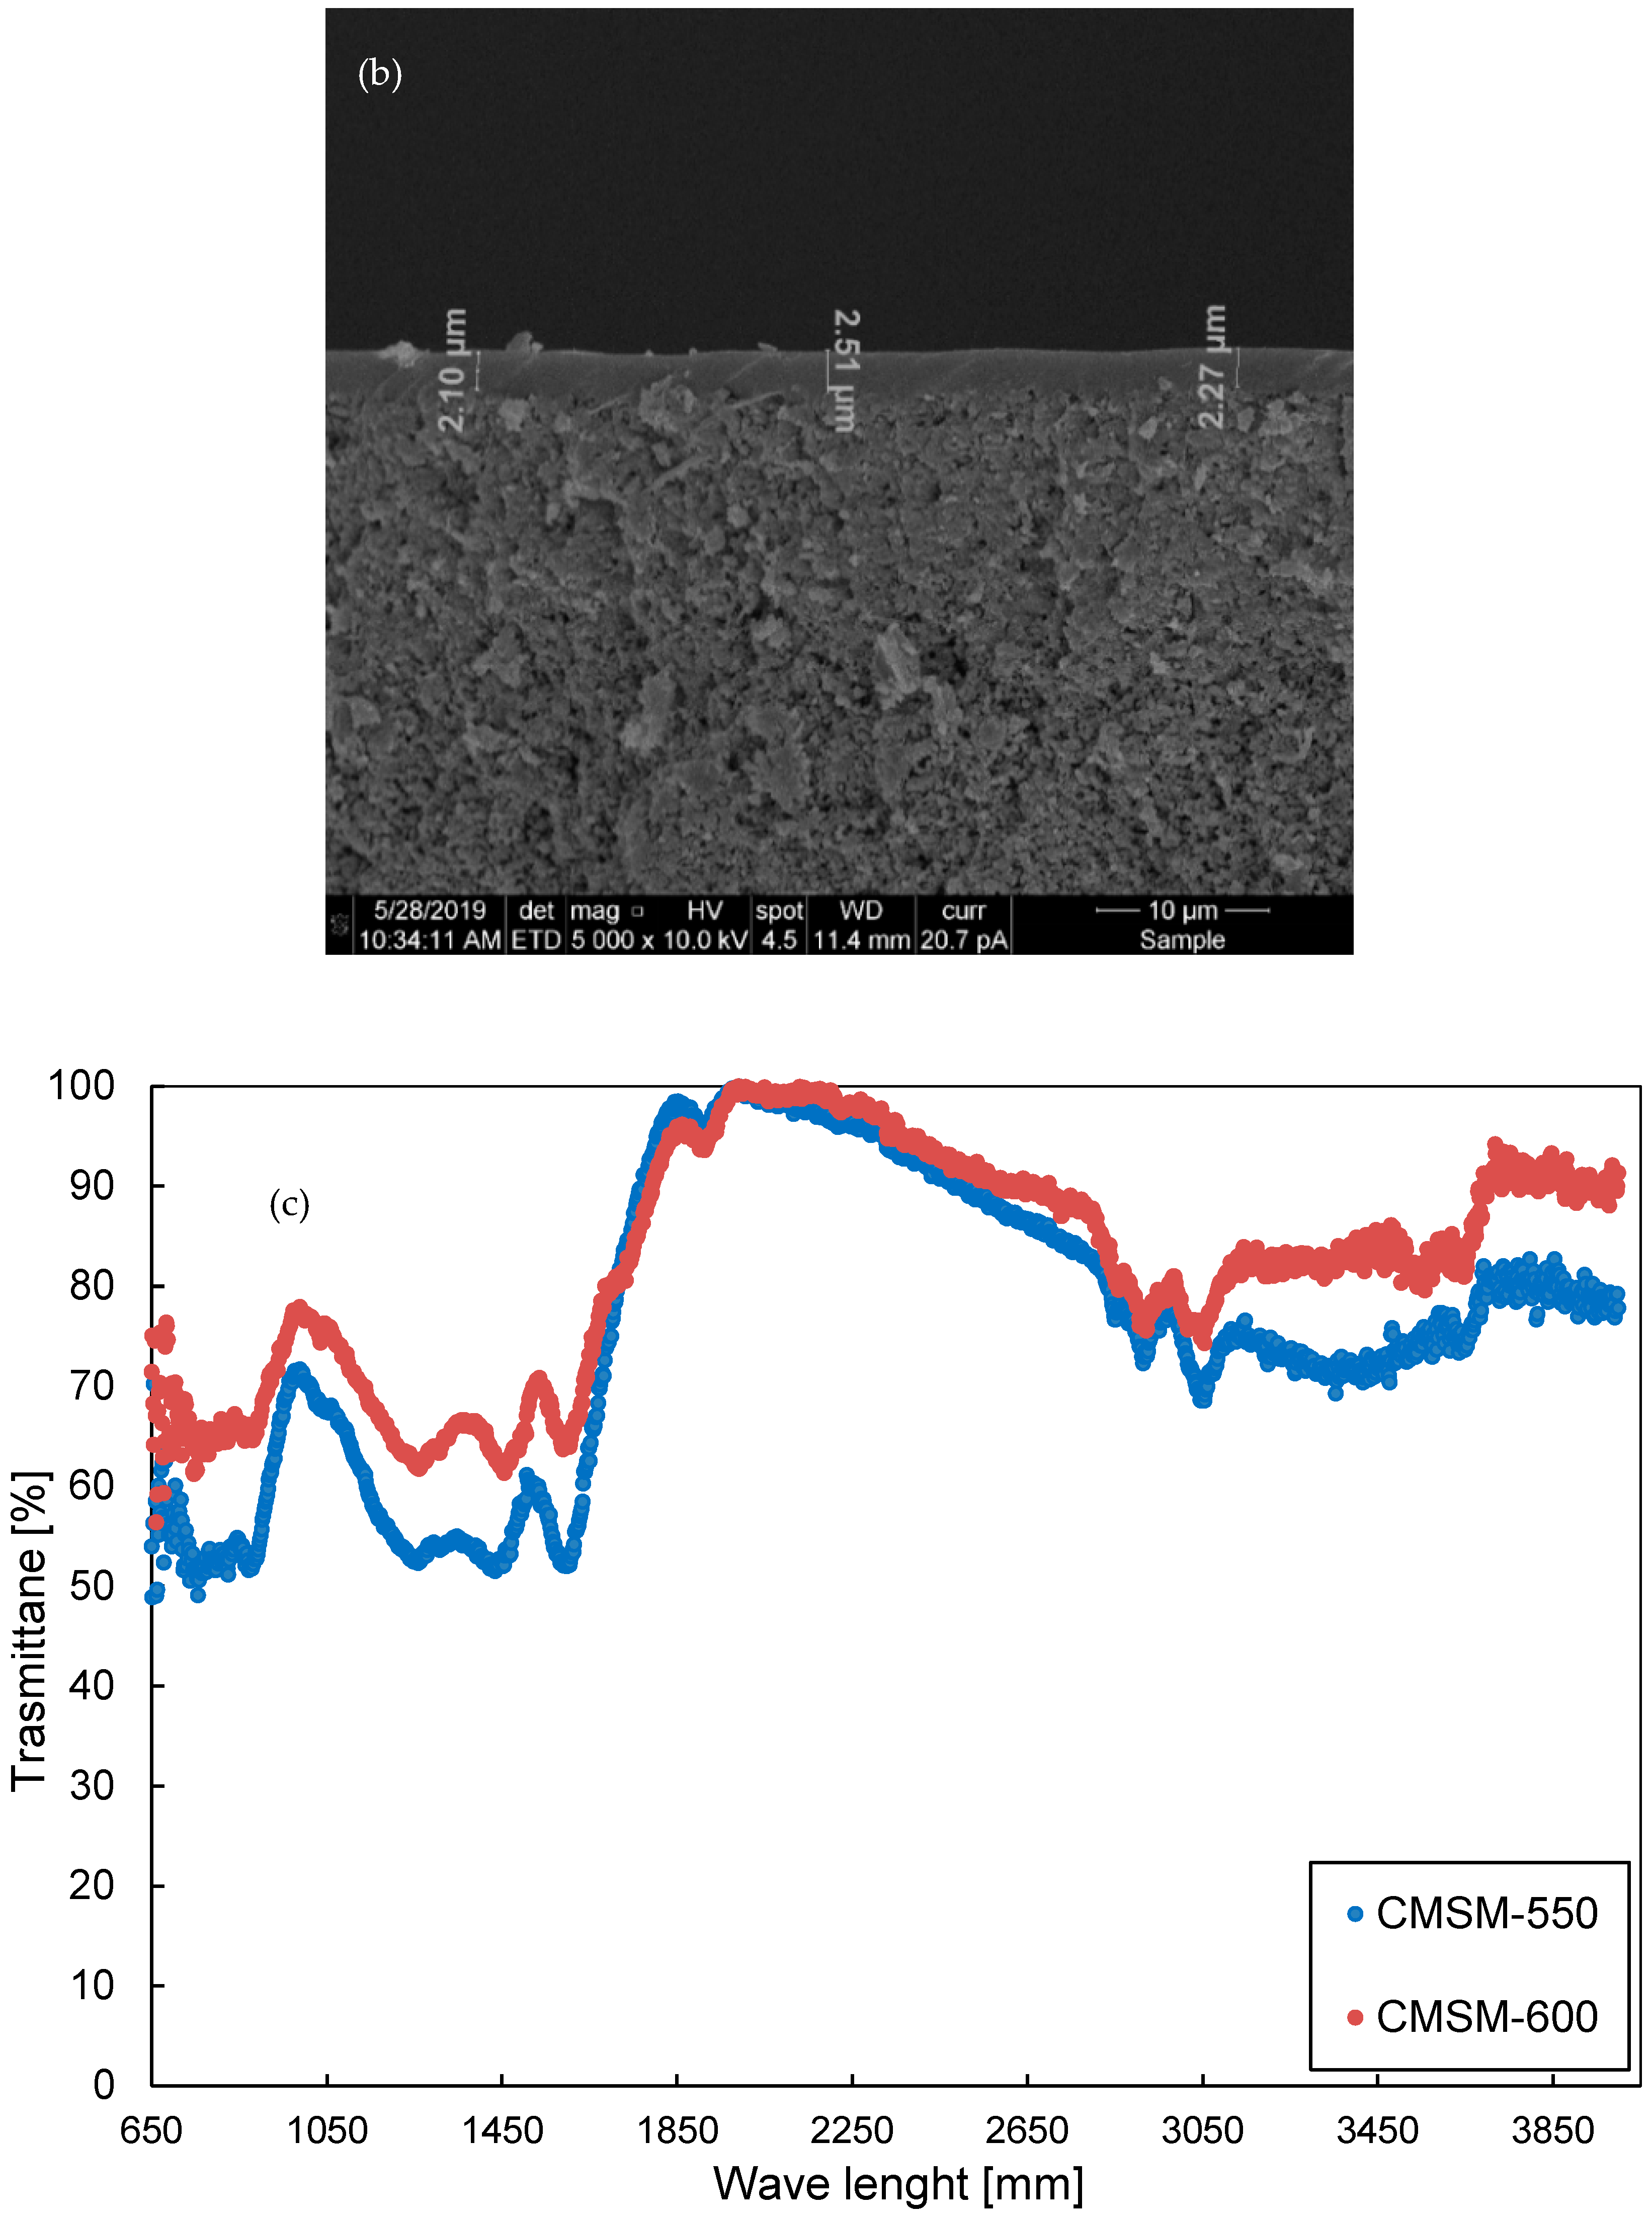
SEM pictures of the top membrane layer and the asymmetric support are given in Figure 3 for the membrane CMSM-550. From Figure 3b,c, a significant difference in thickness between the two sides of the membrane can be observed. This might be caused by the preparation method (dip-coating), where the bottom part of the membrane stays in contact with the polymer longer than the top side, thus yielding thicker membrane layers at the bottom.
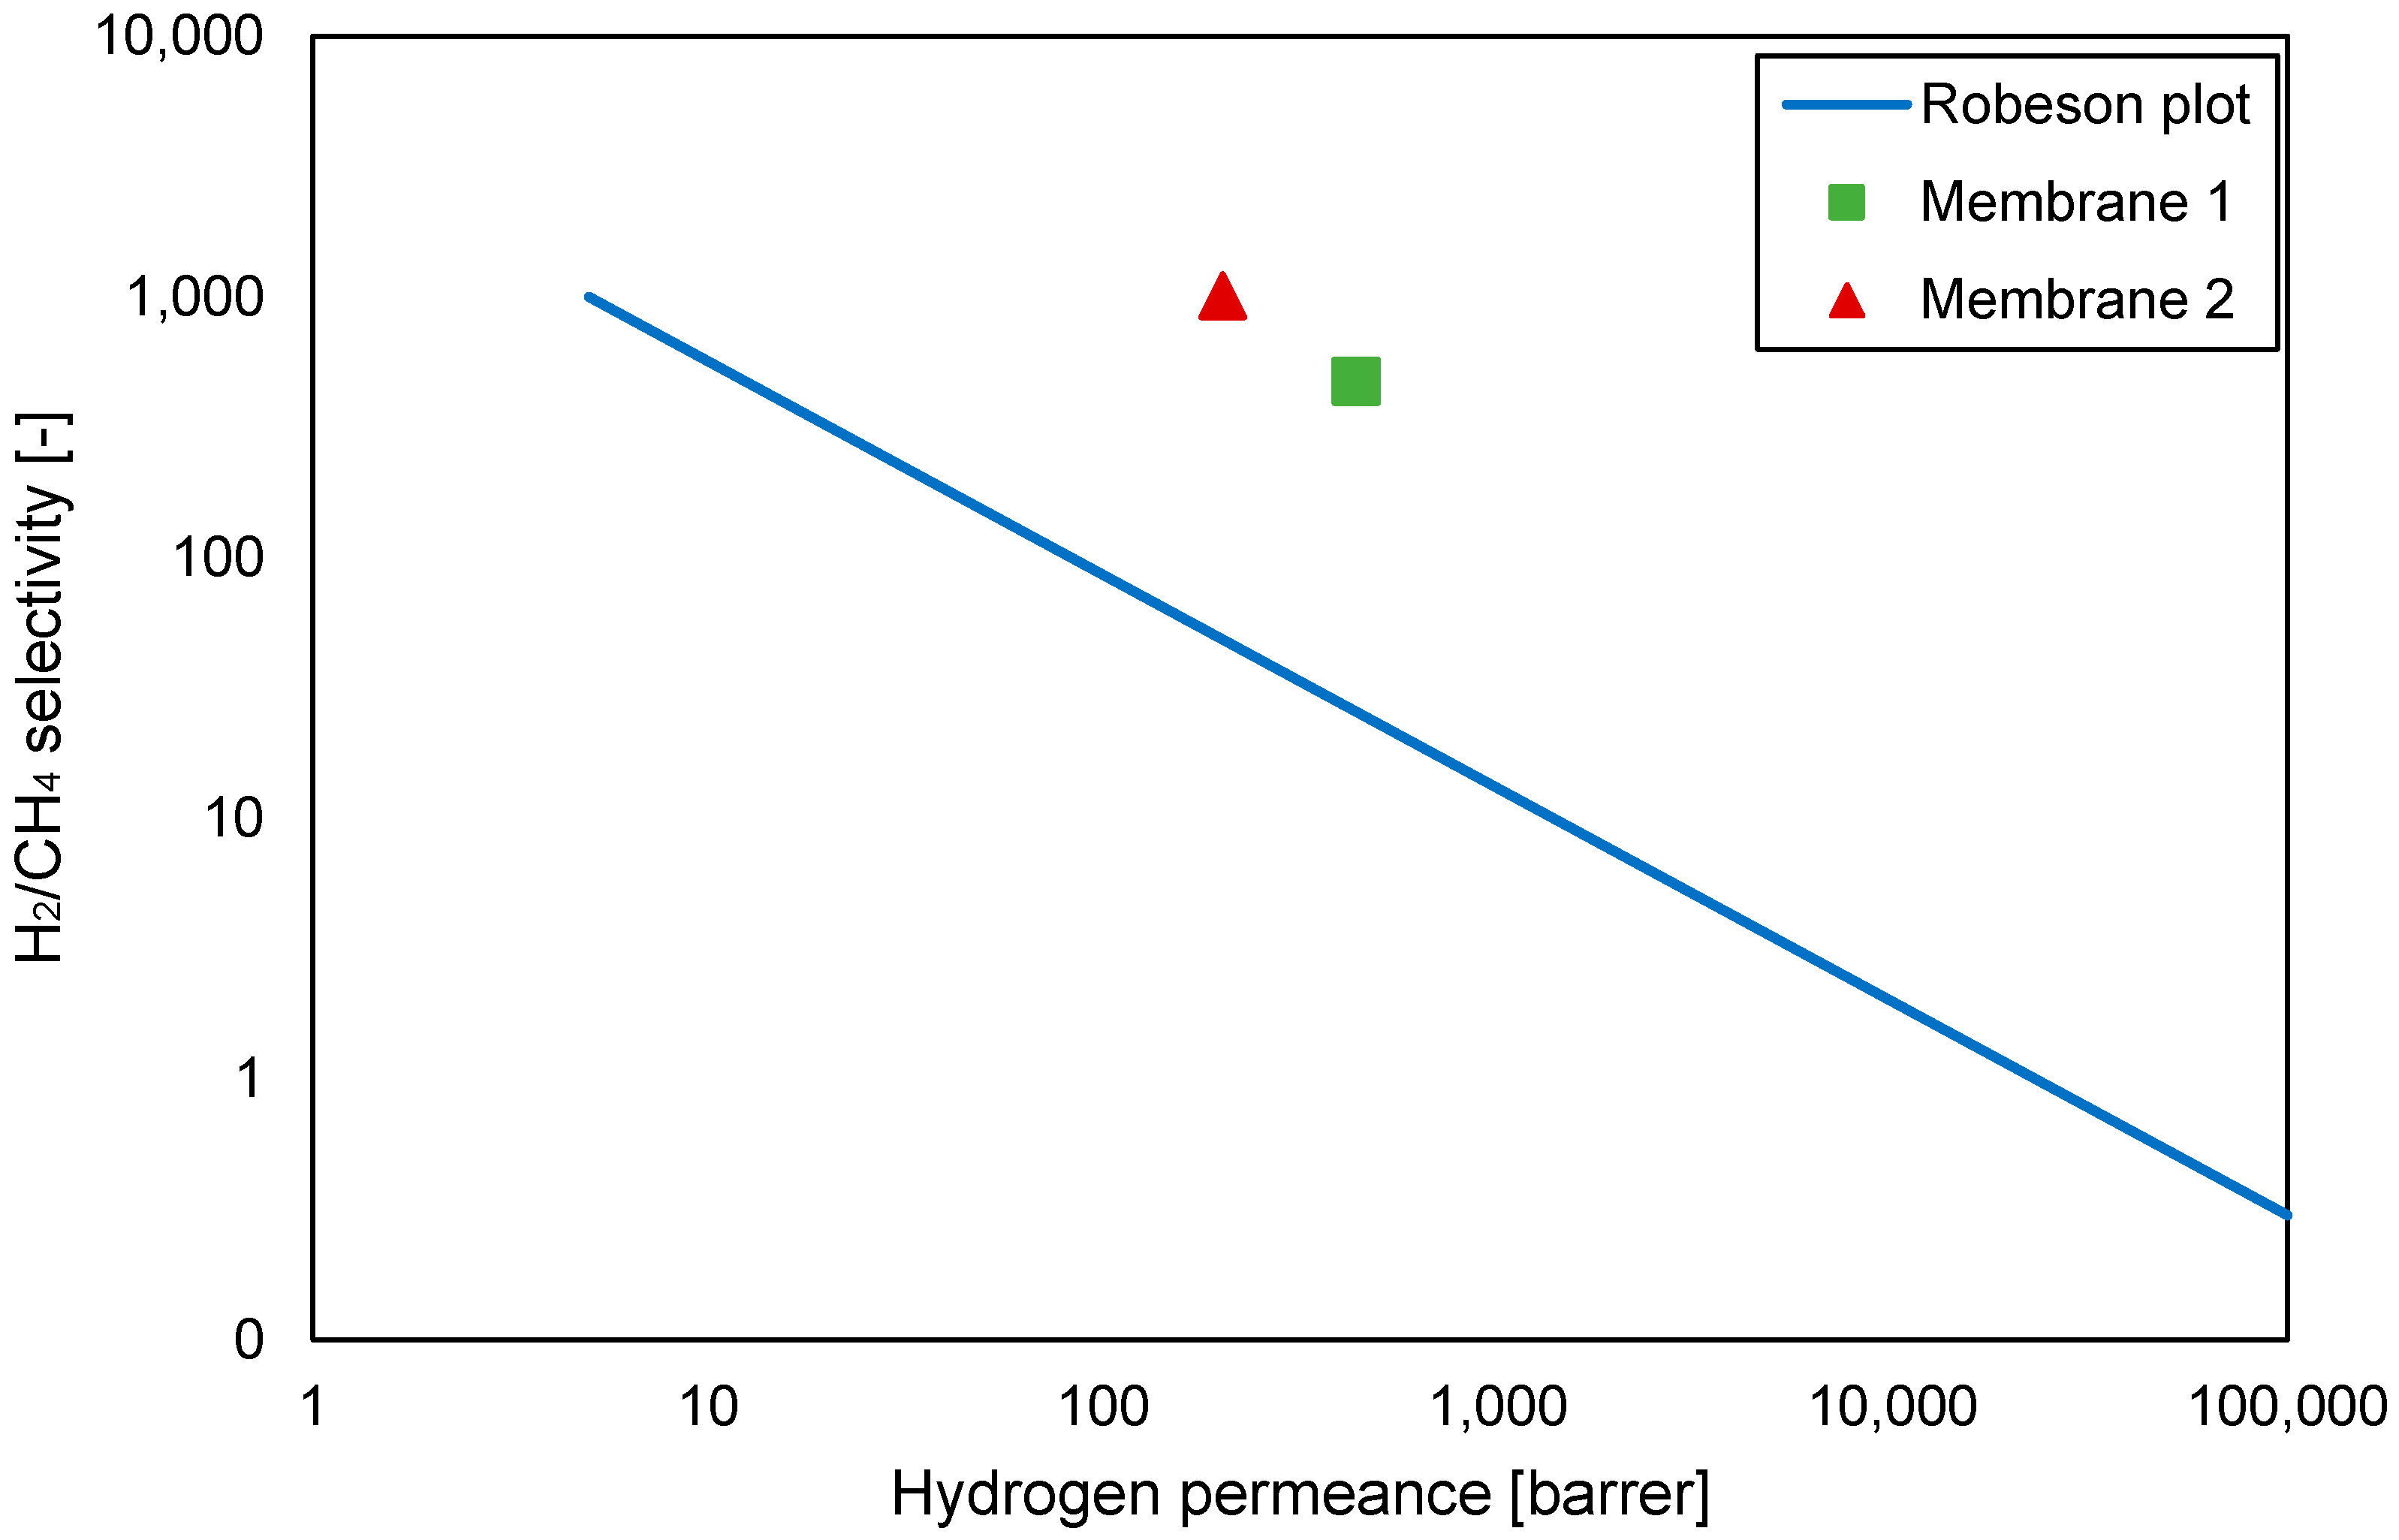
The gas permeation properties of the two membranes investigated in this work have been investigated at 20, 35, 50 and 70 °C and the results are given in Figure 4, where the selectivity and permeability for a H2/CH4 ideal case are compared to the Robeson upper bound, calculated from pure gas tests [22]. These results indicate a higher performance of the carbon membranes prepared in this work as compared to state-of-the-art polymeric membranes for the gas pair H2/CH4.
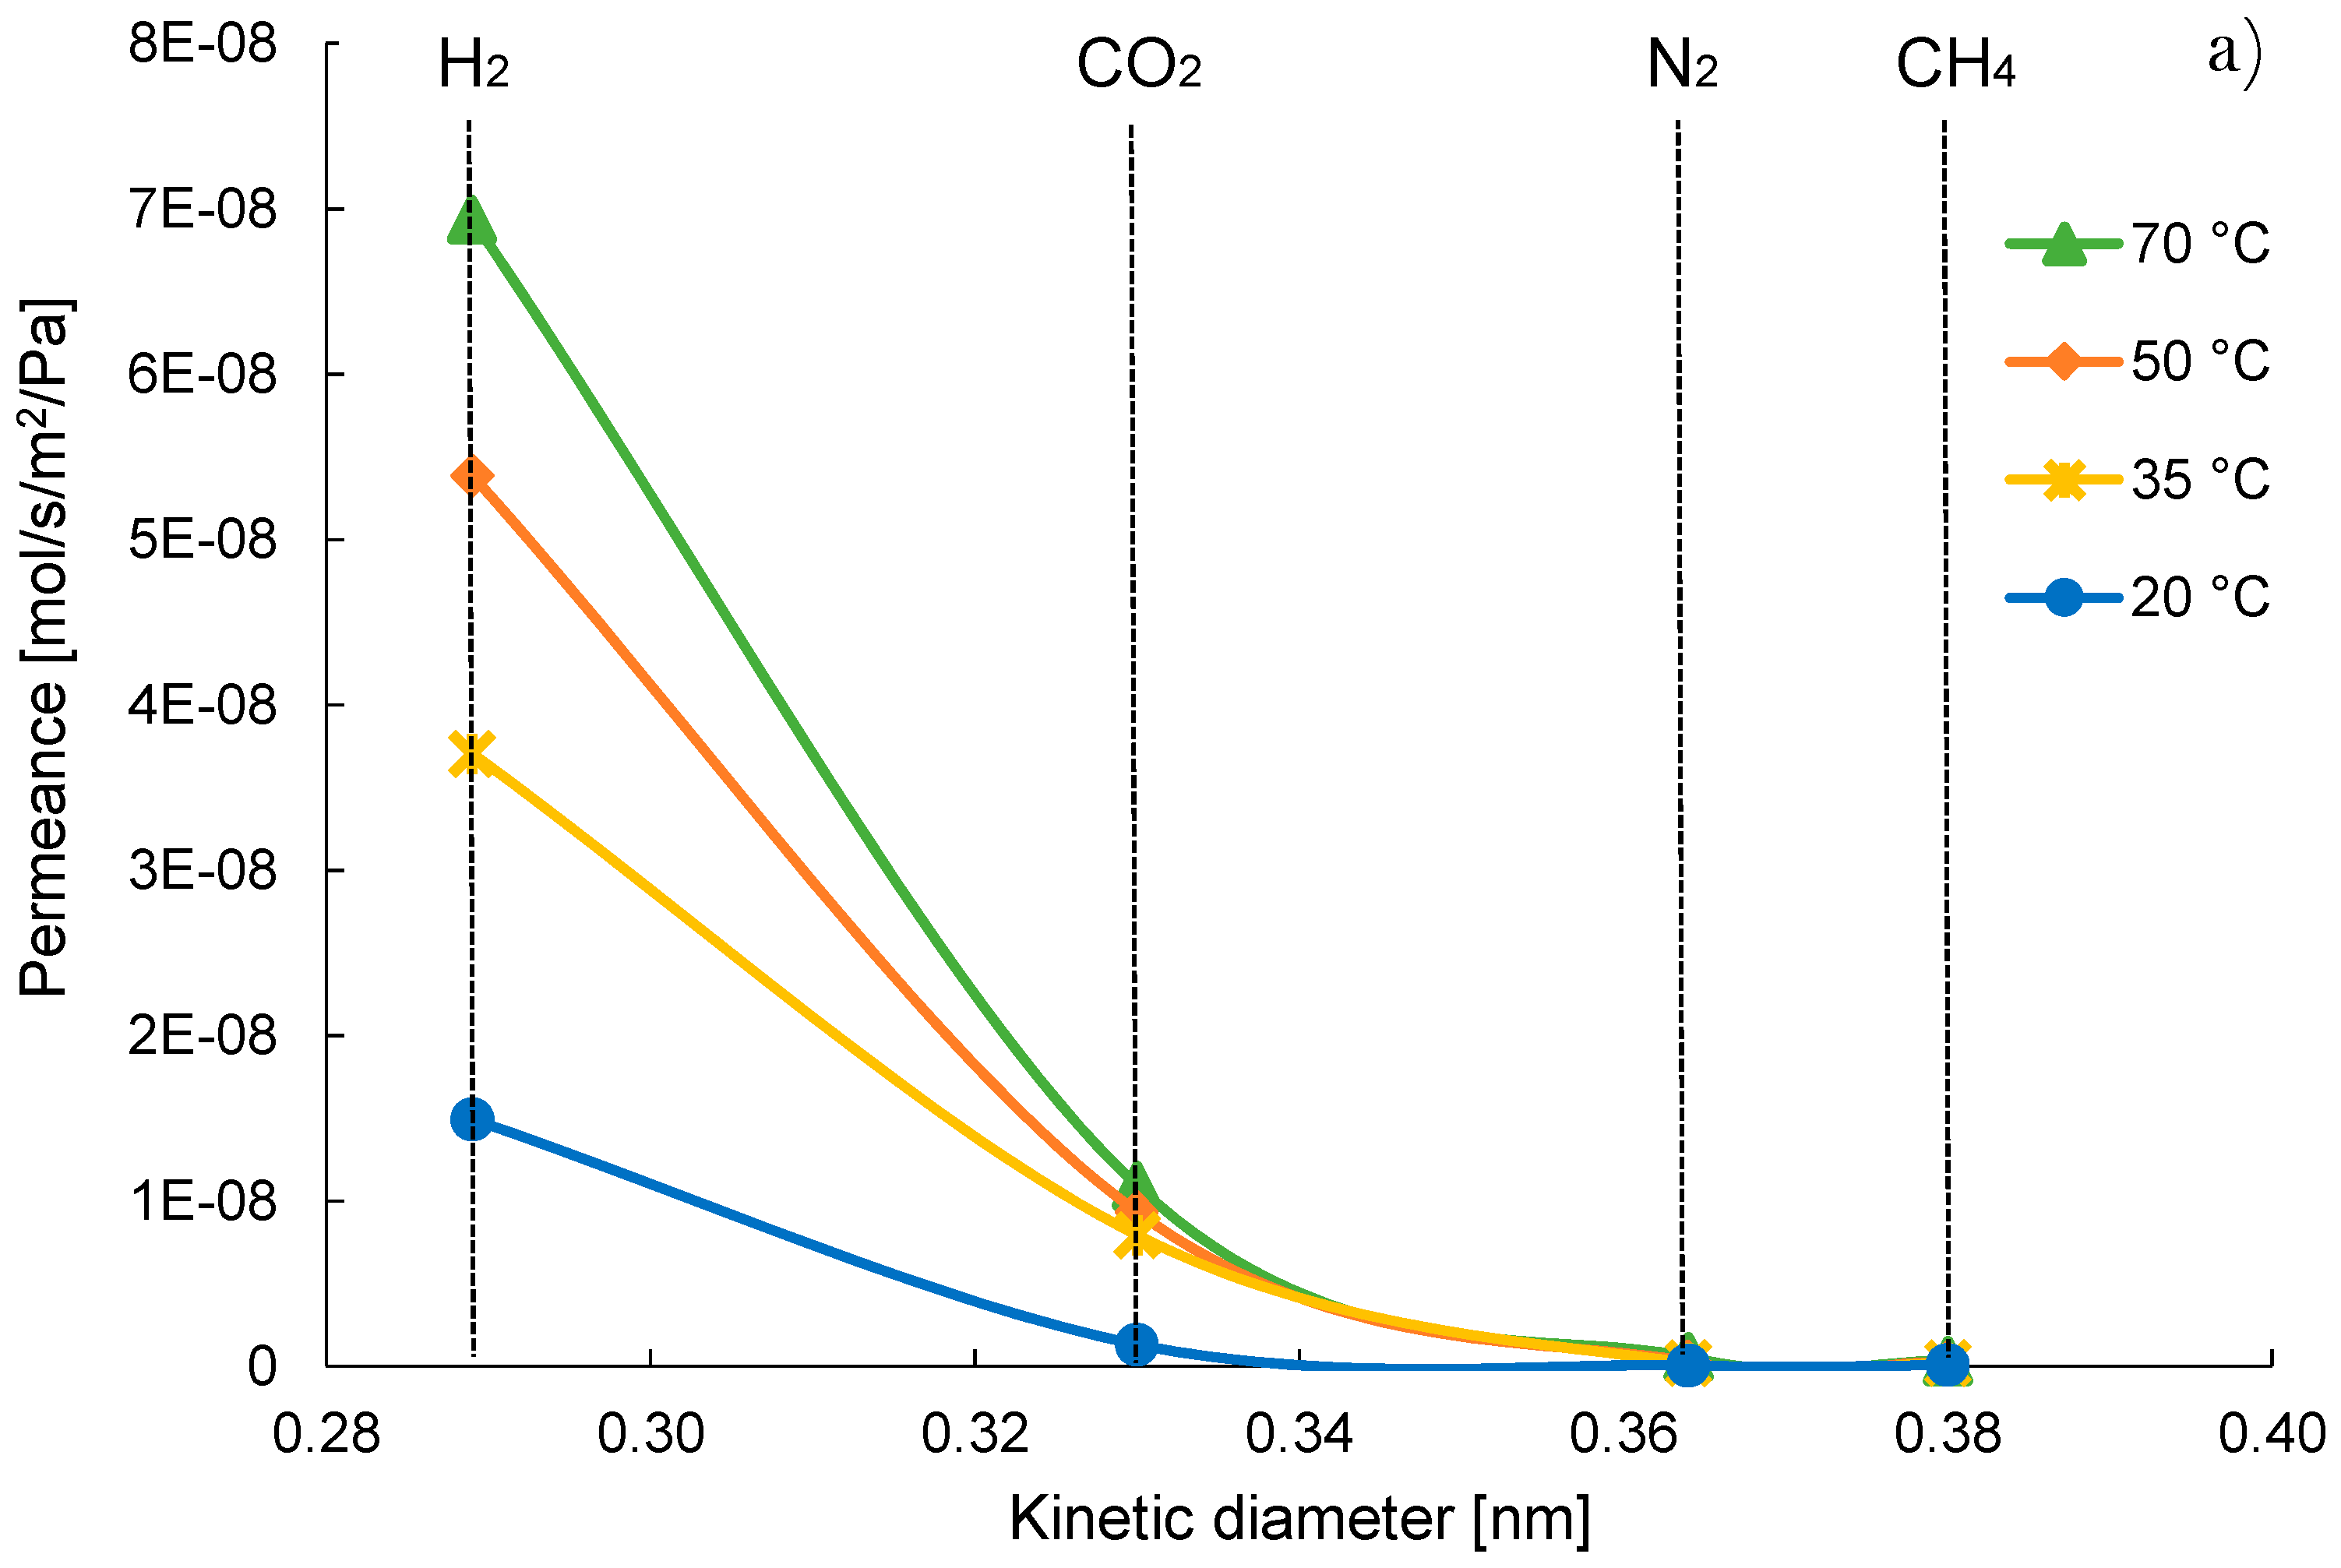
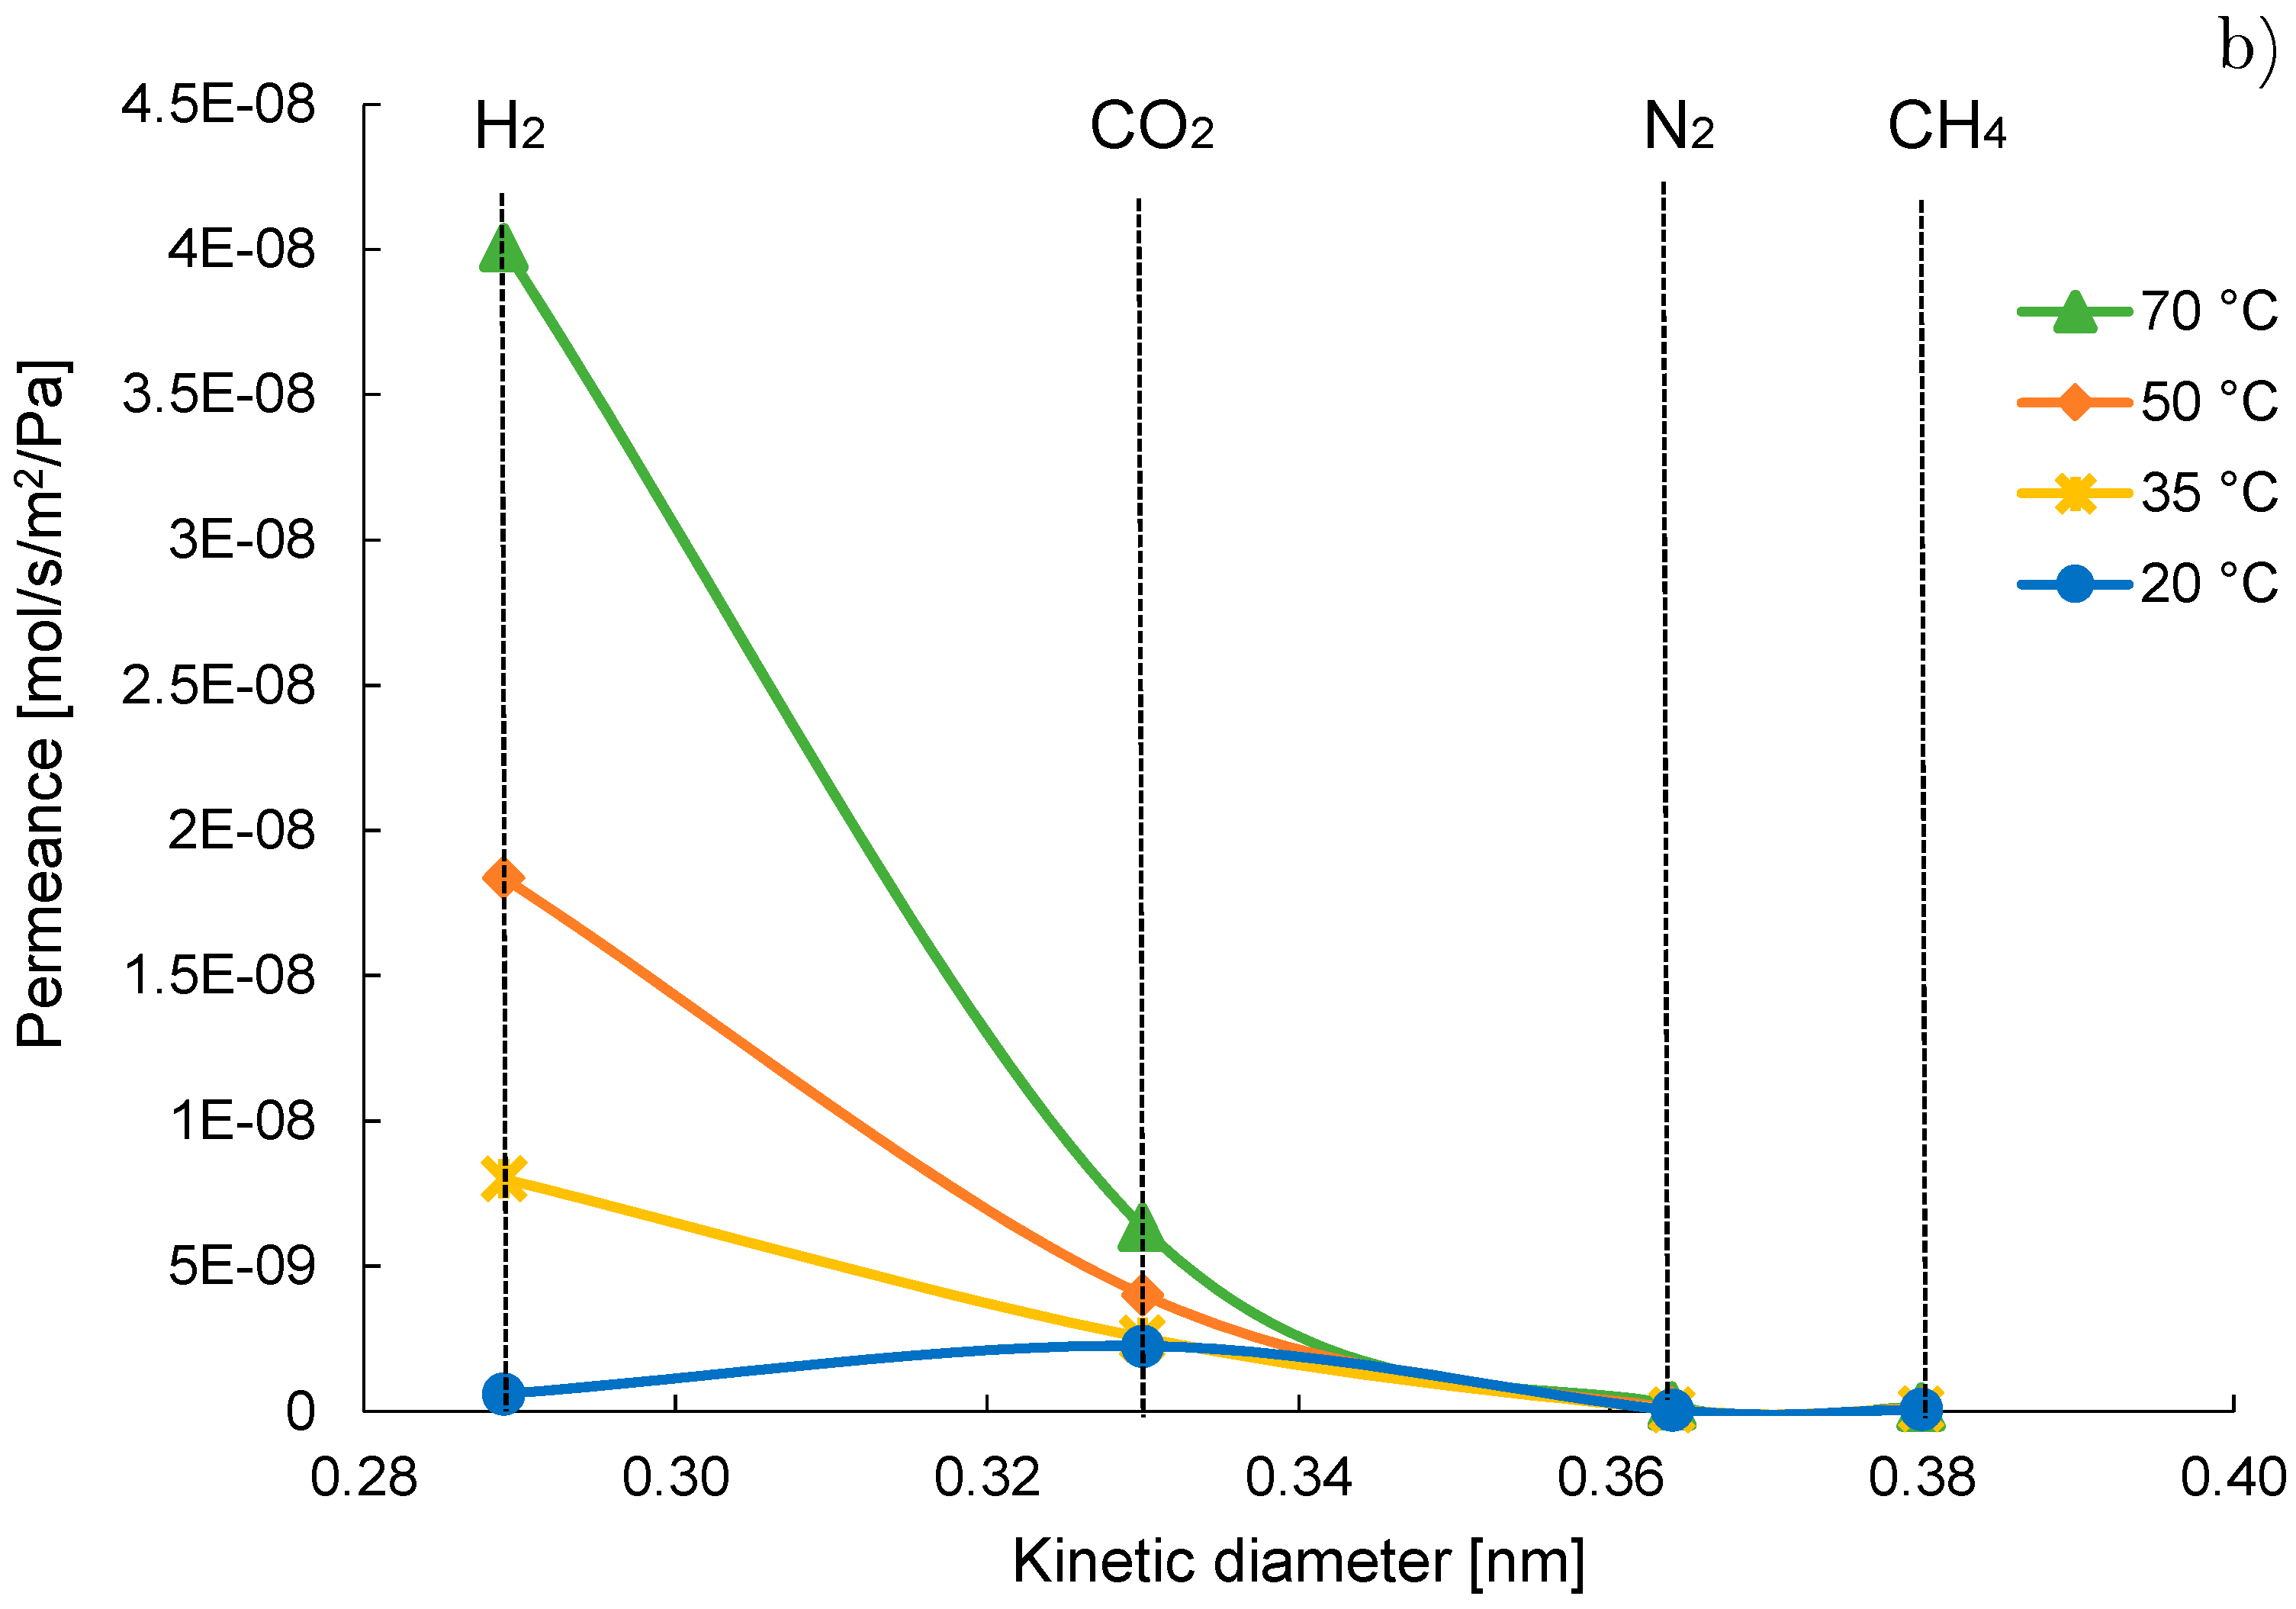
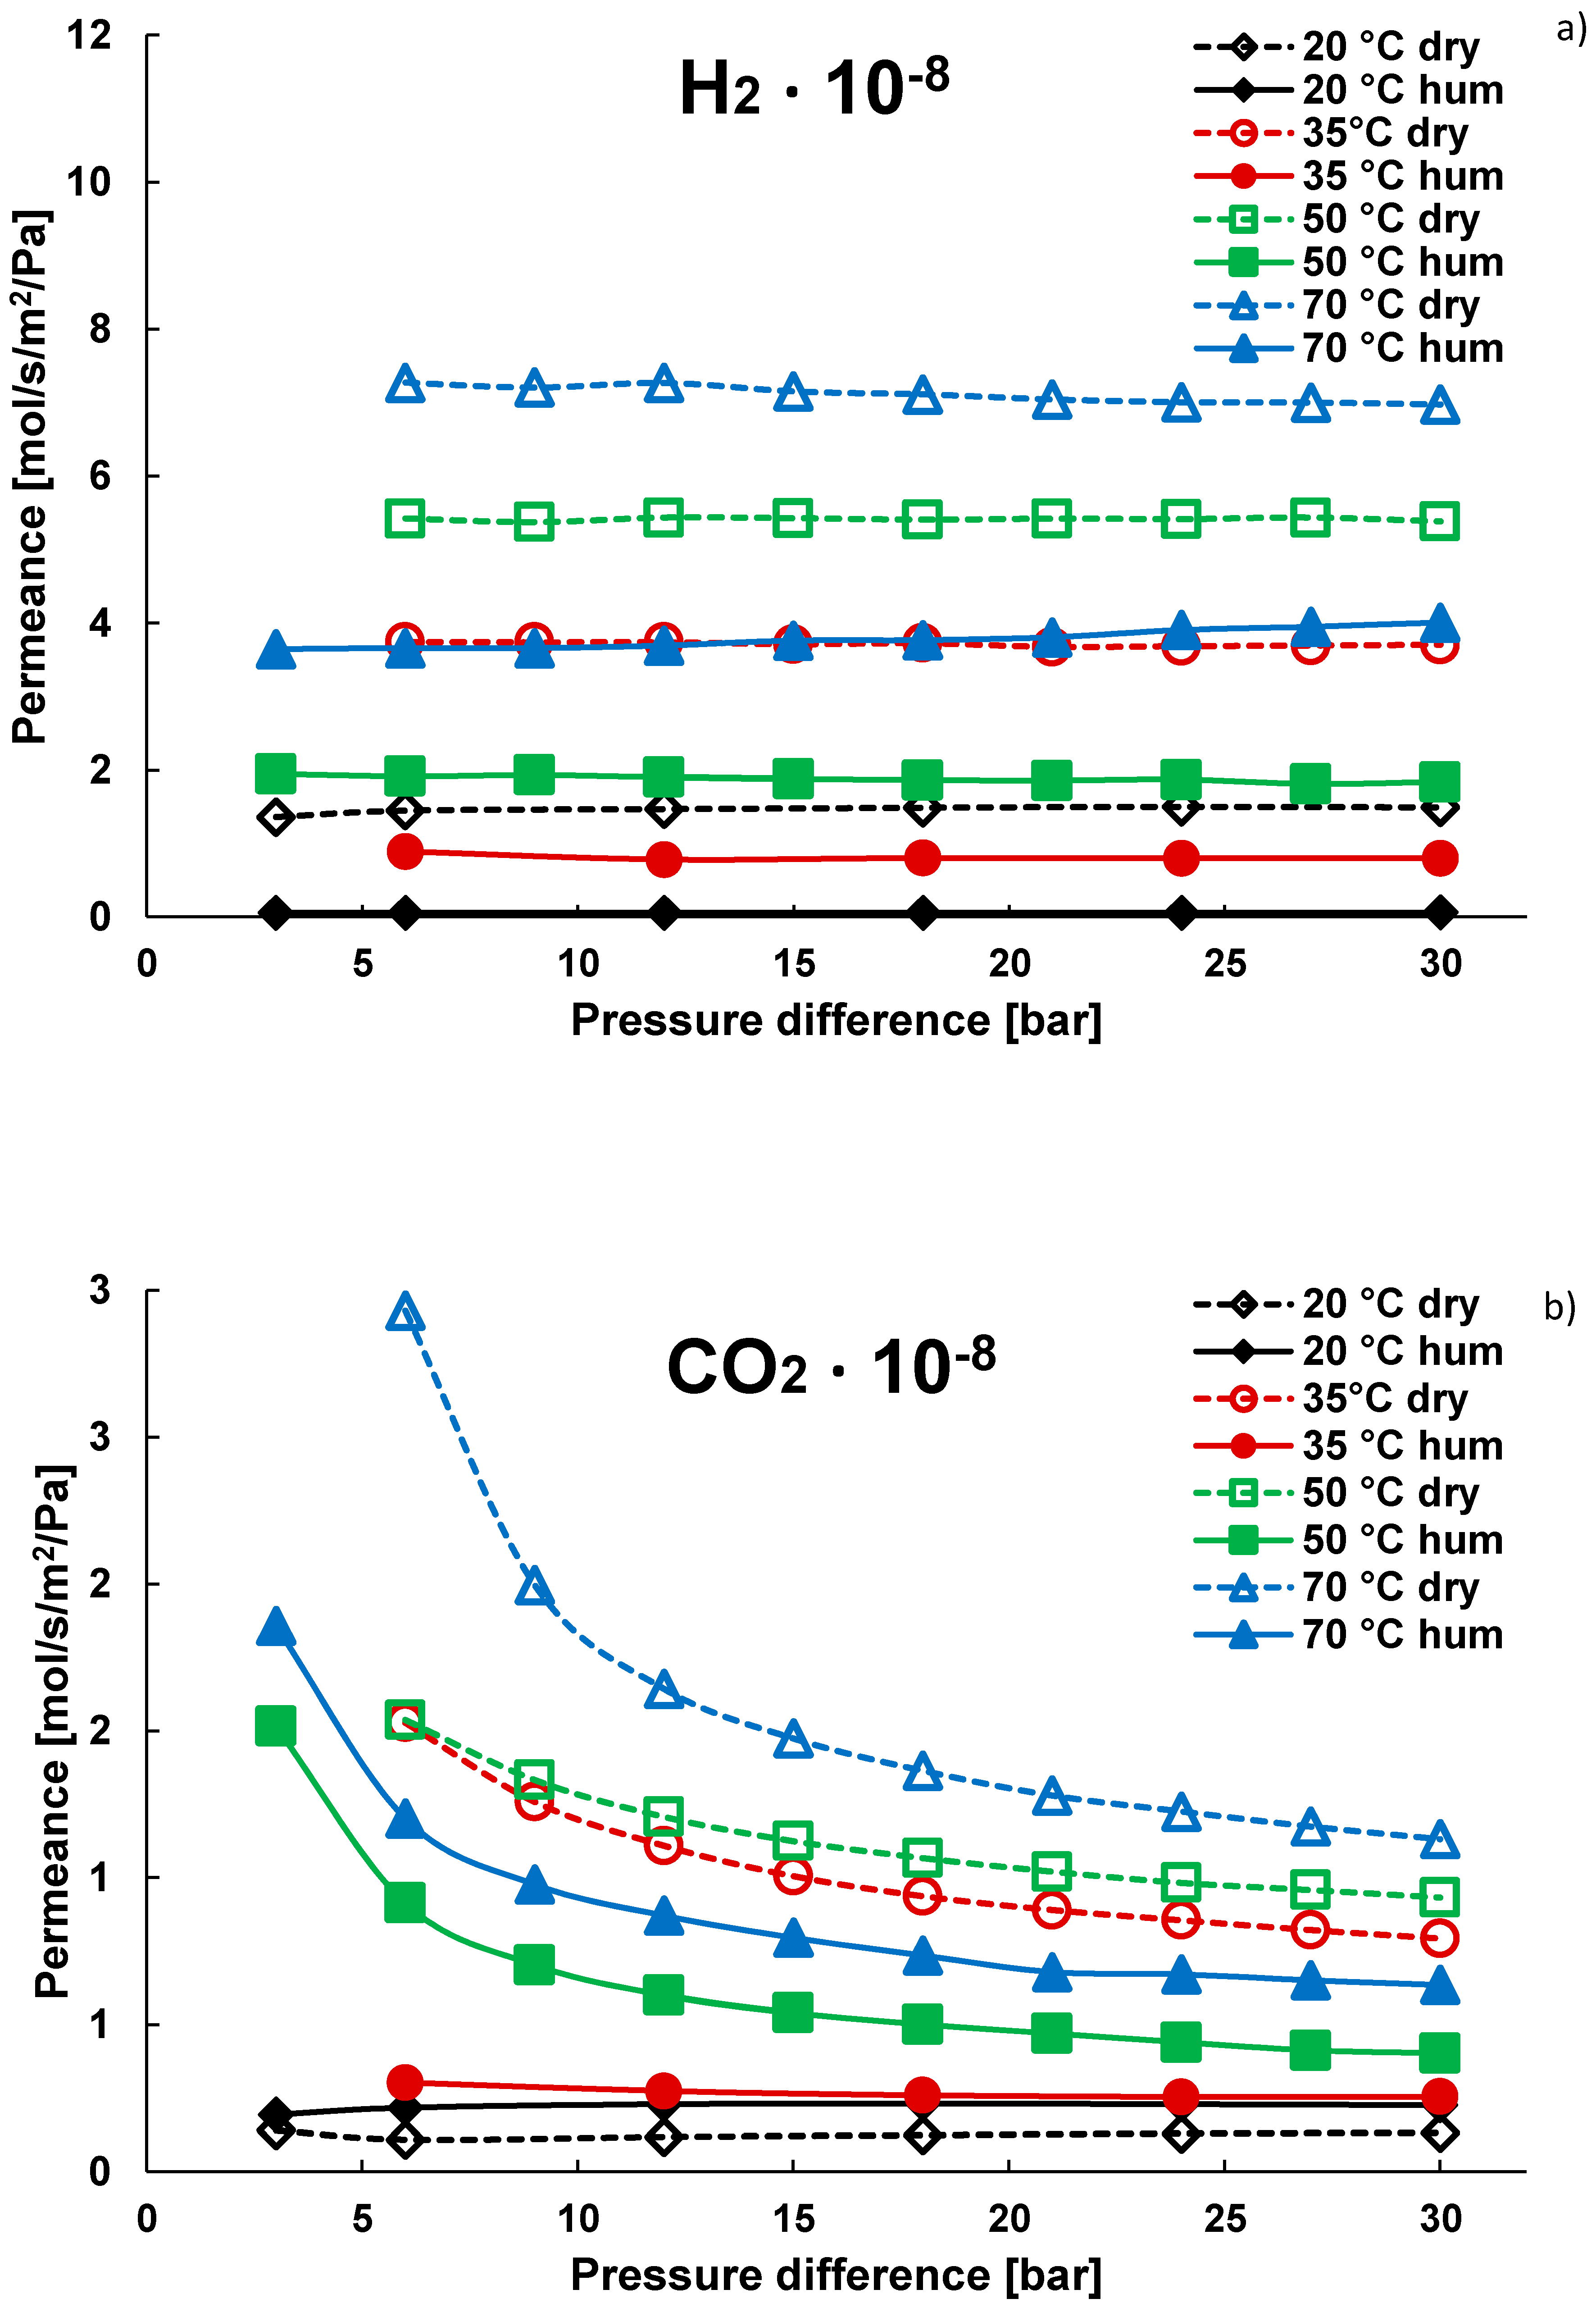
The permeance of various gases for the membrane CMSM-550, stored at room temperature for several weeks, at various temperatures and at 30 bar pressure difference is shown in Figure 5a. Similar experiments but using humidified gas are presented in Figure 5b. The permeance using dry gas follows the order H2 > CO2 > N2 > CH4, which is in line with the kinetic diameter of the gases. Moreover, for all the gases the permeance increases while increasing the temperature. In the literature, it was reported that the permeance for H2 and CO2 are higher than expected for only molecular sieving due to the contribution of adsorption diffusion mechanism at lower temperatures [18].
In Figure 3c, the FTIR results are depicted. These functional groups are responsible for the functionality of the membranes and have an effect on the separation mechanism. As expected, the functional groups present in all the carbon membranes are O-H bonds, C-O bonds and C=C un-saturations that were originally present in the Novolac resin structure. Analysing the FTIR spectrum from high to low wave lengths, it is possible to notice—broad signal at 3400 mm corresponds to the O-H bond stretching, the two peaks located at 2920 mm and 3040 mm are the C-H bonds stretching. The C-H stretching that gives a signal below 3000 mm comes from aromatic rings. Moreover, aromatic C=C stretch peaks are detected at 1610 mm and 1460 mm, followed by the 1240 mm C-O signal. Finally, below 900 mm, the IR energy is absorbed by the C-H and C=C bending movements [10].
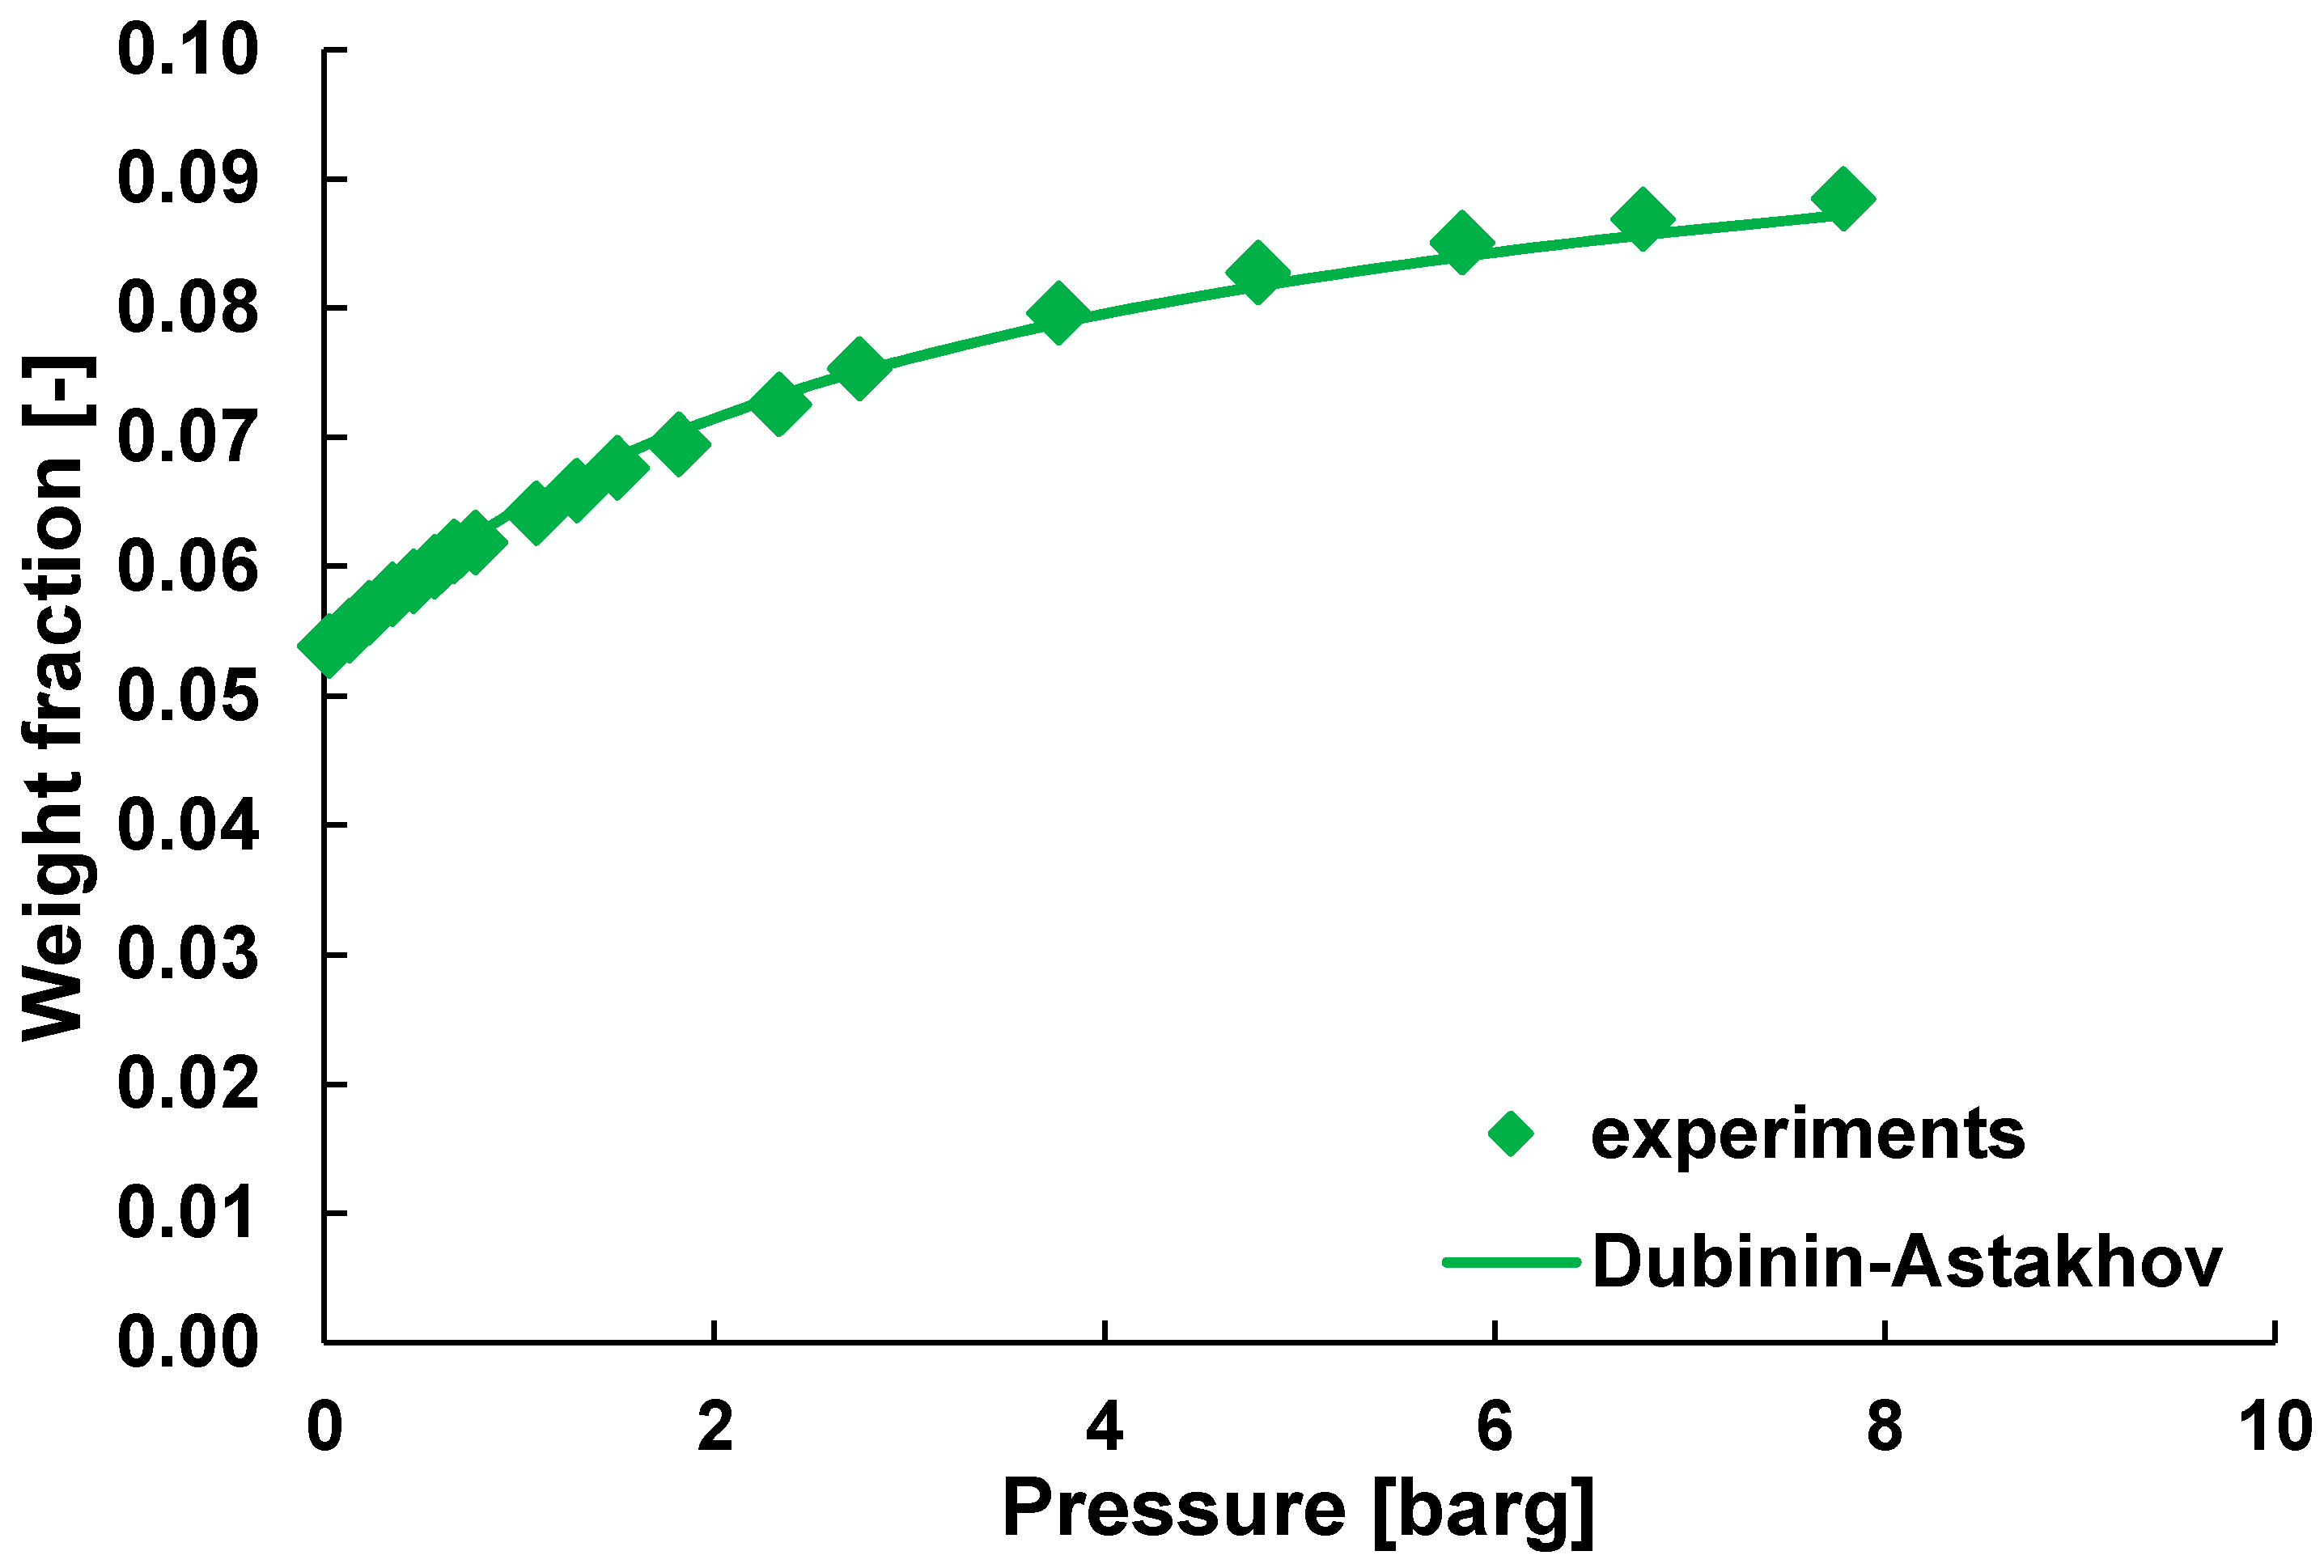
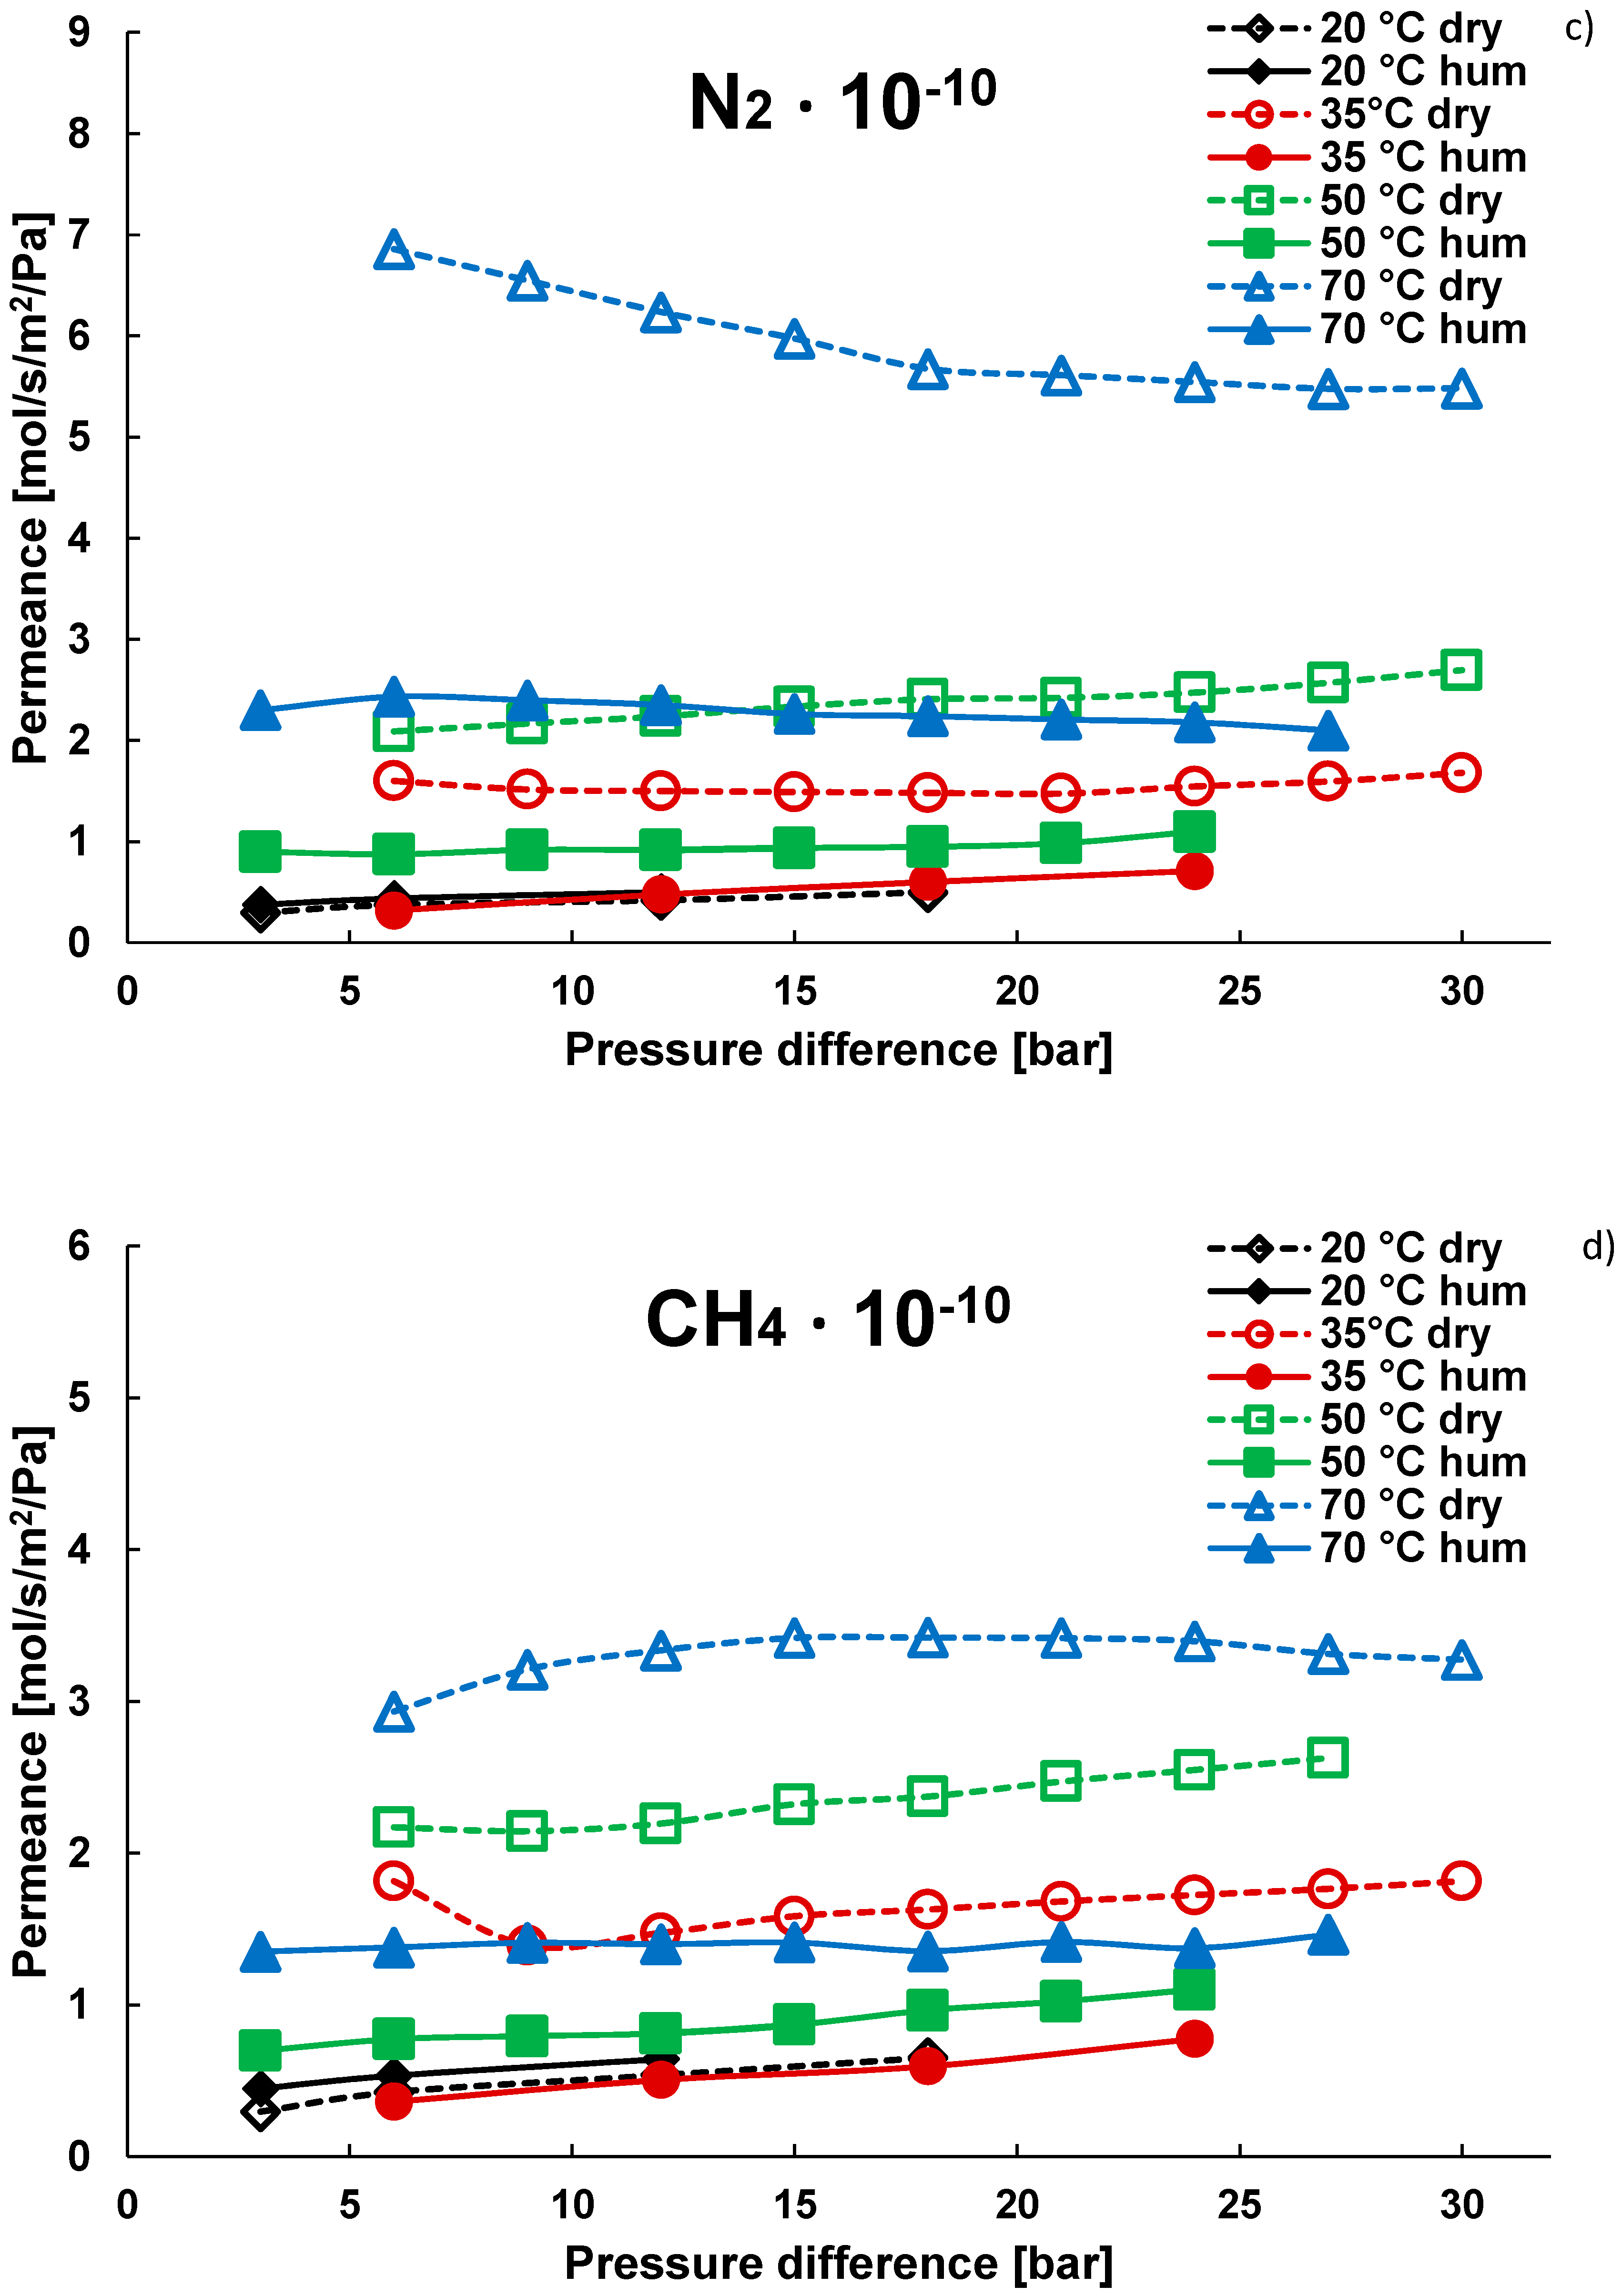
Thermogravimetric analysis (TGA) demonstrates that carbon dioxide follows the adsorption isotherm type I according to Figure 6 and the isotherm can be described by the Dubinin-Astakhov equation. Carbon dioxide has a high adsorption capacity and thus its permeance is higher compared to CH4 and N2. The adsorption is favoured at low temperatures and high pressures. In Figure 7, the permeances of tested gases at various pressures and temperatures are shown. The hydrogen permeance is independent of pressure related to the simple diffusion through the membrane pores. On the other hand, the permeance of CO2, CH4 and N2 are not linear with pressure due to the contribution of adsorption. The mole fraction of water in the gas stream is 2.35% at 1 bar. The gas is always saturated at 20 °C, keeping the same water content even at higher temperatures. The water tank is pressurized when working at higher pressure, assuring gas saturation at higher pressure.
Hydrogen and carbon dioxide have a permeance in the order of 10−8 mol/s/m2/Pa, whereas the permeance of nitrogen and methane is in the order of 10−10. A possible explanation can be found in the lower kinetic diameter of H2 and CO2 compared to the other tested molecules. It is also an indication that the membrane pore size is in between the kinetic diameter of CO2 and CH4. Water adsorption is blocking the gas permeation, thereby reducing the effective membrane pore size. Indeed, at higher temperatures, when water is progressively removed, the permeance of nitrogen and methane increases.
A possible explanation for the gas permeances at different temperatures and pressures with humidified and dry stream lies on a combination of parameters such as gas solubility, gas diffusivity in water and kinetic diameter. In Table 1, a description of gas diffusivity in water at 20 °C, solubility at 20 °C and kinetic diameter is provided for H2, N2, CO2 and CH4.
Considering pure hydrogen tests, it is more convenient to work in dry conditions for improving the permeance because of the reduced solubility in water which one order of magnitude lower than nitrogen and methane.
For carbon dioxide, the only condition in which the permeance in humidified stream is higher than dry stream is at 20 °C because CO2 has a remarkable solubility in water which decreases with temperatures. Similar considerations are valid for nitrogen and methane with reduced solubility in water compared to carbon dioxide. At lower temperatures, the amount of water adsorbed will be higher, consequently reducing the effective pore size. For CO2, the permeance is almost linear with the temperature at pressures higher than 10 bar. At low temperatures, CO2 does not condense significantly in the pores [23].
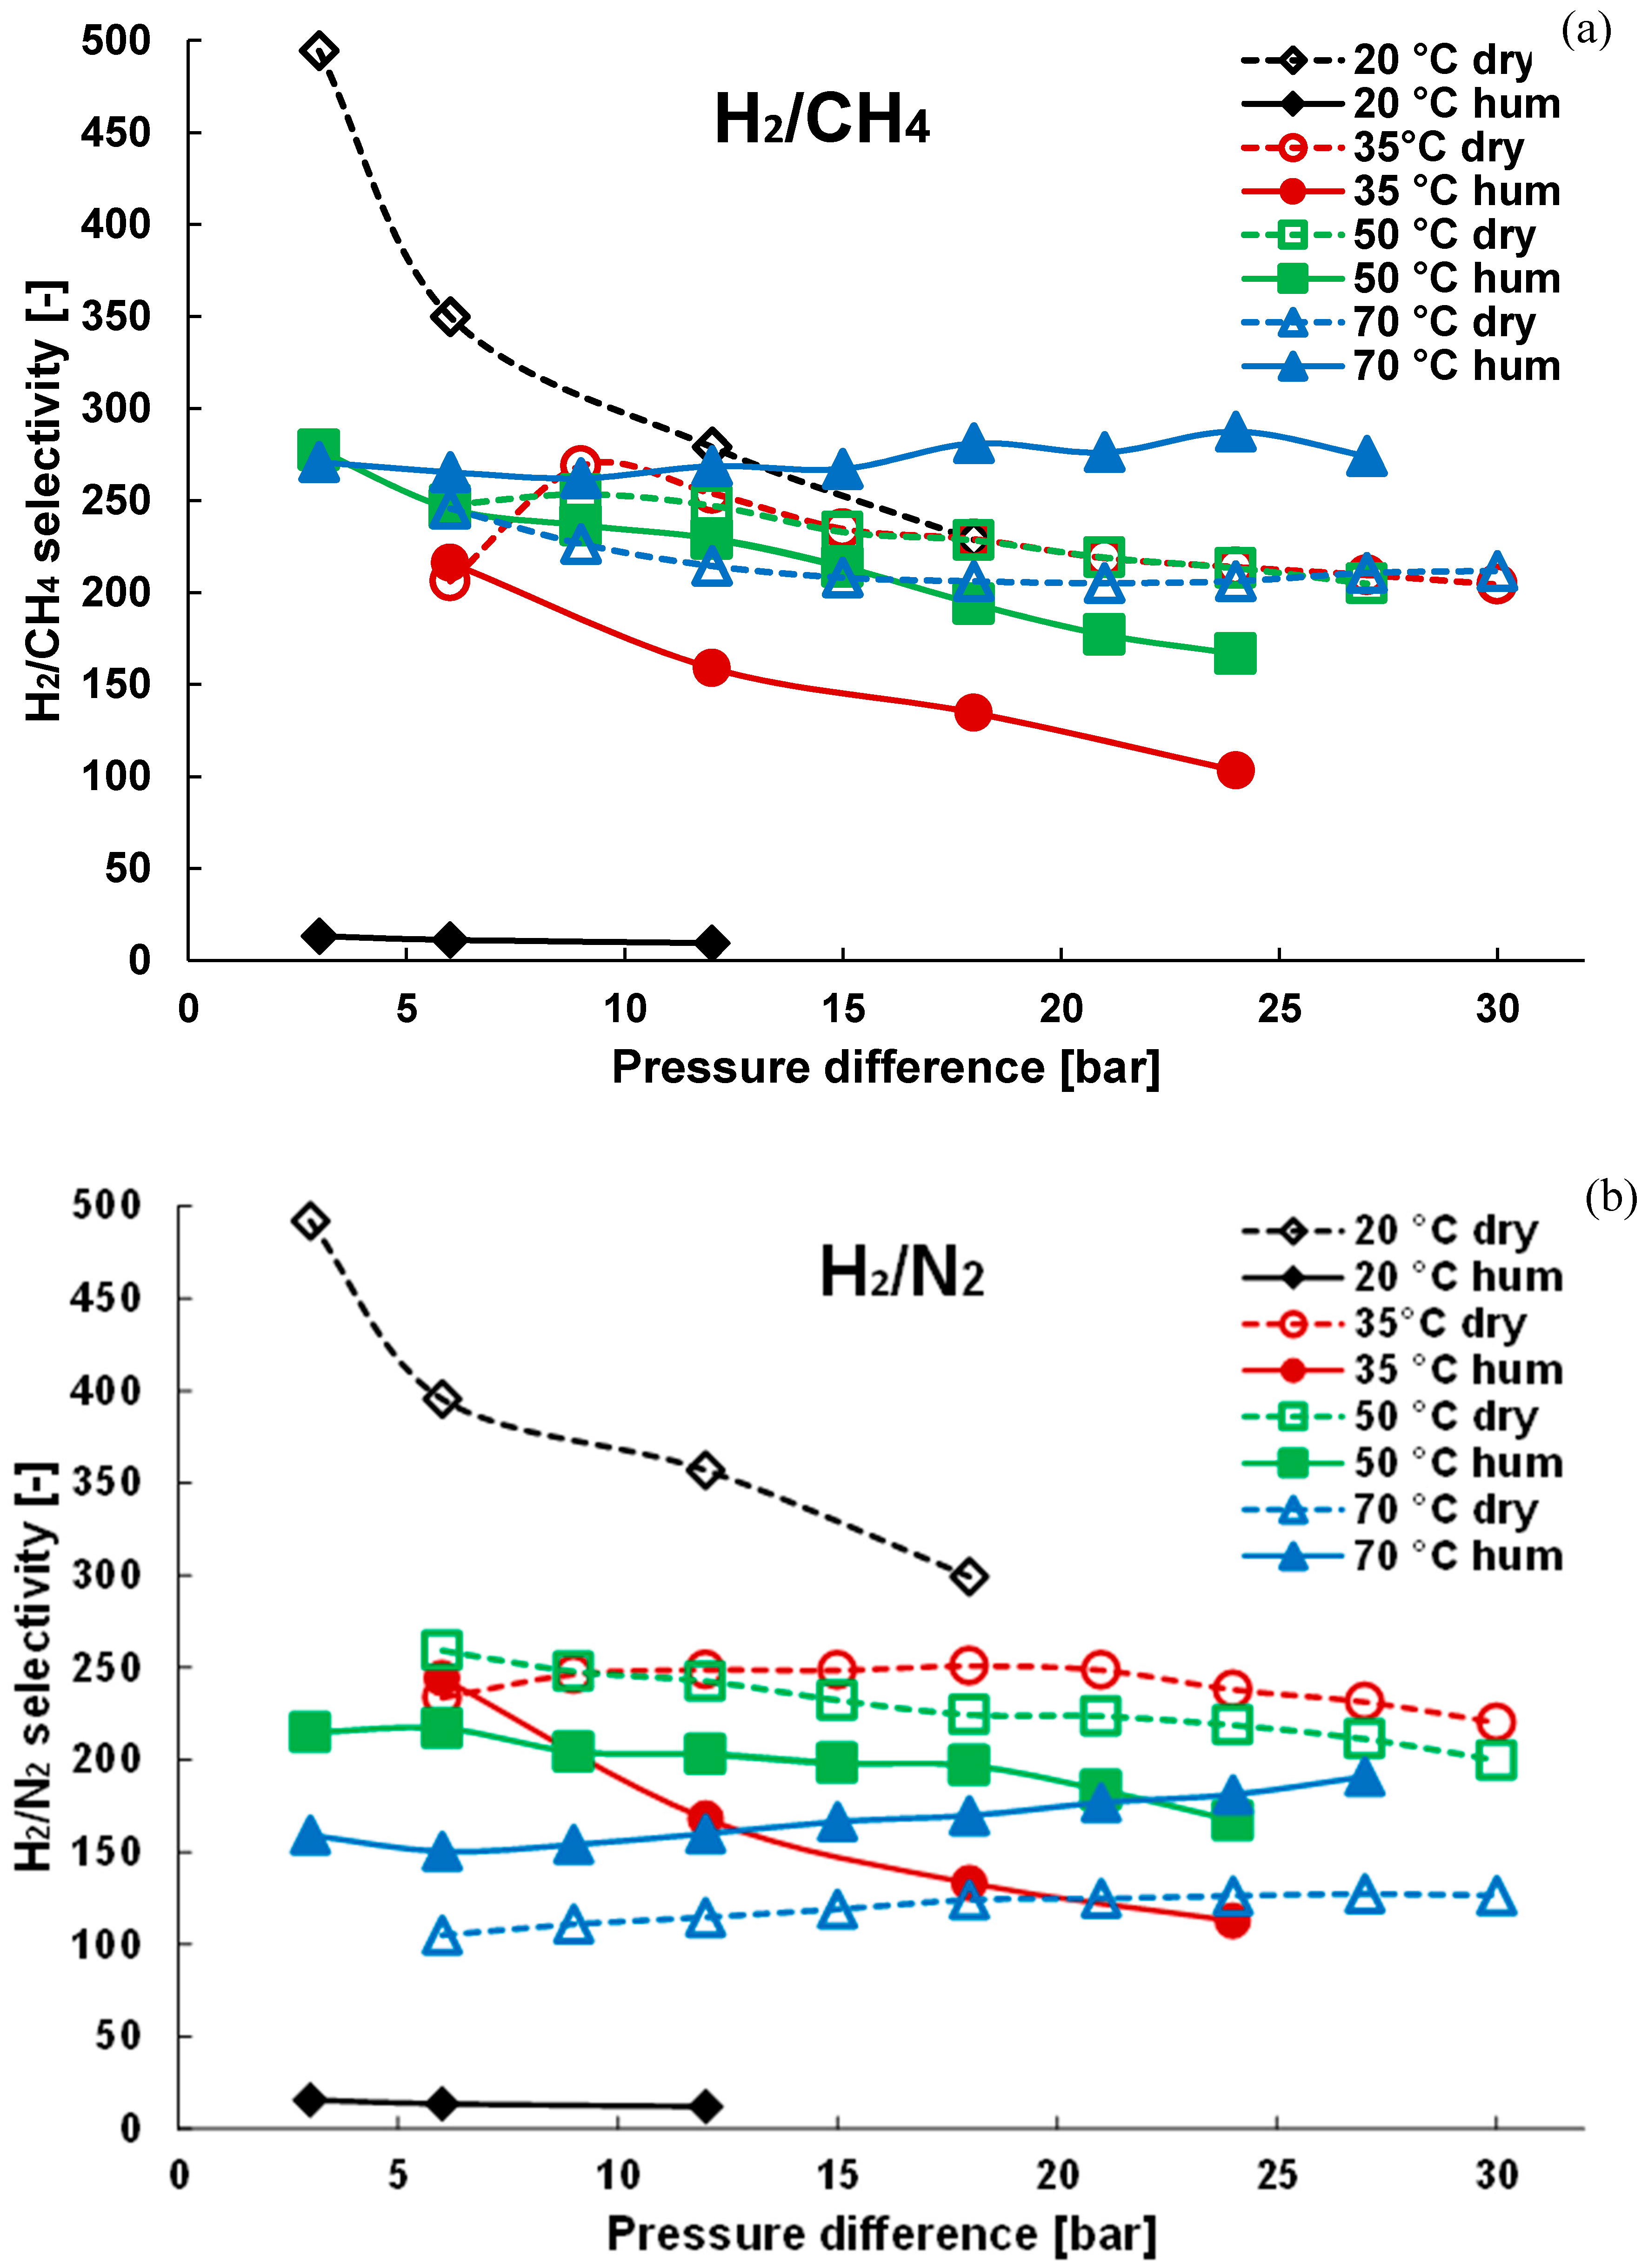
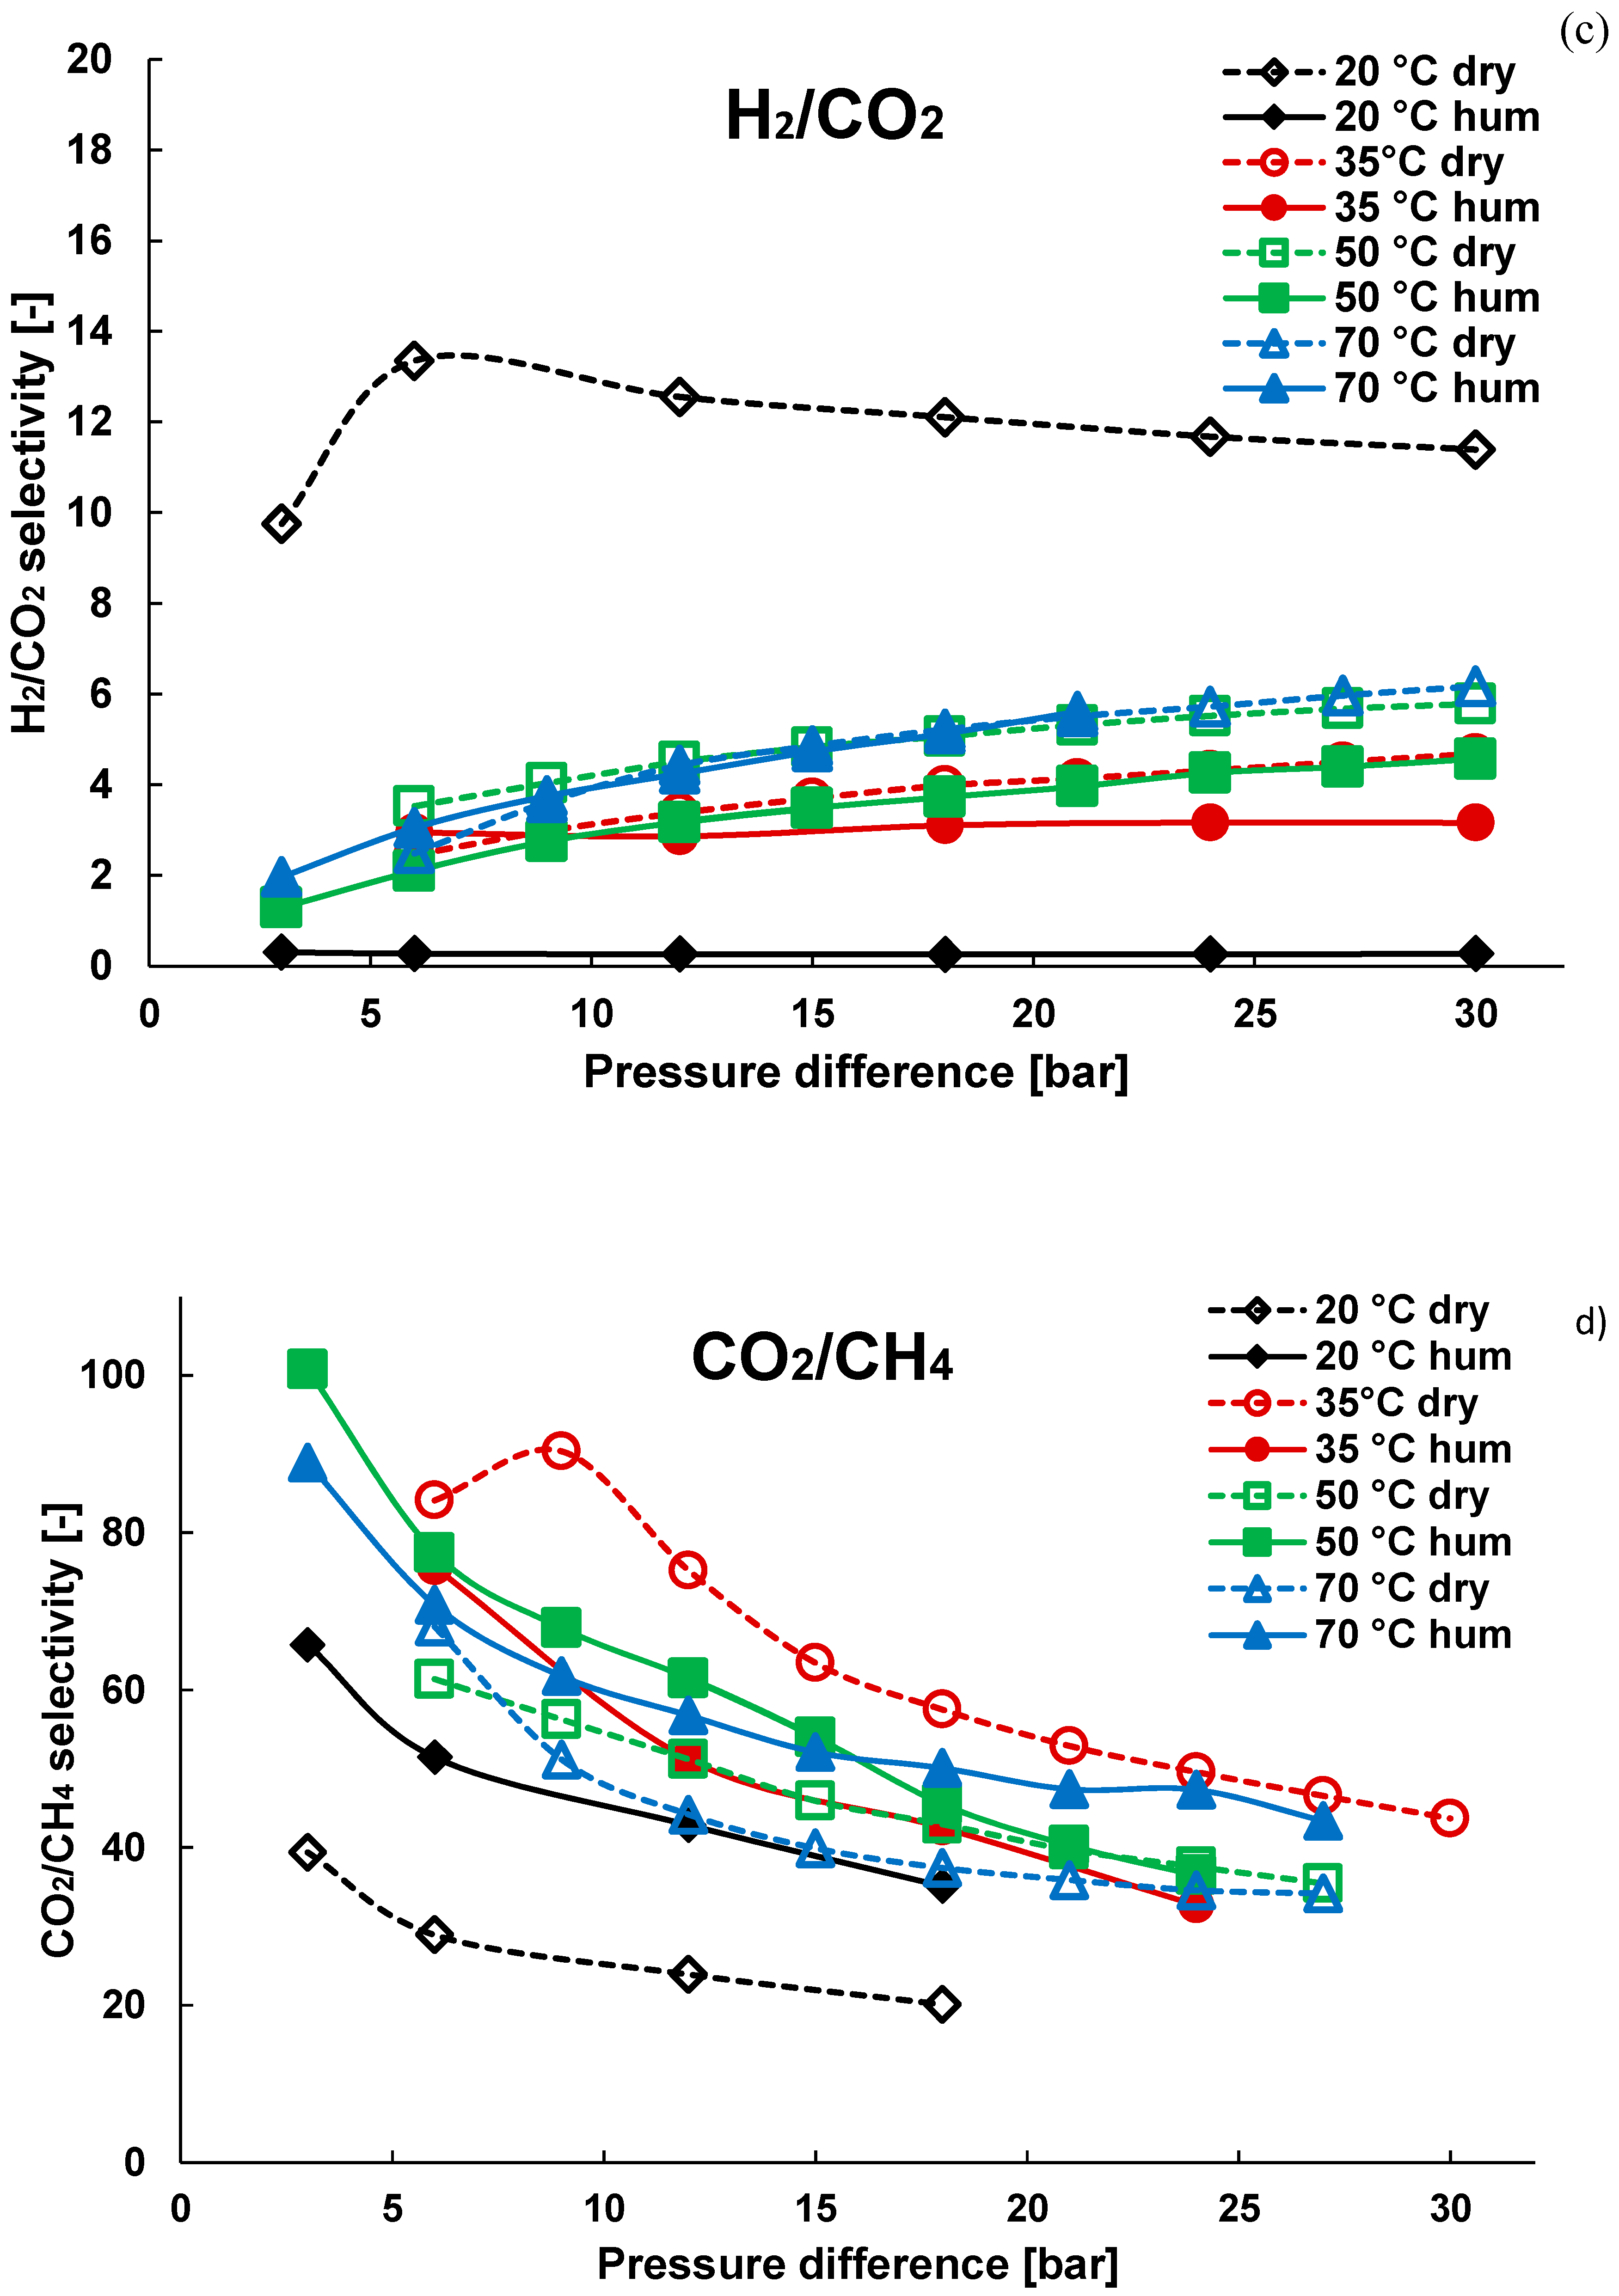
In Figure 8, the H2/N2, H2/CH4 and H2/CO2 selectivities are described as a function of the pressure difference across the membrane. The results show an extremely low selectivity in the case of humidified streams in contrast to the results for dry gases when working at low temperatures. The explanation is related to the transport mechanism for the considered molecules in the presence of humidified gas at very low temperatures (see also Appendix A). Indeed at 20 °C, when the gas is humidified, the membrane is fully saturated and pores are blocked, as revealed by the low hydrogen permeation compared to dry gas tests. When working with a humidified stream, permeation occurs through gas solubility and diffusion in the liquid phase. It is important to mention that the solubility of hydrogen is one order of magnitude lower than methane and nitrogen as described in Table 1. For this reason, at 20 °C the selectivity towards hydrogen is extremely low. On the other hand, at 20 °C in the presence of dry gas, the only water adsorbed on the surface is coming from the ambient humidity. The highest selectivity is observed at low temperatures, where the pores are partly filled with water coming from ambient humidity, which obstructs the bigger molecules, allowing mainly hydrogen to diffuse. The perm-selectivity of the proposed gases at different temperatures and pressures is based on a combination of different parameters such as kinetic diameters and gas solubility in water. When dry gas tests are considered, the perm-selectivity is almost inversely proportional to the temperature. Depending on the considered temperature and based on the kinetic diameter of the molecules, at lower temperature, thanks to the presence of water adsorbed on the membrane surface, hydrogen is more likely to permeate than other gases. When humidified gas tests are considered, the situation is more complex because based on the temperature and the amount of water adsorbed, hydrogen permeance is reduced due to low solubility in water until a specific temperature which allows mainly hydrogen to permeate but the adsorbed water is enough to avoid the contaminant gas to permeate. If this temperature raises, the selectivity drops because more water is removed from the pores.
This is demonstrated by the results for increased operating temperatures, where part of the moisture is removed, thus increasing the apparent pore size, which results in a decrease in the selectivity. In the presence of CO2 and CH4, with dry gas, the selectivity slightly decreases at higher pressures and low temperatures due to the higher adsorption of these gases on the membrane surface. This behaviour is not observed for nitrogen due to the extremely low adsorption capacity for this molecule. For humidified streams, the selectivities towards hydrogen are very low for all the cases carried out at 20 °C and, in fact, at those conditions the membrane is even more selective for CO2 than H2. This is, as previously discussed, related to the water blocking the membrane pores as these conditions. A remarkable case is the CO2/CH4 selectivity at low temperatures, which is very high as CO2 is smaller and has a higher adsorption capacity than methane. For the H2/N2 pair, the selectivity for the humidified membrane is higher at 50 °C than at 70 °C and, in both cases, it increases with the pressure, as there is a higher extent of interaction of H2 with the pore walls.
At 50 and 70 °C, the hydrated gas has a positive effect on the hydrogen selectivity, as the water adsorbed in the pores reduces the effective pore size and restricts the permeation of bigger gas components, allowing the passage of the much smaller H2; at these temperatures, the H2 selectivity of the humid gas is higher than the dry gas.

3.2. Mixture Tests with Dry Gas

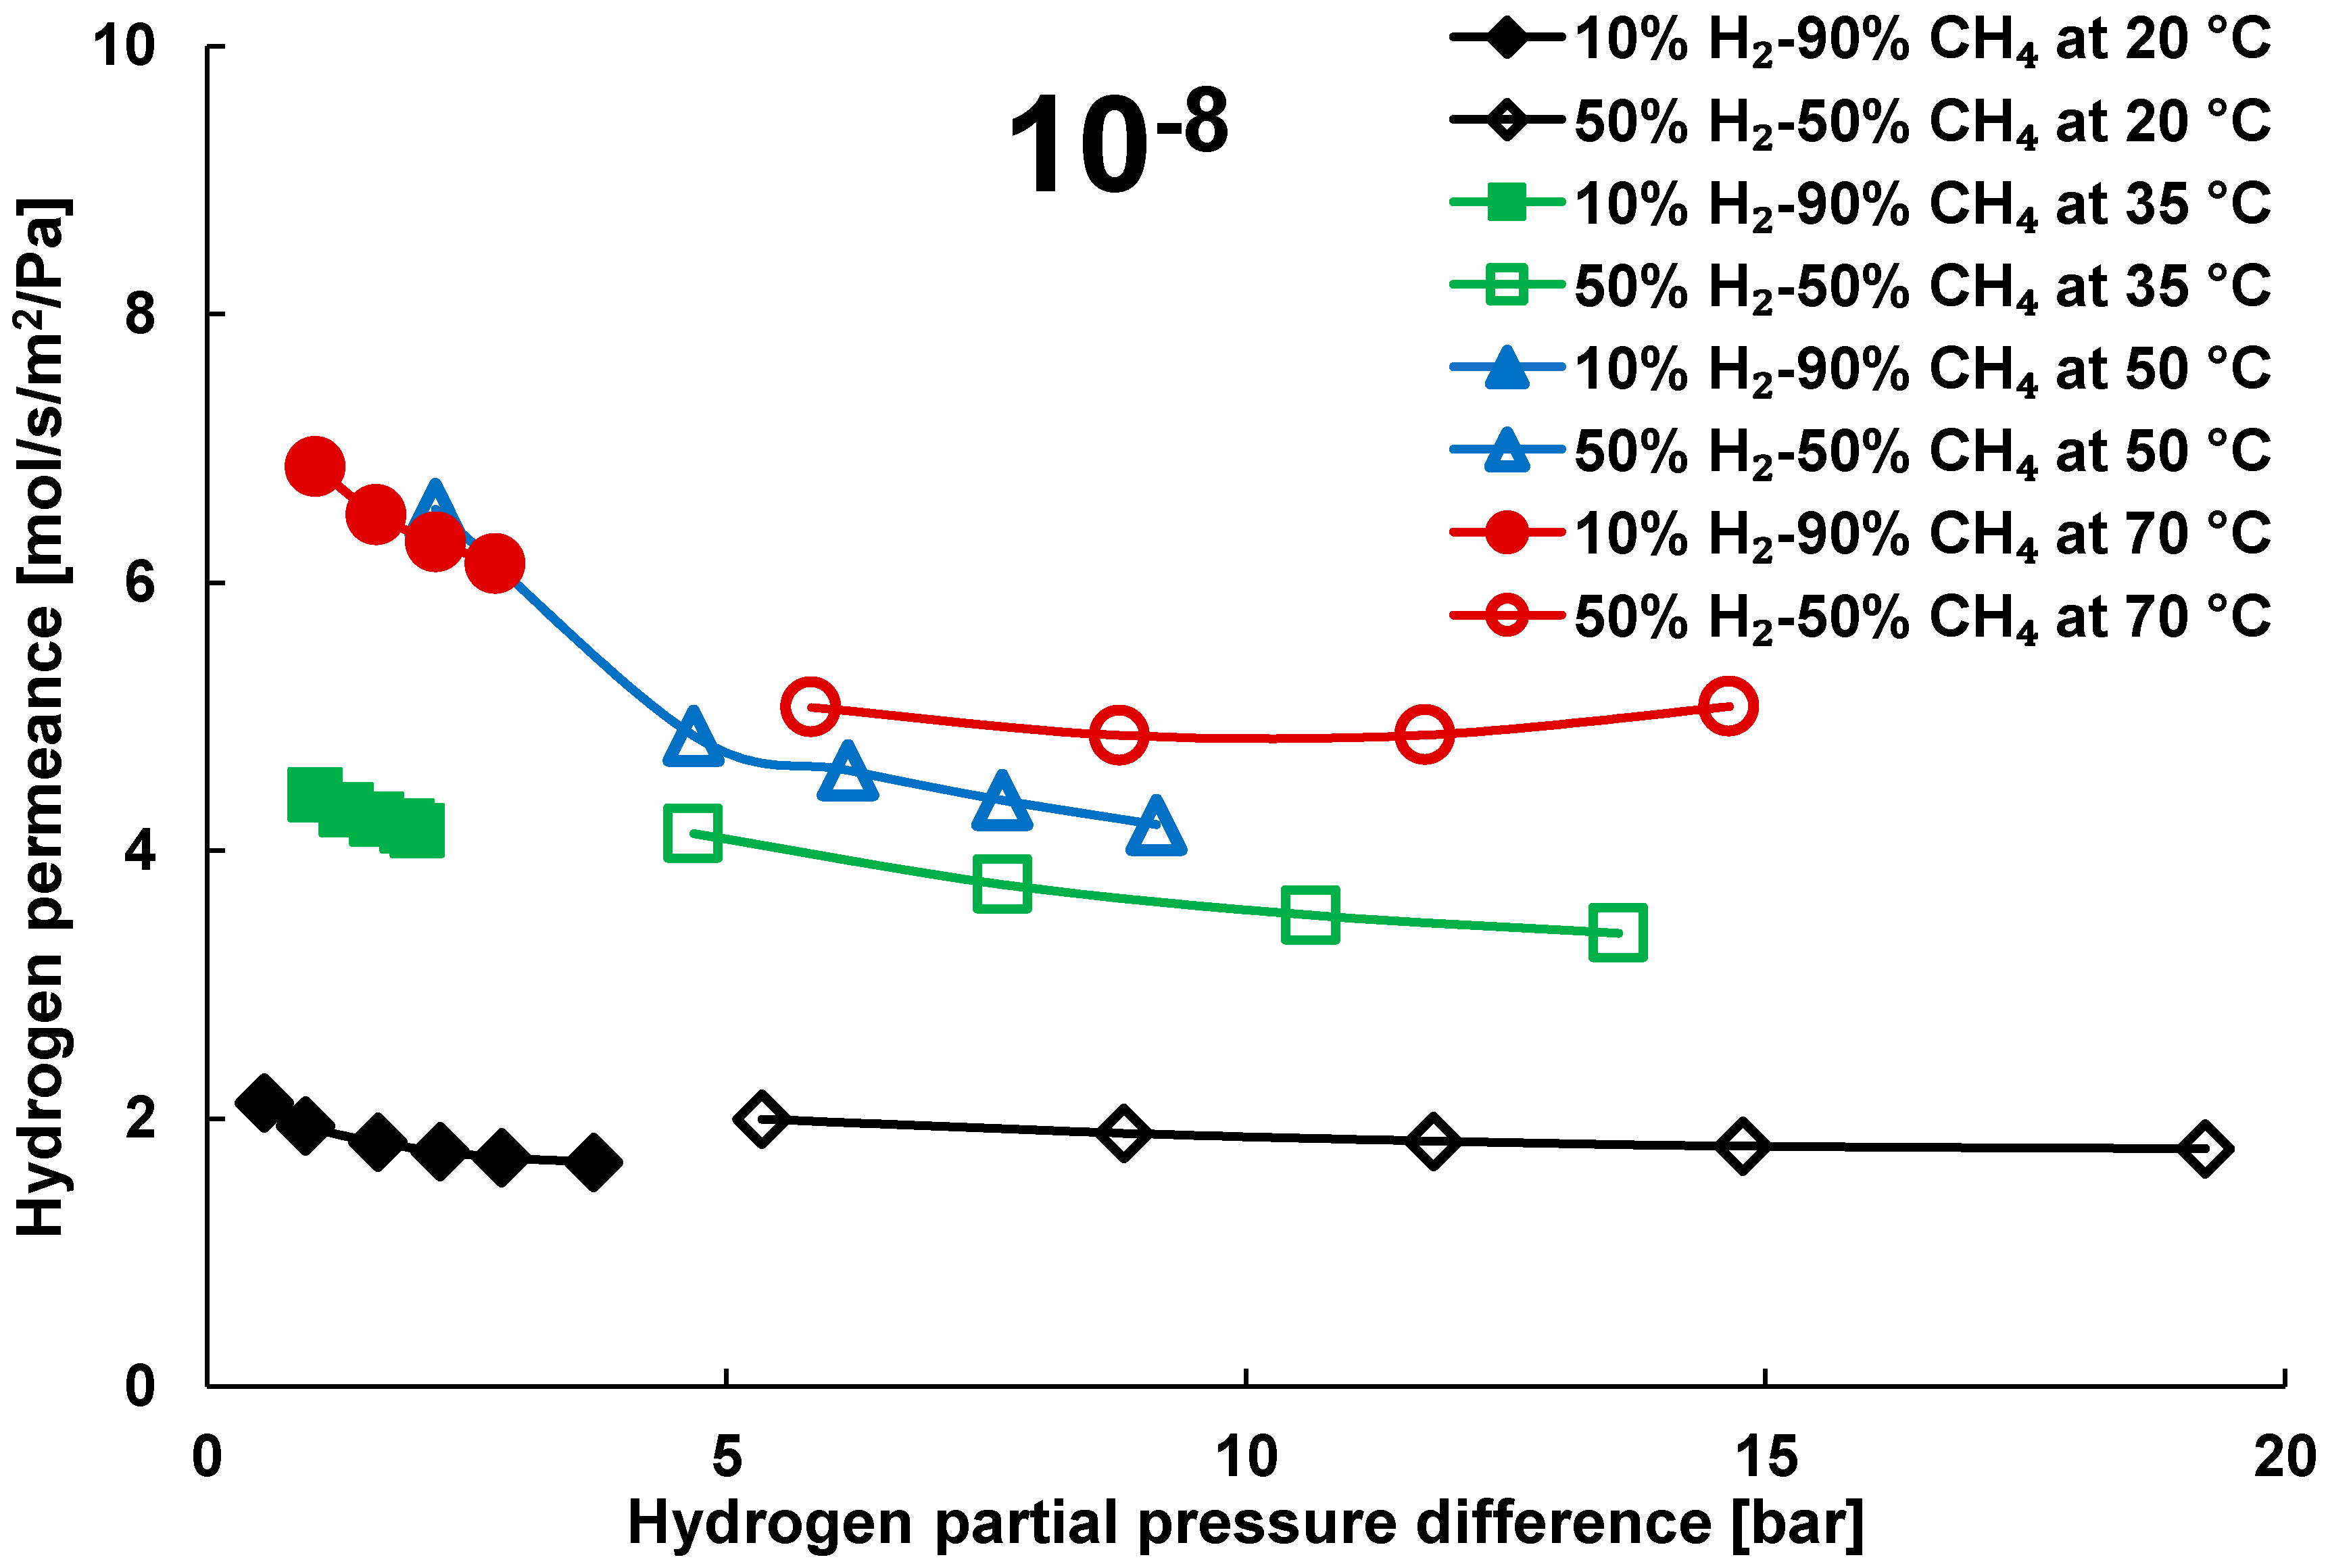
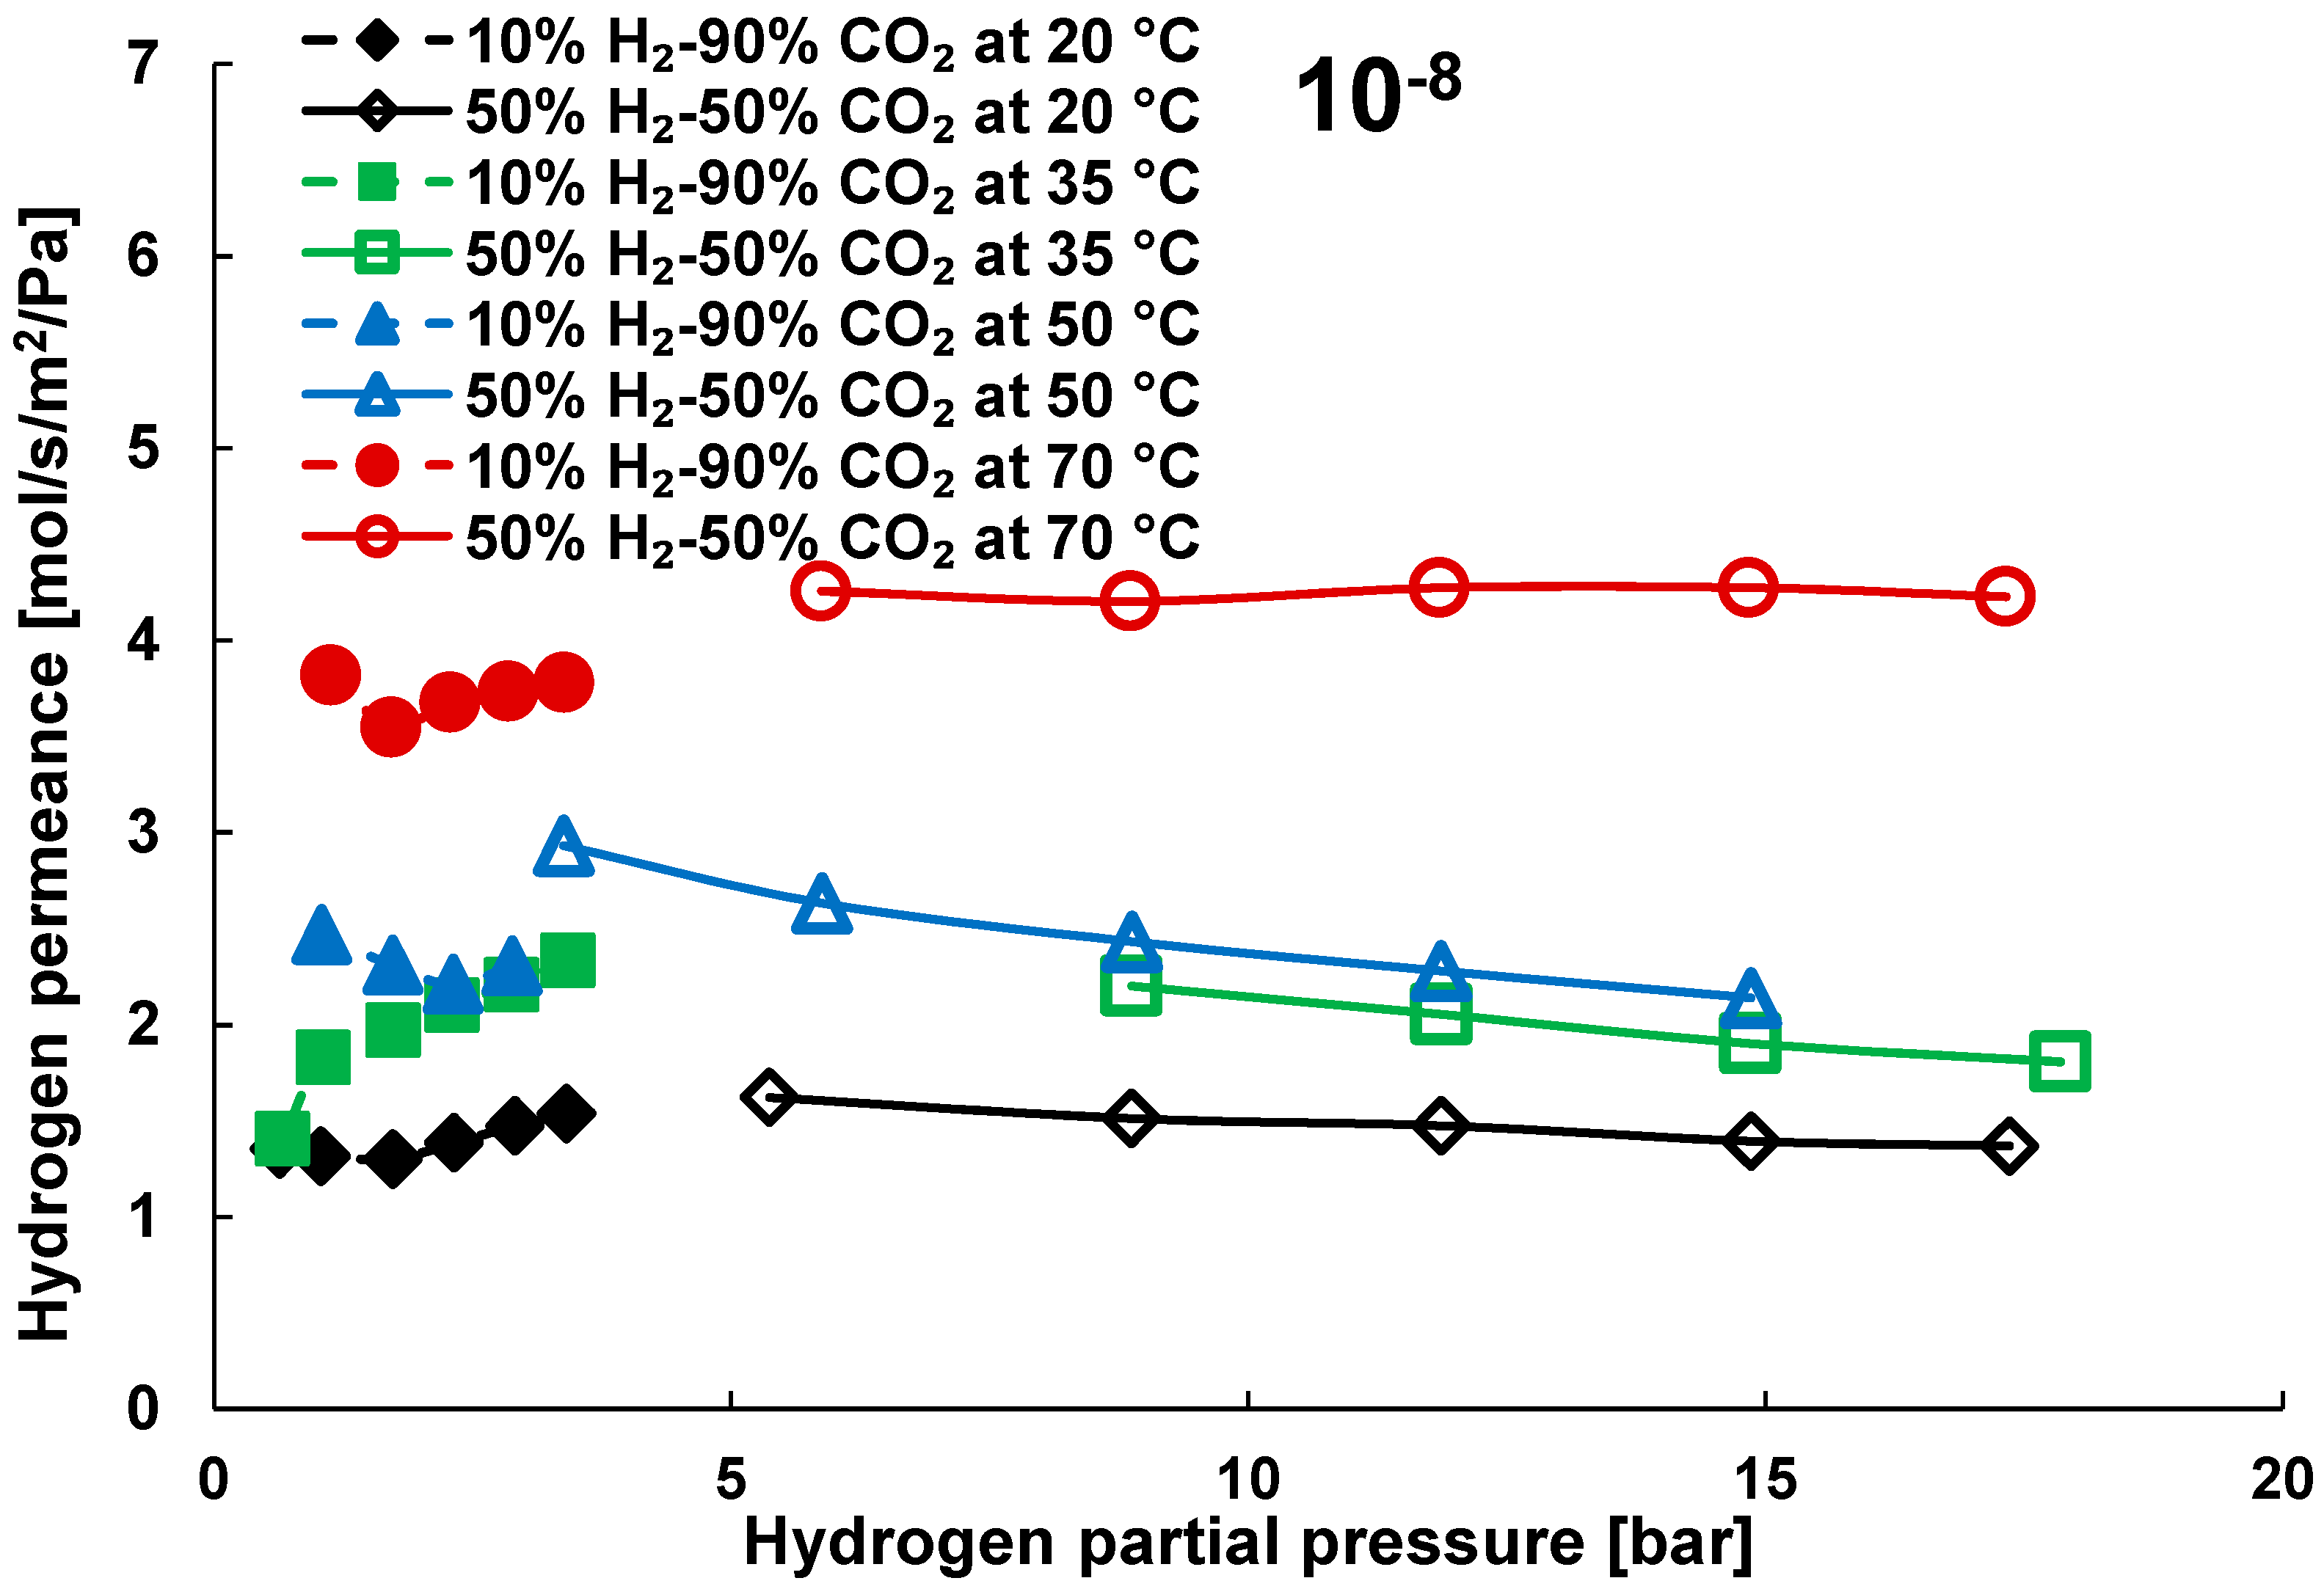
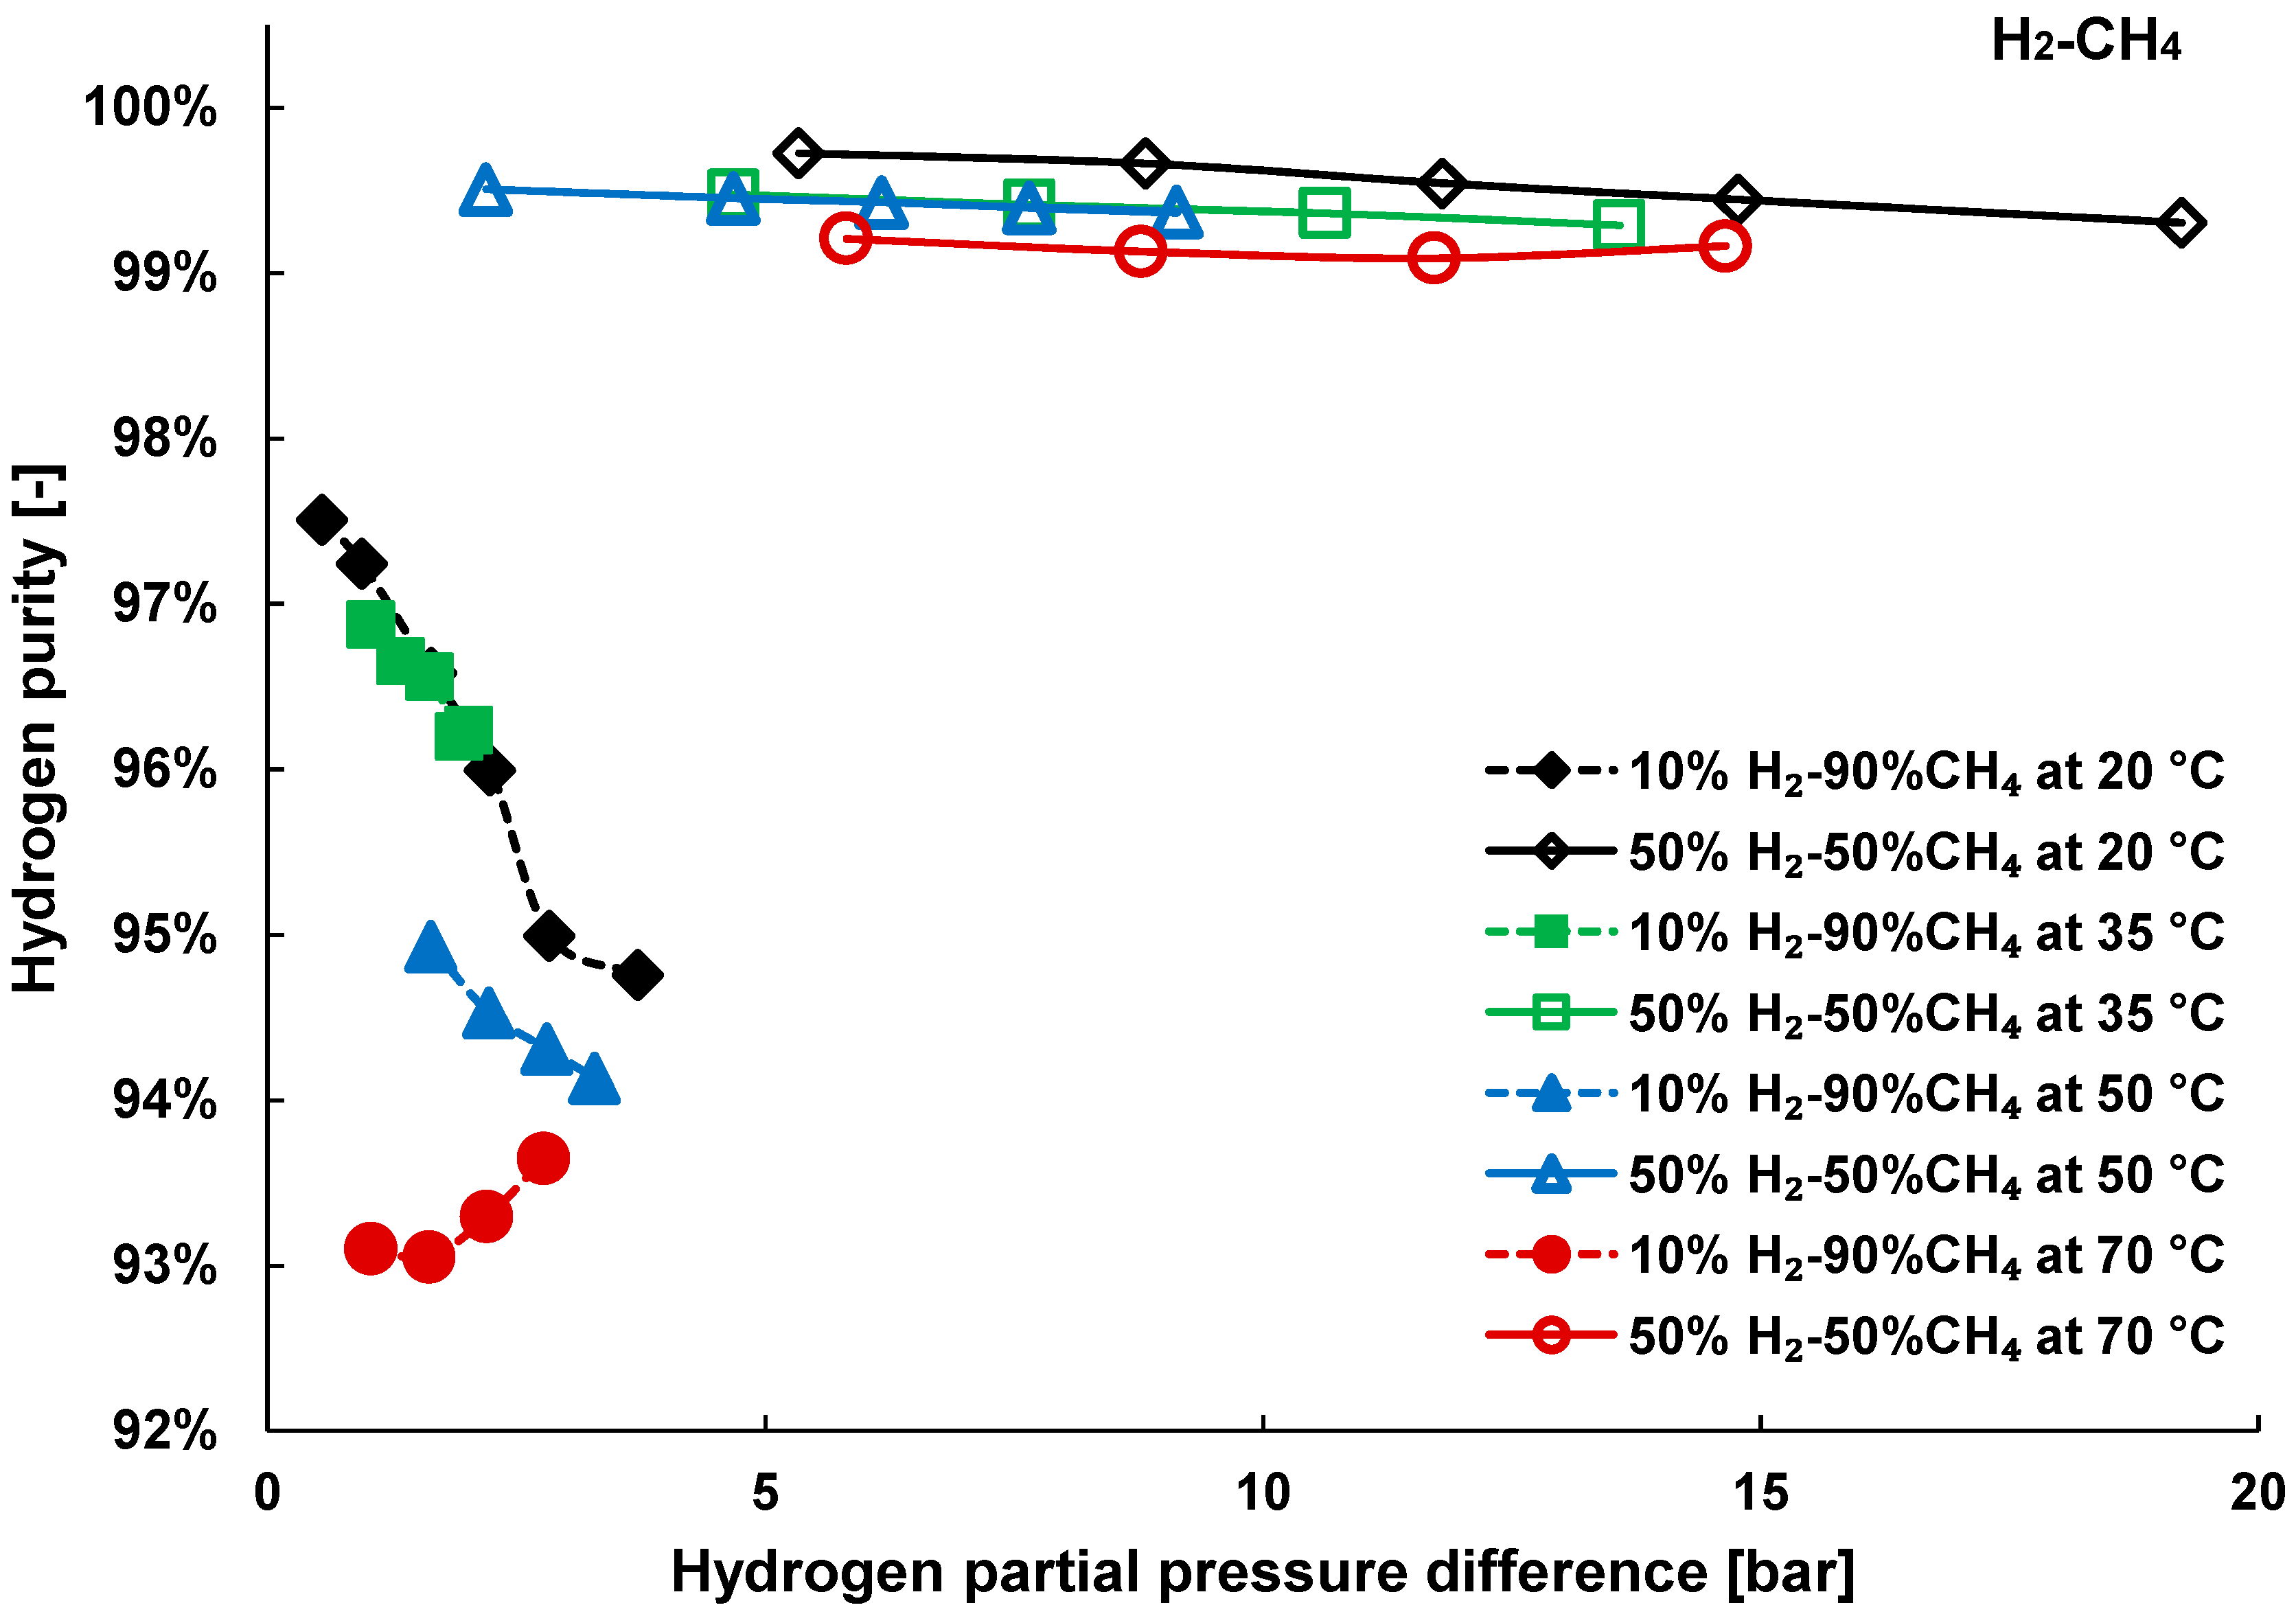
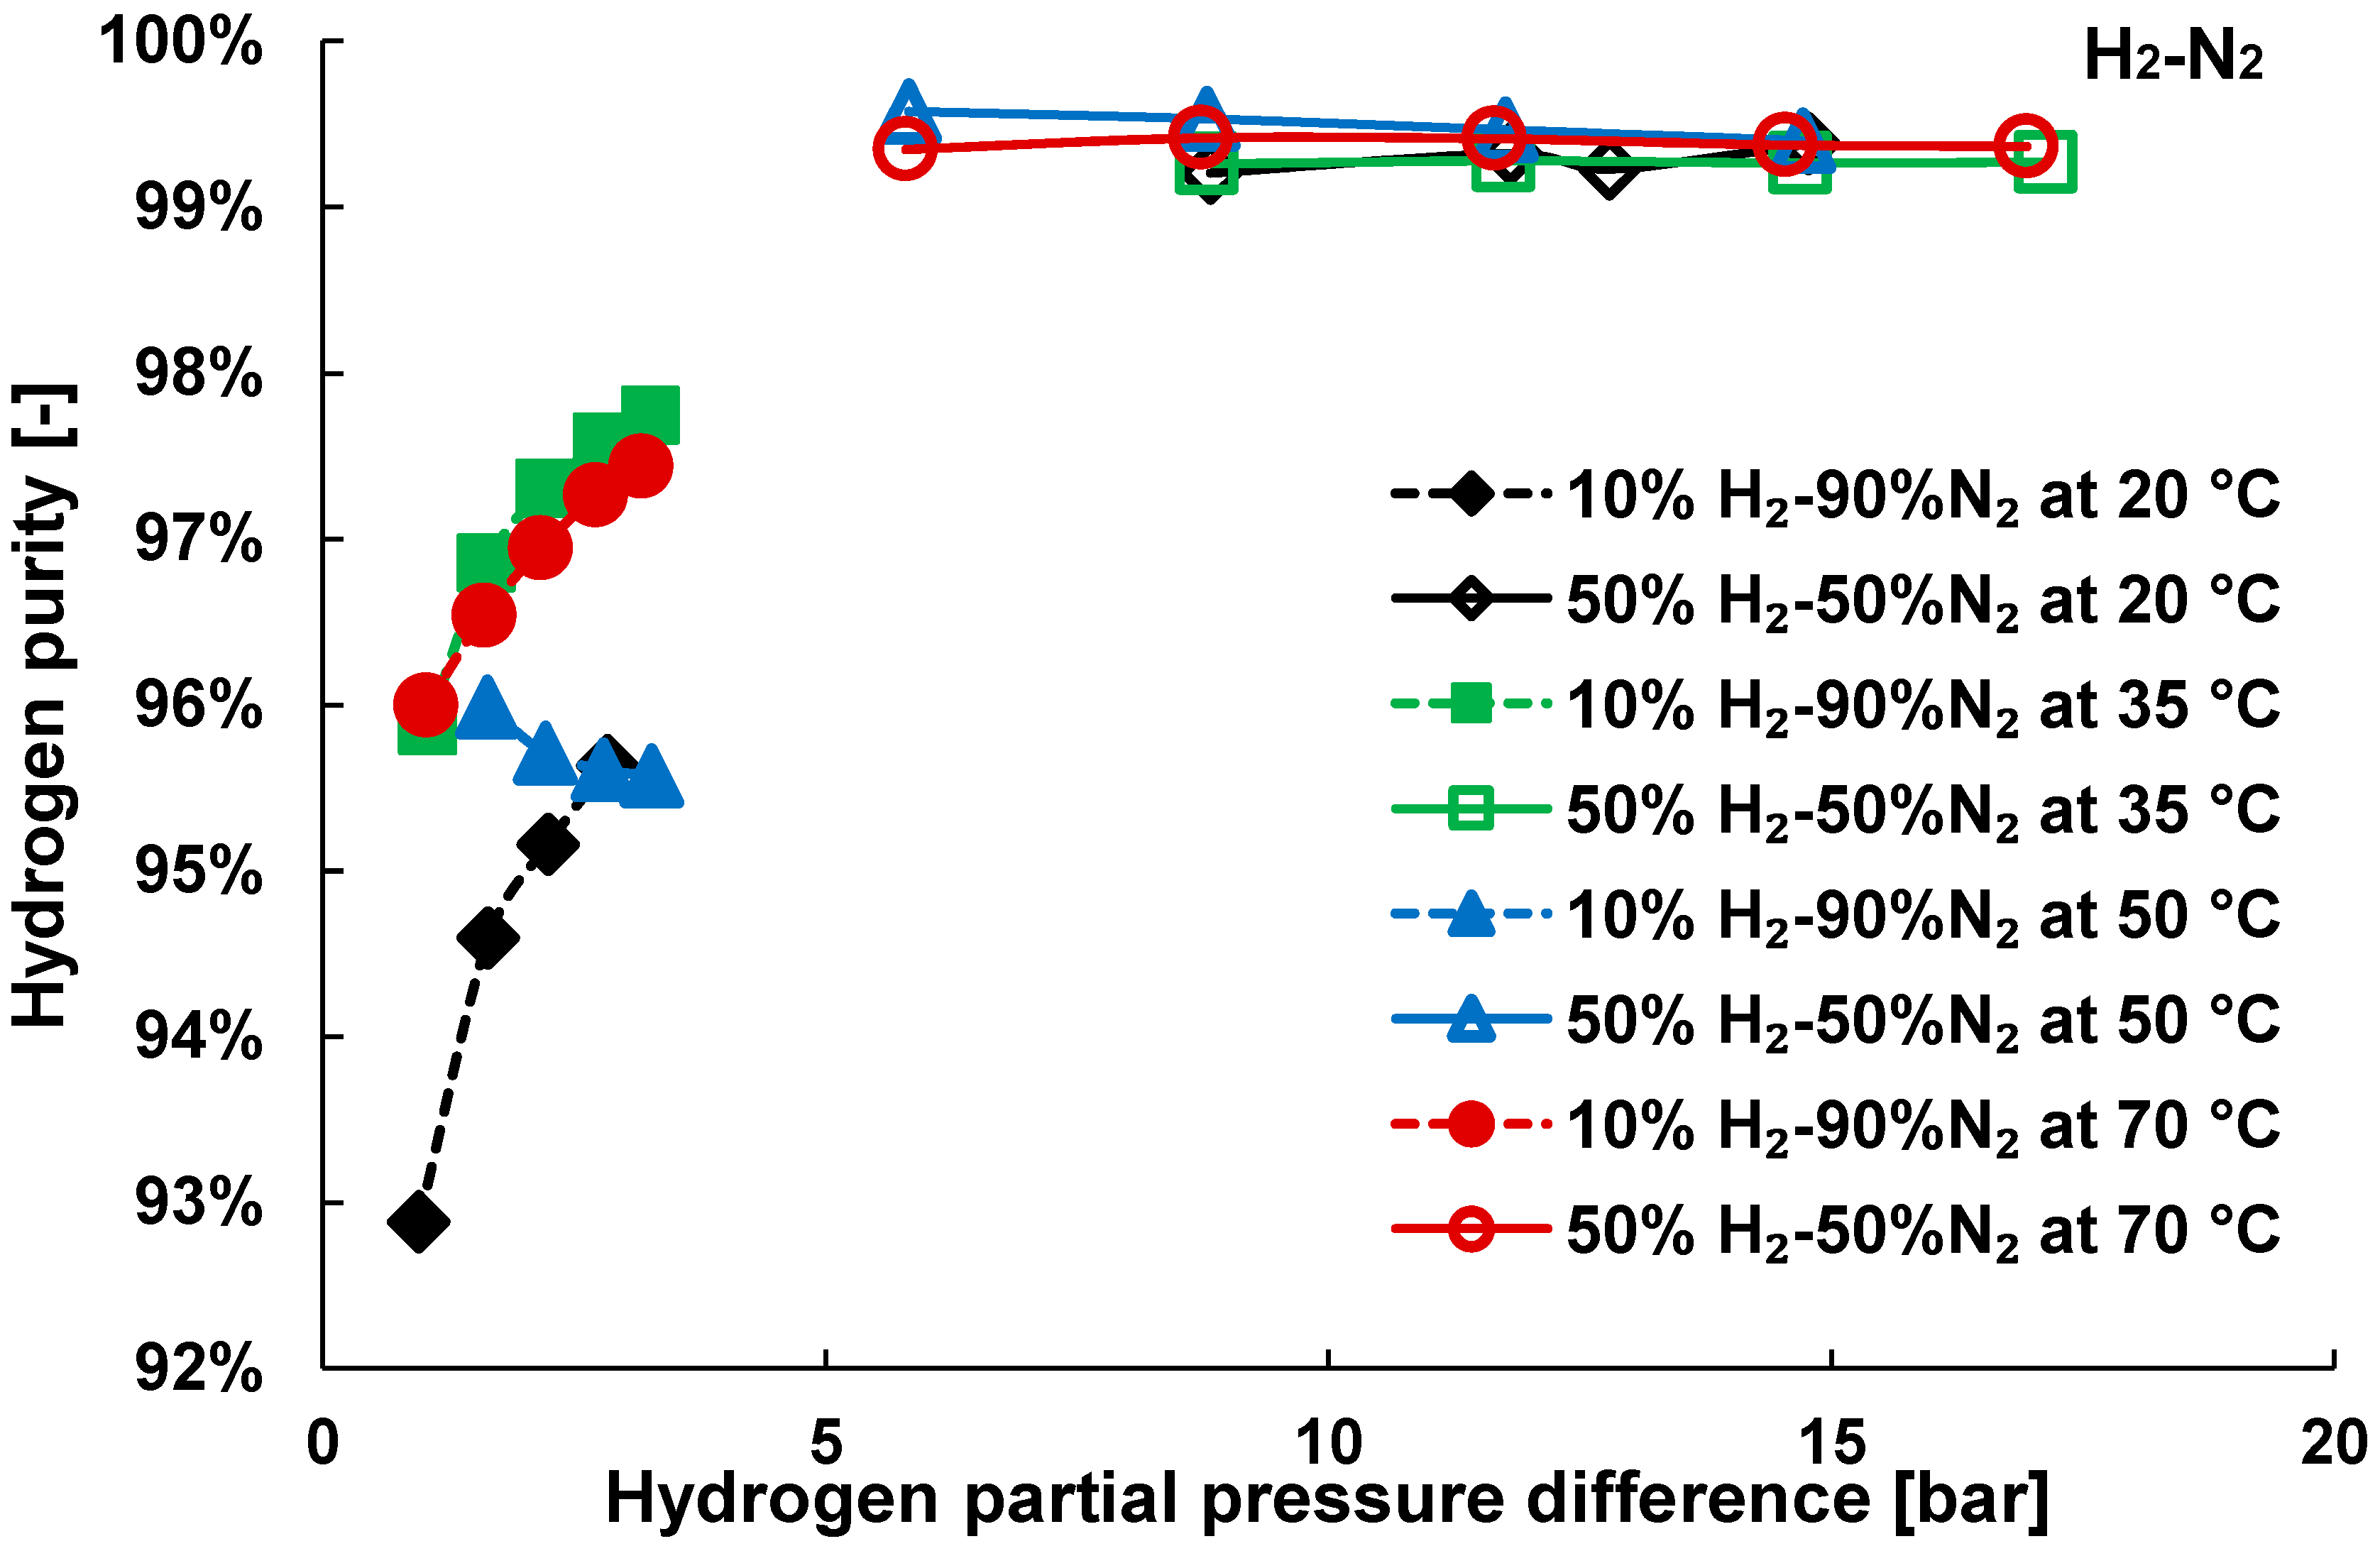
After the single gas measurements, gas mixture tests with H2-CH4, H2-CO2 and H2-N2 at different temperatures, pressures and hydrogen concentrations were performed for a proper understanding of the membrane performance in terms of flow rate and purity. For these tests the membrane CMSM-550 has been used. The results of hydrogen permeance as a function of the hydrogen partial pressure in the feed (10 and 50% vol.) mixed with different gases and at various temperatures are shown in Figure 9, Figure 10 and Figure 11, respectively. From the results it can be observed that the hydrogen permeance increases with temperature and that for hydrogen mixtures with CH4 and N2, at the same partial pressure difference, no relevant deviation in the trend between 10% and 50% H2 is observed, indicating that there is no mass transfer limitation affecting the permeation through the membrane. This is an advantage when compared to Pd-based membranes, where mass transfer resistances, commonly referred to as concentration polarization, limit the separation performance of the membrane [24,25,26,27,28]. Only in the case of the mixture with CO2 a small deviation is observed at different partial pressures, which can be associated with the adsorption of CO2 in the pores, which in turn depends on the CO2 partial pressure in the system. It is worth noting that the hydrogen permeance for the H2-N2 mixture is higher compared to the other mixtures (especially CO2), which is intimately related to the adsorption of these gases on the membrane layer, reducing the available pore sizes for hydrogen to diffuse through. For the H2/CH4 mixture, according to the results presented in Figure 12, the hydrogen purity is decreased with an increase in the operating temperature as a consequence of the water removal from the pores, which increases the apparent pore size of the membrane. It is important to underline that at low temperatures, thanks to the presence of water adsorbed on the pores (from the atmosphere), the obtained hydrogen purity is remarkably high even with 10% H2 content in the mixture. For H2/CO2, since the latter is strongly adsorbed in the pores, a sharp decrease in the hydrogen purity was observed.
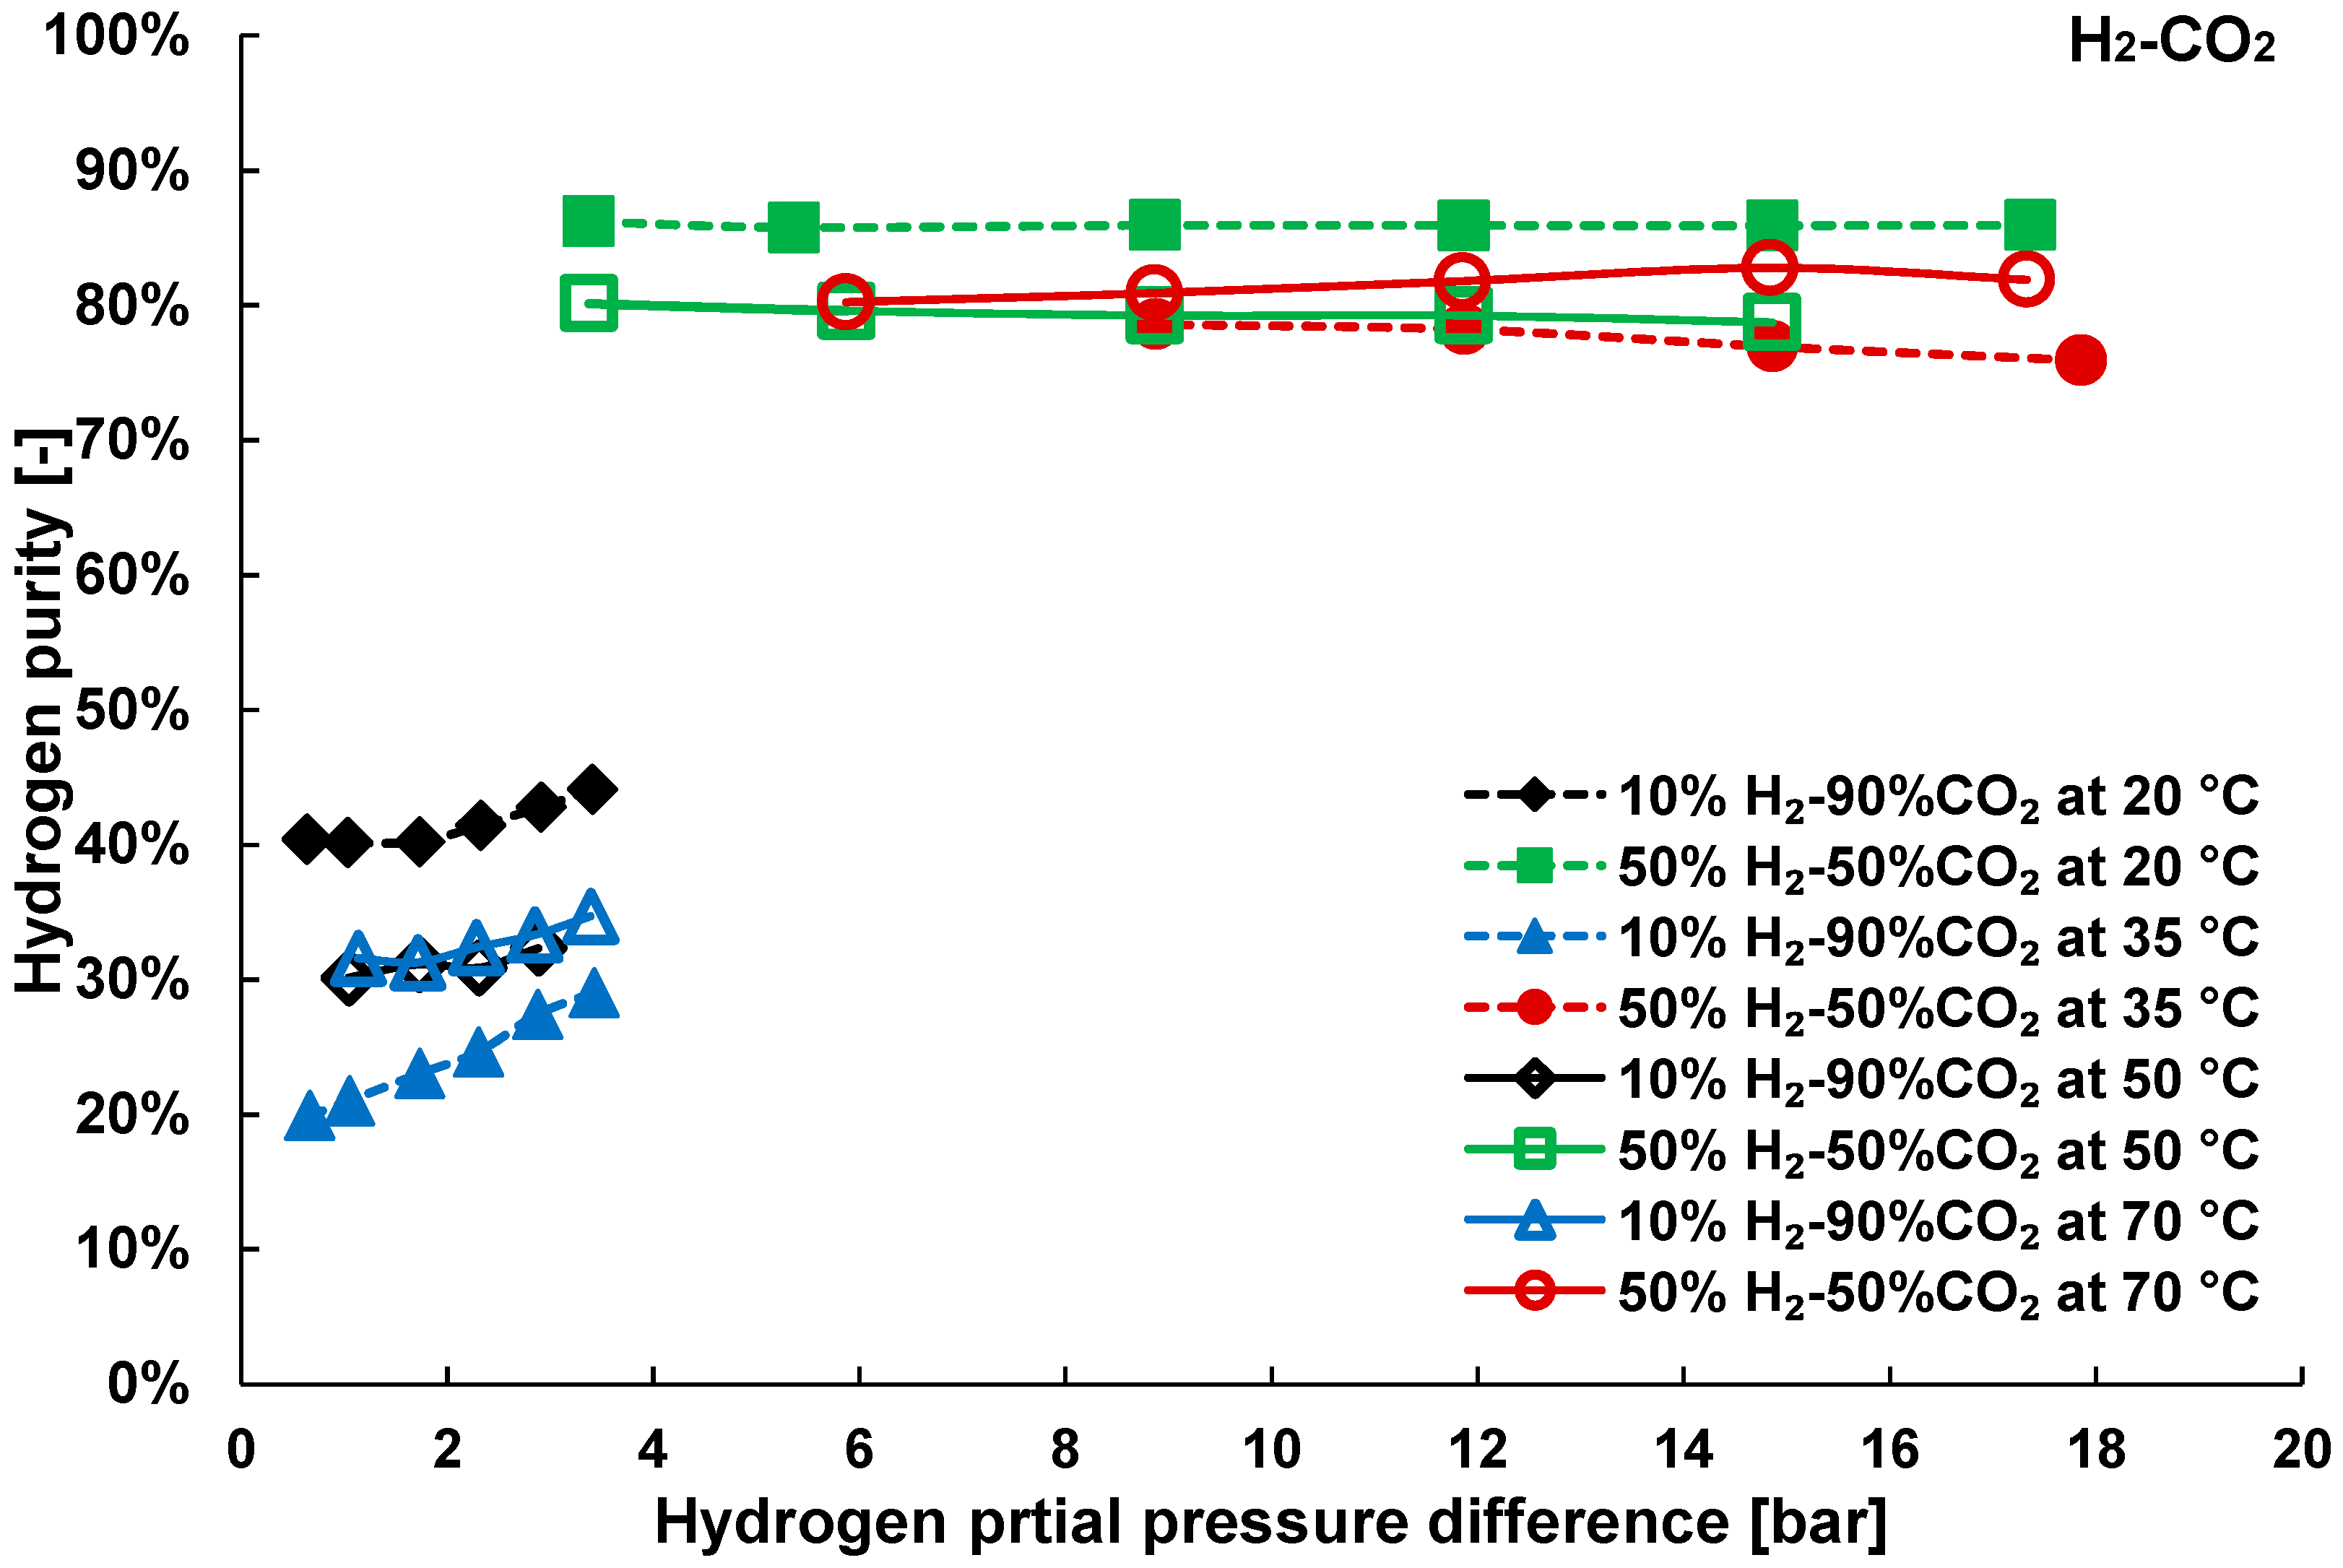
The H2 purity in the mixture with CO2 is higher at lower temperatures, where the water adsorbed in the membrane pores reduces the permeation of CO2 and still allows the permeation of the smaller gas (H2). As shown in Figure 13, a trade-off between the adsorption capacity and the excellent solubility of CO2 in water is evidently affecting the purity trend with temperature, where the lowest and the highest temperatures investigated yield the best hydrogen purities in contrast to intermediate temperatures. Nevertheless, when looking at the hydrogen purity in the presence of CO2, this is remarkably lower compared to N2 and CH4 due to the contribution of adsorption and solubility in the transport mechanism of CO2 through the pores.
In Figure 11 and Figure 14, the H2-N2 results in terms of hydrogen permeance and purity are depicted at different partial pressures. When the membrane is saturated with water, a high hydrogen purity is reached for all the considered mixtures. These results (obtained with H2/N2, H2/CH4 and H2/CO2) are expected for gases with a remarkable difference in molecular size or extremely distinct adsorption capacity. Therefore, a similar behaviour might be anticipated for gas mixtures such as CO2/CH4 or CO2/N2, which can also find application in biogas upgrading or post-combustion technologies.
Hydrogen recovery factor (HRF) defined as ratio between the hydrogen permeated and inlet hydrogen in the retentate side, is an important parameter for describing the separation performance. For 10% H2–90% N2, the highest HRF was 22.67%, achieved at 40 bar and 70 °C. While considering 50% H2–50% N2, the maximum HRF achieved in the same operating conditions was 19.47%.
When considering CMSM for hybrid separation technology application in which the main objective is the separation and purification from an initial mixture of 10% H2–90% CH4, it is possible to achieve a final purity of 93% which would easily allow a further purification from the other technologies integrated in the hybrid system.

3.3. Mixture Tests with Membrane Pre-Treated with Water Vapour

To demonstrate the real water adsorption effect on the membrane performance, in terms of hydrogen permeability and purity, different mixture tests have also been performed in the presence and absence of water in the pores. For these experiments membrane CMSM-600 was selected and the H2/CH4 mixture is investigated. The membrane, once installed in the experimental set-up, has first been heated to 150 °C under N2 and left at these conditions for 5 h, to desorb any humidity taken by the membrane when left exposed to ambient conditions. Afterwards, the membrane was cooled till 100 °C and mixture tests at dry conditions (both membrane and gas) were performed. Successively, the same tests were carried out after humidifying the membrane with the gas stream saturated with water for 15 h at the same temperature (100 °C). The same procedure was subsequently applied for all the other measurements carried out at different temperatures (70, 50 and 20 °C), wherein between the water present in the pores is desorbed at 150 °C following the same procedure as previously described.
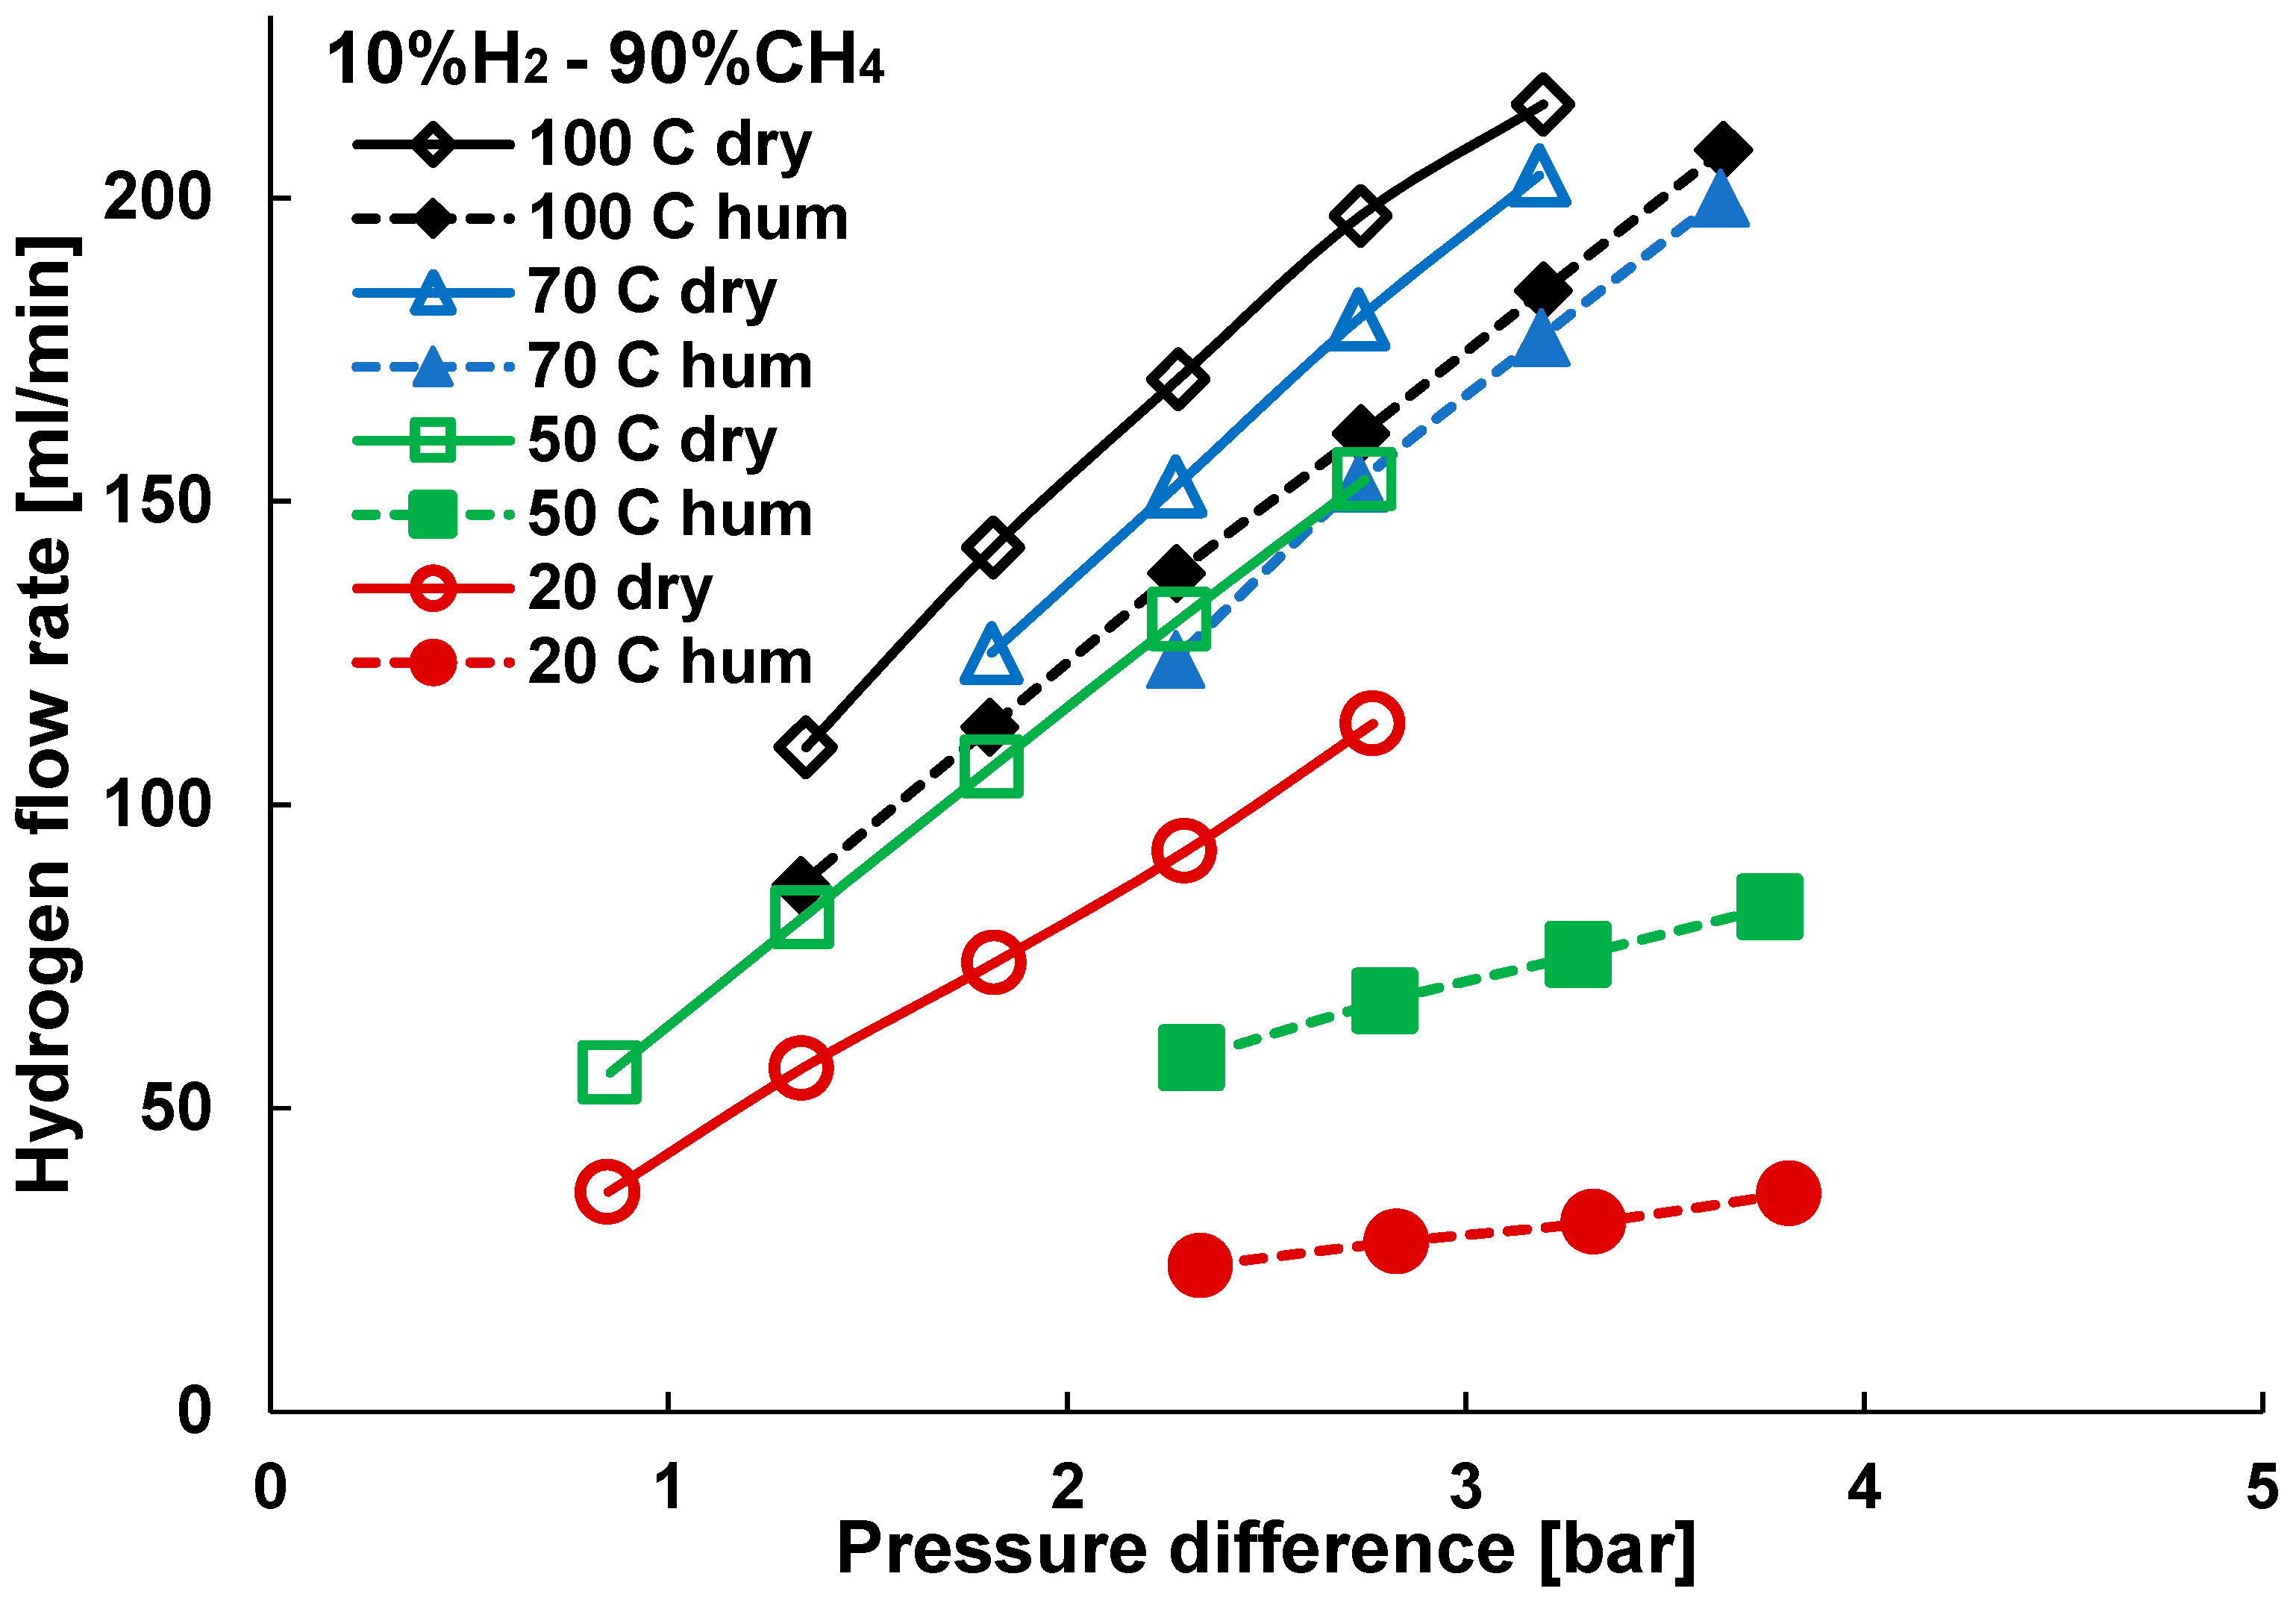
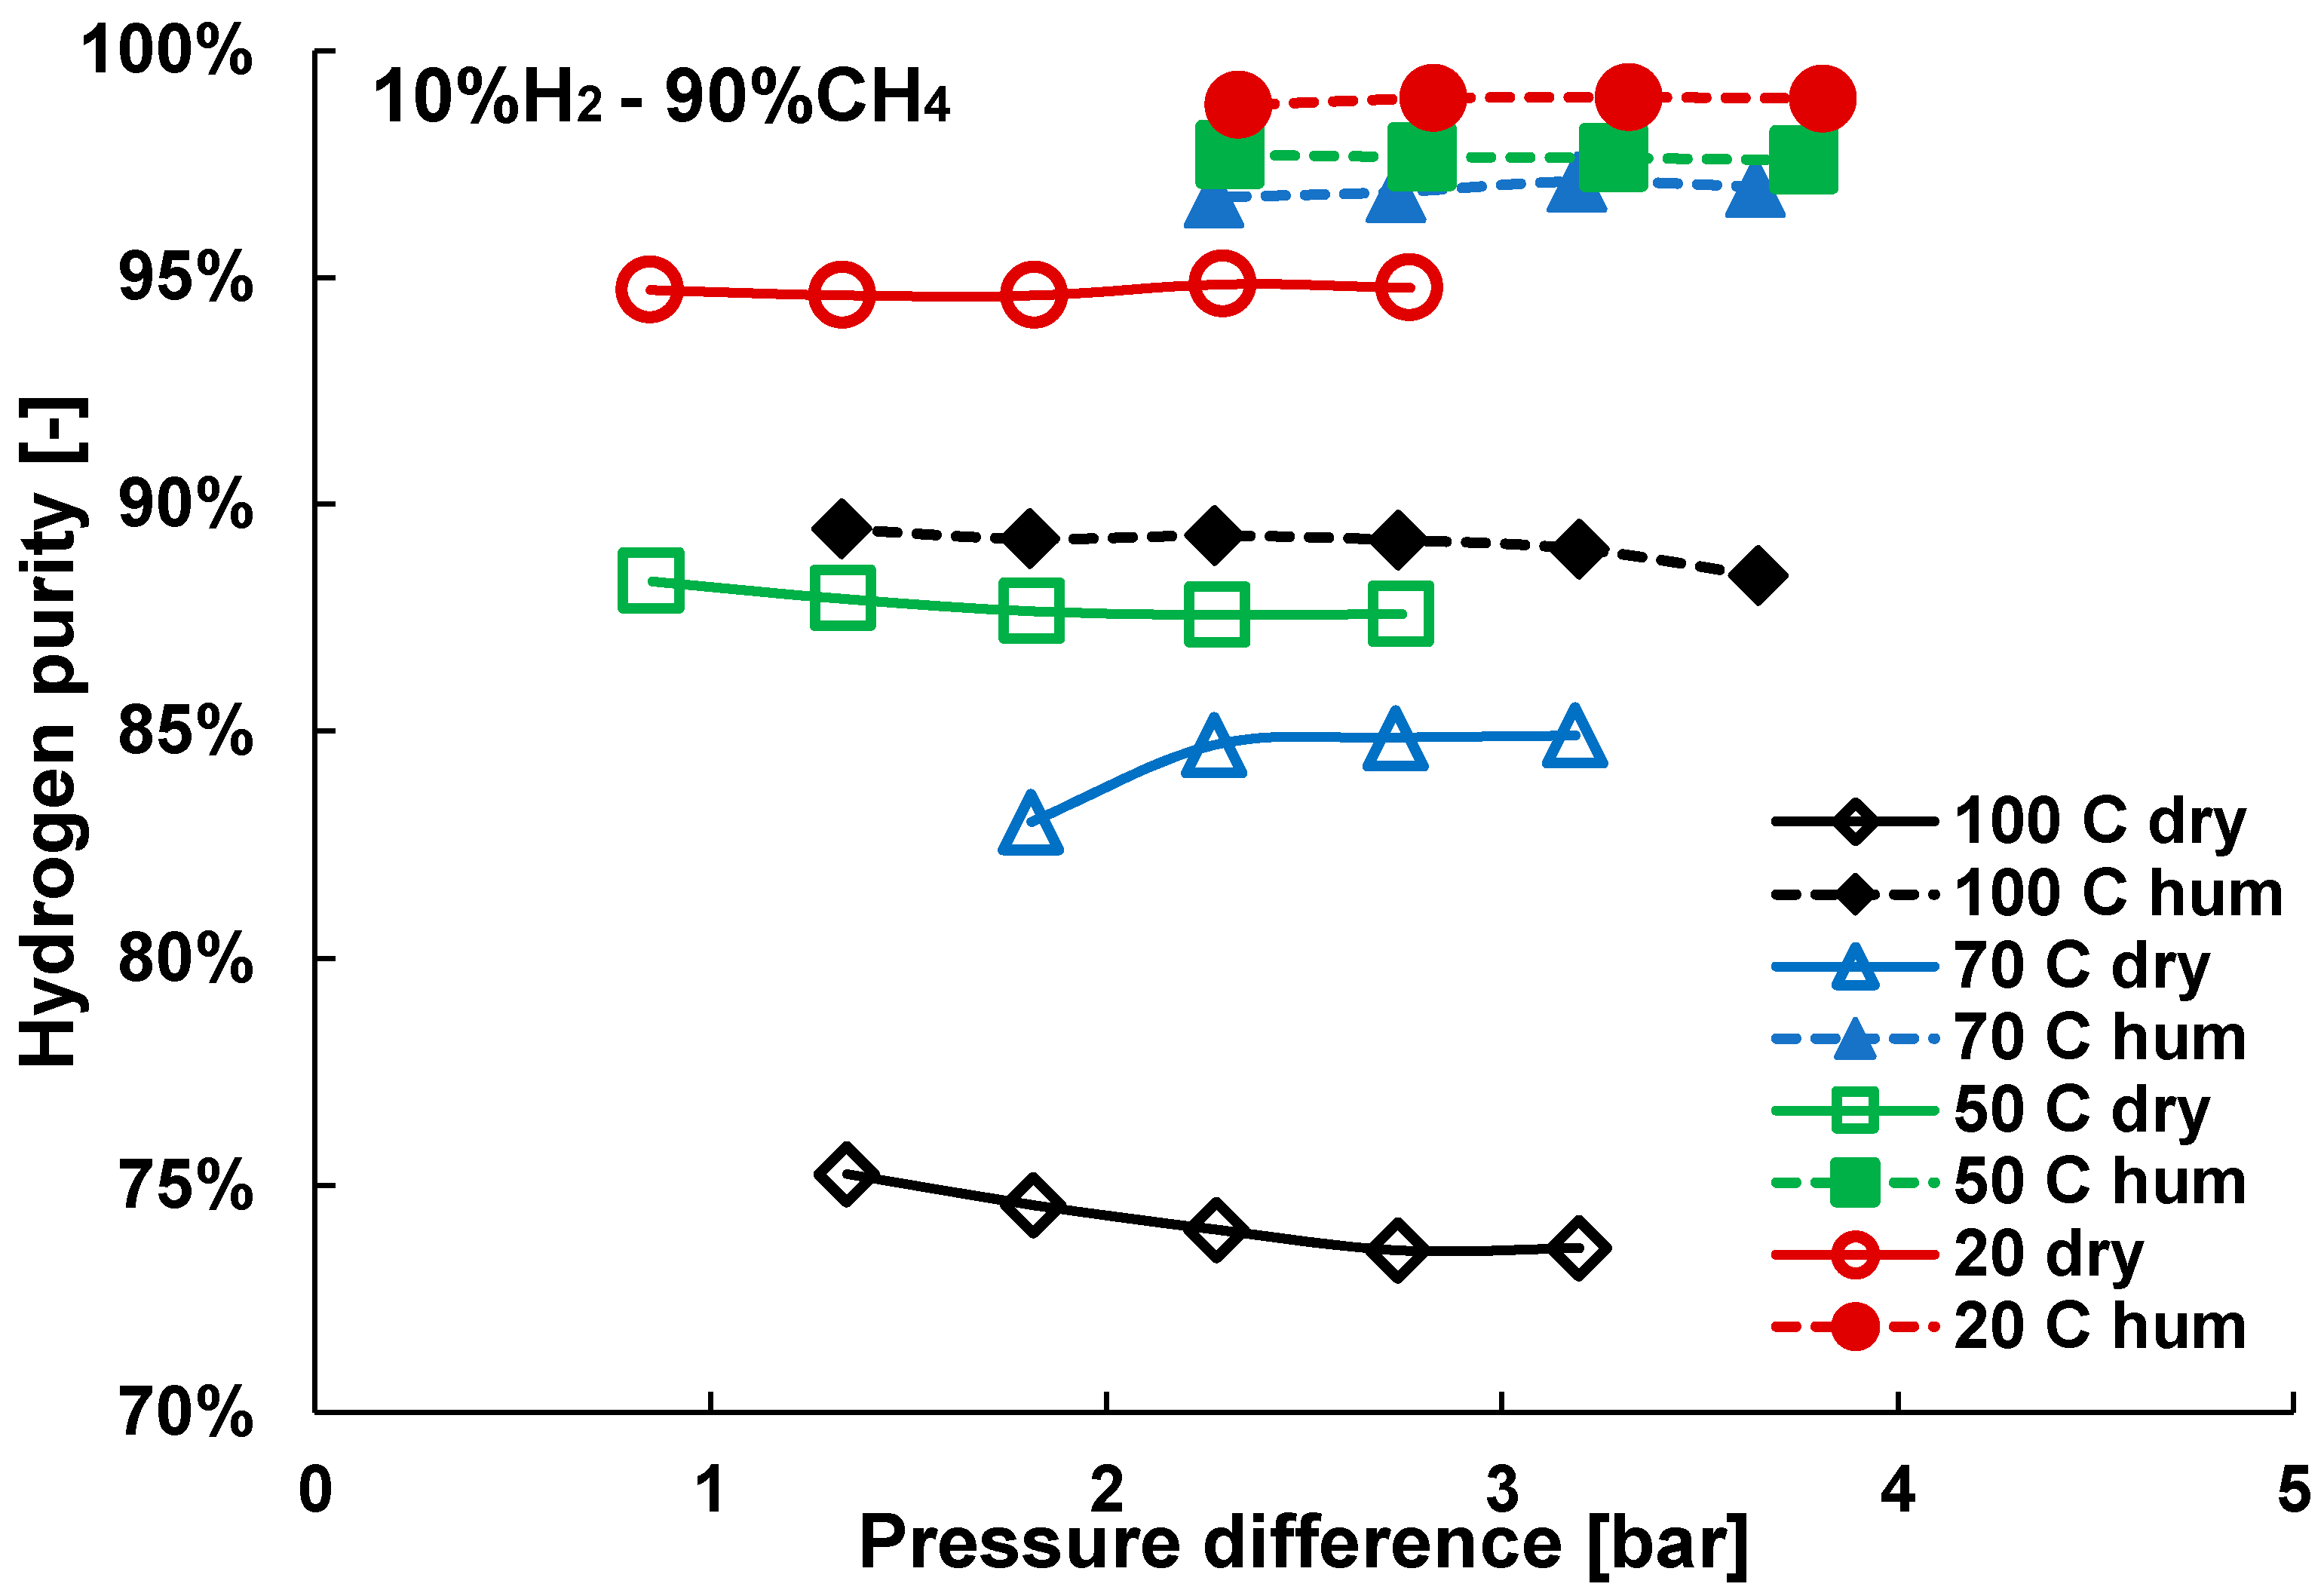
As depicted in Figure 15, the humidification of the membrane results in a reduction in the hydrogen permeance, although giving a remarkable increase to the final purity. Indeed, as shown in Figure 16, the highest purity is obtained for the case in which the membrane is humidified before performing the tests. The improvement in selectivity is more pronounced at higher temperatures, where the adsorption of water still takes place and pores are sufficiently large for the permeation of smaller gas molecules, bringing an important difference in hydrogen purity.
In particular, at 100 °C, the relative increase in purity, which occurs after the membrane is humidified, is 18%. However, this improvement is reduced when lowering the operating temperature, resulting in a relative increase (as ratio between the difference before and after the humidification and the dry case) of 14%, 10% and just 4% when working at the temperatures of 70 °C, 50 °C and 20 °C respectively.
Humidifying the membrane gives an excellent advantage to purification especially at higher temperatures.

4. Conclusions

Two carbon molecular sieve membranes, carbonized at 550 °C and 600 °C, have been tested in pure gas tests at different temperatures and over a wide range of pressures for a better understanding of the permeation mechanisms. Initially, pure gas tests with H2, N2, CH4 and CO2 were performed to analyse the different permeation mechanisms. From the results, it was observed that the H2/N2 and H2/CH4 mixtures show interesting and promising ideal selectivities for hydrogen separation. On the other hand, the H2/CO2 ideal selectivity is lower due to the contribution of adsorption of CO2 in the membrane pores and the lower kinetic diameter of carbon dioxide compared to N2 and CH4.
The permeation mechanism with configurational-diffusion can be partly described, although it should be noted that the activation energy depends on the activation temperature or, in other words, at the temperature the membrane was exposed to under inert conditions to desorb the water confined in the membrane pores. The activation energy decreases with the kinetic diameter due to an easier permeation through the pores. When giving a closer look at the permeation results, the preferential transport mechanism for hydrogen is diffusion, while for nitrogen, methane and in particular CO2, the adsorption contribution plays a role alongside gas diffusion, as the permeance is not linear with pressure.
Mixture tests were carried out in the presence of dry gas, at 10% and 50% of hydrogen, to study the purity at different temperatures and pressures. H2-CH4 and H2-N2 show a higher purity over H2-CO2 due to the very high adsorption of CO2. Higher purity was observed for all the different mixtures at lower temperatures, thanks to a higher extent of water adsorption, which partly blocks the pores allowing mainly hydrogen to diffuse through.
The water adsorption mechanism was also studied, comparing the membrane permeation when water is desorbed at 150 °C and after re-humidifying the membrane at the tested operating temperatures. An improvement in purity is obtained when the membranes are re-humidified, resulting in a smaller apparent pore size, which reduces the permeation of larger molecules and enhances the selectivity towards hydrogen. Moreover, it has been confirmed that this improvement is even more remarkable when working at higher temperatures, where the combination of water adsorption and pore size results in the highest improvements compared to dry tests.
Carbon molecular sieve membranes show competitive and promising performance compared to commercial membranes for gas separation in mixtures, especially at high pressure since they do not suffer from mass transfer limitations. Moreover, when working in humidified conditions, further improvement in gas purity is reached thanks to water adsorption, above all at higher temperature. These results show that these membranes can be considered as very promising candidates for selective hydrogen recovery from hydrogen blended in the natural gas grid. However, the economics of such technology should be compared against other potential candidates for the purpose of comparison.

Author Contributions

Conceptualization, M.L.V.N., J.A.M. and F.G.; methodology, M.L.V.N., D.A.P.T., M.L.T., F.G.; investigation, M.L.V.N. and J.A.M.; resources, F.G.; data curation, M.L.V.N.; writing—Original Draft preparation, M.L.V.N.; writing—review & editing, all authors; supervision, M.v.S.A. and F.G.; funding acquisition, F.G. All authors have read and agreed to the published version of the manuscript.

Funding

This project has received funding from the Fuel Cells and Hydrogen 2 Joint Undertaking under grant agreement No 700355. This Joint Undertaking receives support from the European Union’s Horizon 2020 research and innovation.
Energies 13 03577 i001

Conflicts of Interest

The authors declare no conflict of interest.

Appendix A

For a better understanding of the transport mechanism, the permeation of the different gases (P) can be described by the configurational diffusion equation as described in Equation (A1).
P = D c , a d s d l n ( p ) d l n ( C a d s ) θ τ d C a d s d p + θ τ D c , g a s R T
The terms d C a d s d p and 1 R T are analogous to the solubility coefficient. Above the iso-concentration point, the first term is negligibly small and the permeability is determined exclusively by the mass transport in the gas phase. In this condition, the permeability can be better described by Equation (A2) [29]. D c , a d s and D c , g a s are the corrected diffusion coefficient in the adsorbed and gas phase, respectively.
P = θ ϱ g d P τ R T 8 R T π M exp ( E a R T ) ,
where τ is the tortuosity, θ the porosity, d P the pore diameter, ϱ g the probability that the particle will jump in the desired direction. R and T are respectively the gas constant and the temperature, while E a is the activation energy. For this evaluation, the membrane has been first heated up to 150 °C to remove the water and pure gas tests were performed at 150, 120 and 100 °C with dry gases to investigate the activation energy required for the molecules to permeate. At those temperatures, the portion of adsorbed gas is small and the mechanism of transport depends only on the diffusion through the pores.
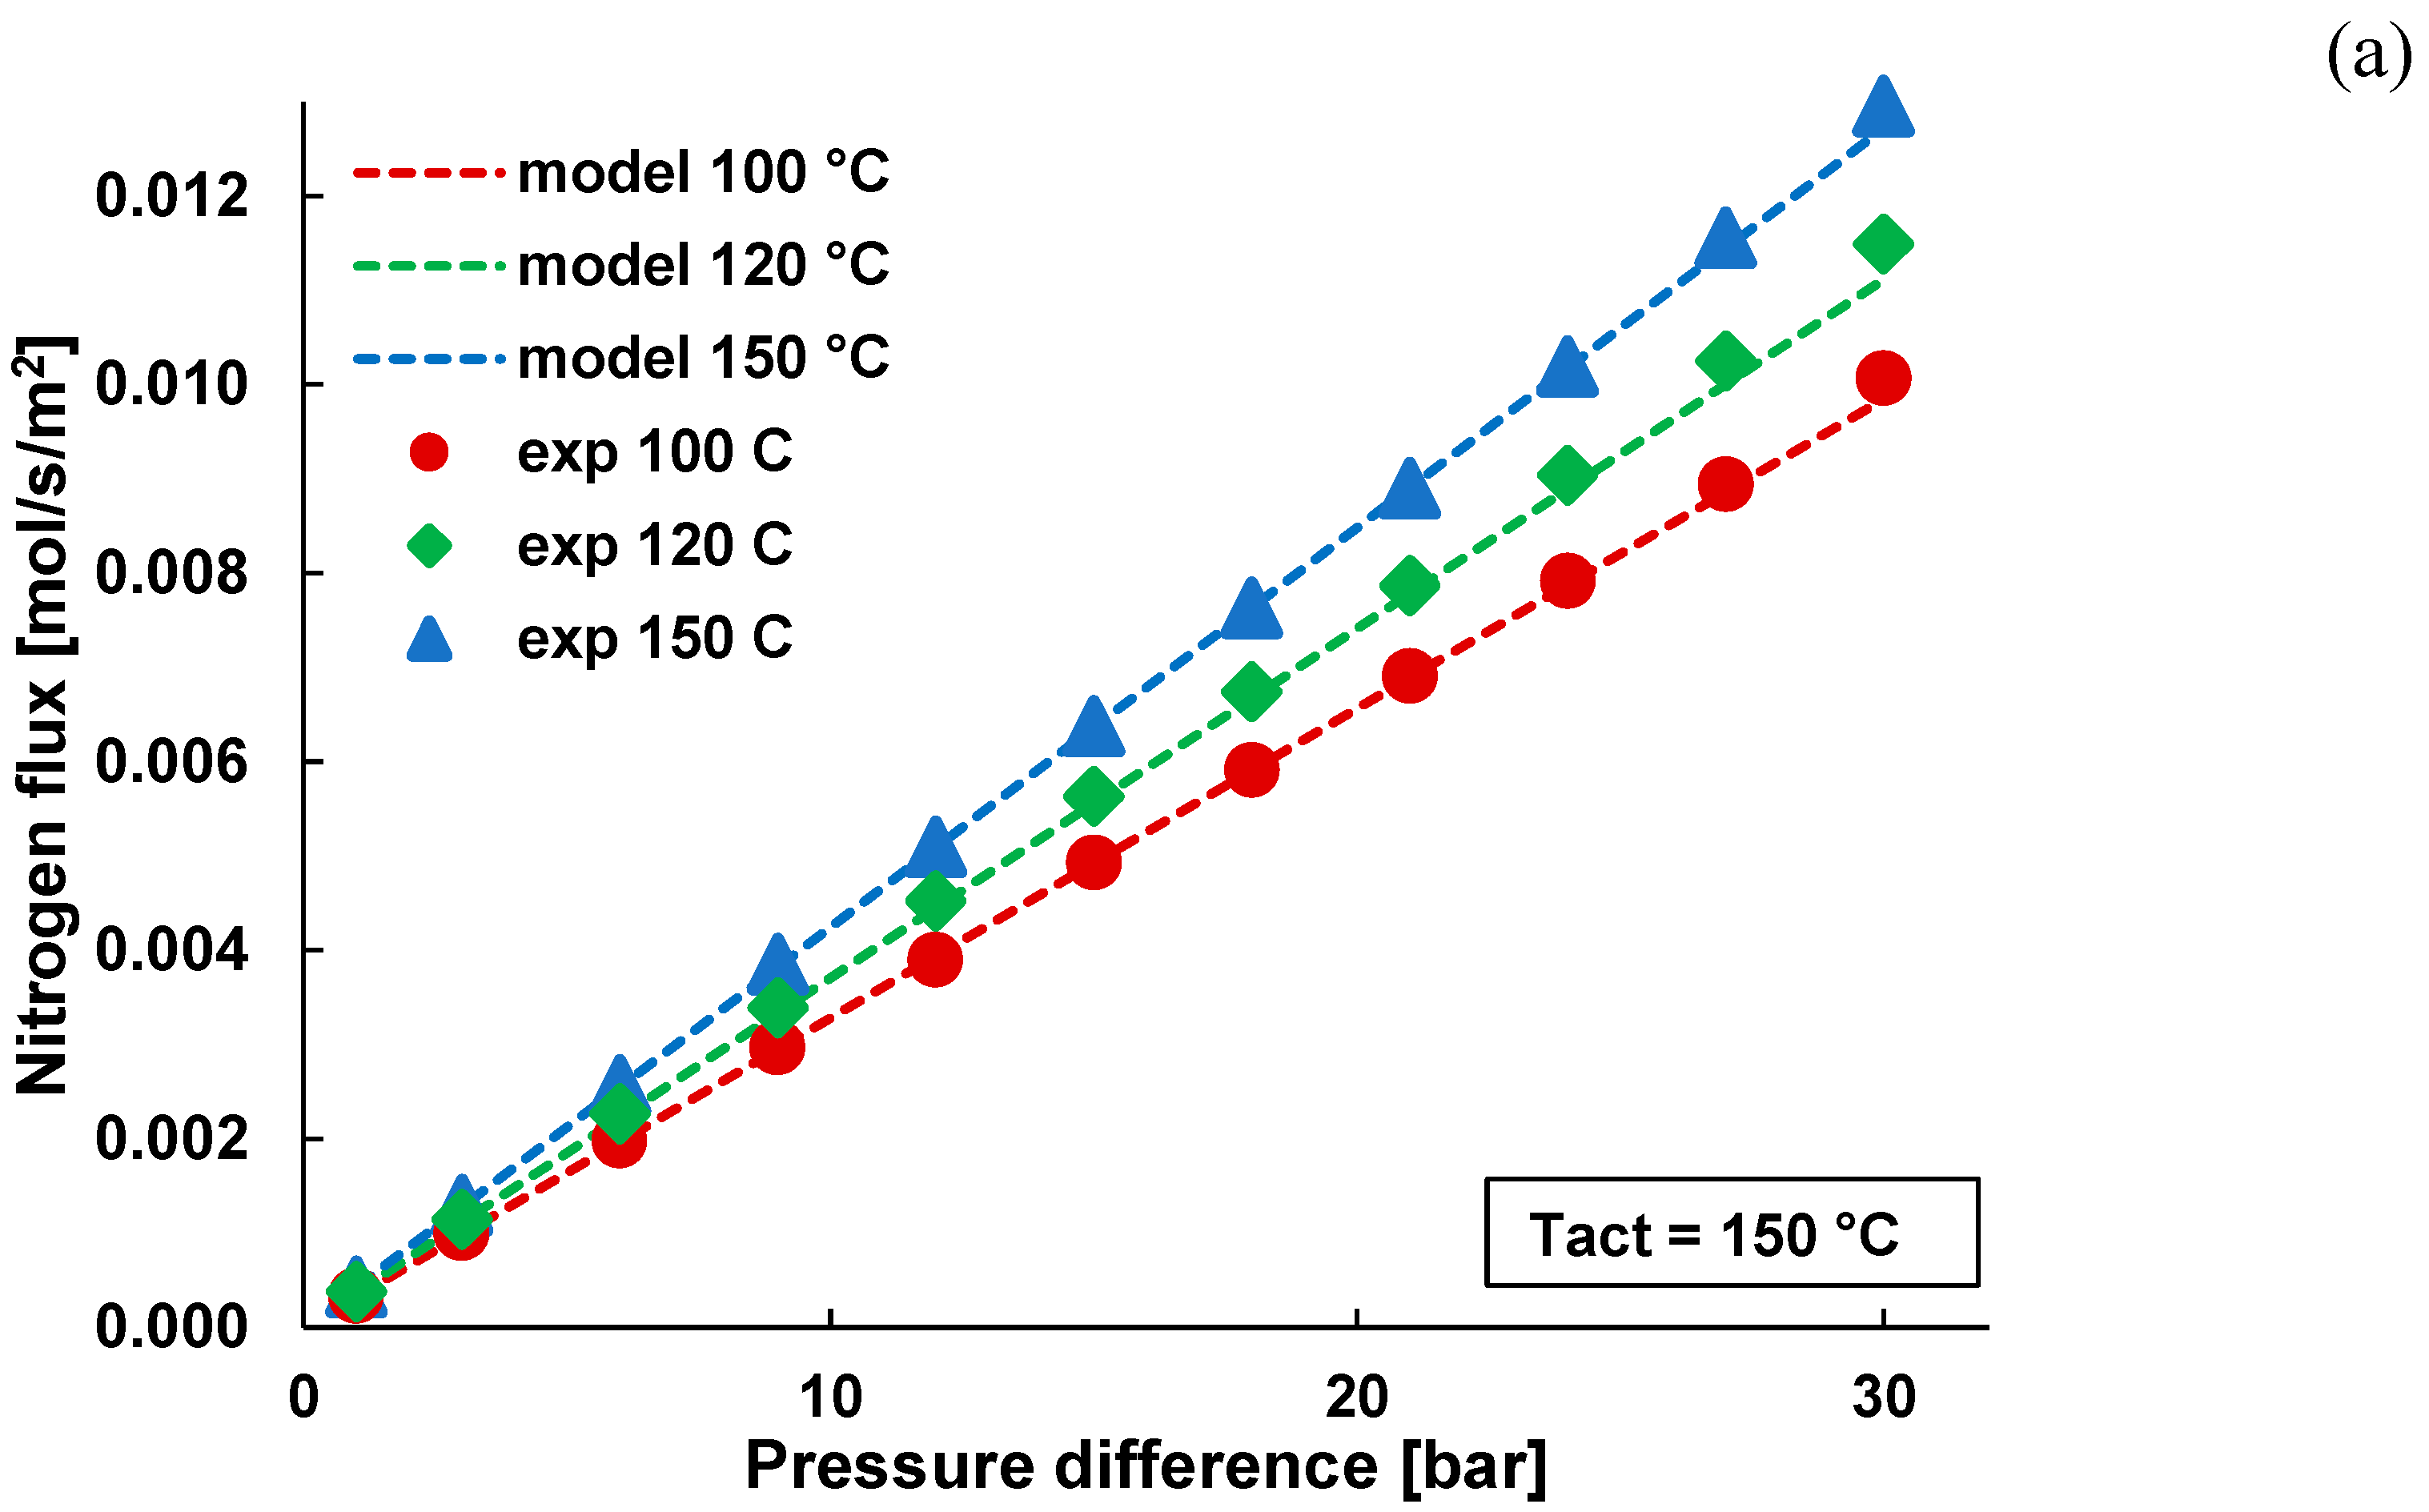
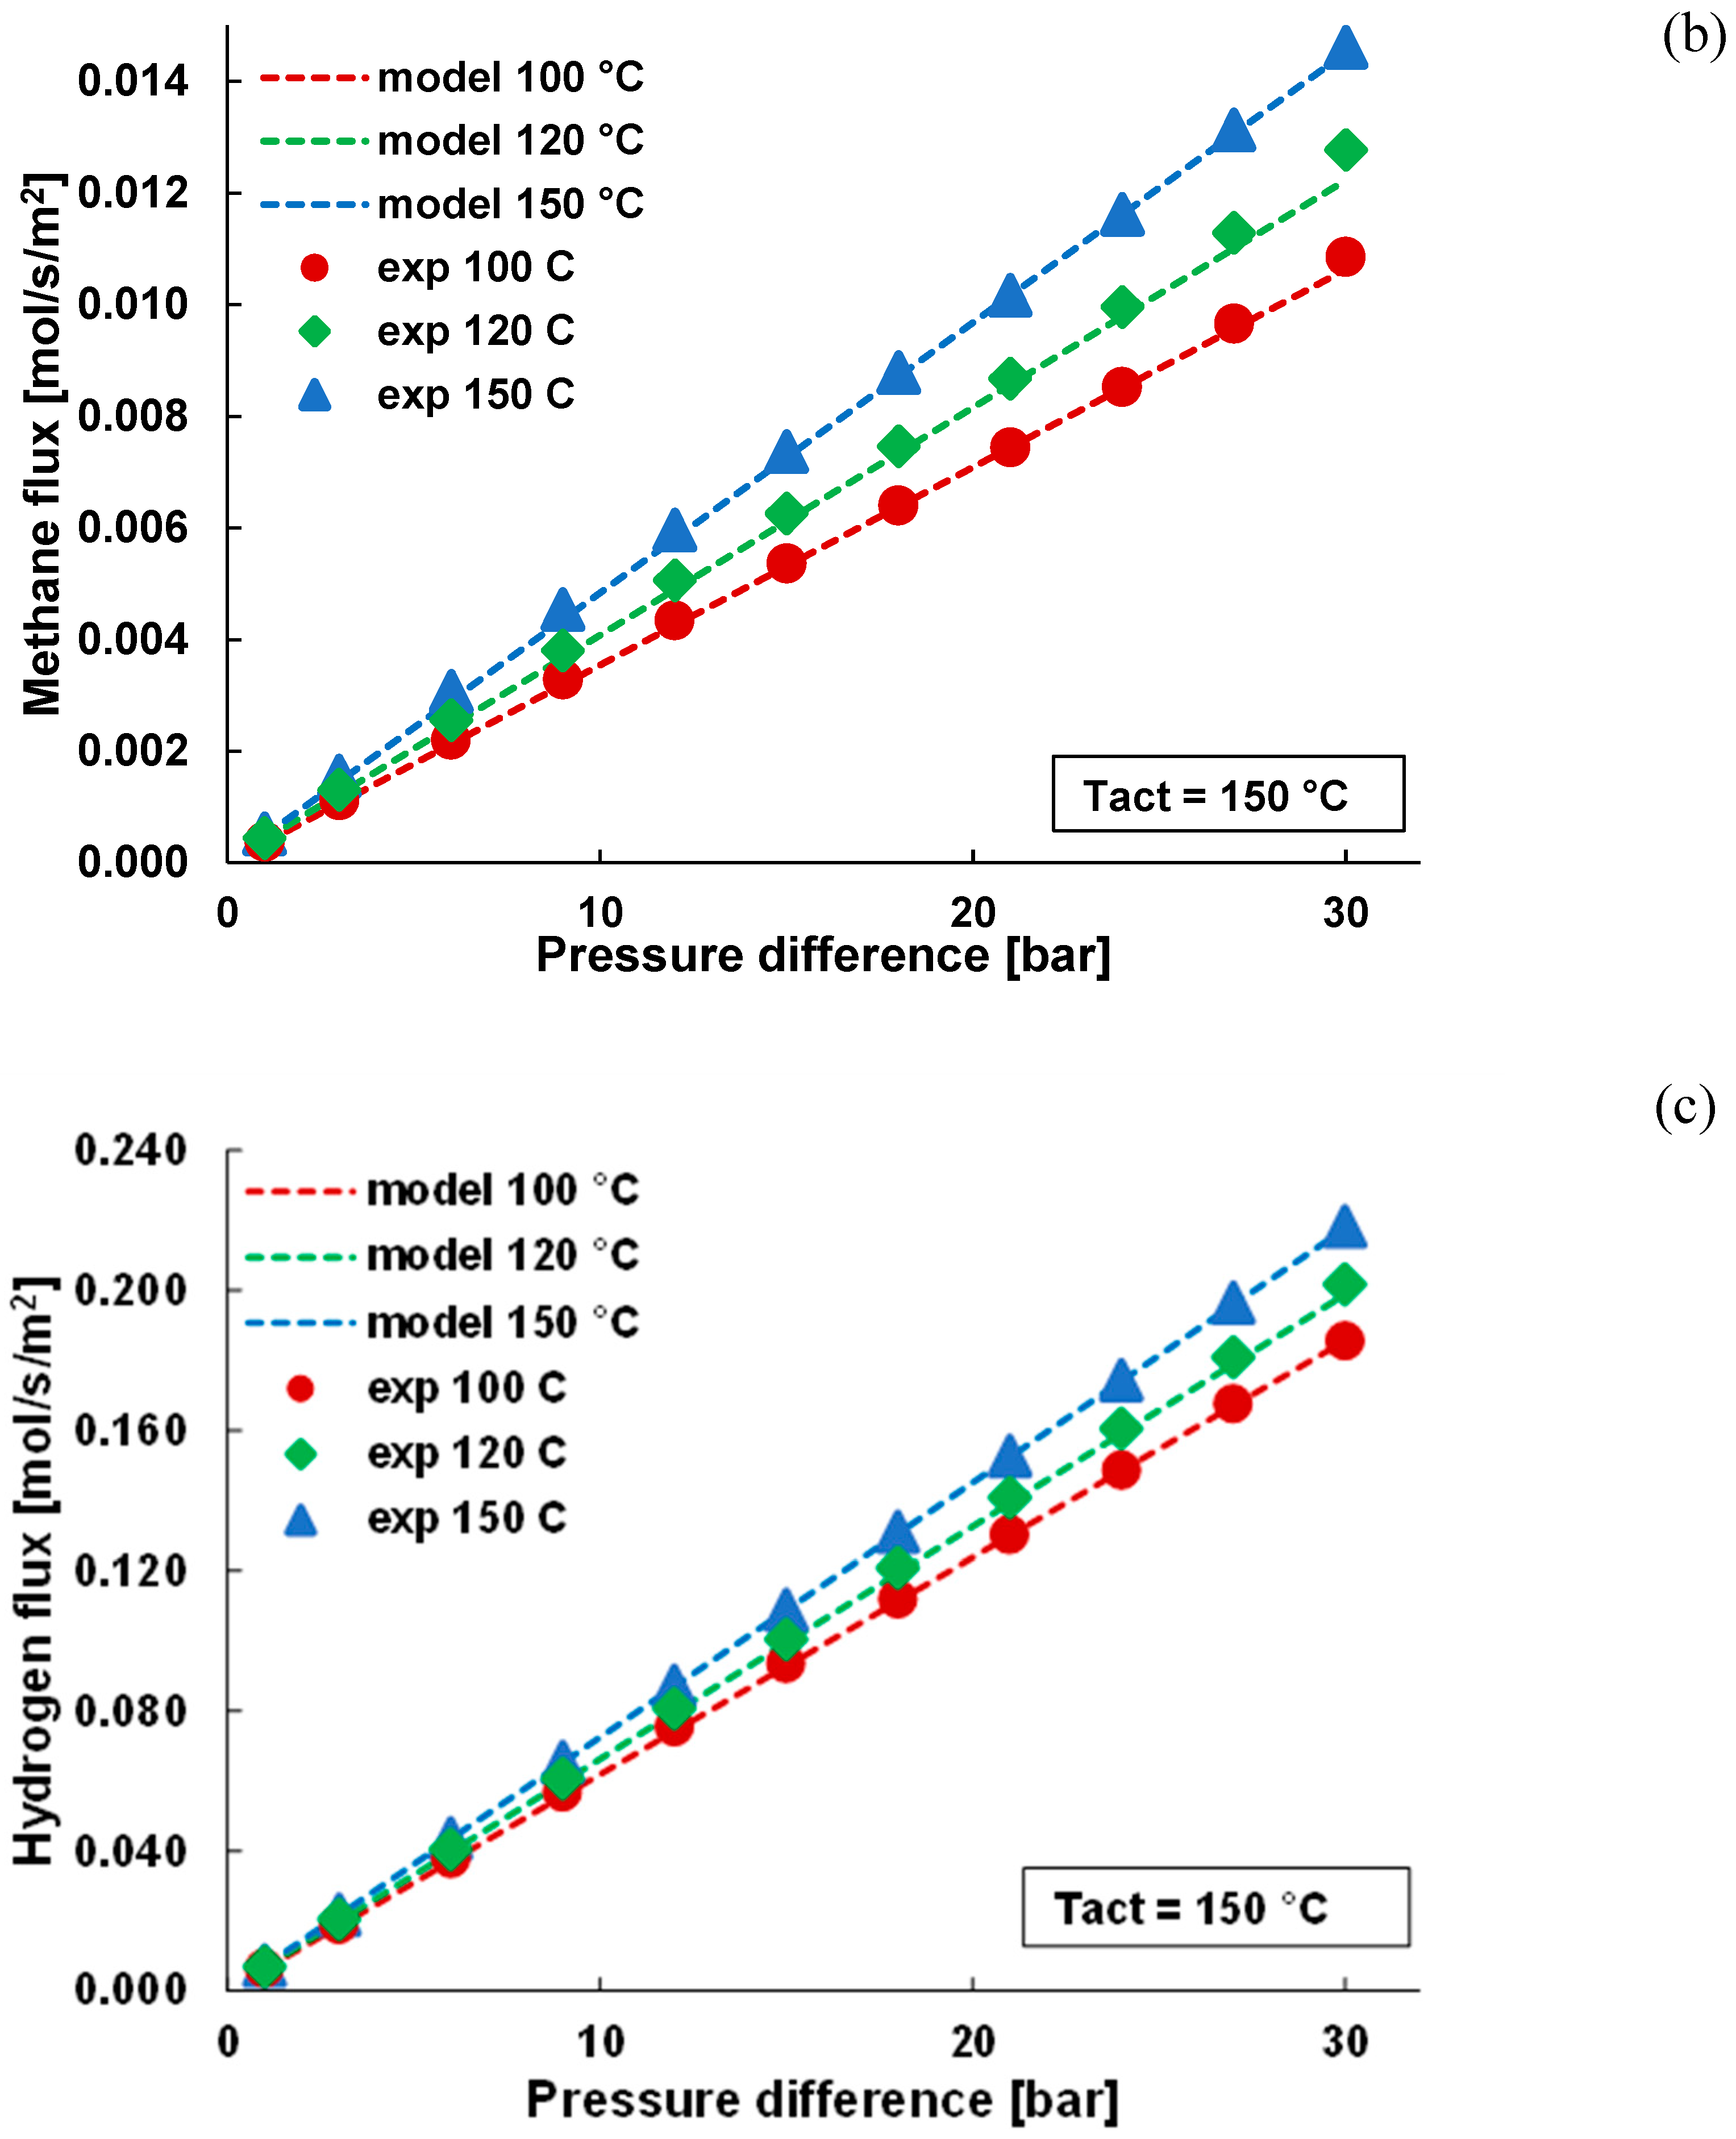
Figure A1 shows a good matching between the experimental and modelled results for all the gases described and in Figure A2 the activation energies for each molecule are shown against the kinetic diameter.
Figure A1. Comparison between (a) N2, (b) CH4 and (c) H2 flux at different temperatures between experimental and modelled description based on configuration diffusion equation CMSM-550.
Energies 13 03577 g0a1aEnergies 13 03577 g0a1b
As expected, the lower the kinetic diameter, the lower the activation energy required since it is easier for the smaller molecule to pass through the membrane pores. According to the results, the trend of activation energy with kinetic diameter is exponential, which means that for bigger molecules, it is more difficult to pass through. Therefore, the hydrogen-hydrocarbon based mixture shows remarkably high selectivities.
Figure A2. Activation energy and permeability dependence on kinetic diameter. Squared markers refer to Activation energy and triangles to permeability.
Energies 13 03577 g0a2

References

  1. Baker, R. Future directions of membrane gas-separation technology. Membr. Technol. 2001, 2001, 5–10. [Google Scholar] [CrossRef]
  2. Iaquaniello, G. Hydrogen Palladium Selective Membranes: An Economic Perspective. In Membrane Reactors for Hydrogen Production Processes; Marcello, D.F., Luigi Marrelli, G.I., Eds.; Springer: London, UK, 2011; ISBN 9780857291509. [Google Scholar]
  3. Ulleberg, Ø.; Hancke, R. Techno-economic calculations of small-scale hydrogen supply systems for zero emission transport in Norway. Int. J. Hydrog. Energy 2020, 45, 1201–1211. [Google Scholar] [CrossRef]
  4. Koresh, J.E.; Soffer, A. Mechanism of Permeation through Molecular-sieve Carbon Membrane. J. Chem. Soc. Faraday Trans. 1 Phys. Chem. Condens. Phases 1986, 82, 2057–2063. [Google Scholar] [CrossRef]
  5. Hägg, M.; Lie, J.O.N.A.; Lindbråthen, A. Carbon Molecular Sieve Membranes A Promising Alternative for Selected Industrial Applications. Ann. N. Y. Acad. Sci. 2003, 345, 329–345. [Google Scholar] [CrossRef]
  6. Rodrigues, S.C.; Whitley, R.; Mendes, A. Preparation and characterization of carbon molecular sieve membranes based on resorcinol-formaldehyde resin. J. Membr. Sci. 2014, 459, 207–216. [Google Scholar] [CrossRef] [Green Version]
  7. Adhikari, S.; Fernando, S. Hydrogen membrane separation techniques. Ind. Eng. Chem. Res. 2006, 45, 875–881. [Google Scholar] [CrossRef]
  8. Grainger, D. Development of Carbon Membranes for Hydrogen Recovery; NTNU: Trondheim, Norway, 2007; ISBN 9788247142974. Available online: https://ntnuopen.ntnu.no/ntnu-xmlui/handle/11250/248707 (accessed on 13 June 2020).
  9. Moreira, R.F.P.M.; José, H.J.; Rodrigues, A.E. Modification of pore size in activated carbon by polymer deposition and its effects on molecular sieve selectivity. Carbon 2001, 39, 2269–2276. [Google Scholar] [CrossRef]
  10. Qiu, W.; Zhang, K.; Li, F.S.; Zhang, K.; Koros, W.J. Gas separation performance of carbon molecular sieve membranes based on 6FDA-mPDA/DABA (3:2) polyimide. ChemSusChem 2014, 7, 1186–1194. [Google Scholar] [CrossRef]
  11. Jones, C.W.; Koros, W.J. Carbon molecular sieve gas separation membranes-I. Preparation and characterization based on polyimide precursors. Carbon 1994, 32, 1419–1425. [Google Scholar] [CrossRef]
  12. Kiyono, M.; Williams, P.J.; Koros, W.J. Effect of polymer precursors on carbon molecular sieve structure and separation performance properties. Carbon 2010, 48, 4432–4441. [Google Scholar] [CrossRef]
  13. Jones, C.W.; Koros, W.J. Characterization of Ultramicroporous Carbon Membranes with Humidified Feeds. Ind. Eng. Chem. Res. 1995, 34, 158–163. [Google Scholar] [CrossRef]
  14. Lagorsse, S.; Campo, M.C.; Magalhães, F.D.; Mendes, A. Water adsorption on carbon molecular sieve membranes: Experimental data and isotherm model. Carbon 2005, 43, 2769–2779. [Google Scholar] [CrossRef]
  15. Llosa Tanco, M.A.; Pacheco Tanaka, D.A.; Mendes, A. Composite-alumina-carbon molecular sieve membranes prepared from novolac resin and boehmite. Part II: Effect of the carbonization temperature on the gas permeation properties. Int. J. Hydrog. Energy 2014, 40, 3485–3496. [Google Scholar] [CrossRef] [Green Version]
  16. Lagorsse, S.; Magalhães, F.D.; Mendes, A. Aging study of carbon molecular sieve membranes. J. Membr. Sci. 2008, 310, 494–502. [Google Scholar] [CrossRef]
  17. Hamm, J.; Ambrosi, A.; Griebeler, J.; Marcilio, N.; Tessaro, I.; Pollo, L. Recent advances in the development of supported carbon membranes for gas separation. Int. J. Hydrog. Energy 2017, 42, 24830–24845. [Google Scholar] [CrossRef]
  18. Gilron, J.; Soffer, A. Knudsen diffusion in microporous carbon membranes with molecular sieving character. J. Membr. Sci. 2002, 209, 339–352. [Google Scholar] [CrossRef]
  19. Llosa Tanco, M.A.; Pacheco Tanaka, D.A.; Rodrigues, S.C.; Texeira, M.; Mendes, A. Composite-alumina-carbon molecular sieve membranes prepared from novolac resin and boehmite. Part I: Preparation, characterization and gas permeation studies. Int. J. Hydrog. Energy 2015, 40, 5653–5663. [Google Scholar] [CrossRef] [Green Version]
  20. Von Kienle, H.; Kunze, N.; Mertens, D.H. The use of activated carbon in the removal of VOC’s. Stud. Environ. Sci. 1994, 61, 321–329. [Google Scholar]
  21. Gil, A.; Grange, P. Application of the Dubinin-Radushkevich and Dubinin-Astakhov equations in the characterization of microporous solids. Colloids Surf. A Physicochem. Eng. Asp. 1996, 113, 39–50. [Google Scholar] [CrossRef]
  22. Robeson, L.M. The upper bound revisited. J. Membr. Sci. 2008, 320, 390–400. [Google Scholar] [CrossRef]
  23. Siriwardane, R.V.; Shen, M.S.; Fisher, E.P.; Poston, J.A. Adsorption of CO2 on molecular sieves and activated carbon. Energy Fuels 2001, 15, 279–284. [Google Scholar] [CrossRef]
  24. Caravella, A.; Barbieri, G.; Drioli, E. Effect of the concentration polarization on the hydrogen permeation through pd-based membranes. Chem. Eng. Trans. 2009, 17, 1681–1686. [Google Scholar]
  25. Nordio, M.; Soresi, S.; Manzolini, G.; Melendez, J.; Van Sint Annaland, M.; Pacheco Tanaka, D.A.; Gallucci, F. Effect of sweep gas on hydrogen permeation of supported Pd membranes: Experimental and modeling. Int. J. Hydrog. Energy 2019, 44, 4228–4239. [Google Scholar] [CrossRef]
  26. Boon, J.; Li, H.; Dijkstra, J.W.; Pieterse, J.A.Z. 2-Dimensional membrane separator modelling: Mass transfer by convection and diffusion. Energy Procedia 2011, 4, 699–706. [Google Scholar] [CrossRef] [Green Version]
  27. Nakajima, T.; Kume, T.; Ikeda, Y.; Shiraki, M.; Kurokawa, H.; Iseki, T.; Kajitani, M.; Tanaka, H.; Hikosaka, H.; Takagi, Y.; et al. Effect of concentration polarization on hydrogen production performance of ceramic-supported Pd membrane module. Int. J. Hydrog. Energy 2015, 40, 11451–11456. [Google Scholar] [CrossRef]
  28. De Nooijer, N.; Gallucci, F.; Pellizzari, E.; Melendez, J.; Pacheco Tanaka, D.A.; Manzolini, G.; van Sint Annaland, M. On concentration polarisation in a fluidized bed membrane reactor for biogas steam reforming: Modelling and experimental validation. Chem. Eng. J. 2018, 348, 232–243. [Google Scholar] [CrossRef]
  29. Shelekhin, A.B.; Dixon, A.G.; Ma, Y.H. Theory of gas diffusion and permeation in inorganic molecular sieve membranes. AIChE J. 1995, 41, 58–67. [Google Scholar] [CrossRef]
Figure 1. Pictures of the carbon molecular sieve membrane (CMSM)-550 and CMSM-600 carbonized at 550 and 600 °C respectively.
Energies 13 03577 g001
Figure 2. Schematic representation of the high permeation setup.
Energies 13 03577 g002
Figure 3. Scanning electron microscopy of CMSM-550: (a) top section of the membrane (b) bottom section of the membrane. (c) Fourier transform infrared (FTIR) of CMSM-550 and CMSM-600.
Energies 13 03577 g003aEnergies 13 03577 g003b
Figure 4. Comparison between Robeson upper bound and membrane permeability and selectivity for the CMSM-550 and CMSM-600 exposed to water from the atmosphere at a working temperature of 70 °C.
Energies 13 03577 g004
Figure 5. Permeance as a function of the kinetic diameter of gases at various temperatures and 30 bar of pressure difference (a) with dry gas; (b) with humidified gas of membrane CMSM 550.
Energies 13 03577 g005aEnergies 13 03577 g005b
Figure 6. CO2 Thermo-gravimetric analysis of CO2 at 50 °C and isotherm adsorption curve, the sample is from CMSM-550.
Energies 13 03577 g006
Figure 7. (a) H2, (b) CO2, (c) N2, (d) CH4 permeance with the humidified gas at several pressures and temperatures.
Energies 13 03577 g007aEnergies 13 03577 g007b
Figure 8. (a) H2/CH4, (b) H2/N2, (c) H2/CO2 (d) CO2/CH4 selectivity at high pressure from 20 to 70 °C with a dry and humidified stream.
Energies 13 03577 g008aEnergies 13 03577 g008b
Figure 9. Comparison between permeating hydrogen flow rate in an H2-CH4 mixture with 10% and 50% hydrogen concentration at 20, 35, 50 and 70 °C, for CMSM-550.
Energies 13 03577 g009
Figure 10. Comparison between permeating hydrogen flow rate in an H2-CO2 mixture with 10% and 50% hydrogen concentration at 20, 35, 50 and 70 °C for CMSM-550.
Energies 13 03577 g010
Figure 11. Comparison between hydrogen flow rate in an H2-N2 mixture with 10% and 50% hydrogen concentration at 20, 35, 50 and 70 °C, for CMSM-550.
Energies 13 03577 g011
Figure 12. Comparison between hydrogen purity in a H2-CH4 mixture with 10% and 50% hydrogen concentration at 20, 35, 50 and 70 °C, for CMSM-550.
Energies 13 03577 g012
Figure 13. Comparison between hydrogen purity in an H2-CO2 mixture with 10% and 50% hydrogen concentration at 20, 35, 50 and 70 °C, for CMSM-550.
Energies 13 03577 g013
Figure 14. Comparison between hydrogen purity in an H2-N2 mixture with 10% and 50% hydrogen concentration at 20, 35, 50 and 70 °C, for CMSM-550.
Energies 13 03577 g014
Figure 15. Comparison between hydrogen flow rate in an H2-CH4 mixture with 10% hydrogen concentration at 20, 50, 70 and 100 °C in a dry and humidified membrane, for CMSM-600.
Energies 13 03577 g015
Figure 16. Comparison between hydrogen purity in an H2-CH4 mixture with 10% hydrogen concentration at 20, 50, 70 and 100 °C in a dry and humidified membrane, for CMSM-600.
Energies 13 03577 g016
Table 1. Water Solubility, Gas diffusivity in water and kinetic diameter for CO2, H2, N2 and CH4.
GasWater Solubility [g/kg water] @ 20 °CGas Diffusivity in Water·10−9 [m2/s] @ 20 °CKinetic Diameter [pm]
carbon dioxide1.651.71330
hydrogen0.00164.5289
nitrogen0.0191.75364
methane0.0241.64380