Abstract
The efficiency of wave energy converters (WECs) is generally evaluated in terms of historical wave conditions that do not necessarily represent the conditions that those devices will encounter when put into operation. The main objective of the study is to assess the historical and near future efficiency and energy cost of two WECs (Aqua Buoy and Pelamis). A SWAN model was used to downscale the wave parameters along the NW coast of the Iberian Peninsula both for a historical period (1979–2005) and the near future (2026–2045) under the RCP 8.5 greenhouse scenario. The past and future efficiency of both WECs were computed in terms of two parameters that capture the relationship between sea states and the WEC power matrices: the load factor and the capture width. The wave power resource and the electric power capacity of both the WECs will decrease in the near future. The load factor for Aqua Buoy will decrease in the entire area, while it will remain unchanged for Pelamis in most of the area, except north of 43.5° N. The capture width and cost of energy will increase for both devices. The methodology here applied can be easily applied to any device and coastal domain under different climate change scenarios.
1. Introduction
The oceans are the largest source of unexploited renewable energy in the world. The development of ocean energy is one of the five strategic priorities of Europe to meet growing energy demand; to significantly improve energy security, reducing the dependence on energy imported from outside Europe; to support sustainable jobs and growth in the “blue economy”; to create a new internal market capable of exporting marine renewable energy products and services; and to reduce carbon emission from burning fossil fuels, improving also the air quality. Renewable energy located in marine environments has the advantage of larger areas for marine energy farms, with a higher and more stable power density. The limitations are deep waters for technological reasons, and that marine energy farms must coexist with other sea uses, like fishing and shipping, and with restricted or protected areas. However, ocean renewable resources may be exploited without harming the marine environment or negatively impacting the other sea uses if farms are sited and scaled properly following environmental guidelines [1]. In addition, future marine wave energy farms could play a key role in coastal protection [2,3,4,5,6,7] by extracting a considerable portion of wave energy, diminishing therefore the amount of energy in the surf zone, which attenuates the intensity of coastal processes, such as local erosion and coastline retreat.
In the marine environment, there are various energy resources that can be tapped using different technologies depending on the energy source. The main energy sources exploited worldwide are offshore wind, tidal-stream, and ocean waves. From these sources, waves are considered the most energetic one, since they are constantly formed and transport and retain energy for thousands of miles with minimum energy loss. Over the last decades, a huge effort has been devoted both to assess the main characteristics of the wave energy resource (a complete summary can be found in [8,9]) and to develop technologies allowing the sustainable extraction and exploitation of the wave energy [10,11,12,13,14,15,16]. Several wave energy converters (WECs) were developed during recent decades within almost 150 WEC projects reported at a global scale, 50% of them developed in Europe [11]. One of the main concerns is to determine the more suitable WEC for each coastal location, which depends on the wave characteristics usually found in that area. Attending to the directional characteristics, WECs can be classified as point absorber (pilot plants are set up in Portugal, Scotland, and Japan), attenuator (Portugal), and terminator (prototypes have already been installed in Denmark and Norway) [17].
Despite the enormous effort dedicated to analyze the wave energy resource both at global [18] and regional scales [19,20,21,22,23,24,25,26,27,28,29,30,31,32,33,34] and to evaluate the adequacy of different WECs located in the worldwide regions with the highest wave power [10,11], little has been done to analyze the effect of climate change on wave power resources. The accurate prediction of the future energy field of a wave farm needs to take into account both the natural and anthropogenic variability of climate, since waves are quite vulnerable to changes in wind forcing [35,36]. In this sense, the impact of climate change on wave energy in the Black Sea basin was analyzed by [37] for the near future (2021–2050).
Furthermore, the wave energy harvest viability relies on the rate between the cost of the energy and the capital required for the projects, which may vary depending on the targeted market and the revenue [38,39,40,41,42] predicted at the present currency. Several authors have assessed the calculation of the life-cycle cost of the floating offshore wave energy farm taking into account different phases, such as development, manufacturing, installation, exploitation, and dismantling [39,40,43,44].
The northwest Iberian Peninsula coast (NWIP) is the target area of this study (Figure 1a) and is one of the worldwide regions with the highest wave power resource, since waves break after traveling thousands of miles, gaining energy as they move through the Atlantic Ocean [11,16,45,46]. In fact, the first place worldwide to install a commercial-scale wave energy device in the water was the “Pilot Zone” located off the Portuguese coast just north of Lisbon. The “Pilot Zone” serves as a testing ground for ocean energy companies. In this region, the current [47,48] and future [49] wave energy resources were analyzed, and different evaluations of several WECs were performed to determine which technology is the most suitable for commercial exploitation in this area [10,11,14,47]. The area is affected by important bathymetric constraints (Figure 1a), since 80% of the points have a depth greater than 50 m and only 5.2% have depths between 25 and 50 m, which limits the type of WECs that can be used. Thence, the efficiency of the WECs will be analyzed for two types of devices whose technical specificities allow them to operate in intermediate water depths: a point absorber (Aqua Buoy) and an attenuator (Pelamis). A picture of both devices can be found in [50] (see Figure 2 in that publication).
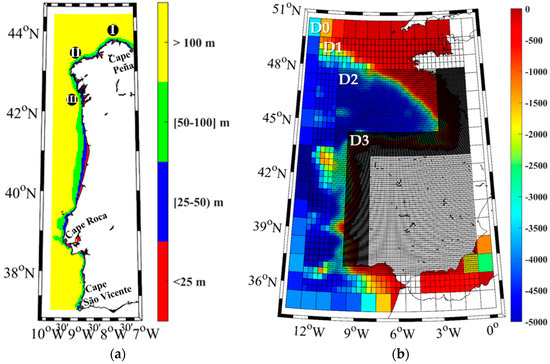
Figure 1.
Study area with the location of the in situ buoys (a) Estaca de Bares (I), Villano Sisargas (II), and cabo Silleiro (III). Colors represent the depth arranged in four bins. Numerical domains and bathymetry (m) used in Simulating WAves Nearshore (SWAN) (b) with a nested approach from the Commonwealth Scientific and Industrial Research Organisation (CSIRO) domain (D0) using three domains (D1, D2, and D3).
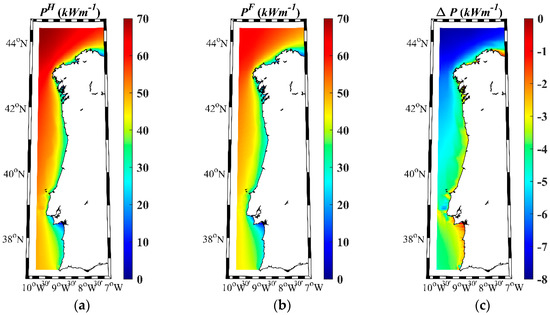
Figure 2.
Wave power resource. Mean wave power energy in the NW Iberian Peninsula for (a) the historical period (1979–2005) and (b) near future (2026–2045), and (c) the difference between both periods (Future–Historical).
The aim of this study is to assess the efficiency and cost of energy over the life-cycle [41,42,51] of two WEC types along the northwest coast of the Iberian Peninsula for the near future. The efficiency of WECs in transforming wave energy into electricity is evaluated using two parameters, the load factor and the capture width, following previous studies [10,11,47]. The lifetime cost energy of the WECs can be estimated by the sum of the capital, operational, and maintenance costs. Other aspects, such as the size of the device or the design of the wave farm, were not considered in the present study. These parameters are calculated from the wave power resource and the wave power of each wave device. The wave power of each WEC is calculated, taking into account the historical and future percentages of sea states (structured into bins of Hs and Tp) and the power matrix and nominal power provided by the manufacturer. The wave states are obtained by means of a dynamical downscaling (~0.037° × 0.037°) of the wave height (Hs) and the peak period (Tp). Wave propagation models were driven by historical (1979–2005) wind data and near future (2026–2045) wind data produced following the Coupled Model Intercomparison Project 5 (CMIP5) protocol [52] under the Representative Concentration Pathway (RCP) 8.5 greenhouse scenario [53,54].
2. Methodology
Comparing the efficiency of different WECs is not straightforward due to the wide variety of technologies (point absorber, terminator or attenuator) for harvesting wave energy. Each WEC has a characteristic nominal power and a power matrix that represents the maximum energy that the WEC could harvest. This confers a range of power that each WEC can efficiently capture from the wave energy flux for different sea states. These sea states can be characterized in terms of the Hs and Tp parameters obtained from in situ measurements or numerical modeling for the past and only through numerical modeling for future projections.
2.1. SWAN Wave Model
The wave parameters (Hs and Tp) for historical and near-future climate data were obtained through the third-generation spectral wave model SWAN [55] embedded in the Delft3D WAVE module [56]. SWAN computes the evolution of random waves in coastal regions with deep, intermediate, and shallow water, which includes wave propagation, refraction due to depth, generation by wind, dissipation due to whitecapping, bottom friction, and depth-induced wave breaking and nonlinear wave–wave interactions [55]. The model was implemented for the northwest Iberian Peninsula coast, taking into account the recommendations of the International Electrotechnical Commission (IEC) for the development of a model to assess the wave energy resource [57]. The IEC set standards related to the modelling and analysis of wave resources depend on the objectives and accuracy of the study. These standards are divided into three categories: reconnaissance, feasibility, and design. The physical processes for a reconnaissance-stage model [58] were taken into account, including triads, bottom friction, depth-induced breaking, and quadruplets. The wave spectrum was discretized to 25 frequencies (0.0418–1 Hz) and 36 directional bands.
The dynamical downscaling considered in the present work will be briefly described here. In a first step, WAVEWATCH III (WWIII) coarse resolution simulations (1° × 1°) provided by Commonwealth Scientific and Industrial Research Organisation (CSIRO) were analyzed. For hindcast purposes [59], CSIRO offers 8 different historical realizations forced with 8 different Global Circulation Models (GCMs) and an additional simulation forced with reanalysis winds obtained from the Climate Forecast System Reanalysis (CFSR). Both Hs and Tp were considered to assess the accuracy of the models to reproduce the wavefield in the area under study. The statistical analysis was carried out through the overlap percentage (OP) between the probability distribution functions (PDFs) of the wavefield generated with hindcast (CFSR) and GCMs winds, following [60]. The WWIII simulations driven with wind from the MIROC5 GCM showed to be the most accurate for the area under study, providing the highest OPs both for Hs (87%) and Tp (90%). Then, coarse (1° × 1°) resolution wavefields were downscaled by means of the SWAN model at three different domains (1/3°, 1/9°, and 1/27°, respectively) (Figure 1b). SWAN was forced at the open boundaries with the wave field provided by WWIII forced with winds from the most accurate model (MIROC5 GCM). In addition, SWAN was also forced in the inner domain with regional winds provided by MIROC5 CCLM4-8-17 RCM [61]. The highest spatial resolution (~0.037° × 0.037°) was used for a fringe ~100 km width along the western coast of the Iberian Peninsula. The simulations covered the historical (1979–2005) and the near-future (2026–2045) periods with an hourly data output. The accuracy of the SWAN model in reproducing wave parameters near the coast was also statistically analyzed for the historical period in terms of the OP between in situ buoys (Figure 1a) and numerical PDFs both for Hs and Tp, following [60], as mentioned above. Overlap values (Table 1) ranging from 78% to 83% were obtained for Hs and from 74% to 84% for Tp. The OPs between winds at coastal buoys moored around the Iberian Peninsula were analyzed in previous research [62], showing OP values of 69±10% for GCMs and 83±3% for RCMs.

Table 1.
Overlap percentage between in situ buoy data and historical numerical probability distribution functions (PDFs) for Hs and Tp from 1985 to 2005 for the northwest Iberian Peninsula (NWIP).
2.2. Wave Power Resource
The Wave Power resource [63] (in kWm−1) can be obtained from the wave spectral parameters Hs and Te, and is depicted by:
where Hs is the significant wave height, ρ is the seawater density (1025 kgm−3), g is the gravitational acceleration, and Te is the energy period, which can be estimated based on the peak period (Tp) as:
where α depends on the shape of the wave spectrum. In the present study, α = 0.9 was adopted because a JONSWAP spectrum with a peak enhancement factor of γ = 3.3 was considered [64,65].
2.3. Parameters to Assess the Efficiency of WECs
Two parameters have been widely used in the literature to assess and compare the efficiency of different devices for specific sites, namely the load factor and the capture width [11,14].
The power load factor (ε) for a specific WEC can be expressed in % by:
where Pmax represents the maximum electric power, provided by the manufacturer [47], that can be harvested with a specific WEC, and PE the average electric power that can be extracted with a certain device.
where pij is the percentage of occurrence of a given sea state bined in terms of Hs and Tp, and Pij is the electric power for the same bin obtained from the power matrix provided by the manufacturer for that specific WEC [11,14].
The capture width (Cw, in meters) represents the width of the wavefront from which the energy is extracted, and it can be defined as the ratio of the WEC electric power (PE) to the wave power resource (P) defined above:
According to [66] these indices are the most appropriate to compare the efficiency of different WECs. Actually, they have been used to evaluate the performance of the different technologies along the Portuguese continental coastal environment [11].
The amount of electricity generated (Ep, in MWh) [41] during the WEC lifetime can be expressed by:
where Lifetime represents the total service life of the WEC (25 years). The cost of energy (CE, in EUR/MWh) [42] is the total cost involved during the lifespan use of the WEC, including the capital, operation, and maintenance cost, divided by Ep:
where CA is the capital cost and COM is the operation and maintenance cost of a specific WEC. As mentioned before, two types of WECs are studied, Pelamis [42] and Aqua [67], whose sum of capital, operation, and maintenance costs can be estimated to be around 8.9 and 2.2 million euros, respectively, for a 25-year lifetime (see [42,68]).
The difference between the future and the historical period for all the variables (P, ε, PE, Cw, and CE) will be calculated as ∆X = XF − XH, where X is the variable under study and the subscripts F and H refer to the future and historical data, respectively.
3. Results and Discussion
The wave power energy was used to identify the wave power resource available along the NWIP coast both for the historical period (1979–2005) and the near future (2026–2045), and also the assessment of the projected changes in terms of mean wave power was made by computing the difference ΔP in the wave power resource between both periods (Figure 2). For the historical period, P increases northward, with the highest value (>65 kWm−1) observed at the northwestern corner of the IP (Figure 2a). In general, P gradually decreases landward. The pattern is similar to that previously obtained by other authors [69]. A similar trend is shown for the near future, although the maximum values do not exceed 60 kWm−1 (Figure 2b). ΔP is negative for the entire region, which suggests that P will decrease for the near future, although at different rates (Figure 2c). In general, |ΔP| increases with the distance to the coast and from south to north. The decrease in P for the near future is consistent with previous research by [70], who found that despite the overall increase for the Atlantic basin since 1948, P has decreased over recent years for the Northeast Atlantic.
The P decrease can compromise the overall WECs efficiency and consequently lower the total wave power harvested in a wave farm located or planned for these locations. In addition, the average lifespan of WECs is assumed to be around 25 years [42,71] with the current technology, leading to a weighted investment due to the constraints for an optimized wave energy harvest. However, despite the P decrease obtained for the near future, the potential of this region for the wave harvest is still viable due to WEC technical specificities such as Pmax, which represents the maximum electric power that can be harvested from different sea states. Several authors have assessed the efficiency of WEC prototypes for commercial purposes in different coastal environments along the NWIP [47,66,69]. Some of the WECs assessed by those authors are Pelamis and Aqua Buoy, due to technical specificities that allow them to operate between intermediate water depths (50–70 m) [47], and the available information of the power matrix [14] and the corresponding Pmax are 750 kW for Pelamis and 250 kW for Aqua Buoy [47].
Thus, the Pelamis and Aqua Buoy electric power capacity (PE) was calculated based on their power matrix and the sea states previously obtained from the SWAN simulations for the historical and near-future periods (Figure 3 and Figure 4). Both figures show the historical values, the near-future projections, and the change in PE between both periods for Pelamis and Aqua Buoy, respectively. The results show that the PE patterns for Pelamis and Aqua Buoy are similar to those previously found for P. In addition, the decreasing pattern previously observed for ΔP is also detected for ΔPE. Pelamis shows a maximum ΔPE reduction (>10 kW in absolute value) at ocean locations in the northern part of the study area (Figure 3c). The ΔPE values are almost negligible from Roca Cape to 43° N. Only a narrow fringe north of 43.5° N shows a decrease higher than 4 kW in absolute value. Aqua Buoy shows a maximum ΔPE reduction (~−7 kW) also in the northern part (Figure 4c). ΔPE will decrease between −2.5 and −4 kW south of 43.5° N, reaching the lowest differences close to the shore between Roca Cape and São Vicente Cape. Overall, both devices show a different ΔPE pattern south of 43.5° N, with the pattern similar north of 43.5° N. These patterns are explained by the differences in the power matrices of the WECs, whose diagrams of scattered Tp-Hs joint distributions have different ranges, between 1–5.5 s and 5–17 m for Aqua Buoy and 0.5–8 s and 5–13 m for Pelamis [14]. These varieties of ranges confer each device a diverse variety of sea states under which they can operate retrieving the maximum electric power energy.
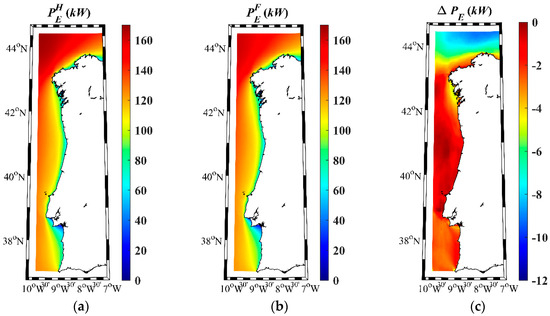
Figure 3.
Pelamis electric power capacity along the northwest Iberian Peninsula coast for (a) the historical period (1979–2005) and (b) the near future (2026–2045), and (c) the difference between both periods (Future-Historical).
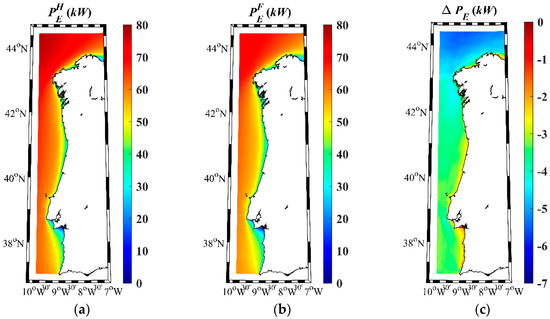
Figure 4.
Aqua Buoy electric power capacity along the northwest Iberian Peninsula coast for (a) the historical period (1979–2005) and (b) the near future (2026–2045), and (c) the difference between both periods (Future-Historical).
The performance of WECs may vary depending on the topographic constraints and sea states, in such a way that just a portion of the total energy is converted into electric power. The power load factor (ε) was calculated for both devices to assess the total energy (in %) harvested under the different sea states. Figure 5 and Figure 6 show the power load factor for Pelamis and Aqua Buoy for the historical period (a) and the near future (b), and (c) the difference between both periods (Δε). The power load factor for Pelamis and Aqua Buoy presents maximum values (25% and 30%, respectively) at ocean locations north of 43.5° N and low values nearshore both for historical and near-future periods (Figure 5a,b and Figure 6a,b). Although the ε pattern is similar for both periods, differences can be highlighted in terms of the Δε parameter (Figure 5c and Figure 6c). The Pelamis power load factor will remain practically unchanged (<0.5% in absolute value) (Figure 5c), with the exception of the region north of 43.5° N, where reductions between −1% and −1.5% are expected. The Aqua Buoy power load factor will decrease between −1% and −2% across the region, as shown in Figure 5c.
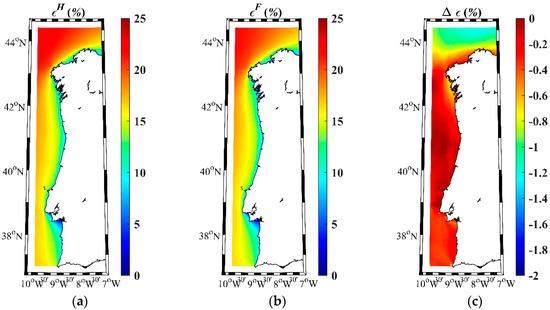
Figure 5.
Power load factor for Pelamis along the northwest Iberian Peninsula coast for (a) the historical period (1979–2005) and (b) the near future (2026–2045), and (c) the difference between both periods (Future-Historical).
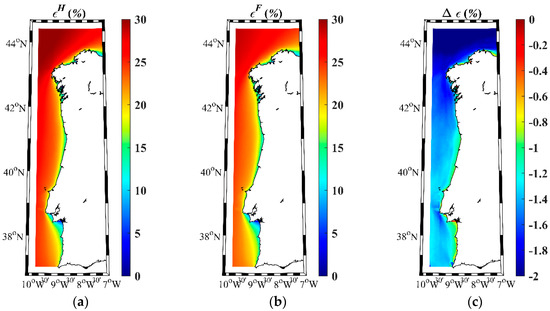
Figure 6.
Power load factor for Aqua Buoy along the northwest Iberian Peninsula coast for (a) the historical period (1979–2005) and (b) the near future (2026–2045), and (c) the difference between both periods (Future-Historical).
The second indicator of the efficiency of a WEC is the capture width (Cw), which represents the width of wave front where the energy is extracted by the WEC [29,43]. Low values correspond to a low efficiency of transforming the wave energy into electricity. The Cw of both wave devices shows higher values near the coast than at ocean locations both for the historical and future time periods. In addition, they also tend to increase southward. Cw values between 2.4 and 2.8 m were obtained for Pelamis (Figure 7a) and between 1.2 and 1.4 m for Aqua buoy (Figure 8a) during the historical period. The highest Cw values, 3 m for Pelamis and 1.5 m for Aqua Buoy, were obtained for a small region located on the north coast of Spain. Overall, the capture width will increase for the near future (Figure 7b and Figure 8b), showing a pattern similar to the one observed for the historical period but with higher Cw values, especially near the shore. The ΔCw ranges from 0.2 to 0.25 m between Roca Cape and Peña Cape for Pelamis (Figure 7c). The highest ΔCw is detected in Roca Cape, with values higher than 0.3 m. Aqua Buoy shows the same ΔCw pattern as Pelamis, although with a more modest increment (between 0.04 and 0.06 m). Aqua Buoy also shows a maximum ΔCw (~0.07 m) near Cape Roca (Figure 8c).
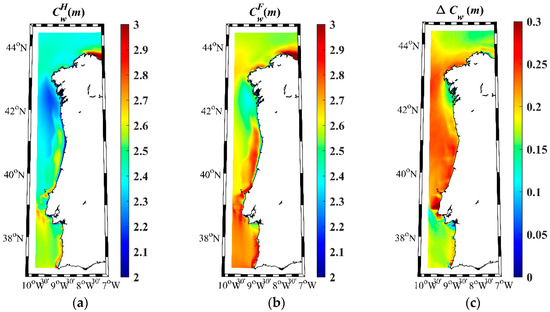
Figure 7.
Capture width for Pelamis along the northwest Iberian Peninsula coast for (a) the historical period (1979–2005) and (b) the near future (2026–2045), and (c) the difference between both periods (Future-Historical).
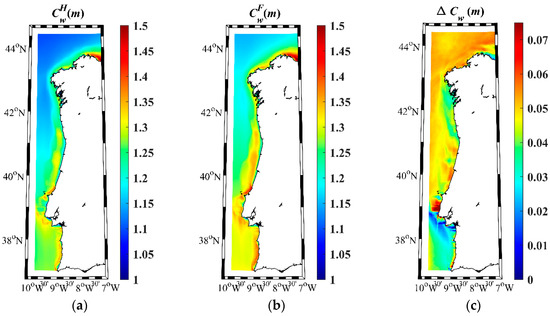
Figure 8.
Capture width for Aqua Buoy along the northwest Iberian Peninsula coast for (a) the historical period (1979–2005) and (b) the near future (2026–2045), and (c) the difference between both periods (Future-Historical).
As far as we know, little is known about the energy cost of WECs under future climate conditions. Here, the cost of energy for the near future will be calculated by considering the current capital (CA), operation, and maintenance (COM) costs and the generated energy during a life-cycle of 25 years, as described above (Equations (6) and (7)). Figure 9 and Figure 10 show the estimated cost of energy (CE) for Pelamis and Aqua Buoy, respectively. Costs are calculated for the historical period (a) and the near future (b). In addition, the cost increase between both periods is depicted in frame (c). The CE patterns are similar for both WECs, with higher values confined to the coast and lower values offshore. In general, the CE is higher for Pelamis (400–1000 EUR/MWh) than for Aqua Buoy (120–300 EUR/MWh) due to the lower production, operation, and maintenance costs. Pelamis shows a maximum ΔCE increase (>20 EUR/MWh) south of Cape Roca, between 42° N and Cape Finisterre, and in the northeast area (Figure 9c). Only in the ocean section between 39° N and 43° N is the cost of energy the same as at present. The Aqua Buoy ΔCE also increases in the same areas, with the exception of the northeast region.
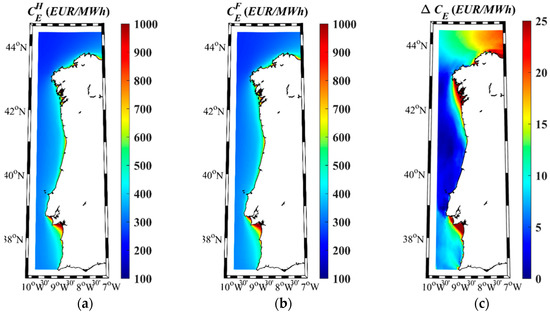
Figure 9.
Cost of energy for Pelamis along the northwest Iberian Peninsula coast for (a) the historical period (1979–2005) and (b) the near future (2026–2045). Frame (c) represents the increase in cost between both periods (Future-Historical).
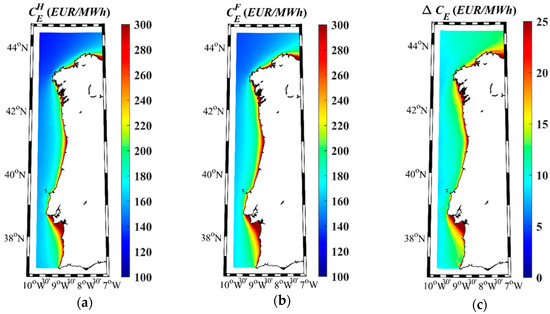
Figure 10.
Cost of energy for Aqua Buoy along the northwest Iberian Peninsula coast for (a) the historical period (1979–2005) and (b) the near future (2026–2045). Frame (c) represents the increase in cost between both periods (Future-Historical).
4. Conclusions
The main novelty of this study is that the electric power capacity, the efficiency, and the cost of energy of WECs were calculated both for the present and near future. The calculations were performed for the entire domain (from 37.01° N to 44.43° N and from 7° W to 9.88° W) and not only at certain points, as carried out in previous studies in the same area. The SWAN model was used to provide high spatial resolution (~0.037° × 0.037°) in a fringe ~100 km-wide along the west coast of Iberia, resulting in around 7000 points that constitute possible locations to install WEC farms. The study provides then a very detailed picture on the most suitable locations to moor a particular device both at present and in the near future. The main conclusions on the impact of projected changes on the efficiency of WECs along the west coast of Iberia for the near future under the RCP 8.5 can be summarized as follows:
First, the study highlighted a decrease in the wave power resource for the near future throughout the domain, which is more intense in the northern corner of the Iberian Peninsula, where the highest wave power resource was detected both for the historical and the future period.
The electric power capacity follows the same spatial pattern as the wave power resource across the region both for the Pelamis and Aqua Buoy devices. The maximum decrease in electric power for the near future was detected at ocean locations in the northern part both for Pelamis (decrease > 10 kW) and Aqua Buoy (decrease ~7 kW). South of 43° N, Pelamis shows a negligible decrease, while Aqua Buoy shows a decrease ranging from 2.4 kW to 4.5 kW, which is the lowest decrease observed at southern locations.
The power load factor for Pelamis will remain practically unchanged (<0.5% in absolute value) throughout the area, except for the region north of 43.5° N, where reductions between 1% and 1.5% are expected. The power load factor for the Aqua Buoy will decrease between 1% and 2% across the region.
The capture width will increase from 0.2 to 0.25 m between Cape Roca and Cape Peña for Pelamis. The greatest increase is detected in Cape Roca, with values greater than 0.3 m. Aqua Buoy shows the same spatial distribution for the capture width as Pelamis, although with a more modest increase (between 0.04 and 0.06 m). Aqua Buoy also will show a maximum increase (~0.07 m) near Cape Roca.
The cost of energy was projected to increase in the near future for the entire region for both devices mainly due to the decrease in the electric power (PE). A maximum increase nearshore south of Cape Roca and Cape Finisterre was projected for both devices. In addition, a noticeable future increase in CE is also observed in the northeast area for Pelamis.
The results have shown that the efficiency of the different devices is not only dependent on the wave resource at a certain study area but also on the relationship between the sea states and the power matrix of the WECs that can operate in that area. The projected changes in wave parameters that affect wave resources can be magnified or softened depending on the particular features of the device. The electric power capacity and its derived parameters (the power load factor and the capture width) have shown to be the pertinent variables to be considered to analyze the current and near future efficiency of the different converters.
In summary, this work provides a valuable methodology to analyze the projected changes in efficiency for different WECs along any coastal domain under different climate change scenarios. In addition, the estimation of energy cost in the future for different devices constitutes an added value of the study that allows assessing the economic viability of wave farms under future climate conditions.
Author Contributions
Conceptualization, A.S.R., M.G.-G. and M.d.; methodology, L.R., M.B. and M.G.-G.; software, A.S.R. and M.G-G.; validation, L.R. and M.B.; formal analysis, A.S.R., M.d., L.R., M.B. and M.G.-G.; investigation, A.S.R.; writing—original draft preparation, A.S.R.; writing—review and editing, A.S.R., M.d., L.R., M.B., M.G.-G. and J.M.D.; visualization, M.d., L.R., M.B. and J.M.D.; supervision, M.d., J.M.D. and M.G-G.; funding acquisition, J.M.D. and M.G.-G. All authors have read and agreed to the published version of the manuscript.
Funding
The first author of this work has been supported by the Portuguese Science Foundation (FCT) through a doctoral grant (SFRH/BD/114919/2016). Thanks are due to FCT/MCTES for the financial support to CESAM (UIDB/50017/2020+UIDP/50017/2020), through national funds. This work was partially supported by Xunta de Galicia under project ED431C 2017/64-GRC (Grupos de Referencia Competitiva) and by Ministry of Economy and Competitiveness of the Government of Spain under the project “WELCOME ENE2016-75074-C2-1-R” funded by European Regional Development Fund (ERDF). This work was also partially supported by the project CLIMENA—CLimate change Impacts on the Marine Environment of the North Atlantic—funded by the Portuguese Foundation for Science and Technology (FCT- Fundação Portuguesa para a Ciência e a Tecnologia) under contract n.°: PTDC/EAM_OCE/28561/2017. The present study is also part of the project “WECAnet: A pan-European network for Marine Renewable Energy” (CA17105), which received funding from the HORIZON2020 Framework Programme by COST (European Cooperation in Science and Technology), a funding agency for research and innovation networks.
Conflicts of Interest
The authors declare no conflict of interest. The funders had no role in the design of the study; in the collection, analysis, or interpretation of data; in the writing of the manuscript; or in the decision to publish the results
References
- Pelc, R.; Fujita, R.M. Renewable energy from the ocean. Mar. Policy 2002, 26, 471–479. [Google Scholar] [CrossRef]
- Diaconu, S.; Rusu, E. The Environmental Impact of a Wave Dragon Array Operating in the Black Sea. Sci. World J. 2013, 2013, 1–20. [Google Scholar] [CrossRef] [PubMed]
- Zanopol, A.T.; Onea, F.; Rusu, E. Coastal impact assessment of a generic wave farm operating in the Romanian nearshore. Energy 2014, 72, 652–670. [Google Scholar] [CrossRef]
- Zanopol, A.T.; Onea, F.; Rusu, E. Evaluation of the coastal influence of a generic wave farm operating in the Romanian nearshore. J. Environ. Prot. Ecol. 2014, 15, 597–605. [Google Scholar]
- Rusu, E.; Guedes Soares, C. Coastal impact induced by a Pelamis wave farm operating in the Portuguese nearshore. Renew. Energy 2013, 58, 34–49. [Google Scholar] [CrossRef]
- Bento, A.R.; Rusu, E.; Martinho, P.; Guedes Soares, C. Assessment of the changes induced by a wave energy farm in the nearshore wave conditions. Comput. Geosci. 2014, 71, 50–61. [Google Scholar] [CrossRef]
- Silva, D.; Rusu, E.; Guedes Soares, C. The Effect of a Wave Energy Farm Protecting an Aquaculture Installation. Energies 2018, 11, 2109. [Google Scholar] [CrossRef]
- Cornett, A. A global wave energy resource assessment. In Proceedings of the Sea Technology, Vancouver, BC, Canada, 6–11 July 2008; p. 9. [Google Scholar]
- Zheng, C.W.; Wang, Q.; Li, C.Y. An overview of medium- to long-term predictions of global wave energy resources. Renew. Sustain. Energy Rev. 2017, 79, 1492–1502. [Google Scholar] [CrossRef]
- Rusu, L.; Onea, F. Assessment of the performances of various wave energy converters along the European continental coasts. Energy 2015. [Google Scholar] [CrossRef]
- Rusu, L.; Onea, F. The performance of some state-of-the-art wave energy converters in locations with the worldwide highest wave power. Renew. Sustain. Energy Rev. 2017, 75, 1348–1362. [Google Scholar] [CrossRef]
- Siegel, S.G. Numerical benchmarking study of a Cycloidal Wave Energy Converter. Renew. Energy 2019. [Google Scholar] [CrossRef]
- Rosa-Santos, P.; Taveira-Pinto, F.; Rodríguez, C.A.; Ramos, V.; López, M. The CECO wave energy converter: Recent developments. Renew. Energy 2019, 139, 368–384. [Google Scholar] [CrossRef]
- Silva, D.; Rusu, E.; Guedes Soares, C. Evaluation of Various Technologies for Wave Energy Conversion in the Portuguese Nearshore. Energies 2013, 6, 1344–1364. [Google Scholar] [CrossRef]
- Gonçalves, M.; Martinho, P.; Guedes Soares, C. Assessment of wave energy in the Canary Islands. Renew. Energy 2014, 68, 774–784. [Google Scholar] [CrossRef]
- Bento, A.R.; Martinho, P.; Guedes Soares, C. Wave energy assessement for Northern Spain from a 33-year hindcast. Renew. Energy 2018, 127, 322–333. [Google Scholar] [CrossRef]
- World Ocean Review: Renewable Energies. Available online: https://worldoceanreview.com/en/wor-1/energy/renewable-energies/ (accessed on 23 June 2020).
- Reguero, B.G.; Losada, I.J.; Méndez, F.J. A global wave power resource and its seasonal, interannual and long-term variability. Appl. Energy 2015. [Google Scholar] [CrossRef]
- Lin, Y.; Dong, S.; Wang, Z.; Guedes Soares, C. Wave energy assessment in the China adjacent seas on the basis of a 20-year SWAN simulation with unstructured grids. Renew. Energy 2019, 136, 275–295. [Google Scholar] [CrossRef]
- Appendini, C.M.; Urbano-Latorre, C.P.; Figueroa, B.; Dagua-Paz, C.J.; Torres-Freyermuth, A.; Salles, P. Wave energy potential assessment in the Caribbean Low Level Jet using wave hindcast information. Appl. Energy 2015, 137, 375–384. [Google Scholar] [CrossRef]
- López, M.; Veigas, M.; Iglesias, G. On the wave energy resource of Peru. Energy Convers. Manag. 2015, 90, 34–40. [Google Scholar] [CrossRef]
- Guedes Soares, C.; Bento, A.R.; Gonçalves, M.; Silva, D.; Martinho, P. Numerical evaluation of the wave energy resource along the Atlantic European coast. Comput. Geosci. 2014, 71, 37–49. [Google Scholar] [CrossRef]
- Silva, D.; Bento, A.R.; Martinho, P.; Guedes Soares, C. High resolution local wave energy modelling in the Iberian Peninsula. Energy 2015, 91, 1099–1112. [Google Scholar] [CrossRef]
- Bernardino, M.; Rusu, L.; Guedes Soares, C. Evaluation of the wave energy resources in the Cape Verde Islands. Renew. Energy 2017, 101, 316–326. [Google Scholar] [CrossRef]
- Ulazia, A.; Penalba, M.; Rabanal, A.; Ibarra-Berastegi, G.; Ringwood, J.; Sáenz, J. Historical Evolution of the Wave Resource and Energy Production off the Chilean Coast over the 20th Century. Energies 2018, 11, 2289. [Google Scholar] [CrossRef]
- Silander, M.F.C.; Moreno, C.G.G. On the spatial distribution of the wave energy resource in Puerto Rico and the United States Virgin Islands. Renew. Energy 2019, 136, 442–451. [Google Scholar] [CrossRef]
- Rusu, L.; Guedes Soares, C. Wave energy assessments in the Azores islands. Renew. Energy 2012, 45, 183–196. [Google Scholar] [CrossRef]
- Haces-Fernandez, F.; Li, H.; Ramirez, D. Wave energy characterization and assessment in the U.S. Gulf of Mexico, East and West Coasts with Energy Event concept. Renew. Energy 2018, 123, 312–322. [Google Scholar] [CrossRef]
- Gonçalves, M.; Martinho, P.; Guedes Soares, C. A 33-year hindcast on wave energy assessment in the western French coast. Energy 2018, 165, 790–801. [Google Scholar] [CrossRef]
- Lisboa, R.C.; Teixeira, P.R.F.; Fortes, C.J. Numerical evaluation of wave energy potential in the south of Brazil. Energy 2017, 121, 176–184. [Google Scholar] [CrossRef]
- Hemer, M.A.; Zieger, S.; Durrant, T.; O’Grady, J.; Hoeke, R.K.; McInnes, K.L.; Rosebrock, U. A revised assessment of Australia’s national wave energy resource. Renew. Energy 2017, 114, 85–107. [Google Scholar] [CrossRef]
- Silva, D.; Rusu, E.; Guedes Soares, C. High-Resolution Wave Energy Assessment in Shallow Water Accounting for Tides. Energies 2016, 9, 761. [Google Scholar] [CrossRef]
- Besio, G.; Mentaschi, L.; Mazzino, A. Wave energy resource assessment in the Mediterranean Sea on the basis of a 35-year hindcast. Energy 2016, 94, 50–63. [Google Scholar] [CrossRef]
- Emmanouil, G.; Galanis, G.; Kalogeri, C.; Zodiatis, G.; Kallos, G. 10-year high resolution study of wind, sea waves and wave energy assessment in the Greek offshore areas. Renew. Energy 2016, 90, 399–419. [Google Scholar] [CrossRef]
- Harrison, G.P.; Wallace, A.R. Sensitivity of Wave Energy to Climate Change. IEEE Trans. Energy Convers. 2005, 20, 870–877. [Google Scholar] [CrossRef]
- López-Ruiz, A.; Bergillos, R.J.; Ortega-Sánchez, M. The importance of wave climate forecasting on the decision-making process for nearshore wave energy exploitation. Appl. Energy 2016, 182, 191–203. [Google Scholar] [CrossRef]
- Rusu, L. Evaluation of the near future wave energy resources in the Black Sea under two climate scenarios. Renew. Energy 2019. [Google Scholar] [CrossRef]
- Snyder, B.; Kaiser, M.J. Ecological and economic cost-benefit analysis of offshore wind energy. Renew. Energy 2009, 34, 1567–1578. [Google Scholar] [CrossRef]
- Castro-Santos, L.; Bento, A.; Guedes Soares, C. The Economic Feasibility of Floating Offshore Wave Energy Farms in the North of Spain. Energies 2020, 13, 806. [Google Scholar] [CrossRef]
- Castro-Santos, L.; Martins, E.; Guedes Soares, C. Methodology to Calculate the Costs of a Floating Offshore Renewable Energy Farm. Energies 2016, 9, 324. [Google Scholar] [CrossRef]
- Callaghan, J.; Boud, R. Future Marine Energy: Results of the Marine Energy Challenge: Cost competitiveness and growth of wave and tidal stream energy. Carbon Trust 2006. [Google Scholar]
- Bosserelle, C.; Reddy, S.; Krüger, J. Waves and Coasts in the Pacific—Cost Analysis of Wave Energy in the Pacific; Pacific Community (SPC): Fiji Islands, The Republic of Fiji, 2015; ISBN 978-982-00-0944-8. [Google Scholar]
- Castro-Santos, L.; Martins, E.; Guedes Soares, C. Economic comparison of technological alternatives to harness offshore wind and wave energies. Energy 2017, 140, 1121–1130. [Google Scholar] [CrossRef]
- Castro-Santos, L.; Silva, D.; Bento, A.; Salvação, N.; Guedes Soares, C. Economic Feasibility of Wave Energy Farms in Portugal. Energies 2018, 11, 3149. [Google Scholar] [CrossRef]
- Valentim, J.M.; Vaz, N.; Silva, H.; Duarte, B.; Caçador, I.; Dias, J.M. Tagus estuary and Ria de Aveiro salt marsh dynamics and the impact of sea level rise. Estuar. Coast. Shelf Sci. 2013, 130, 138–151. [Google Scholar] [CrossRef]
- Silva, D.; Martinho, P.; Guedes Soares, C. Wave energy distribution along the Portuguese continental coast based on a thirty three years hindcast. Renew. Energy 2018, 127, 1064–1075. [Google Scholar] [CrossRef]
- Rusu, E. Evaluation of the Wave Energy Conversion Efficiency in Various Coastal Environments. Energies 2014, 7, 4002–4018. [Google Scholar] [CrossRef]
- Bernardino, M.; Guedes Soares, C. Evaluating marine climate change in the Portuguese coast during the 20th century. In Maritime Transportation and Harvesting of Sea Resources; Guedes Soares, C., Teixeira, A.P., Eds.; Taylor & Francis: London, UK, 2018; pp. 1089–1095. [Google Scholar]
- Bernardino, M.; Silva, D.; Guedes Soares, C. Evaluating Trends and Variability in Portuguese Coastal Wave Energy Potential Using a 22 Years High Resolution Hindcast; Guedes Soares, C., Santos, T.A., Eds.; Developments in Maritime Technology and Engineering: London, UK; Taylor and Francis: London, UK, 2020. [Google Scholar]
- Farkas, A.; Degiuli, N.; Martić, I. Assessment of Offshore Wave Energy Potential in the Croatian Part of the Adriatic Sea and Comparison with Wind Energy Potential. Energies 2019, 12, 2357. [Google Scholar] [CrossRef]
- Astariz, S.; Iglesias, G. Enhancing Wave Energy Competitiveness through Co-Located Wind and Wave Energy Farms. A Review on the Shadow Effect. Energies 2015, 8, 7344–7366. [Google Scholar] [CrossRef]
- Taylor, K.E.; Stouffer, R.J.; Meehl, G.A. An Overview of CMIP5 and the Experiment Design. Bull. Am. Meteorol. Soc. 2012, 93, 485–498. [Google Scholar] [CrossRef]
- Moss, R.H.; Edmonds, J.A.; Hibbard, K.A.; Manning, M.R.; Rose, S.K.; van Vuuren, D.P.; Carter, T.R.; Emori, S.; Kainuma, M.; Kram, T.; et al. The next generation of scenarios for climate change research and assessment. Nature 2010, 463, 747–756. [Google Scholar] [CrossRef]
- van Vuuren, D.P.; Edmonds, J.; Kainuma, M.; Riahi, K.; Thomson, A.; Hibbard, K.; Hurtt, G.C.; Kram, T.; Krey, V.; Lamarque, J.-F.; et al. The representative concentration pathways: An overview. Clim. Chang. 2011, 109, 5–31. [Google Scholar] [CrossRef]
- SWAN. SWAN User Manual Version 41.31; Delft University of Technology, Environmental Fluid Mechanics Section: Delft, The Netherlands, 2019; p. 143. Available online: http://swanmodel.sourceforge.net/ (accessed on 23 June 2020).
- Deltares. Delft3D-WAVE Simulation of Short-Crested Waves with SWAN User Manual; Version: 3.05; Deltares: Delft, The Netherlands, 2020. [Google Scholar]
- IEC (International Electrotechnical Commission). Marine Energy—Wave, Tidal and Other Water Current Converters—Part 101: Wave energy resource assessment and caracterization; IEC TS 62600-101; Edition 1.0.2015-06; International Electrotechnical Commission: Geneva, Switzerland, 2015. [Google Scholar]
- Ramos, V.; Carballo, R.; Ringwood, J.V. Assessing the utility and effectiveness of the IEC standards for wave energy resource characterisation. In Progress in Renewable Energies Offshore: Proceedings of the 2nd International Conference on Renewable Energies; Taylor Fr. Gr.: London, UK, 2016; pp. 27–36. [Google Scholar] [CrossRef]
- Durrant, T.; Hemer, M.; Trenham, C.; Greenslade, D. CAWCR Wave Hindcast 1979–2010. v8; Service Collection; CSIRO: Canberra, Australia, 2013. [Google Scholar] [CrossRef]
- Perkins, S.E.; Pitman, A.J.; Holbrook, N.J.; McAneney, J. Evaluation of the AR4 climate models’ simulated daily maximum temperature, minimum temperature, and precipitation over Australia using probability density functions. J. Clim. 2007, 20, 4356–4376. [Google Scholar] [CrossRef]
- EURO-CORDEX—Coordinated Downscaling Experiment—European Domain. Available online: https://www.euro-cordex.net/ (accessed on 23 June 2020).
- Santos, F.; Gómez-Gesteira, M.; DeCastro, M.; Añel, J.A.; Carvalho, D.; Costoya, X.; Dias, J.M. On the accuracy of CORDEX RCMs to project future winds over the Iberian Peninsula and surrounding ocean. Appl. Energy 2018, 228, 289–300. [Google Scholar] [CrossRef]
- Pastor, J.; Liu, Y. Wave Energy Resource Analysis for Use in Wave Energy Conversion. J. Offshore Mech. Arct. Eng. 2015, 137, 011903-1. [Google Scholar] [CrossRef]
- Sierra, J.P.; Casas-Prat, M.; Campins, E. Impact of climate change on wave energy resource: The case of Menorca (Spain). Renew. Energy 2017. [Google Scholar] [CrossRef]
- Astariz, S.; Iglesias, G. The collocation feasibility index—A method for selecting sites for co-located wave and wind farms. Renew. Energy 2017. [Google Scholar] [CrossRef]
- Aderinto, T.; Li, H. Review on Power Performance and Efficiency of Wave Energy Converters. Energies 2019, 12, 4329. [Google Scholar] [CrossRef]
- Piscopo, V.; Benassai, G.; Della Morte, R.; Scamardella, A. Cost-Based Design and Selection of Point Absorber Devices for the Mediterranean Sea. Energies 2018, 11, 946. [Google Scholar] [CrossRef]
- Energy Systems Research Unit. Available online: www.esru.strath.ac.uk (accessed on 26 June 2020).
- Mota, P.; Pinto, J.P. Wave energy potential along the western Portuguese coast. Renew. Energy 2014, 71, 8–17. [Google Scholar] [CrossRef]
- Reguero, B.G.; Losada, I.J.; Méndez, F.J. A recent increase in global wave power as a consequence of oceanic warming. Nat. Commun. 2019. [Google Scholar] [CrossRef]
- Kim, C.-K.; Toft, J.E.; Papenfus, M.; Verutes, G.; Guerry, A.D.; Ruckelshaus, M.H.; Arkema, K.K.; Guannel, G.; Wood, S.A.; Bernhardt, J.R.; et al. Catching the Right Wave: Evaluating Wave Energy Resources and Potential Compatibility with Existing Marine and Coastal Uses. PLoS ONE 2012, 7, e47598. [Google Scholar] [CrossRef] [PubMed]
© 2020 by the authors. Licensee MDPI, Basel, Switzerland. This article is an open access article distributed under the terms and conditions of the Creative Commons Attribution (CC BY) license (http://creativecommons.org/licenses/by/4.0/).