Article

A BEM for the Hydrodynamic Analysis of Oscillating Water Column Systems in Variable Bathymetry

by
Kostas Belibassakis
1,
Alexandros Magkouris
1 and
Eugen Rusu
2,*
1
School of Naval Architecture & Marine Engineering, National Technical University of Athens, Heroon Polytechniou 9, 15780 Zografou, Greece
2
Department of Mechanical Engineering, University Dunarea de Jos of Galati, Strada Domnească 47, 800008 Galați, Romania
*
Author to whom correspondence should be addressed.
Energies 2020, 13(13), 3403; https://doi.org/10.3390/en13133403
Submission received: 1 June 2020 / Revised: 18 June 2020 / Accepted: 28 June 2020 / Published: 2 July 2020
(This article belongs to the Special Issue Advances and Challenges in Harvesting Ocean Energy)

Abstract

:
In this work, a novel Boundary Element Method (BEM) is developed and applied to the investigation of the performance of Oscillating Water Column (OWC) systems, taking into account the interaction of the incident wave field with the bottom topography. The modelling includes the effect of additional upwave walls and barriers used to modify the resonance characteristics of the device and improve its performance as the U-OWC configuration. Numerical results illustrating the effects of depth variation in conjunction with other parameters—such as chamber dimensions as well as the parameters associated with the turbine and power take-off system—on the device performance are presented and discussed. Finally, a case study is presented regarding the potential installation of an OWC in a selected port site in the Black Sea, characterized by a good wave energy potential, on the coast of Romania.

1. Introduction

The extensive use of fossil fuels by modern civilization has led to disruptions of the planet’s natural circles via the accumulation of greenhouse gases in the atmosphere. The pressure for more regulations regarding the emissions is intense. Climate change and global warming concerns, in conjunction with the continuing fall in the costs of certain renewable energy equipment, such as wind turbines and solar panels, are driving the increased use of renewables. Wave energy is one of the renewable energy forms that has not yet developed to such an extent as a result of a combination of factors, such as the associated economic risks as well as technical barriers like the energy-capturing devices’ survivability, accessibility, and maintenance. The Oscillating Water Column (OWC) is one of the wave-energy-converting concepts that has been extensively studied in real conditions via prototype devices—see, e.g., [1,2]. This has led the OWC to relative commercial maturity.
An OWC system is essentially a chamber, which is a fixed structure with its lower part open to the sea water. The water’s free surface motion inside the chamber, due to wave propagation, alternatively compresses and decompresses the air that is trapped above the water level inside the chamber. The fluid’s movement forces the column to act like a piston, resulting in the generation of an alternating stream of air which is then channeled through a Power-Take-Off (PTO) System. The PTO must be able to convert the bidirectional airflow into beneficial work, which is usually achieved by means of bidirectional turbines. Although floating OWC plants are being studied as well, fixed structure OWCs are, by nature, shoreline devices and thus operate in shallow water regions. As a result, the effects caused to their response due to the presence of bathymetric inhomogeneities could be significant and need to be accounted for. This has been illustrated in the case of WEC point absorbers—e.g., [3,4]—as well as surge-type devices [5] operating in variable bathymetry regions, for which Boundary Element Method (BEM) models have been developed; it is shown that the bottom slope and curvature could alter the performance curves of the systems, especially in shallow water conditions.
In the present work, a novel BEM is developed and applied to the investigation of the performance of the Oscillating Water Column, taking into account the interaction of the incident wave field with the variable seabed topography in the upwave region. For simplicity, we restrict ourselves to the study of two-dimensional configurations and normally incident waves in the context of linear theory. From this perspective, the next section (Section 2) presents a BEM for a coupled hydrodynamic-thermodynamic analysis of OWC in variable bathymetry. Besides the general theoretical background associated with the approach considered, this section includes a description of the discrete BEM model, as well as examples of model application in uniform depth regions. Further on, in Section 3 the effects of the seabed profile inhomogeneities are analyzed and discussed, while in Section 4 an alternative OWC configuration (U-OWC) is considered. This U-OWC is essentially an OWC which includes an additional vertical U-shaped duct for connecting the water column in the chamber to the open sea. In Section 5 of this work, a case study is presented regarding the potential installation of the OWC in a selected port site in the Black Sea, characterized by a relatively increased wave energy potential, on the coast of Romania. Using the latter data, power performance measures are derived that can be further exploited for a levelized energy cost analysis. Finally, in the conclusion section, a discussion concerning the validity and shortcomings of the present simplified analysis is included, especially as concerns the three-dimensional and real fluid effects, which will be treated in future work.
Although the present simplified BEM model does not fully treat the three-dimensional effects, as well as non-linearity effects, it still provides useful information, especially as concerns the variable bathymetry effects on the performance of the device. The modelling includes the effect of additional walls and barriers, studied in [6,7], which are used in front of the chamber to modify the resonance characteristics of the device and improve its performance; more details concerning the U-OWC device can be found in [7] and the references cited therein. Numerical results illustrating the effects of depth variation in conjunction with other parameters—such as chamber dimensions as well as parameters associated with the turbine and power take-off system—on the device’s performance are presented and discussed, including directions for further research

2. A BEM for Coupled Hydrodynamic-Thermodynamic Analysis of OWC in Variable Bathymetry

In this work, a two-dimensional BEM model is presented for the analysis of a simplified OWC system in the case of normally incident waves in variable bathymetry, examined in the context of linearized wave theory. In the first part, the treatment of wave hydrodynamics is presented, and subsequently the modelling of the OWC chamber and Wells turbine dynamics is described. The discrete BEM model is then presented in detail, and finally its application in variable bathymetry regions is discussed.

2.1. Modelling of Wave Hydrodynamics

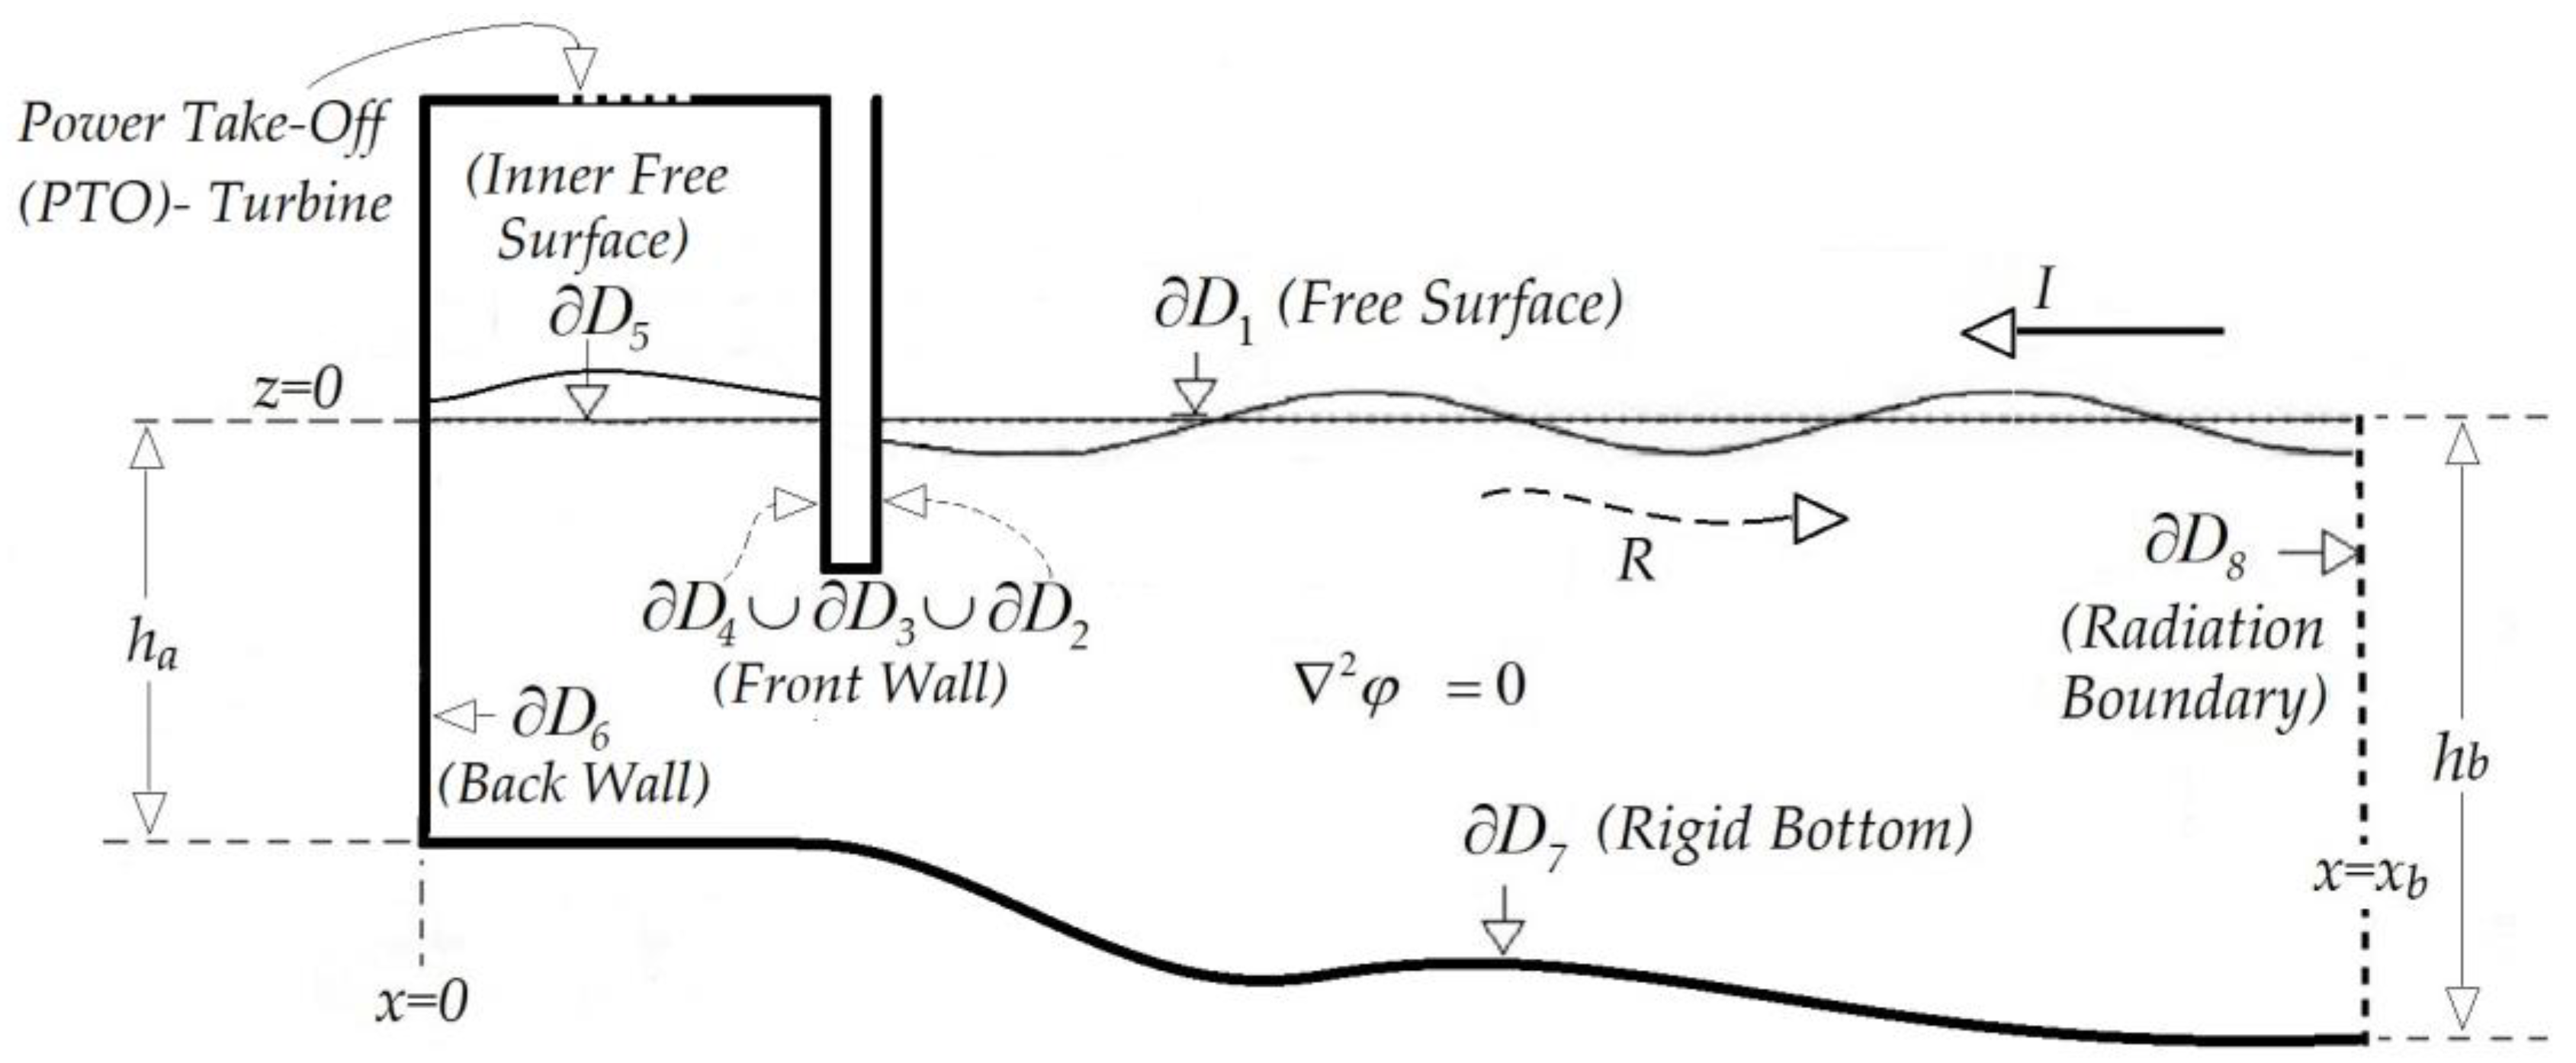
In particular, a left horizontally semi-infinite domain is considered D = { x α < x ,   h ( x ) < z < 0 } , as depicted in Figure 1. Without a loss of generality, the domain is set to start at the horizontal position x a = 0 , which has been chosen to coincide with the horizontal position of the OWC chamber’s back wall, where the depth is constant ( h = h a ) . Moreover, it is assumed that the water depth remains constant in the far upwave region ( h = h b ) , which permits us to derive an appropriate incidence-radiation condition on a vertical interface at a point x = x b in the constant-depth region of wave incidence, where evanescent modes have died out. The latter enables the truncation of the domain into a finite part D and solving the problem by standard boundary integral equation methods. The present BEM is based on approximating the under-study domain’s boundary by linear elements/panels carrying simple source-sink distributions, following a low-order BEM; see, e.g., [8]. We assume the harmonic time dependence for the wave potential and water elevation Φ ( x , z , t ) = e ( φ ( x , z ) exp ( i ω t ) ) ,   η ( x , t ) = e ( η ( x ) exp ( i ω t ) ) , and the complex wave potential is represented by:
φ ( x ) = D σ ( x 0 ) G ( x | x 0 ) d S ( x 0 ) ,
where G ( x | x 0 ) = ( 2 π ) 1 l n x x 0 is the fundamental solution of the Laplace equation in the two-dimensional space; x(x,z) is a general field point in the domain; x 0 ( x , z ) indicates the singularity point; σ ( x 0 ) is the unknown source-sink function, which is assumed to be piecewise constant on each element; and D = i = 1 8 D i denotes the boundary of the domain, decomposed into eight sections as presented in Figure 1: the free surface ( D 1 ) , the device’s front wall ( D 2 D 3 D 4 ) , the water’s free surface inside the OWC’s chamber ( D 5 ) , the back wall ( D 6 ) , the seabed ( D 7 ) , and the vertical interface ( D 8 ) serving as an incidence-radiation boundary.
Excluding, for the moment, the inner water surface in the OWC chamber D 5 and the radiation interface D 8 , whose Boundary Conditions (BCs) will be analyzed in the sequel, the linearized Free-Surface Boundary Condition (FSBC) applies to the free surface out of the OWC’s chamber, while Newman BCs apply to the rest of the sub-boundaries, imposing that the normal velocity is zero:
φ n ω 2 g φ = 0 ,   on   D 1 ,   and   φ n = 0 ,   on   D 2 , 3 , 4 , 6 , 7
where φ / n denotes the normal derivative of the wave potential on the boundary with respect to the outward-directed normal unit vector n , and g stands for the gravitational acceleration.
Assuming that the evanescence modes have died out at the horizontal position x = x b , well within the constant-depth wave incidence subregion, the complex wave potential is expressed by means of the propagating mode only, as follows:
Φ ( x , z ) = Q φ ( x , z ) ,   φ ( x , z ) = [ exp ( i k 0 x ) + R exp ( i k 0 x ) ] Z 0 ( b ) ( z ) ,   x x b ,
where Q = i g H / ( 2 ω ) is used to normalize the wave potential and H is the incident wave height. Furthermore, R denotes the reflection coefficient and k 0 is the wavenumber corresponding to the propagating mode obtained as the real root of the dispersion relation formulated at h = h b :
ω 2 = k 0 g tanh ( k 0 h b ) ,
and Z 0 ( b ) ( z ) = cosh ( k 0 ( z + h b ) ) / cosh ( k 0 h b ) denotes the vertical structure of the propagating mode. Using Equation (3), the horizontal wave velocity is calculated by the partial x-derivative of the normalized complex wave potential φ at x = x b as follows:
φ x | x b = [ i k 0 R exp ( i k 0 x b ) i k 0 exp ( i k 0 x b ) ] Z 0 ( b ) ( z )
The vertical eigenfunctions { Z n ( b ) ( z ) , n = 0 , 1 , 2 , } are derived from the solution of the Sturm–Liouville problem, to which the Laplace equation is reduced in the constant depth fluid channel h < Z < 0 ,   x x b . The latter are Z 0 ( b ) ( z ) ,   Z n ( b ) ( z )   = cos ( k n ( z + h b ) ) / cos ( k n h b ) ,   n = 1 , 2 , , with the corresponding parameters i k n ,   n = 1 , 2 , , obtained as the imaginary roots of the dispersion relation (4) formulated at h = h b . According to the Sturm–Liouville theory—see, e.g., [9]—the subspace spanned by the sequence of the eigenmodes { Z n ( b ) ( z ) , n = 0 , 1 , 2 , } forms an orthogonal basis of the Hilbert space L 2 [ h b , 0 ] . By projecting the two members of Equation (3) in the above orthogonal vertical basis, we obtain an expression of the reflection coefficient as a function of the complex wave potential in the water column at x = x b :
R = φ ( x b , z ) , Z 0 ( b ) Z 0 ( b ) 2 exp ( i k 0 x b ) exp ( 2 i k 0 x b )
where f 1 ( z ) , f 2 ( z ) = z = h b z = 0 f 1 ( z ) f 2 ( z )   d z and f 2 = f ( z ) , f ( z ) .
The substitution of the latter into Equation (4) results in the following radiation condition, which applies to the incidence-radiation interface:
φ n i k 0 φ ( x b , z ) , Z 0 ( b ) Z 0 ( b ) 2 Z 0 ( b ) ( z ) = 2 i k 0 exp ( i k 0 x b ) Z 0 ( b ) ( z ) ,   on   D 8

2.2. Modelling of OWC Chamber and Wells Turbine Dynamics

In addition to the hydrodynamic part, the operation of an OWC consists of a thermodynamic part as well. The latter can be modelled using an air pocket dynamics approach (see Figure 2). Due to air compressibility, the density of the air mass enclosed within the chamber will be time-dependent, as will its volume and pressure. However, the analysis can be significantly simplified by assuming the isentropic compression and decompression of the air mass during operation. The following analysis is partly based on the model presented and discussed in [7].
Based on the air pocket representation depicted in Figure 2a, the air volume inside the chamber and its rate of change are given by:
V ( t ) = b L [ h c A ( t ) ] , V ˙ ( t ) = b L A ˙ ( t ) ,   where   A ( t ) = 1 b x = 0 x = b η ( x ; t ) d x ,
with η ( x ; t ) denoting the time-dependent water elevation inside the chamber, while b ,   h c stand for the horizontal and vertical dimensions of the chamber, respectively, and L denotes the length to which the OWC configuration extends in the transverse direction. Assuming isentropic thermodynamic processes, the relation that connects the air density ρ ( t ) and the air pressure P c ( t ) in the chamber reads as [7]:
ρ ˙ ( t ) ρ ( t ) = 1 γ P ˙ c ( t ) P c ( t )
where γ is the heat capacity ratio of air. The air mass in the chamber is equal to M ( t ) = ρ ( t ) V ( t ) .
Therefore, by differentiating the air density with respect to time, we obtain:
ρ ˙ ( t ) = M ˙ ( t ) V ( t ) M ( t ) V ˙ ( t ) [ V ( t ) ] 2
The substitution of the expressions of ρ , ρ ˙ in Equation (10) results in:
M ˙ ( t ) = [ 1 γ P ˙ ( t ) P c ( t ) A ˙ ( t ) h c A ( t ) ] M ( t )
Furthermore, M ˙ ( t ) is equal to the opposite of the air mass rate m ˙ ( t ) flowing out of the chamber [7]. In this context, Equation (11) can be rewritten as:
m ˙ ( t ) = [ 1 γ P ˙ c ( t ) P c ( t ) A ˙ ( t ) h c A ( t ) ] ρ ( t ) V ( t ) P ˙ c ( t ) = γ P c ( t ) h c A ( t ) [ m ˙ ( t ) b L ρ ( t ) A ˙ ( t ) ]
Assuming the further isentropic compression and decompression of the air mass during the OWC’s operation, if P 0 , ρ 0 are the atmospheric pressure and density, respectively, Equation (14) can be expressed as follows:
P ˙ c ( t ) = γ P c ( t ) h c A ( t ) [ m ˙ ( t ) b L ρ ( t ) ρ 0 ρ 0 A ˙ ( t ) ] = γ P c ( t ) h c A ( t ) { m ˙ ( t ) b L ρ 0 [ P 0 P c ( t ) ] 1 γ A ˙ ( t ) }
The air pressure in the chamber is considered to be equal to the sum of the atmospheric pressure and the harmonically time-dependent term δ P c ( t ) :
P c ( t ) = P 0 + δ P c ( t ) ,   and   thus ,   P ˙ c ( t ) = δ P ˙ c ( t )
Thus, Equation (13) can be re-written as:
δ P ˙ c ( t ) = γ [ P 0 + δ P c ( t ) ] h c A ( t ) { m ˙ ( t ) b L ρ 0 [ P 0 P c ( t ) ] 1 γ A ˙ ( t ) }
Assuming further that | δ P c | < < P 0 , the above equation is approximated by dropping higher-order terms, and we obtain:
δ P ˙ c ( t ) = { γ P 0 h c A ( t ) [ m ˙ ( t ) b L ρ 0 A ˙ ( t ) ] + γ   δ P c ( t ) h c A ( t ) [ m ˙ ( t ) b L ρ 0 A ˙ ( t ) ] }
The above relation can be expressed in the frequency domain by introducing the complex amplitudes of the time-dependent variables:
i ω p ˜ = [ γ p ˜ h c A ˜ ( i ω m ˜ b L ρ 0 + i ω A ˜ ) + γ P 0 h c A ˜ ( i ω m ˜ b L ρ 0 + i ω A ˜ ) ]
where δ P c ( t ) = e [ p ˜ exp ( i ω t ) ] ,   A ( t ) = e [ A ˜ exp ( i ω t ) ] ,   m ( t ) = e [ m ˜ exp ( i ω t ) ] . A model which relates the air mass rate m ˙ ( t ) flowing through the turbine to the air pressure difference [ P c ( t ) P 0 ] can be obtained by using the turbine characteristics [7]. The latter can be linearized around the operating point, leading to the following expression involving the turbine flow-pressure head coefficient λ T :
m ˙ ( t ) = λ T [ P c ( t ) P 0 ] = λ T   δ P c ( t ) ,   and   thus ,   i ω m ˜ = λ T p ˜
Subsequently, by substituting the above result into Equation (17), we obtain:
λ T p ˜ 2 b L ρ 0 + i ω p ˜ A ˜ + λ T p ˜ P 0 b L ρ 0 + i ω A ˜ P 0 i ω p ˜ γ ( h c A ˜ ) = 0
Again, by neglecting the higher-order terms, the above equation is linearized in the form:
λ T p ˜ P 0 b L ρ 0 + i ω A ˜ P 0 i ω p ˜ h c γ = 0 ,
which provides us an approximate expression connecting the oscillatory amplitudes p ˜ and A ˜ :
p ˜ = i ω A ˜ P 0 ( i ω h c γ λ T P 0 b L ρ 0 ) 1
On the other hand, from Bernoulli’s equation in the water region in the OWC, the complex amplitude of the pressure in the chamber is p ˜ = i ω ρ φ ρ g η , where η denotes the corresponding surface elevation. The latter is related to the complex wave potential φ via the kinematic condition η ( x ) = ( 1 / i ω ) φ ( x , 0 ) / z . Since the complex amplitude of water piston motion, A ˜ , is defined as the mean elevation of the water surface inside the chamber,
A ˜ = η ˜ a v e r a g e = 1 i ω b x = 0 x = b φ z d x = 1 i ω φ z D 5
Based on the above, Equation (20) becomes:
i ω ρ w φ ρ g η = P 0 φ z D 5 ( i ω h c γ λ T P 0 ρ 0 b ) 1 ,
and is finally put in the form:
φ z ω 2 g φ = i ω ρ g w P 0 φ z D 5 ( i ω h c γ λ T P 0 b L ρ 0 ) 1
Therefore, the BC that applies to the water surface inside the OWC’s chamber is:
φ n ω 2 g φ C ( ω ) φ z D 5 = 0   on   D 5 ,   where   C ( ω ) = i ω P 0 ρ w g ( i ω h c γ λ T P 0 b L ρ 0 ) 1

2.3. Discrete BEM Model

The boundary of the domain D is discretized by a closed polygonal line. This is achieved by distributing nodes across its length. The node spacing is uniform across the sub-boundaries, excluding the free surface ( D 1 ) and the seabed ( D 7 ) , where cosine node spacing is utilized in order to achieve finer meshing approaching the vertical sides of the boundary, where the hydrodynamic interactions are expected to be stronger. The constant distance between the nodes of D in the uniformly meshed parts is selected to match the finer meshing achieved from the cosine spacing at the corners, as schematically shown in Figure 3. The discretization depicted in this figure is coarse for illustration purposes.
By assuming unit source-sink singularity strengths on each element, the induced potential and velocity matrices φ k j ,   U k j , k , j = 1 , , M , from each element to each collocation point is analytically calculated; see [6]. The collocation points are selected to coincide with the boundary elements’ midpoints. Using the latter quantities in the boundary conditions, the influence matrix A k j of the discrete system is obtained, as explained in more detail in the sequel. By denoting with σ j , the strength of the source/sink of the j-element and by b k the boundary data that apply to each control point, the resulting linear system is:
j = 1 M A k   j σ j = b k ,   k = 1 , 2 , , M
The construction of the BEM model is based on the expression of the BCs in discrete form. In the sequel, the number of elements distributed across the sub-border D i will be referred to as M i , while M = i = 1 , 8 M i is the total number of distributed boundary elements. The BC on the incidence-radiation interface (Equation (7)) is discretized as follows:
j = 1 M { ( n k U k j ) i k 0 [ a = M A + 1 M σ j φ α j δ z 8 Z 0 ( b ) ( z a ) ] Z 0 ( b ) ( z k ) } = b k ,   k = M A + 1 , M ,   M A = i = 1 7 M i
where b k = 2 i k 0 exp ( i k 0 x b ) Z 0 ( b ) ( z k ) are the boundary data associated with the incident wave on the incidence-radiation interface D 8 ; nk is the unit normal vector on the k-boundary element (directed outwards); and zk denotes the collocation point, located at the center of the k-element on D 8 . In the above expression, δ z 8 stands for the constant length of the boundary elements distributed across the radiation interface, while the auxiliary index α, spans the interval of indices corresponding to the elements distributed across D 8 and is used in order to approximate the integral involved in the BC by using the trapezoidal rule.
The BC on the free surface D 1 is discretized in the present BEM as follows:
j = 1 M σ j ( n k U k j ω 2 g φ k , j ) = 0 ,   k = 1 , M 1
while the no-entrance BC requiring vanishing normal velocity on all rigid wall sub-boundaries, including the seabed rigid bottom D 2 , 3 , 4 , 6 , 7 , is approximated by:
j = 1 M σ j ( n k U k j ) = 0 ,   k { [ 1 + Μ 1 , , i = 1 4 M i ] [ 1 + i = 1 5 M i , , i = 1 7 M i ] }
Furthermore, the linearized BC that applies to the water surface inside the OWC’s chamber, Equation (23), is discretized for a given angular frequency ω of the incident wave field as follows:
j = 1 M σ j [ n k U k j ω 2 g φ k j 1 b C ( ω ) α = 1 + Μ Β Μ Β + Μ 5 δ z 5 n a U a j ] = 0 ,   k = 1 + M B , , i = 1 5 M i , M B = i = 1 4 M i
In conclusion, the linear BEM system modelling the 2D OWC is presented below:
( A 1 , 1 A 1 , 2 . . . . . . A 1 , M 1 A 1 , M A 2 , 1 A 2 , 2 . . . . . . A 2 , M 1 A 2 , M . . . . A 3 , 3 . . . . . . . . . . . . . . . . . . . . . . . . . . . . . . . . . . . . . . . . . . . . . . . . . . . . . . . . . . . . . . . . . . . . . . . . . . . . . . . . . . . . . . . . . . . . A M , 1 A M , 2 . . . . . . A M , M 1 A M , M ) ( σ 1 σ 2 . . . . . . σ M A σ M A + 1 . . σ M 1 σ M ) = ( 0 0 . . . . . . 0 b M A + 1 . . b M 1 b M )
where the right-hand side data b k express the excitation by the incident wave and are zero for every k M A (see Equation (25)). The data b k , for k > M A = i = 1 7 M i , are defined from the right-hand side of Equation (7). The system solution provides the values of the unknown source-sink distributions on each element. Subsequently, the reflection coefficient is calculated from Equation (6), which is expressed in discretized form as follows:
R = a = M A + 1 M ( j = 1 M σ j φ a j δ z 8 Z 0 ( z a ) ) Z 0 ( b ) 2 exp ( i k 0 x b ) exp ( 2 i k 0 x b )
Finally, given that the complex wave potential has been normalized with respect to the incident wave height H and that the reflected wave has a height equal to | R | H , the energy feeding the turbine is ( 1 | R | 2 ) P i n , where P i n = ρ w g C g b H 2 / 8 and C g b denotes the wave group velocity in the incidence region at depth h b . Only a fraction of the above power is captured by the system, and the output power P o u t can be estimated taking into account the performance of the Wells turbine, for which an average value η W E L L S = 70% is considered here; see also Figure 6 of Ref. [10]. On the basis of the above, the performance of the examined configuration is finally obtained as follows:
η O W C = P o u t P i n = ( 1 | R | 2 ) η W E L L S .
To conclude this subsection, it is noted that the height of the air column above the water level as well as the coefficient λ T of the turbine are involved in the linear BEM system through the coefficient C ( ω ) of the boundary condition, Equation (28), imposed on the water surface within the chamber, which includes the effect of the chamber width. The effect of the other dimensions of the studied configuration, such as the draft ( D w ) and thickness ( d ) of the OWC’s front wall, is included in the BEM formulation.

2.4. Application of the Model in Uniform Depth Regions

The developed model is first applied to constant-depth regions in order to obtain the performance curves of the device in which seabed inhomogeneity effects are not involved as reference data. For this purpose, we consider an OWC device whose air chamber extends at a distance of 7m from Still Water Level (SWL), while the chamber’s width is set to 3m and the front wall has a 0.5m thickness ( h c = 7   m ,   b = 3   m ,   d = 0.5   m ) . The device is placed at a 10m water depth ( h a = h b = 10   m ) . The domain’s length is set to 200 m, while the boundary’s mesh is defined by assuming a minimum of 70 nodes per wavelength for each frequency. In addition, the number of nodes distributed across the sub-boundaries D 1 and D 7 is set to a minimum of 300 in order to avoid coarse meshing in cases of very low frequencies (long wavelengths).
The turbine coefficient λ T is defined in [ m   s ] , and for the present study is made non-dimensional as follows:
λ ˜ = λ T g / b 3
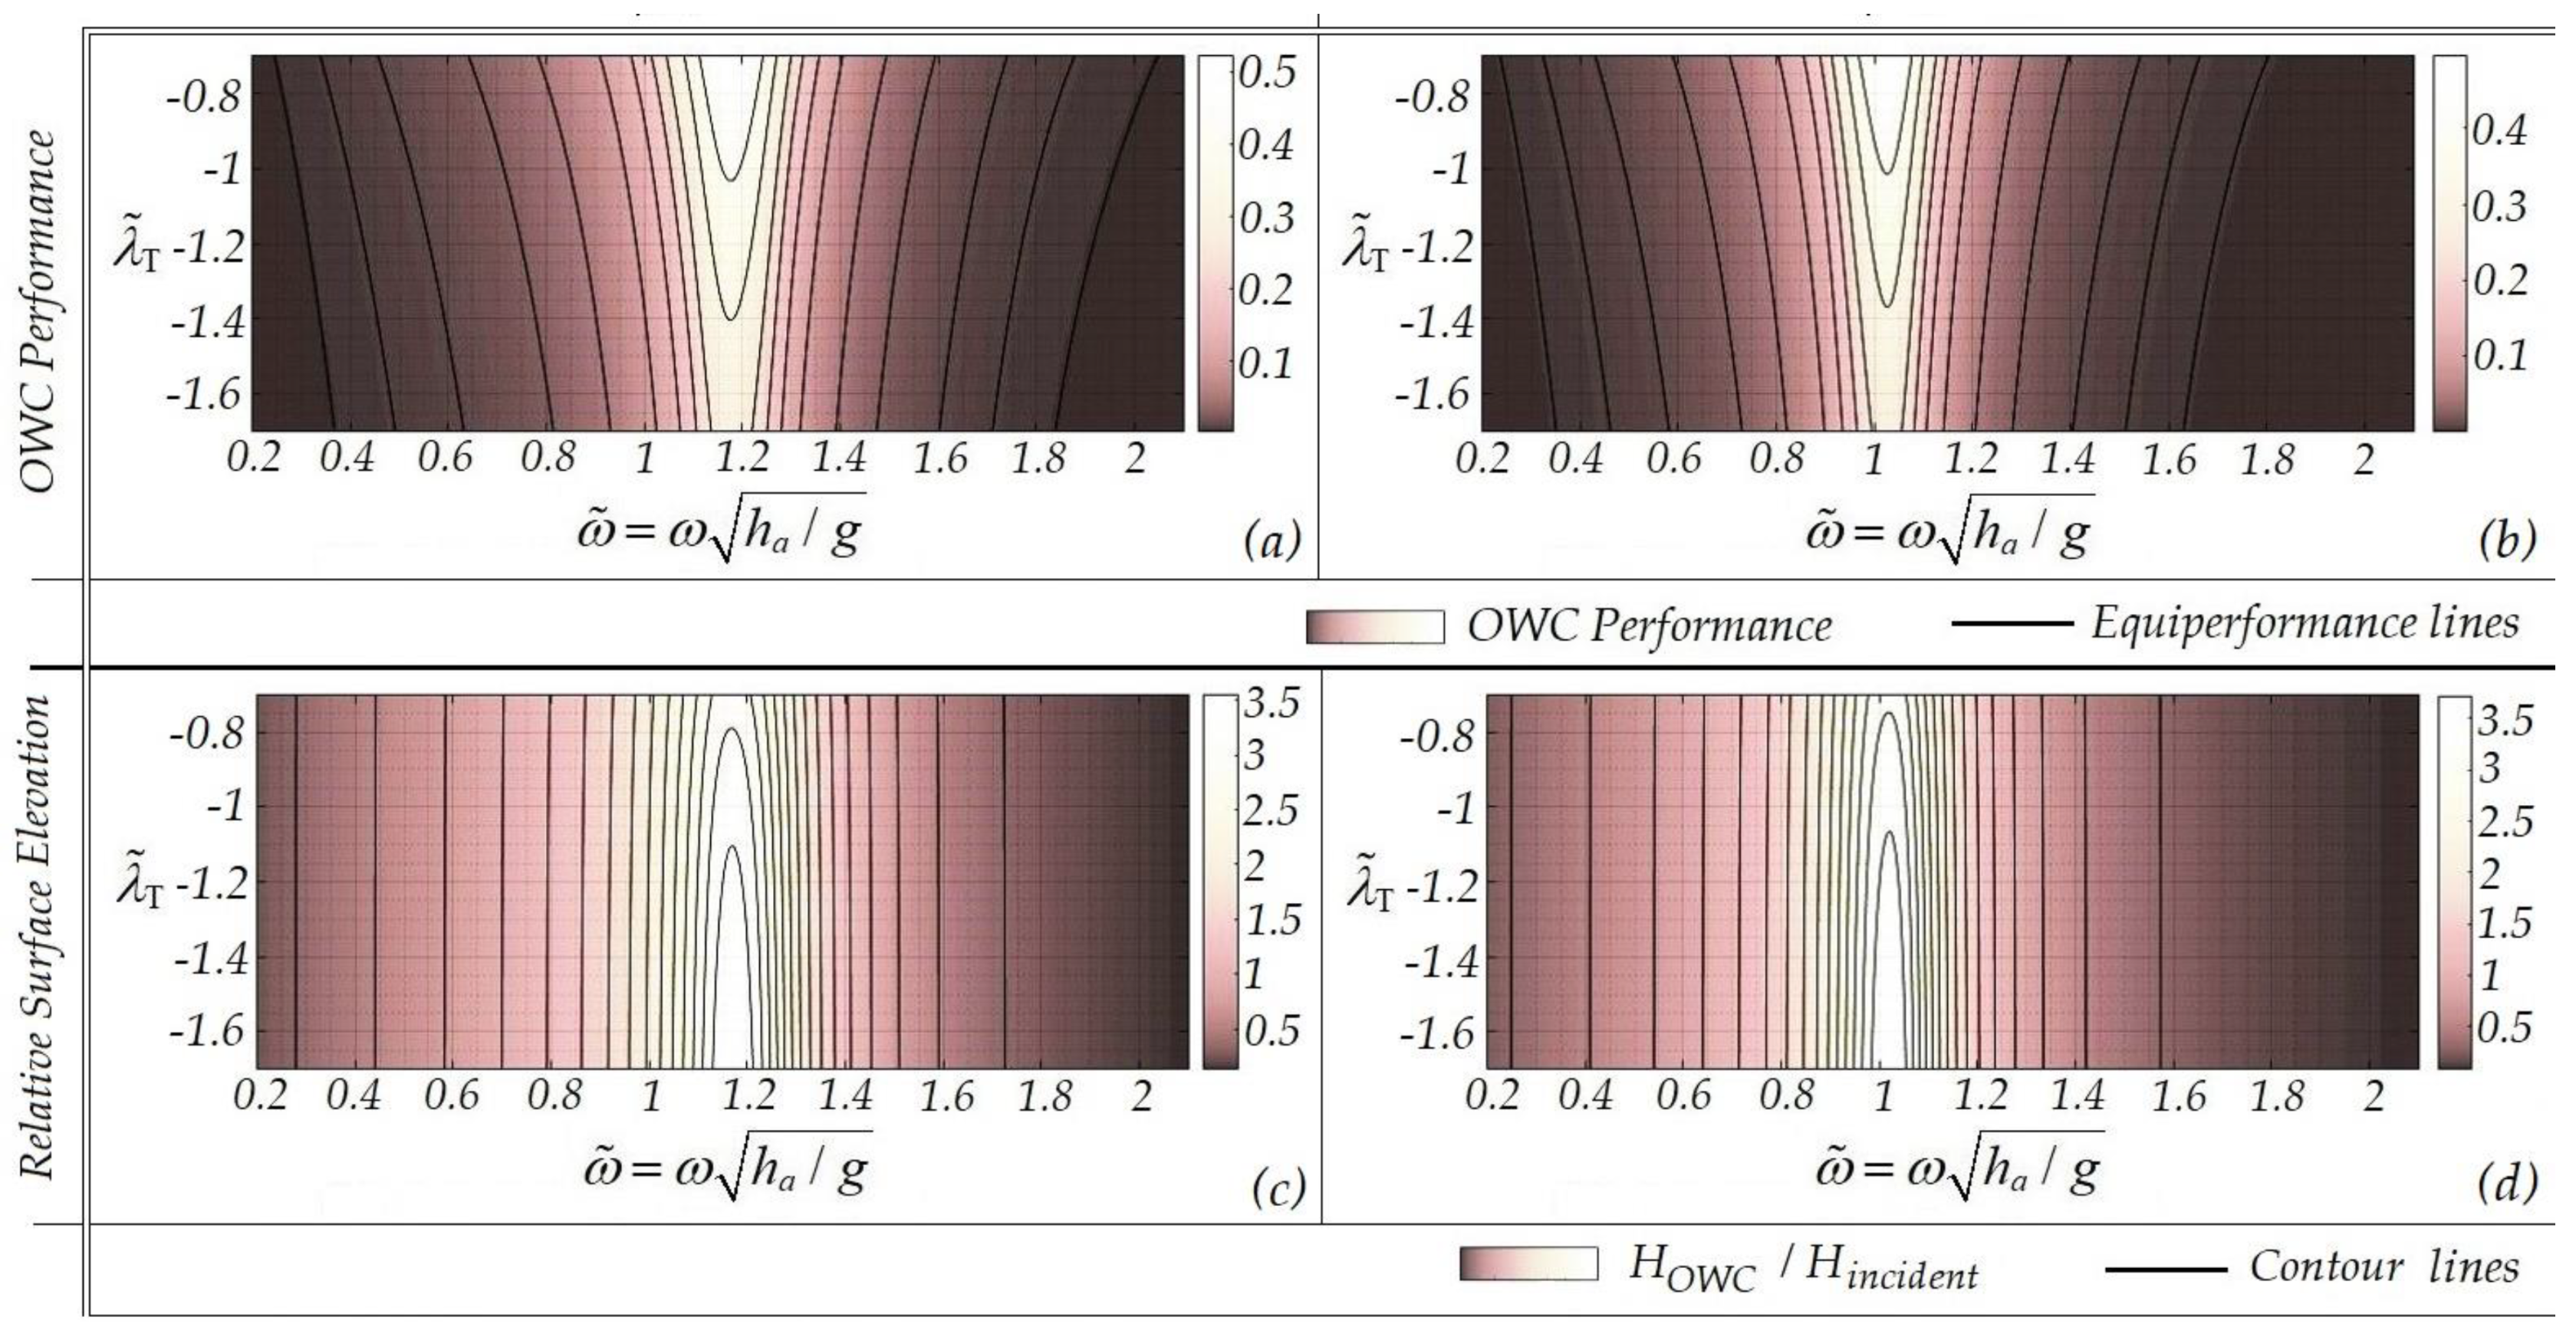
Results concerning the calculated performance of the system are presented in Figure 4a,b as a function of the non-dimensional frequency ω ˜ = ω h a / g and the coefficient λ ˜ , for two different values of the front wall’s draft ( D w / h = 0.5   and   0.7 ) . The corresponding contour plots depicting the relative free surface elevation in the OWC’s chamber are presented in Figure 4c,d.
It is observed that the device’s performance is increased within a range of non-dimensional frequency near one, despite the changes in the parameter λ ˜ . However, the specific value of the latter parameter affects the peak performance. It is also noticeable that increasing the front wall’s draft leads the system to lower resonance frequencies, and that in resonance conditions the amplitude of the piston-like motion of the water surface in the OWC chamber reaches a maximum of around 3 times the incident wave’s amplitude.

3. Effects of the Seabed Profile Inhomogeneities

In this section, the developed model is applied to variable bathymetry regions in order to investigate the effect of the wave field-seabed interaction on the OWC performance. The depth profiles that are used in order to model the shoaling environments are defined by:
z = h ( x ) = 1 2 ( h a + h b ) 1 2 ( h a h b ) tanh [ κ ( x x m ) ] + δ h c ( x ) ,   x [ 0 , x b ]
which describes a smooth shoal between two subregions of constant but different depth—the region of wave incidence with depth h b and the region of the OWC configuration with depth h a . The maximum bottom slope is controlled by the parameter κ and the difference | h b h a | . Moreover, δ h c ( x ) is used to model additional bottom irregularities in the upwave region, such as seabed corrugations.
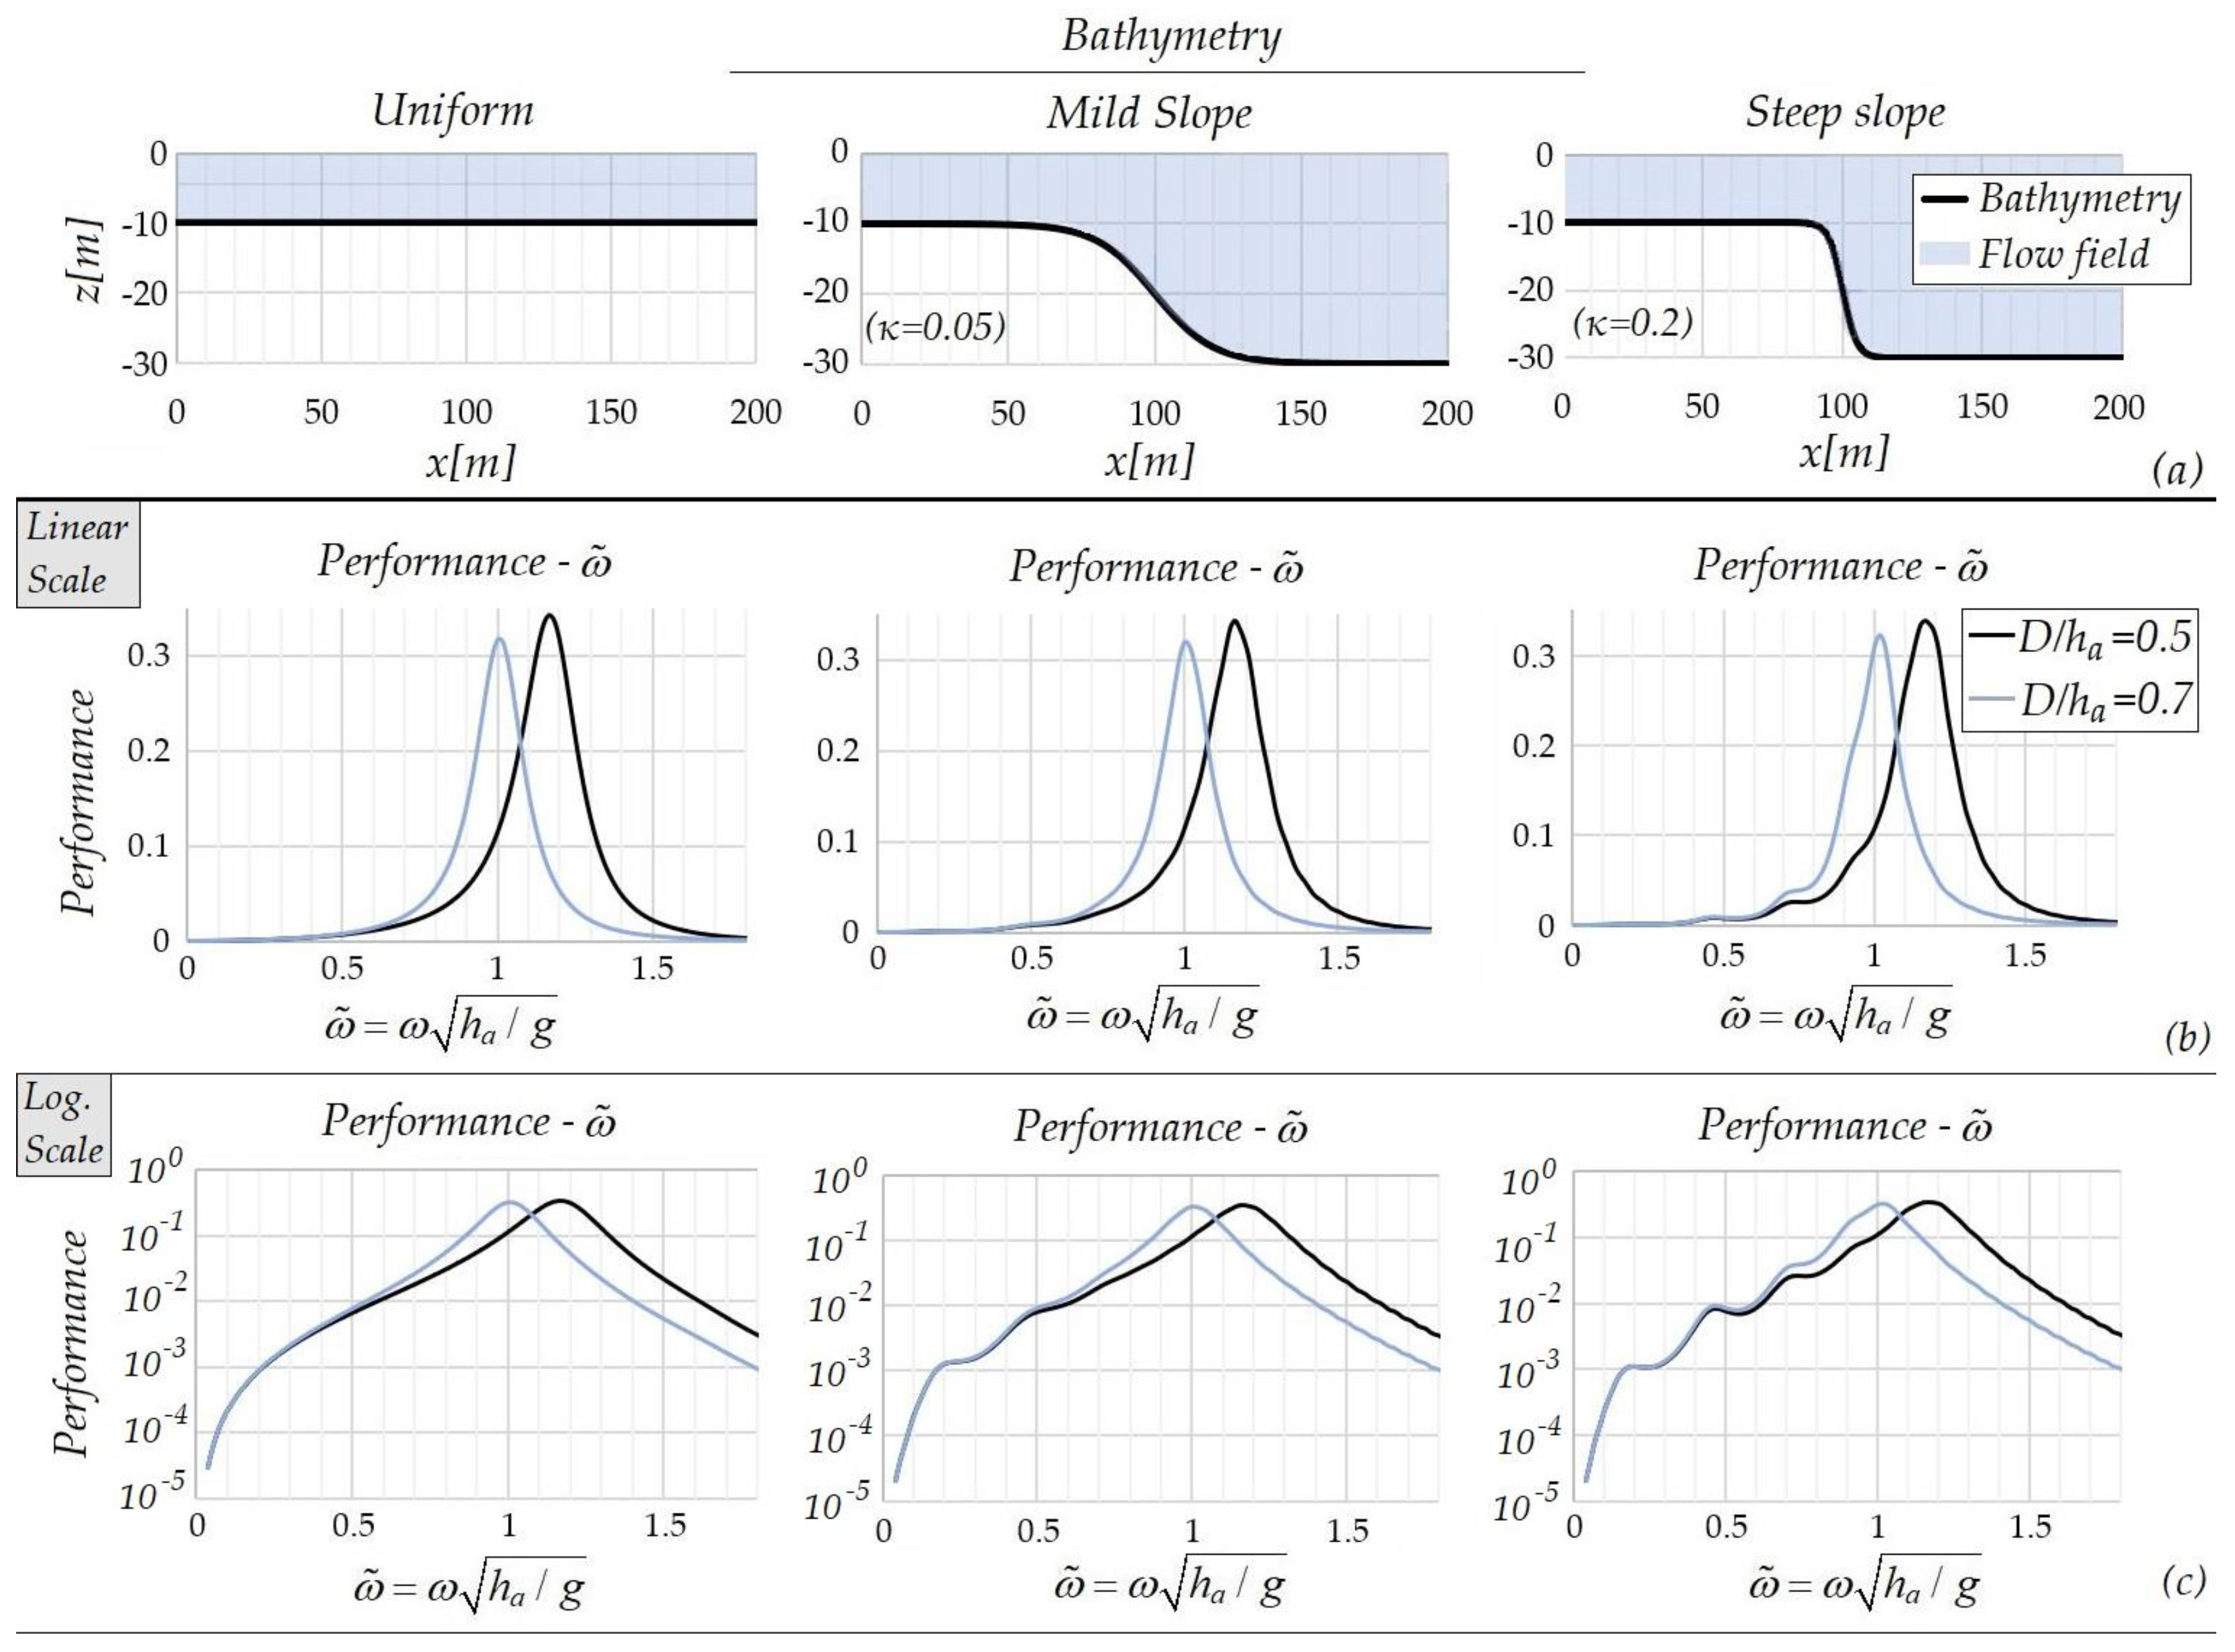
We consider an OWC operating at a 10 m water depth at the end of a 200 m-long variable bathymetry domain ending at a deeper water subregion of depth h b = 30   m . The configuration dimensions remain the same as in the previous case, for comparison purposes, and the same two values of the front wall’s draft ( D w / h = 0.5   and   0.7 ) are considered. Additionally, the chamber’s width is equal to 3 m and the turbine coefficient is selected as λ ˜ = 1.4 . In the case of a smooth shoal, the considered domain bathymetry is illustrated in Figure 5a, and the calculated performance curves with respect to the non-dimensional frequency for different values of the bottom slope parameter κ are shown in Figure 5b. In the same figure, the corresponding performance curves resulting from simulating the OWC’s operation in the uniform bathymetry domain are plotted for comparison. The observed oscillations in the numerical results are due to the phase variations of various quantities excited by seabed profile irregularities.
As it becomes clear from Figure 5, the more abrupt the depth changes, the more intense the influence of the flow field’s interaction with the seabed, leading to effects on the performance of the device. In this case, the overall influence of the bottom topography is not very significant. This is due to the fact that the peak performance occurs for incident waves of non-dimensional frequency ω ˜ 1 , which corresponds to wavelengths of around 40–50 m for the given water depth of 10 m, while the most significant alterations in the performance curves take place in the bandwidth of non-dimensional frequency below ω ˜ 0.8.
Moreover, it is observed in this case that for high frequencies (higher than the peak performance of the studied system), the influence of the seafloor is negligible. This is due to the fact that the interaction of the above components with the seabottom becomes very small. On the other hand, non-linear wave-seabed and wave-structure interactions could generate additional effects that are not represented in the present linearized model, and future work is planned in this direction.
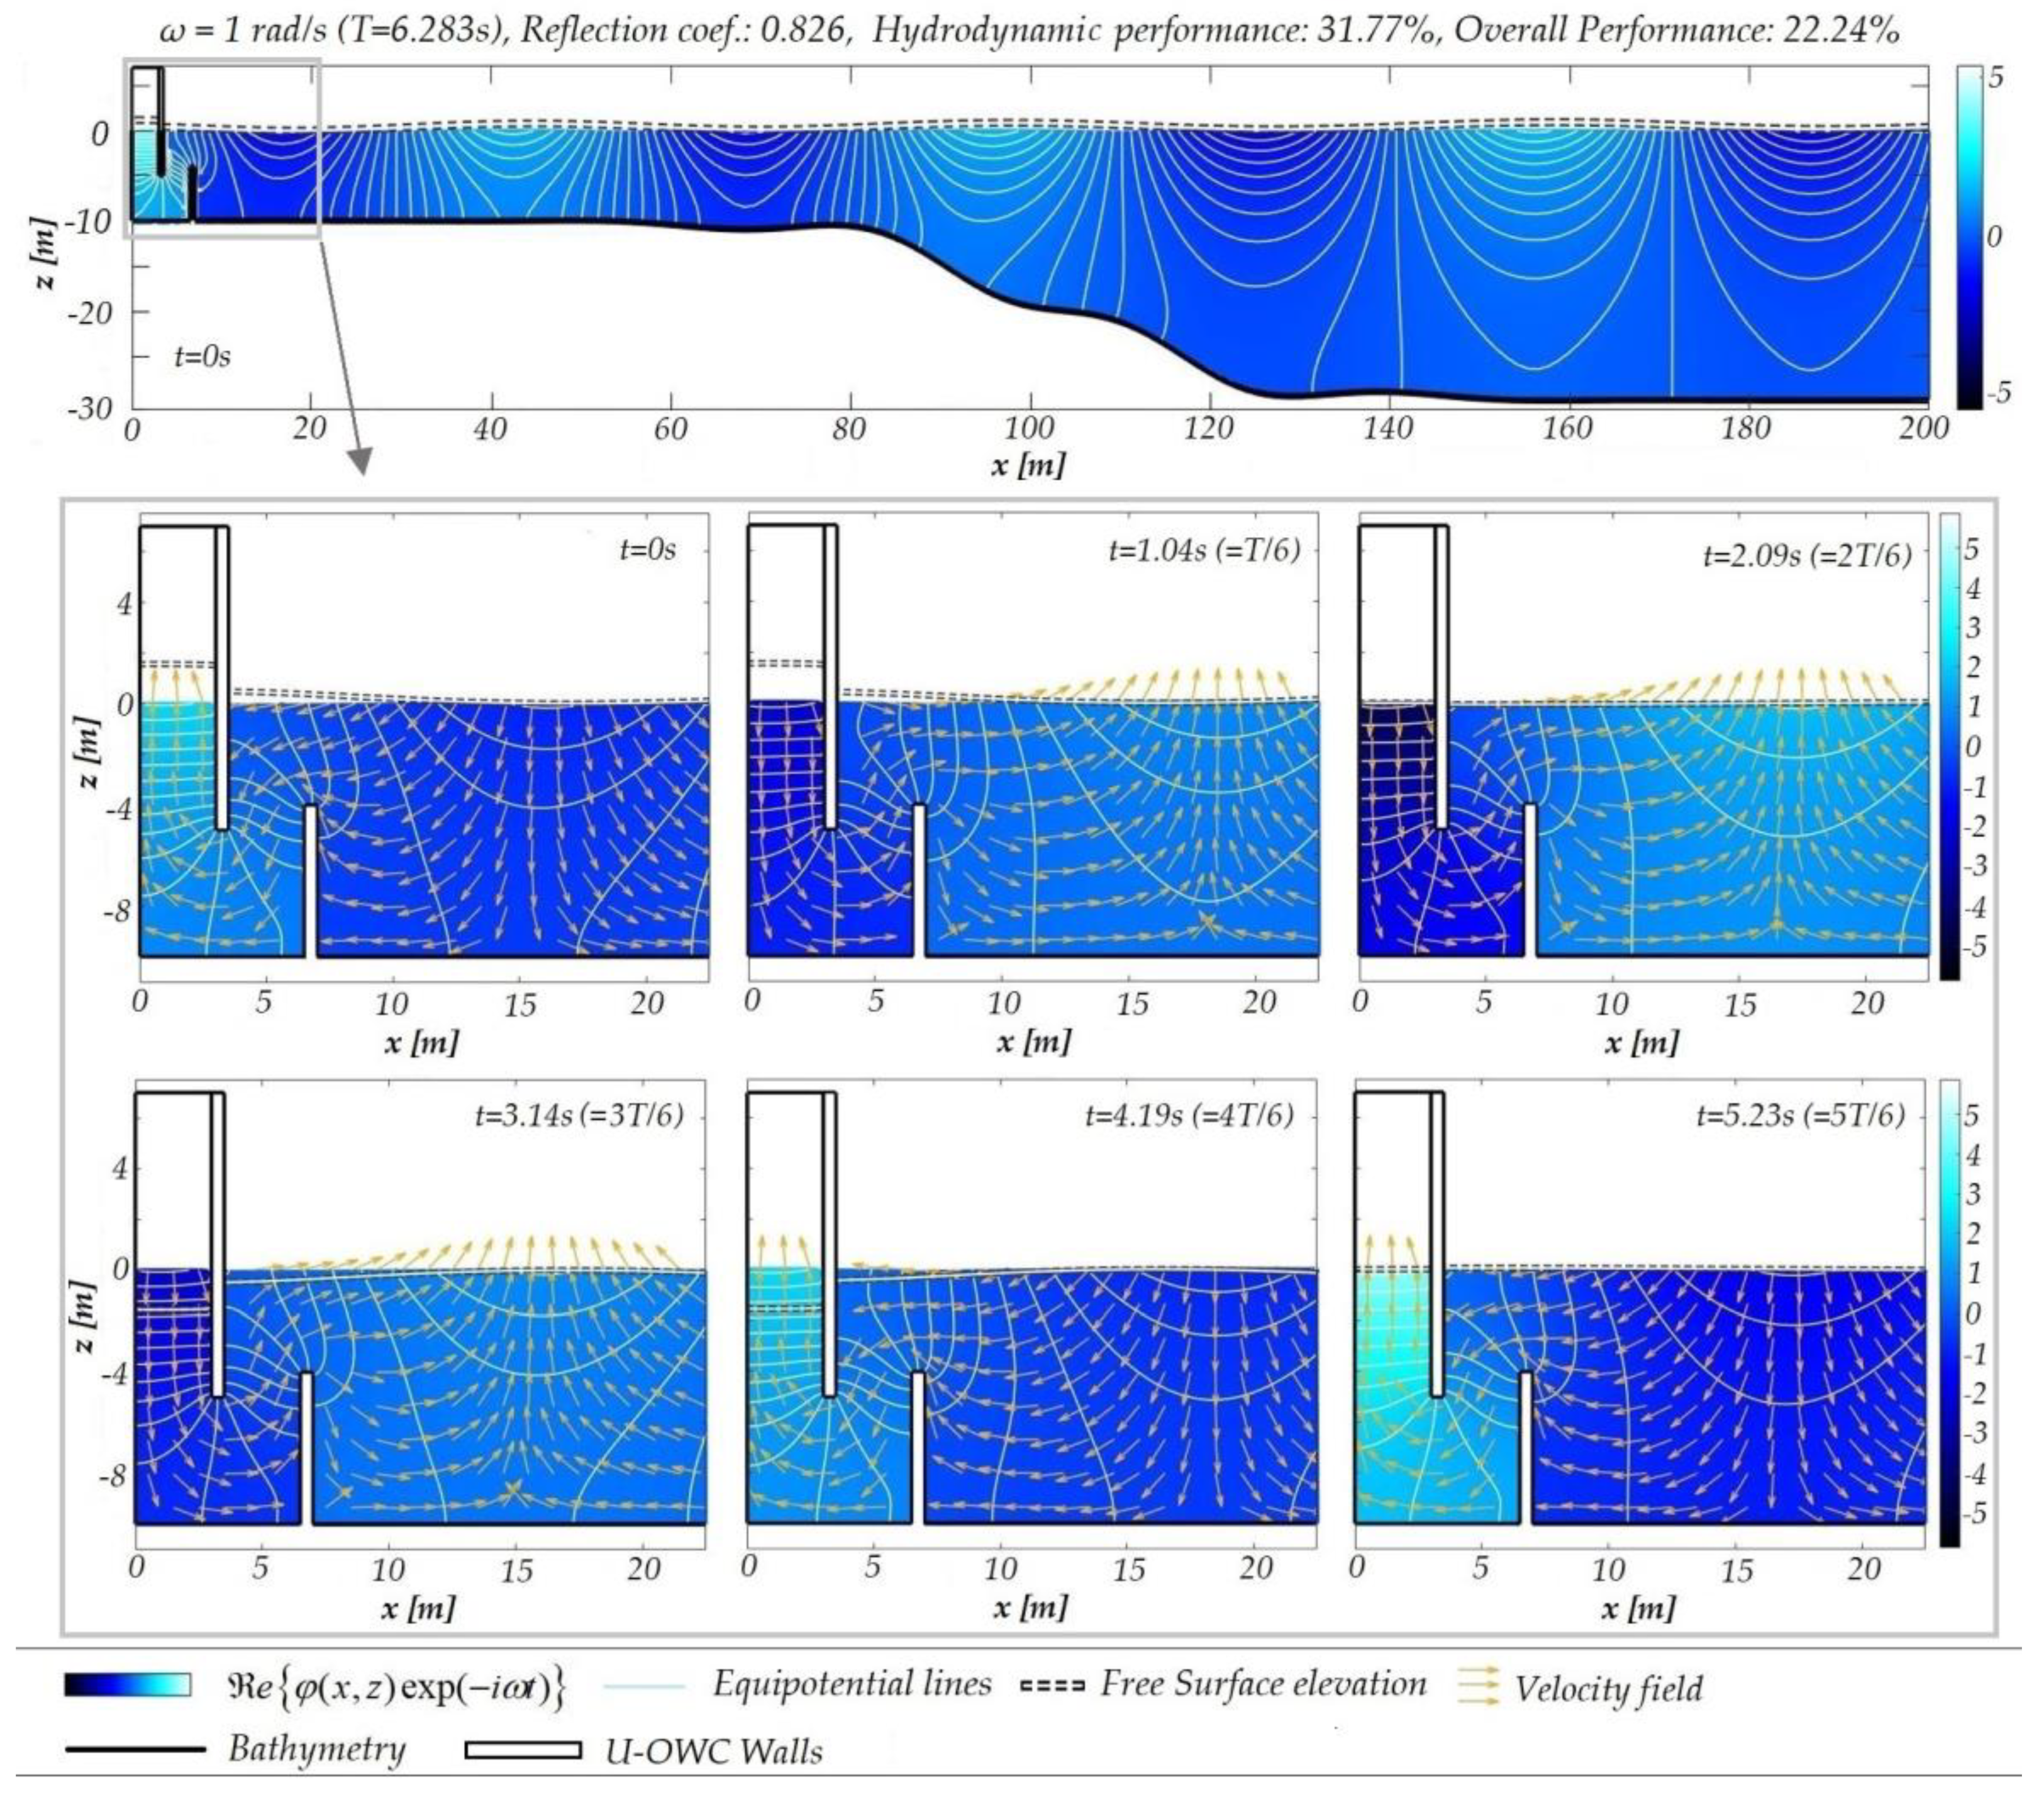
By using an auxiliary grid spanning the entire two-dimensional domain, the distribution of the complex wave potential across the whole wave field can be obtained by the superposition of the potential induced from each boundary element to each point of the grid. Figure 6 illustrates the wave field around an OWC that operates in a variable bathymetry region in the case of a smooth shoal of mean slope 20%, with the seabed profile being defined by Equation (33) for κ = 0.05 and δ h c ( x ) = 0 . Specifically, the figure represents the wave field at some instant (t = 0) in the domain, while the enlarged area depicts snapshots of the wave field at time instants evenly spaced within a period T. In the latter case, also the wave velocity field is shown by using arrows. Τhe alteration caused to the wavefield due to the shoaling bottom topography including the reduction in the wavelength (from 43 m to 39 m) over the shallower water region of the domain is observed. Furthermore, it is clearly seen in this figure that the equipotential lines intersect all the solid parts of the boundary perpendicularly, which implies the satisfaction of the Neumann boundary condition.

4. The U-OWC Model

The U-OWC is an alternative OWC configuration proposed by P. Boccotti [6] in 2003. A U-OWC is essentially an OWC which includes an additional vertical U-shaped duct for connecting the water column in the chamber to the open sea. Although the structural modifications needed—with respect to the conventional OWC plants—are not significant, this configuration allows for designing the natural resonance without the use of phase control devices. During operation, sea waves do not directly propagate below the trapped air mass, but the surface motion in the chamber occurs due to pressure oscillations at the opening of the vertical duct.
The present BEM is easily modified in order to model this type of OWC. For this purpose, the domain boundary is modified by including additional parts modelling the extra walls forming the U-shaped duct. Ιn particular, as shown in Figure 7, three additional straight boundary segments are added to the D . Due to the presence of the additional sub-boundaries, the seabed is split to two sections. The depth of the domain is considered to be constant from the OWC’s back wall to the horizontal position of the additional vertical duct, as shown in the figure. Τhe variable seabed profile starts from the horizontal position x x w and is defined as follows:
z = h ( x ) = 1 2 ( h a + h b ) 1 2 ( h a h b ) tanh [ κ ( x x m ) ] + δ h c ( x ) , x [ x w , x b ] ,   x m = [ x b x w ] / 2
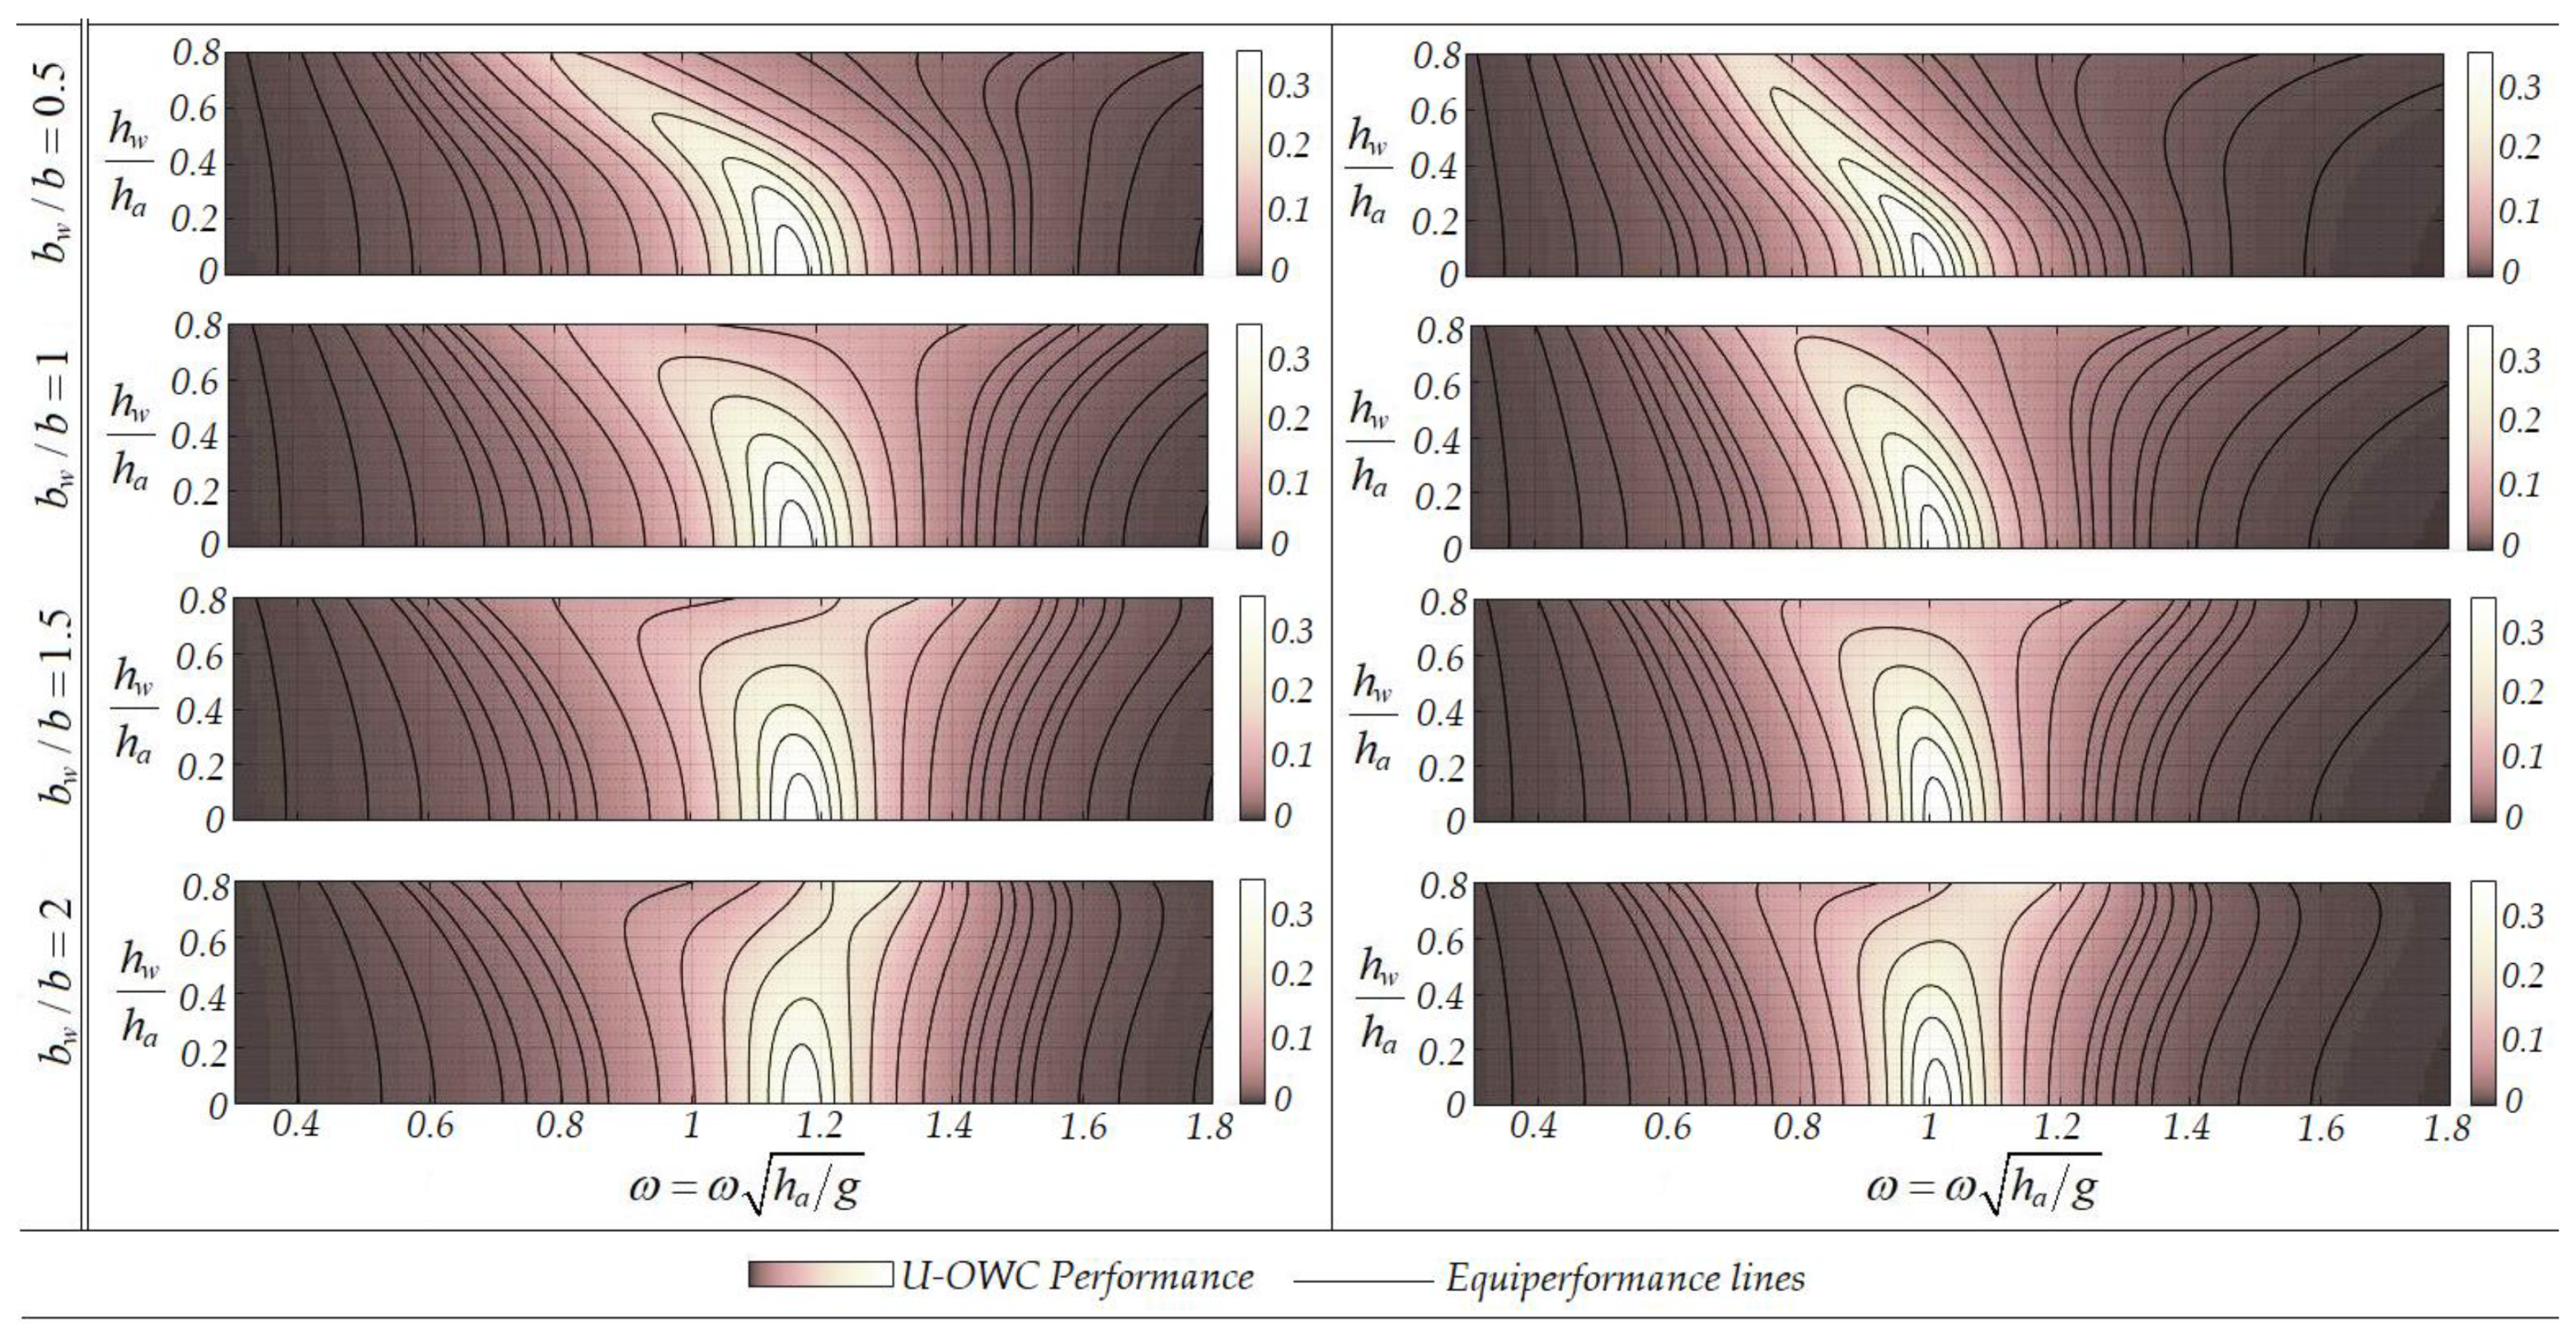
Considering the U-OWC configuration of Figure 7, the performance of the device is presented in Figure 8 for different settings of the additional wall, located at distance b w from the pre-existing front wall. In particular, the effects of the front wall draft, the duct section, and the front wall height are considered. Comparing the above results to the ones concerning the simple OWC presented in Figure 4, it is observed that the above parameters significantly influence the peak performance frequency of the system, which could be found useful for the appropriate selection of the parameters and the design of the device.
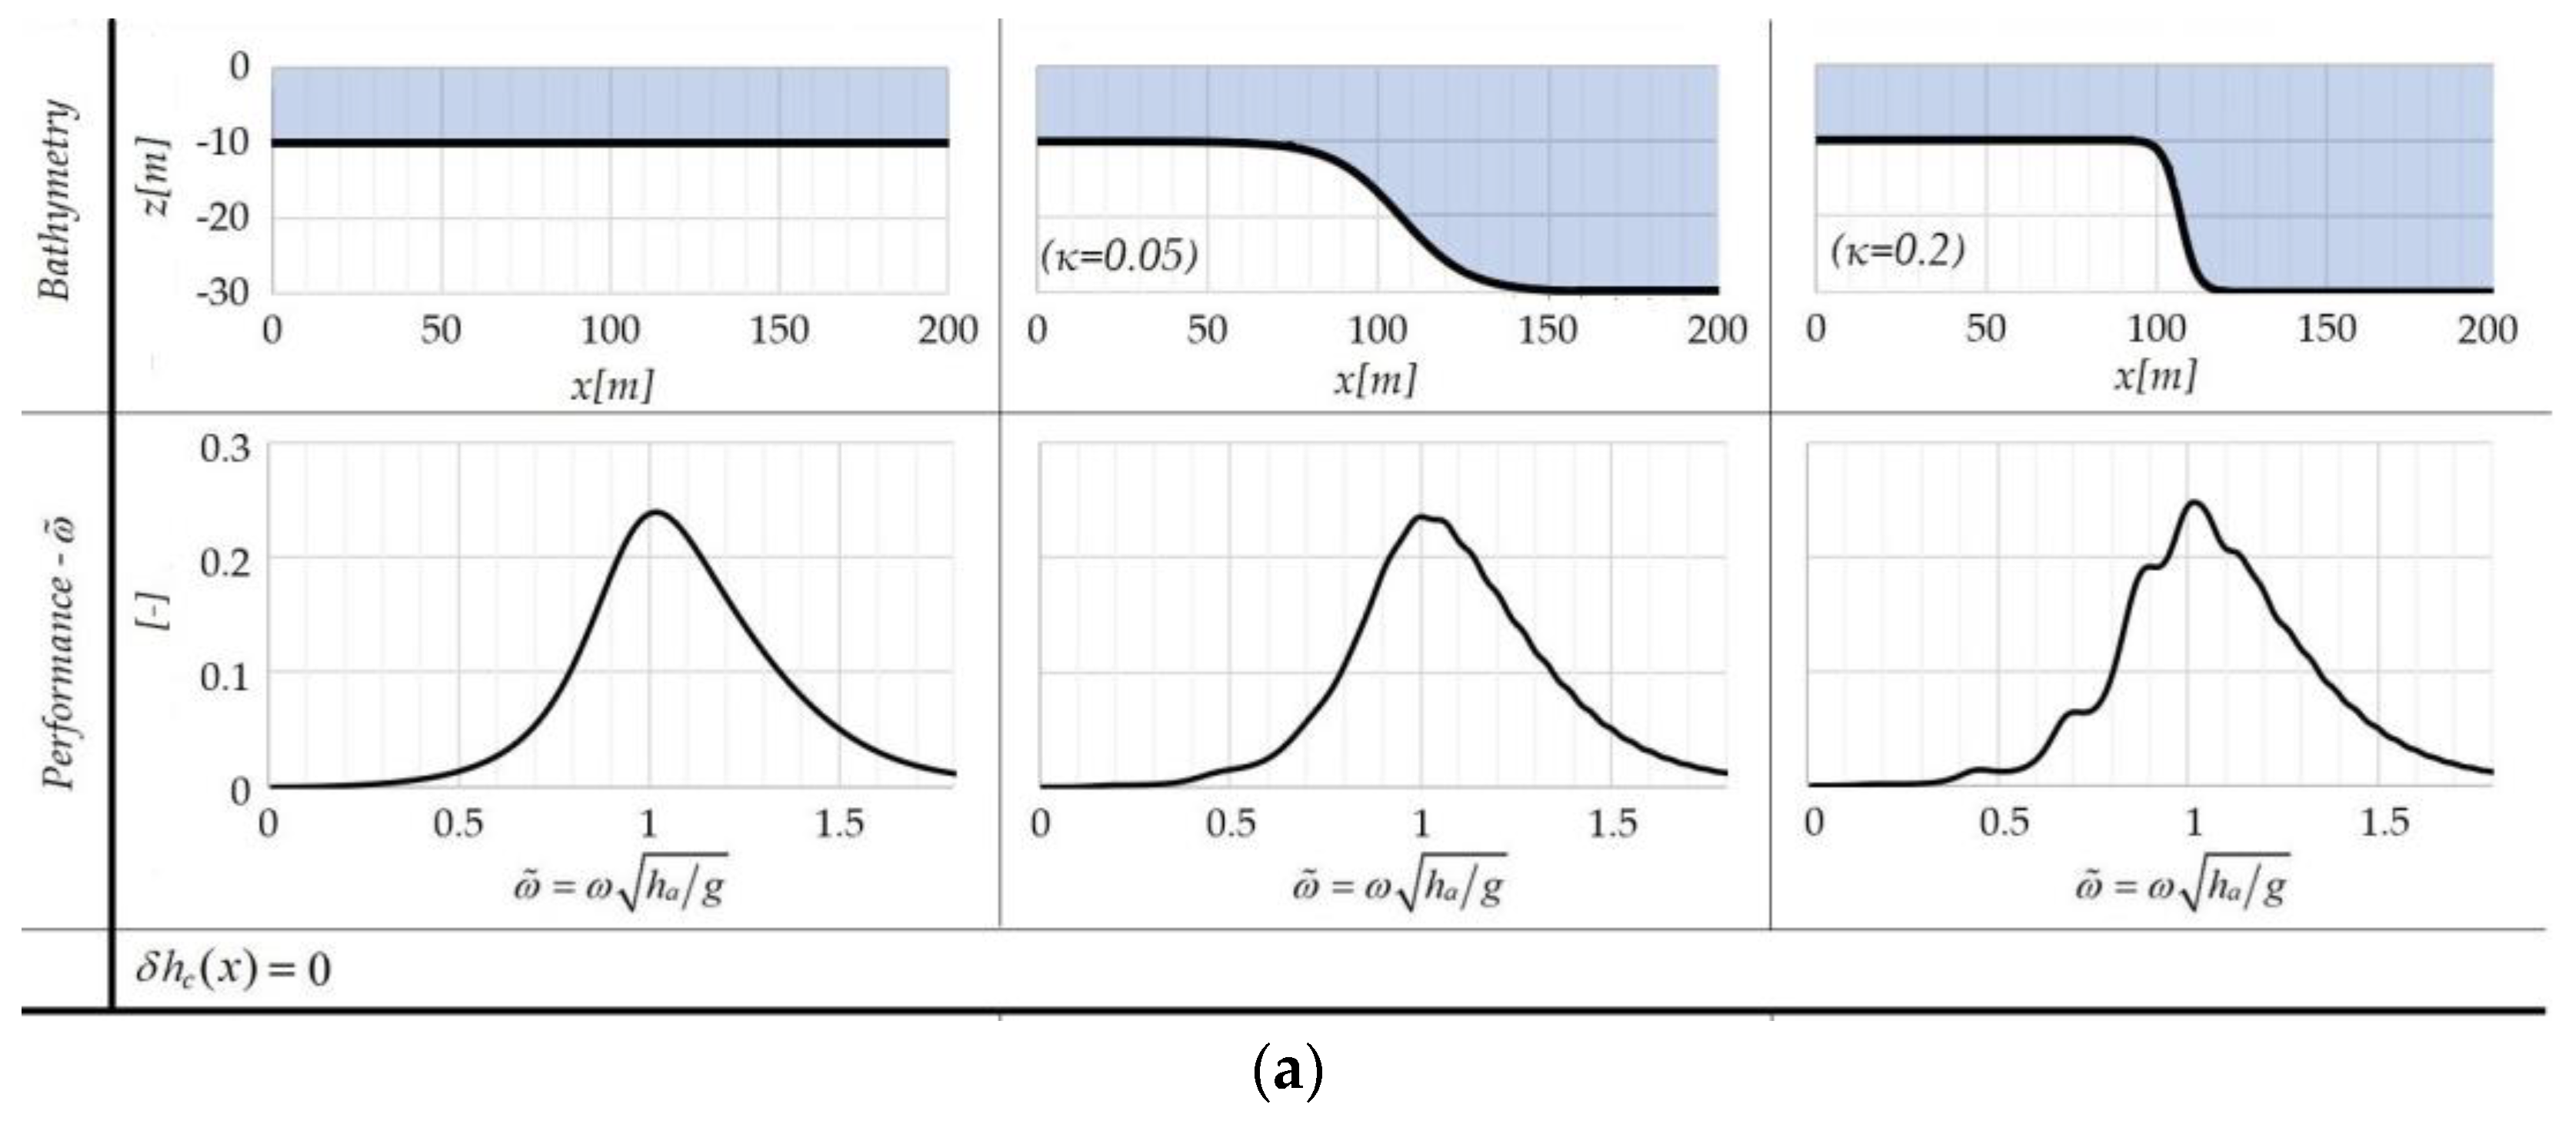
The non-dimensional turbine parameter is set to λ ˜ = 1.4 . In the case of a smooth shoaling topography, the performance of the U-OWC modelled by the present BEM is shown in Figure 9a comparatively to the case of constant depth h = 10 m shown in the first subplot. The additional effects of bottom corrugations on the calculated performance of the device are presented in Figure 9b. In this case, the seabed profile is defined by Equation (34) using κ = 0.05 and δ h c ( x ) = 2 sin [ 0.2 ( x x m ) ]   exp [ 10 3 ( x x m ) 2 ] .
The calculated wave field around the U-OWC considered in the above variable bathymetry region is illustrated in Figure 10 using equipotential lines. As before, the enlarged area depicts snapshots of the wave field near the OWC at evenly spaced time instants within a period T. In these plots, the wave velocity is also presented using arrows. In the examined case, for a given angular frequency of 1 rad/s the reflection coefficient is calculated 0.826 and the device’s performance is 22.2%. A stronger interaction of the wavefield with the seabed can be observed as well as the relative reduction of around 16% in the wavelength over the shallow region (from 61.3 m to 59.6 m). For the same case and the same values of wave frequency and parameters, it is noted that the device performance in the absence of the vertical duct, as calculated by the present model, is about 16%, indicating a significant increase in performance obtained by the U-OWC.

5. Application to a Coastal Site in Mangalia Port

In several works, the incorporation of OWCs into existing harbour infrastructure is proposed in order to maximise the cost-effectiveness; see, e.g., [11,12]. In this context, during the last decade different plants were built at full scale to convert wave energy into electrical power. Unlike offshore wave-capturing devices, coastal ones—like fixed structure OWCs—greatly facilitate installation and maintenance procedures, while they eliminate the need for deep-water moorings and long submerged electrical cables for transporting the electricity produced. In this context, the potential installation of OWC into pre-existing infrastructure at the port of Mangalia in the southern part of the Romanian coast is examined in this section. In more detail, a 300 m-long array of OWCs arranged at the northern breakwater of the port is considered, as illustrated in Figure 11.
In the considered area, the wave conditions are calculated in previous studies using the multilevel wave modelling system SWAN (Simulating WAves Nearshore) [13]. SWAN is a third-generation numerical wave model based on the spectrum concept that integrates the action balance equation in time in the geographical and spectral space, which are defined by the relative frequency and the wave direction [13]. The latter has been implemented and extensively validated in the Black Sea. The wind fields at a 10m height over the sea level (U10) provided by NCEP-CFSR [14] have been considered for forcing the system at the sea level.
This field has a spatial resolution of 0.312o × 0.312o and a temporal resolution of 3 h. At this point, it has to be highlighted that the wind data accuracy and resolution is a fundamental issue in reflecting the wind variability of such complicate marine environment as the Black Sea and represents also the most significant aspect in obtaining credible wave predictions in the modelling process.
The reliability of the SWAN-based wave prediction system in the above region implemented at the sea level is discussed in [15], where some data assimilation methods have been also developed in order to improve the accuracy of the results. A comparison against satellite data shows in general good results, especially considering the relatively complicated marine environment targeted. Further results of this wave modelling system at the sea level are also presented in [16], where the wave and wind energy are evaluated in the coastal environment of the Black Sea. A second computational level focused on the western side of the Black Sea was defined in [17]. Further on, several areas with increased resolution in the geographical space have been implemented and validated against in situ measurements and remotely sensed data [18]. From this perspective, in the present work a three-level wave prediction system has been considered and used for providing wave predictions in the vicinity of the Mangalia harbour, located in the southern part of the Romanian nearshore. The geographical space and subregions considered are illustrated in Figure 12 and the characteristics of the corresponding computational grids defined are presented in Table 1, while the physical processes activated in the simulations with the SWAN model corresponding to these three computational levels considered are presented in Table 2. Although the bathymetry at level 3 (see Figure 12) is relatively mild and does not necessarily lead to the excitation of strong diffraction phenomena (for water depths above 10 m), the abrupt variation in depth near the coastline could generate local diffraction/reflection phenomena, and for this purpose SWAN level 3 with diffraction activated has been used in the simulations.
More specifically, in Table 2 Wave indicates the wave forcing, Tide indicates the tide forcing, Wind indicates the wind forcing, Curr indicates the current field input, Gen indicates generation by wind, Wcap indicates the whitecapping process, Quad indicates the quadruplet nonlinear interactions, Triad indicates the triad nonlinear interactions, Diff indicates the diffraction process, Bfric indicates the bottom friction, Set up indicates the wave-induced set up, and Br depth indicates induced wave breaking. With this three-level SWAN-based modelling system, simulations have been performed in the present work for the 10-year period 2007–2016 and the results in a target point TP with the coordinates (28.68° E, 43.83° N) are further considered. Further information concerning the nearshore wave dynamics at Mangalia beach simulated by spectral models are provided in [19]. The calculated nearshore wave climatology is presented in Figure 13, and details concerning the analytical probability models used for univariate and multivariate data can be found in [20,21].
Given that the model developed and presented in this work is limited to a two-dimensional analogue of OWC devices, it is considered that the wave power flux received by the considered configuration is identical to that of the TP region, provided that the propagation direction is limited within the range ( 0 ° , 90 ° ) . For propagation directions outside this range, no power flux is considered to be received by the array.
The corresponding polar histogram as well as the monthly mean values of the wave power flux per meter of wave front after the aforementioned limitation are presented in Figure 14.
The mean value of the energy period occurring at the specific geographical area equals 2.86 s (see Figure 13a). However, these sea states are associated with relatively low wave heights due to the correlation between the two variables (see Figure 13b).
On the other hand, the occurrence of waves characterized by increased energy periods (e.g., Τ > 8 s) is very scarse in the specific site. A normalized distribution of the available wave energy with respect to the incident energy period associated with the population of waves in the nearshore/coastal area examined is presented in Figure 15, as obtained from the climatological data of Figure 13 (after applying the direction limitation). It can be clearly seen that the wave period with the highest energy content significantly differs from the mean value and is around 4.3 s. The latter provides useful information regarding the dimensioning of the considered devices.
The water depth at the northern breakwater of the port is 15 m. Therefore, the non-dimensional frequency corresponding to the highest-energy-content energy period equals ω ˜ = ω h a / g 1.80 . We consider conventional OWC devices with 2.5 m-wide chambers (b = 2.5 m). The front wall’s thickness is set to d = 0.5 m, while the Wells turbine non-dimensional parameter is set to λ ˜ = 3.5 , so that the peak performance achieved by the configuration remains unchanged relative to the previously discussed examples of 200 m-long configurations, taking into account the considered chamber’s reduced width and the length of 300 m in the transverse dimension (Equation (23)). The front wall’s draft as well as the chamber’s height were selected so that they are both greater than the maximum wave amplitude (H/2) encountered in the hindcast data, corresponding to an incident wave period of ± 5 % for each configuration’s eigenperiod, multiplied by a factor of 3 (see Figure 4). After the relevant calculations, it was found that a close-to-optimal selection, (assuming that D = h c ), is D = h c = 5   m , which, in conjunction with the rest of the parameters, results in peak performance at ω ˜ = 1.61   ( T = 4.83   s ) . (Further reduction in the eigenperiod, for the given chamber’s width, requires reducing D and h c , which would result in the aforementioned criterion being unsatisfied based on the climate data of Figure 14.)
The latter results were obtained via the developed BEM model for water of constant depth equal to 15 m. However, given the depth of the installation location and the eigenfrequency of the selected configuration, changes in the depth profile introduce negligible changes in the performance curve, as depicted in Figure 16. The device’s operation was simulated at an indicative 1 km-long domain, with the water depth varying from 25 m at the incidence-radiation boundary, to 15 m at the region of the OWC located at the northern breakwater of Mangalia port.
The resulting mean monthly values of power output, expressed in [kW/m], are presented in Figure 17. The overall mean value of wave power output equals 0.135 kW/m. Given that the results were extracted via a two-dimensional analogue, the power output in [kW] can be estimated by multiplying the power output per meter of wavefront by the considered array’s width, which is considered to be 300 m. (Apparently, this estimation neglects all the effects caused due to the three-dimensional nature of the considered configuration). Eventually, the annual energy production (AEP) can be estimated in [kWh] by multiplying the overall mean value of power output in [kW] by the total number of hours within a year (8766):
A E P = 0.135 kW m × 300   m × 8766   h = 355023   kWh 0.355   GWh
By artificially shifting the performance curve of the system (see Figure 16b) towards the optimal operating point, it can be found that the achieved power output per meter of wavefront reaches 0.1534 KW/m (for the shifted curve), for peak performance at T = 4.227 s   ( ω ˜ = 1.838 ) , which matches the expected result based on the Normalized Power flux curve of Figure 15. The shift in the system’s eigenperiod can be achieved—apart from reducing the previously discussed dimensions D and h c —also by reducing the chamber’s width, b. The AEP in this case increases to 0.404   GWh .
Although the results from the present study show that the expected electric power in the target area is not very high, some recent works [22,23] indicate that there is significant wind power potential in this coastal region, and furthermore that there are also expectations of an enhancement of the average wind power in this area [24]. From this perspective, it would make sense for hybrid wind-wave energy farms to be implemented in this nearshore and the present study provides relevant information also in this direction.
To conclude, it should be noticed that the results presented and discussed in the present work are based on a linearized model, based on small-amplitude wave theory and are considered as preliminary estimates providing useful information for the design of OWCs including the effects of seabed variation in the upwave subregion of the device. However, the operation of OWCs is also dependent on several non-linear effects, such as the ones associated with the chamber thermodynamics; the turbine characteristics; and the fluid-structure interaction, including wave breaking—e.g., [25,26,27]—which are left to be considered in future work.
6. Conclusions

In this work, a simplified two-dimensional BEM model is developed and applied to the investigation of OWC’s response, excited by harmonic normally incident waves in general bathymetry regions. Apart from conventional OWC, U-OWC configurations are also modelled. By applying the developed model, the effects of depth inhomogeneities in the upwave region in conjunction with several parameters are examined and discussed. Moreover, numerical results are presented illustrating the details of the wave field in variable bathymetry and in the vicinity of the device. It is shown that the effects of the bottom slope and curvature on the performance of the studied device could be important and should be taken into account, especially in cases where the wave climate leads the site-specific optimal design to low resonance frequencies. Finally, the installation of an OWC array in a specific coastal region of Romania, characterized by its relatively increased potential, is examined.
Two-dimensional models, such as the ones studied in the present work, support understanding and intuition regarding the dynamics of the system. However, the investigation of three-dimensional effects, including oblique wave incidence, is important concerning the studied configurations. Future research will be directed towards the extension of the present model to the above direction, as well as the consideration of non-linear effects. Additionally, a feasibility study concerning the realistic application of the system and a comparison with other technologies is planned for future work.

Author Contributions

This work is based on the diploma thesis of A.M. supervised by K.B. The draft of the text and the numerical simulations were handled by A.M. The initial version of the BEM for OWC is developed by A.M. E.R. participated in verification of the results and the application of the model to coastal site. All authors have read and agreed to the published version of the manuscript.

Funding

This research received no external funding.

Acknowledgments

The work of Eugen Rusu was supported by the project “Excellence, performance and competitiveness in the Research, Development and Innovation activities at “Dunarea de Jos” University of Galati”, acronym “EXPERT”, financed by the Romanian Ministry of Research and Innovation in the framework of Programme 1—Development of the national research and development system, Sub-programme 1.2. Institutional Performance. Projects for financing excellence in Research, Development and Innovation, contract no. 14PFE/17.10.2018.

Conflicts of Interest

The authors declare no conflict of interest.

Abbreviations

AEPAnnual Energy Production
BCBoundary Condition
BEMBoundary Element Method
CFSRClimate Forecast System Reanalysis
FSBCFree-Surface Boundary Condition
NCEPNational Centers for Environmental Prediction
SWANSimulating WAves Nearshore
OWCOscillating Water Column
U-OWCOWC with U-shaped duct
PTOPower Take Off
SWANSimulating WAves Nearshore
SWLStill Water Level
TPTarget Point
WECWave Energy Converter
Nomenclature
Φ, φ potential functions
ω, Hwave frequency and height
hwater depth
b,Lchamber width and length
RReflection Coefficient
λTturbine flow rate-pressure head coefficient
Pc,, P0chamber air pressure, atmospheric pressure
U k j , φ k j , b j BEM matrices
ηwater upper surface elevation
ρ , air density
γ heat capacity ratio of air
ρ w water density
ggravitational acceleration
C g wave group velocity
P i n , P o u t input output power
σ j discrete source-sink distribution

References

  1. Falcão, A.F.O. The shoreline OWC wave power plant at the Azores. In Proceedings of the 4th European Wave Energy Conference, Aalborg, Denmark, 4–6 December 2000. [Google Scholar]
  2. Boake, C.; Whittaker, T.; Folley, M.; Hamish, E. Overview and Initial Operational Experience of the LIMPET Wave Energy Plant. In Proceedings of the 12th International Offshore and Polar Engineering Conference, Kitakyushu, Japan, 26–31 May 2002. [Google Scholar]
  3. Belibassakis, K.; Bonovas, M.; Rusu, E. A Novel Method for Estimating Wave Energy Converter Performance in Variable Bathymetry Regions and Applications. Energies 2018, 11, 2092. [Google Scholar] [CrossRef] [Green Version]
  4. Bonovas, M.; Belibassakis, K.; Rusu, E. Multi-DOF WEC Performance in Variable Bathymetry Regions Using a Hybrid 3D BEM and Optimization. Energies 2019, 12, 2108. [Google Scholar] [CrossRef] [Green Version]
  5. Magkouris, A.; Bonovas, M.; Belibassakis, K. Hydrodynamic analysis of surge-type wave energy devices in variable bathymetry by means of BEM. Fluids 2020, 5, 99. [Google Scholar] [CrossRef]
  6. Boccotti, P. On a new wave energy absorber. Ocean. Eng. 2003, 30, 1191–1200. [Google Scholar] [CrossRef]
  7. Malara, G.; Arena, F. U—Oscillating Water Column in random waves: Modelling and Performances. In Proceedings of the 32nd International Conference on Ocean, Offshore and Arctic Engineering, Nantes, France, 9–14 June 2013. [Google Scholar] [CrossRef]
  8. Katz, J.; Plotkin, A. Low-Speed Aerodynamics, 2nd ed.; Cambridge University Press: Cambridge, UK, 2001. [Google Scholar]
  9. Coddington, E.; Levinson, N. Theory of Ordinary Differential Equations, TMH ed.; McGraw Hill Publishing Co. Ltd.: New Delhi, India, 1972. [Google Scholar]
  10. Falcão, A.F.O.; Gato, L.M.C.; Nunes, E.P.A.S. A novel radial self-rectifying air turbine for use in wave energy converters. Part 2. Results from model testing. Renew. Energy 2013, 53, 159–164. [Google Scholar] [CrossRef]
  11. Falcão, A.F.O. Wave energy utilization: A review of the technologies. Renew. Sustain. Energy Rev. 2010, 14, 899–918. [Google Scholar] [CrossRef]
  12. Falcão, A.F.O.; Henriques, C.J. Oscillating-water-column wave energy converters and air turbines: A review. Renew. Energy 2016, 85, 1391–1424. [Google Scholar] [CrossRef]
  13. Booij, N.; Ris, R.C.; Holthuijsen, L.H. A third-generation wave model for coastal regions. Part 1: Model description and validation. J. Geophys. Res. 1999, C4, 7649–7666. [Google Scholar] [CrossRef] [Green Version]
  14. Saha, S.; Moorthi, S.; Wu, X.; Wang, J.; Nadiga, S.; Tripp, P.; Behringer, D.; Hou, Y.T.; Chuang, H.Y.; Iredell, M.; et al. The NCEP climate forecast system version 2. J. Clim. 2014, 27, 2185–2208. [Google Scholar] [CrossRef]
  15. Rusu, L. Assessment of the Wave Energy in the Black Sea Based on a 15-Year Hindcast with Data Assimilation. Energies 2015, 8, 10370–10388. [Google Scholar] [CrossRef]
  16. Rusu, L.; Ganea, D.; Mereuta, E. A joint evaluation of wave and wind energy resources in the Black Sea based on 20-year hindcast information. Energy Explor. Exploit. 2018, 36, 335–351. [Google Scholar] [CrossRef]
  17. Rusu, L. The wave and wind power potential in the western Black Sea. Renew. Energy 2019, 139, 1146–1158. [Google Scholar] [CrossRef]
  18. Rusu, E. Study of the Wave Energy Propagation Patterns in the Western Black Sea. Appl. Sci. 2018, 8, 993. [Google Scholar] [CrossRef] [Green Version]
  19. Anton, I.A.; Rusu, L.; Anton, C. Nearshore Wave Dynamics at Mangalia Beach Simulated by Spectral Models. J. Mar. Sci. Eng. 2019, 7, 206. [Google Scholar] [CrossRef] [Green Version]
  20. Athanassoulis, G.A.; Skarsoulis, E.K.; Belibassakis, K.A. Bivariate distributions with given marginals with an application to wave climate description. Appl Ocean. Res. 1994, 16, 1–17. [Google Scholar] [CrossRef]
  21. Athanassoulis, G.A.; Belibassakis, K.A. Probabilistic description of metocean parameters by means of kernel density models. Part 1: Theoretical background and first results. Appl. Ocean. Res. 2002, 24, 1–20. [Google Scholar] [CrossRef]
  22. Onea, F.; Rusu, E. Efficiency assessments for some state-of-the-art wind turbines in the coastal environments of the Black and the Caspian seas. Energy Explor. Exploit. 2016, 34, 217–234. [Google Scholar] [CrossRef] [Green Version]
  23. Onea, F.; Ciortan, S.; Rusu, E. Assessment of the potential for developing combined wind-wave projects in the European nearshore. SAGE Energy Environ. 2017, 28, 580–597. [Google Scholar] [CrossRef]
  24. Rusu, E. A 30-year projection of the future wind energy resources in the coastal environment of the Black Sea. Renew. Energy 2019, 139, 228–234. [Google Scholar] [CrossRef]
  25. Wang, R.Q.; Ning, D.Z.; Zhang, C.W.; Zou, Q.P.; Liu, Z. Nonlinear and viscous effects on the hydrodynamic performance of a fixed OWC wave energy converter. Coast. Eng. 2018, 131, 42–50. [Google Scholar] [CrossRef]
  26. Elhanafi, A.; Fleming, A.; Macfarlane, G.; Leong, Z. Numerical energy balance analysis for an onshore oscillating water column wave energy converter. Energy J. 2016, 116, 539–557. [Google Scholar] [CrossRef]
  27. Gkikas, G.D.; Athanassoulis, G.A. Development of a novel nonlinear system identification scheme for the pressure fluctuation inside an oscillating water column-wave energy converter. Ocean Eng. 2014, 80, 84–99. [Google Scholar] [CrossRef]
Figure 1. Definition of the Oscillating Water Column (OWC) domain in the variable bathymetry region and the decomposition of the boundary ∂D into eight sections.
Energies 13 03403 g001
Figure 2. (a) Air pocket dynamics representation and OWC dimensions, (b) rendered view of the considered configuration.
Energies 13 03403 g002
Figure 3. Generated mesh of an OWC in a non-uniform bathymetry domain.
Energies 13 03403 g003
Figure 4. Contour plots of the OWC’s performance in uniform bathymetry for different values of the front wall’s draft D w / h = 0.5 (left column) and D w / h = 0.7 (right column). ( Parameters : h a = h b = 10   m ,   h c = 7   m ,   d = 0.5   m ) .
Energies 13 03403 g004
Figure 5. OWC performance curves in variable bathymetry (smooth shoals). ( Parameters :   h a = 10   m ,   h b = 30   m ,   b = 3   m ,   h c = 7   m ,   d = 0.5   m ,   λ ˜ = 1.4 ) .
Energies 13 03403 g005
Figure 6. Equipotential lines of the wave field and free surface elevation at different time instants during an OWC’s operation in a variable bathymetry region ( Parameters :   h a = 10   m ,   h b = 30   m ,   b = 3   m ,   d = 0.5   m , D = 5   m ,   λ ˜ = 1.4 ,   h c = 7   m κ = 0.05 ,   δ h c ( x ) = 0 ) .
Energies 13 03403 g006
Figure 7. Definition of Alternative Oscillating Water Column (U-OWC) dimensions in variable bathymetry.
Energies 13 03403 g007
Figure 8. Contour plots of U-type OWC performance in uniform bathymetry for different values of the front wall’s draft D w / h = 0.5 (left column) and D w / h = 0.7 (right column), and different values of the duct section ( b w / b ) and the front wall height ( h w / h ) . ( Parameters :   h a = h b = 10   m ,   b = 3   m ,   h c = 7   m ,   d w = d = 0.5   m ,   λ ˜ = 1.4 ) .
Energies 13 03403 g008
Figure 9. (a). U-OWC performance curves in variable bathymetry ( Parameters : h a = 10   m ,   h b = 30   m ,   D = 5   m ,   b = b w = 3   m ,   h c = 7   m ,   d = d w = 0.5   m ,   λ ˜ = 1.4 ) . (b). U-OWC performance curves in variable bathymetry ( Parameters :   h a = 10   m ,   h b = 30   m ,   D = 5   m ,   b = b w = 3   m ,   h c = 7   m ,   d = d w = 0.5   m ,   λ ˜ = 1.4 ) .
Energies 13 03403 g009aEnergies 13 03403 g009b
Figure 10. Wave potential and velocity fields at different time instants during a U-OWC’s operation in a variable bathymetry region ( Parameters :   h a = 10   m ,   h b = 30   m ,   b = b w = 3   m ,   d = d w = 0.5   m ,   D = 5   m .   h w = 7   m ,   λ ˜ = 1.4 ,   h c = 7   m ,   κ = 0.05 ,   δ h c ( x ) = 2 sin [ 0.2 ( x x m ) ] exp [ 10 3 ( x x m ) 2 ] ) .
Energies 13 03403 g010
Figure 11. Port of Mangalia and considered array of OWCs (source: Google Maps).
Energies 13 03403 g011
Figure 12. The computational domains defined in Simulating WAves Nearshore (SWAN) model simulations: (a) Level 1—Black Sea basin; Level 2 (right side)—western coastal driver. (b) Level 3—nearshore area in the southern Romanian nearshore. (c) Local site (Mangalia Port). Location of the nearshore target point (TP) and sector of wave directions 0 ° < θ < 90 ° that influence the considered OWC in the northern breakwater.
Energies 13 03403 g012
Figure 13. Annual distribution of wave parameters and wave potential at the nearshore area of TP.
Energies 13 03403 g013
Figure 14. Polar histogram and monthly mean values of the incident wave power.
Energies 13 03403 g014
Figure 15. Distribution of the available wave energy at TP as a function of the incident wave period.
Energies 13 03403 g015
Figure 16. Considered OWC’s performance curve in variable bathymetry. ( Parameters :   h a = 10   m ,   h b = 25   m ,   b = 2.5   m ,   d = 0.5   m ,   D = 5   m ,   λ ˜ = 2.1 , h c = 5   m ,   κ = 0.015 , δ h c ( x ) = 4 sin [ 0.02 ( x x m ) ] exp [ 7   10 6 ( x x m ) 2 ] ) .
Energies 13 03403 g016
Figure 17. Monthly mean values of power output.
Energies 13 03403 g017
Table 1. Characteristics of the computational domains defined in spherical coordinates for the SWAN model simulations focused on the western side of the Black Sea.
Spherical DomainsΔλ × ΔφΔt (min)nfngλ × ngφ = np
Black Sea (Level 1)0.08° × 0.08°10 non-stat2436176 × 76 = 13,376
Coastal Driver (Level 2)0.02° × 0.02°10 non-stat2436141 × 141 = 19,881
Southern RO (Level 3)0.01° × 0.01°10 non-stat2436161 × 141 = 22,701
Table 2. Physical processes activated in the SWAN simulations corresponding to the three computational domains defined. (X—process activated, 0—process inactivated.).
Input/ProcessWaveWindTideCurrGenWcapQuadTriadDiffrBfricSet UpBr
Domains
Level 10X00XXX00X0X
Level 2XX00XXXX0X0X
Level 3XX00XXXXXX0X