Article

The Role of Bi-Polar Plate Design and the Start-Up Protocol in the Spatiotemporal Dynamics during Solid Oxide Fuel Cell Anode Reduction

by
Thomas M. M. Heenan
1,2,*,
Seyed Ali Nabavi
3,
Maria Erans
3,4,
James B. Robinson
1,2,
Matthew D. R. Kok
1,2,
Maximilian Maier
1,
Daniel J. L. Brett
1,2,
Paul R. Shearing
1,2 and
Vasilije Manovic
3,*
1
Electrochemical Innovation Lab, Department of Chemical Engineering, University College London, London WC1E 7JE, UK
2
The Faraday Institution, Quad One, Harwell Science and Innovation Campus, Didcot OX11 0RA, UK
3
Centre for Climate and Environmental Protection, Cranfield University, Bedford MK43 0AL, UK
4
Faculty of Engineering, University of Nottingham, Nottingham NG7 2RD, UK
*
Authors to whom correspondence should be addressed.
Energies 2020, 13(14), 3552; https://doi.org/10.3390/en13143552
Submission received: 19 June 2020 / Revised: 6 July 2020 / Accepted: 7 July 2020 / Published: 10 July 2020

Abstract

:
Start-up conditions largely dictate the performance longevity for solid oxide fuel cells (SOFCs). The SOFC anode is typically deposited as NiO-ceramic that is reduced to Ni-ceramic during start-up. Effective reduction is imperative to ensuring that the anode is electrochemically active and able to produce electronic and ionic current; the bi-polar plates (BPP) next to the anode allow the transport of current and gases, via land and channels, respectively. This study investigates a commercial SOFC stack that failed following a typical start-up procedure. The BPP design was found to substantially affect the spatiotemporal dynamics of the anode reduction; Raman spectroscopy detected electrochemically inactive NiO on the anode surface below the BPP land-contacts; X-ray computed tomography (CT) and scanning electron microscopy (SEM) identified associated contrasts in the electrode porosity, confirming the extension of heterogeneous features beyond the anode surface, towards the electrolyte-anode interface. Failure studies such as this are important for improving statistical confidence in commercial SOFCs and ultimately their competitiveness within the mass-market. Moreover, the spatiotemporal information presented here may aid in the development of novel BPP design and improved reduction protocol methods that minimize cell and stack strain, and thus maximize cell longevity.

Graphical Abstract

1. Introduction

Solid oxide fuel cells (SOFCs) are capable of converting chemical to electrical energy plus heat. Unlike many other fuel cell types, SOFCs can operate directly on a variety of fuels, such as hydrocarbons. This fuel versatility is achieved by operating at high temperatures in the range of 600–1000 °C, which avoids the use of expensive platinum metal catalysts within the electrodes. Furthermore, the high-grade heat generated through the reactions can be recovered, resulting in very high net efficiencies. These factors make SOFCs an enticing low-carbon substitute for many applications; however, limitations in operational consistency continue to inhibit competitive entry to the mass-market [1,2].
In its most simple form, the SOFC consists of two porous electrodes separated by a dense ceramic electrolyte and electrically connected via an external circuit. Common ceramic electrolytes are zirconia- or ceria-based, e.g., yttria-stabilized zirconia (YSZ) and gadolinium-doped ceria (GDC). The anode is typically nickel-based (Ni) with the addition of the electrolyte ceramic in the form of a porous cermet often deposited in the oxide form, e.g., NiO–YSZ, which is later reduced during the first operational start-up to the metallic form, i.e., Ni–YSZ. The cathode is typically a perovskite-based compound such as lanthanum strontium manganite (LSM) or lanthanum strontium cobalt ferrite (LSCF) and is also typically combined with the ceramic, i.e., LSM–YSZ. Finally, the electrodes are often connected to the external electrical circuit using bi-polar plates (BPP). Although these materials describe many state-of-the-art SOFC designs, various alternatives are being proposed, such as: rare earth oxide doping [3]; nanoparticle impregnation of manganite structures [4]; geopolymer/ceria for lower temperatures [5]; metal-supported [6]; single-layer and electrolyte-free cells [7].
Recent years have seen substantial progress in the literature, where focus has been placed upon improving our understanding of anode degradation processes and the mechanisms that underpin them [8,9,10,11,12]. Particularly, chemical and microstructural characterization methods can be employed as proxies for the measure of the expected electrochemical performance, and as a post-mortem for failed cells and stacks. Raman spectroscopy has proven useful as a method for exploring the chemical composition of electrodes as a function of temperature, oxidation state [13], reduction kinetics [14], redox reactions [15] and poisoning [16,17]. X-ray techniques have become widely employed for SOFC investigations due to the versatility of such characterization. For instance, molecular structure can be explored using edge information [18]; whereas the microstructure can be explored using computed tomography (CT) which is capable of resolving features across multiple length scales, from the particles [19,20,21,22] and electrodes [23], up to the cell-level [24,25].
As discussed, the Ni metal is deposited as NiO and reduced during the first operational start-up. In order to reduce the NiO, a reducing agent such as hydrogen gas is flowed over the anode, diffusing beyond the anode surface, through the tortuous pore-network up to the anode/electrolyte interface. However, reduction kinetics are complex [26,27], and can result in irreversible structural changes [28]. Moreover, oxidized regions have been observed to possess higher tortuosity-factors than reduced regions, potentially increasing diffusive impedances and inhibiting reduction [29]. Recent models have predicted the production of oxygen-depleted zones in the conventional parallel channel cell/stack design [30]. Further, start-up optimization has been investigated for various flowrates and temperatures protocols, demonstrating that saturation times can vary considerably [31]. Finally, cell cracking has been observed with operation for planar stacks and has been attributed to substantial electrical resistance, hindering power output [32]. Consequently, although progress is being made with regard to new materials and system design [33], further understanding is still needed with regards to design optimization for minimal degradation in order to maximize power output and lifetime.
This paper inspects the implications of non-uniform NiO reduction within an SOFC stack, with a particular focus on the influence of the BPP design. Novel insights into the reduction processes within SOFC anodes during operational start-up are elucidated using a combination of Raman spectroscopy and X-ray CT.

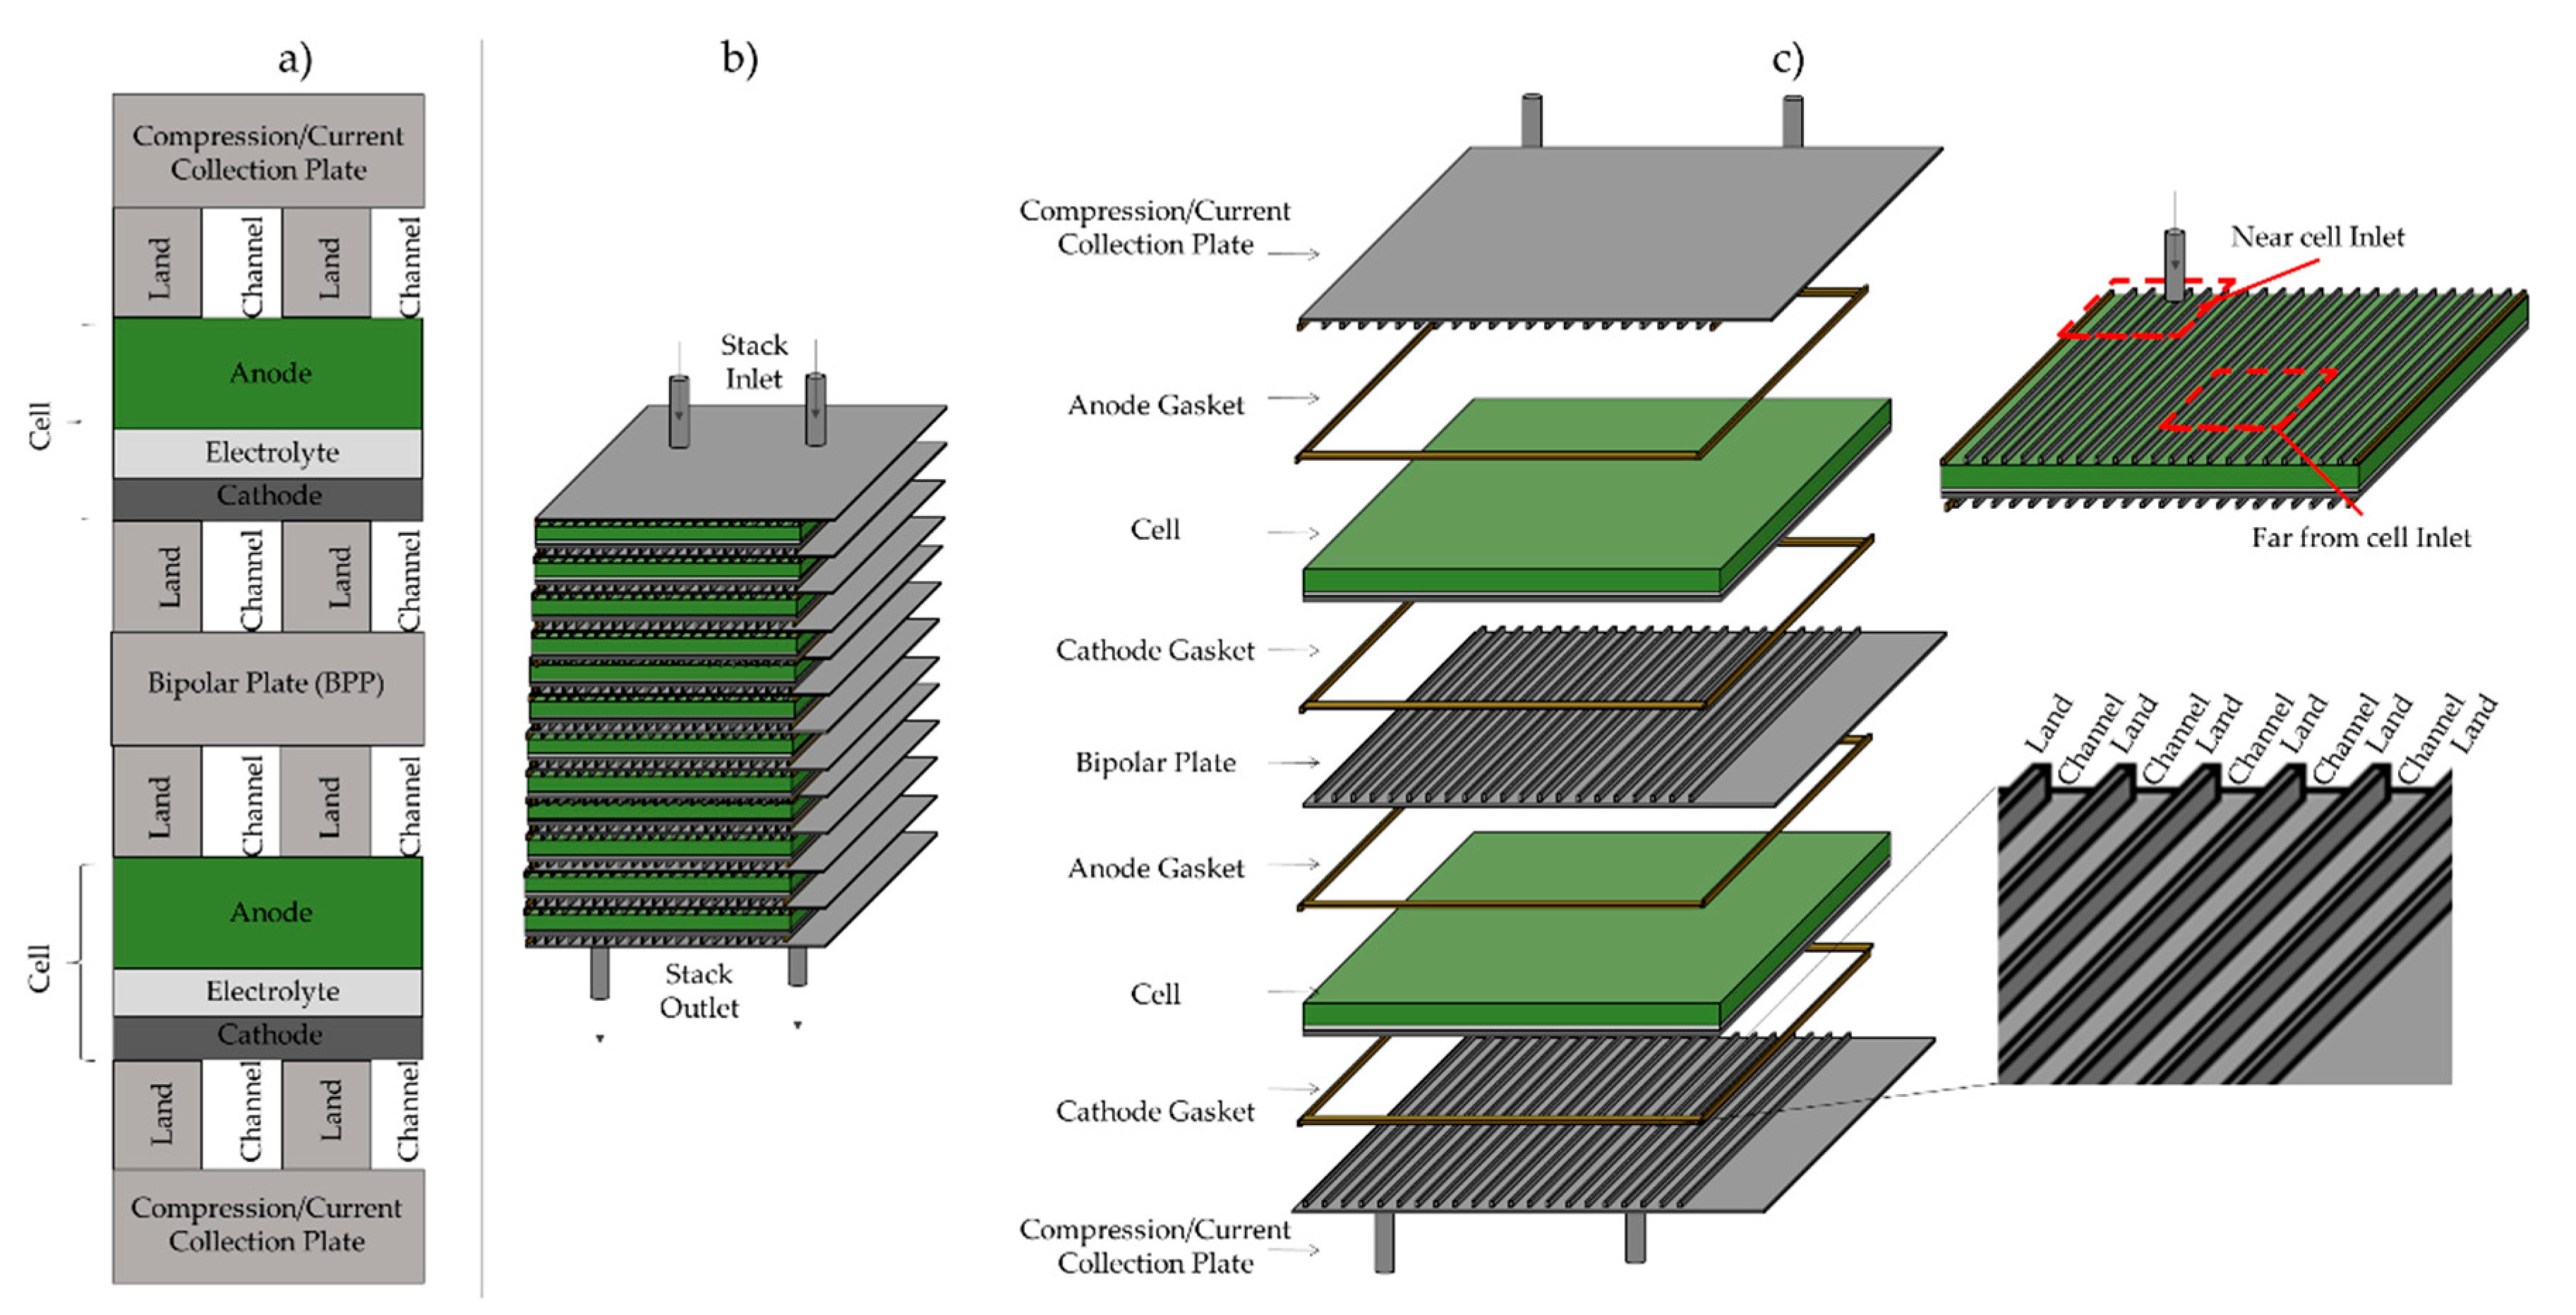
2. Materials and Methods

In this study, a 2 kWel SOFC stack (SOFCMAN Ningbo, China) comprised of 30 planar anode-supported cells, and a configuration of Ni–YSZ/YSZ/CGO/LSCF-CGO, was used. The cell size was 14 × 14 cm, with an expected active area of 150 cm2. The stack was placed in a 3.5 kW furnace (SOFCMAN Ningbo, China); the stack temperature was measured using a thermocouple located in the vicinity of the stack; and an external pressure load of ~11.5 N cm−2 was applied and maintained constant throughout the test to ensure sufficient gas sealing. See Table S1 and Figure S1 for more information on the cell materials and experimental set-up.
To perform the operational testing, the stack was heated to 750 °C, at a rate of 1–3 °C min−1 (2.2 °C min−1 from 0–400 °C and 1.6 °C min−1 from 400–750 °C). Prior to any stack reduction, the anode side of the stack was purged with 4 L min−1 of nitrogen for 10 min.
The stack reduction was initiated by introducing 4 L min−1 of hydrogen and 12 L min−1 of air into the anode and cathode sides, respectively. The hydrogen and air streams were preheated to 600 °C and 500 °C before feeding into the stack using 1.2 and 2.1 kW (0.9 kW plus 1.2 kW) heating tapes (OMEGA, London, UK), respectively. The stack anode underwent approximately 3 h of reduction in the hydrogen atmosphere whereby the average cell open circuit potential (OCP) climbed from a minimum of 0.53 V to 0.81 V, substantially lower than the manufacture’s recommendation of 1.14 V per cell. Run-time, hydrogen and air flowrates, average cell potentials and stack temperatures can all be found within the (Supplementary Material Table S2).
The OCP will always be lower than the thermodynamic limit due to entropy; however, a low OCP can provide an indication of insufficient or incomplete anode reduction; overpotential losses that cause a reduction in the voltage efficiency and thus a decrease in the cell potential, are complex and non-linear. Therefore, in addition to observing the potential with negligible current (OCP), two polarization curves were collected while increasing and decreasing the cell load from 0.0 to 0.9 A, resulting in a significant reduction in cell potential from 0.76 to 0.02 V. This confirmed the inefficacious start-up and the stack was shut down for post-mortem analysis. The polarization data can be found within the (Supplementary Material Table S3 and Figure S2). Although SOFC stacks of the same design have previously been demonstrated to deliver sufficient electrical power output [34], after significant volumes of hydrogen were introduced to the anodes within the SOFC stack, this assembly failed to perform. This was likely due to some part of the reduction profile not being effective at reducing the metal-oxide. Therefore a post-mortem of the stack was required in order to reveal where the reduction had and had not been successful.
Figure 1 illustrates the layout of the cells, electrical connection plates and gaskets within the stack, and can be used as a geometric reference for the subsequent chemical and structural analysis. The channel and land which will be referred to throughout, and the cell and stack positions with respect to the gas feed inlet are also highlighted.
The chemical analysis was conducted using a Raman spectroscope (DXR, Raman Microscope, Thermo Fisher Scientific, Waltham, MA, USA) with a 532 nm wavelength laser. Line scans were conducted for 10 mm across the surface of various cells using a step size of 20 µm and exposure time of 60 s. The Raman maps were produced with isotropic step size (pixel length) of 20 µm and exposure time of 60 s and then mapped with respect to the intensity of a particular peak, i.e., 1100 cm−1 or 1500 cm−1. The analysis and presentation of the Raman data were achieved using open-source Python scripts [35,36].
To quantify the anode surface coverage that remained substantially unreduced, the four 1500 cm−1 Raman maps (i.e., inlet cell near (map 1) and far (map 2) from fuel, and the outlet cell near (map 3) and far (map 4) from fuel) were normalized with respect to intensity; i.e., the maximum value for maps 1–4 was set to 1 and the minimum to 0. Then each pixel was evaluated for the land and channel to produce a value for the surface coverage containing substantial amounts of NiO, whereby normalized intensity values >0.8 were considered substantial. This value was divided by the total number of pixels to produce one value for the surface coverage containing NiO as a percentage of the total surface area analyzed. This analysis was then extended to the four 1100 cm−1 Raman maps.
The structural analysis was conducted using a Nikon (Nikon 225, Nikon Corporation, Tokyo 108-6290 Japan) employing a tungsten anode target within the source, producing a polychromatic beam with a characteristic peak around 58 keV (W-Kα), a source voltage peak of 160 kVp and 200 µA current. Using the cone-beam geometry, a field-of-view (FOV) of 7.8 mm and isotropic pixel size of 38 µm were achieved. After 3176 radiograph projections were collected, the data were reconstructed using a cone-beam, filtered-back-projection algorithm in commercial software (“CT Pro 3D,” Nikon Metrology, Inc., Brighton, MI, USA). The analysis and presentation of the reconstructed tomogram were conducted using Avizo Fire software (Avizo, Thermo Fisher Scientific, Waltham, MA, USA) by inspecting the greyscale ortho slices through the depth of the cell. Scanning electron microscope (SEM) images were collected using a Zeiss SEM EVO MA 10 (Carl Zeiss, Dublin, CA, USA) with all imaging conditions noted on the raw SEM images within the Supplementary Material.

3. Results

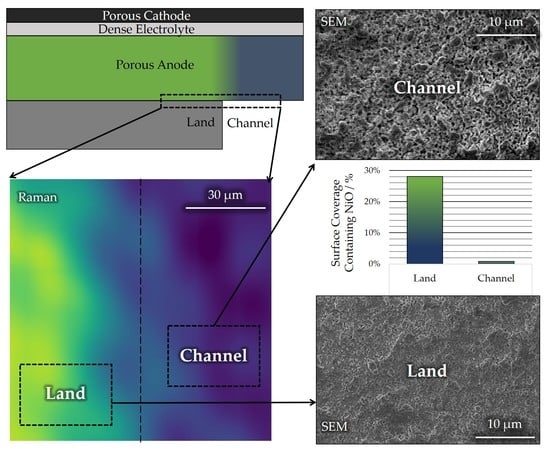
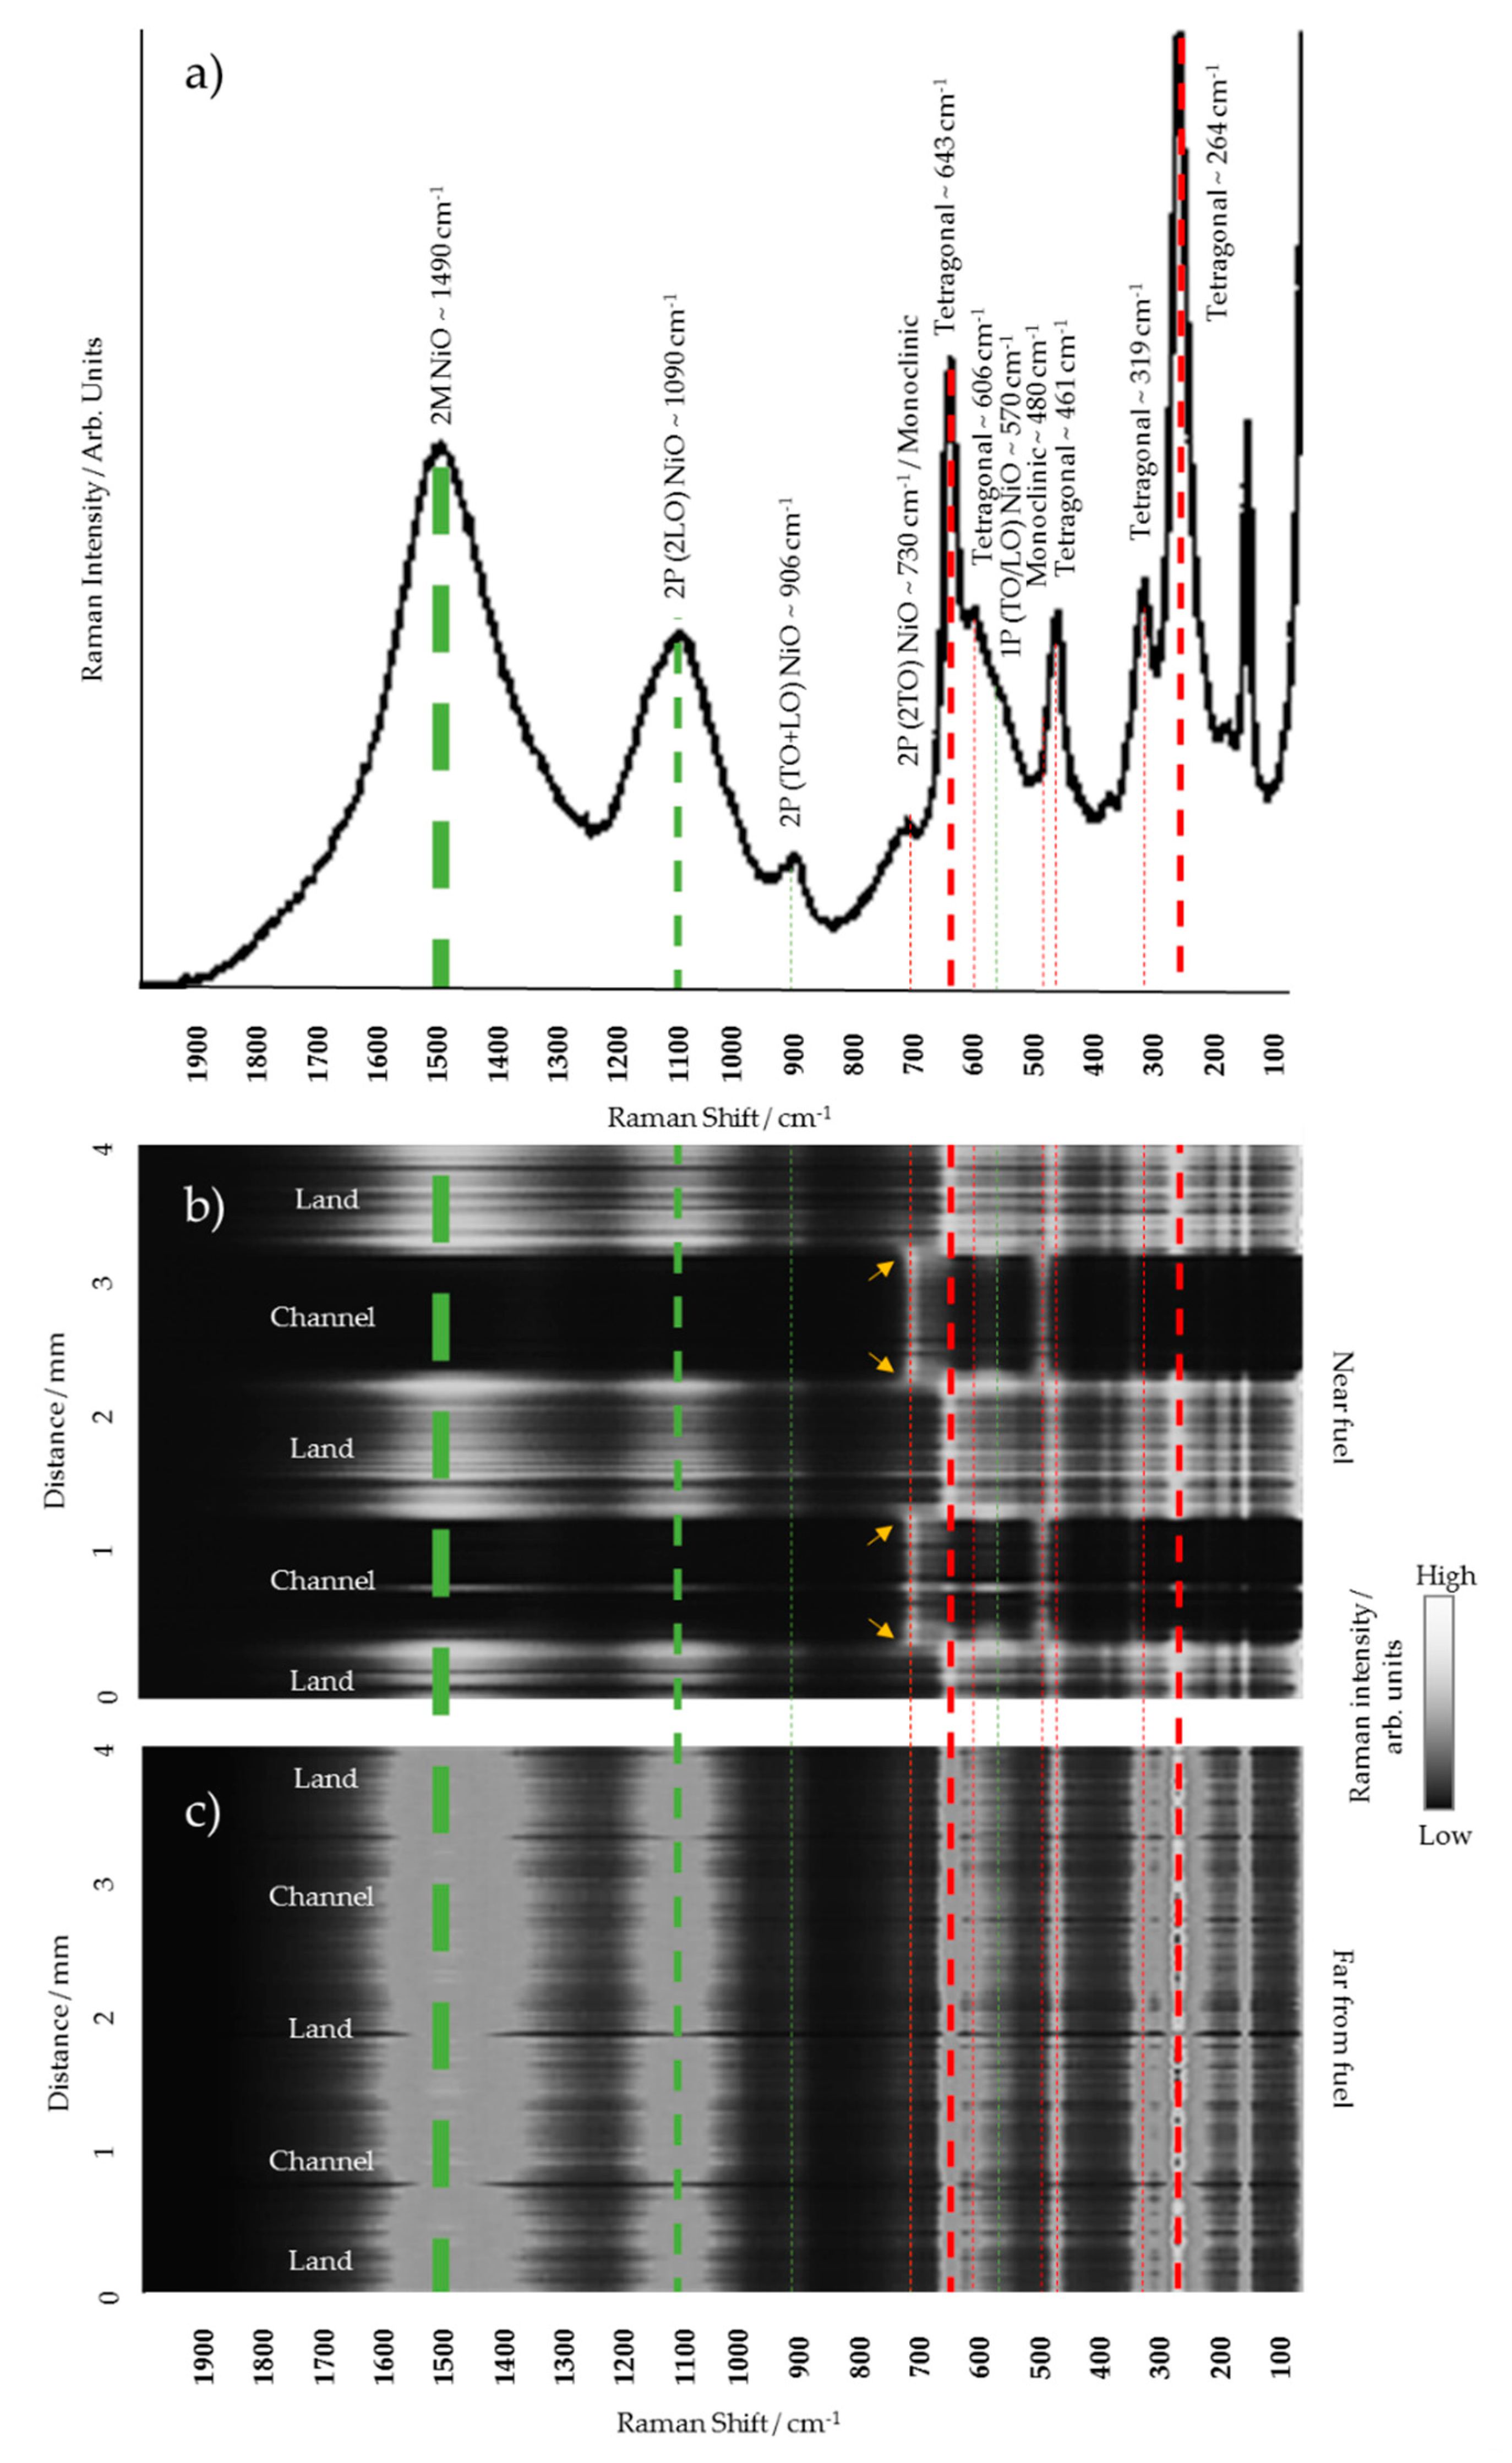
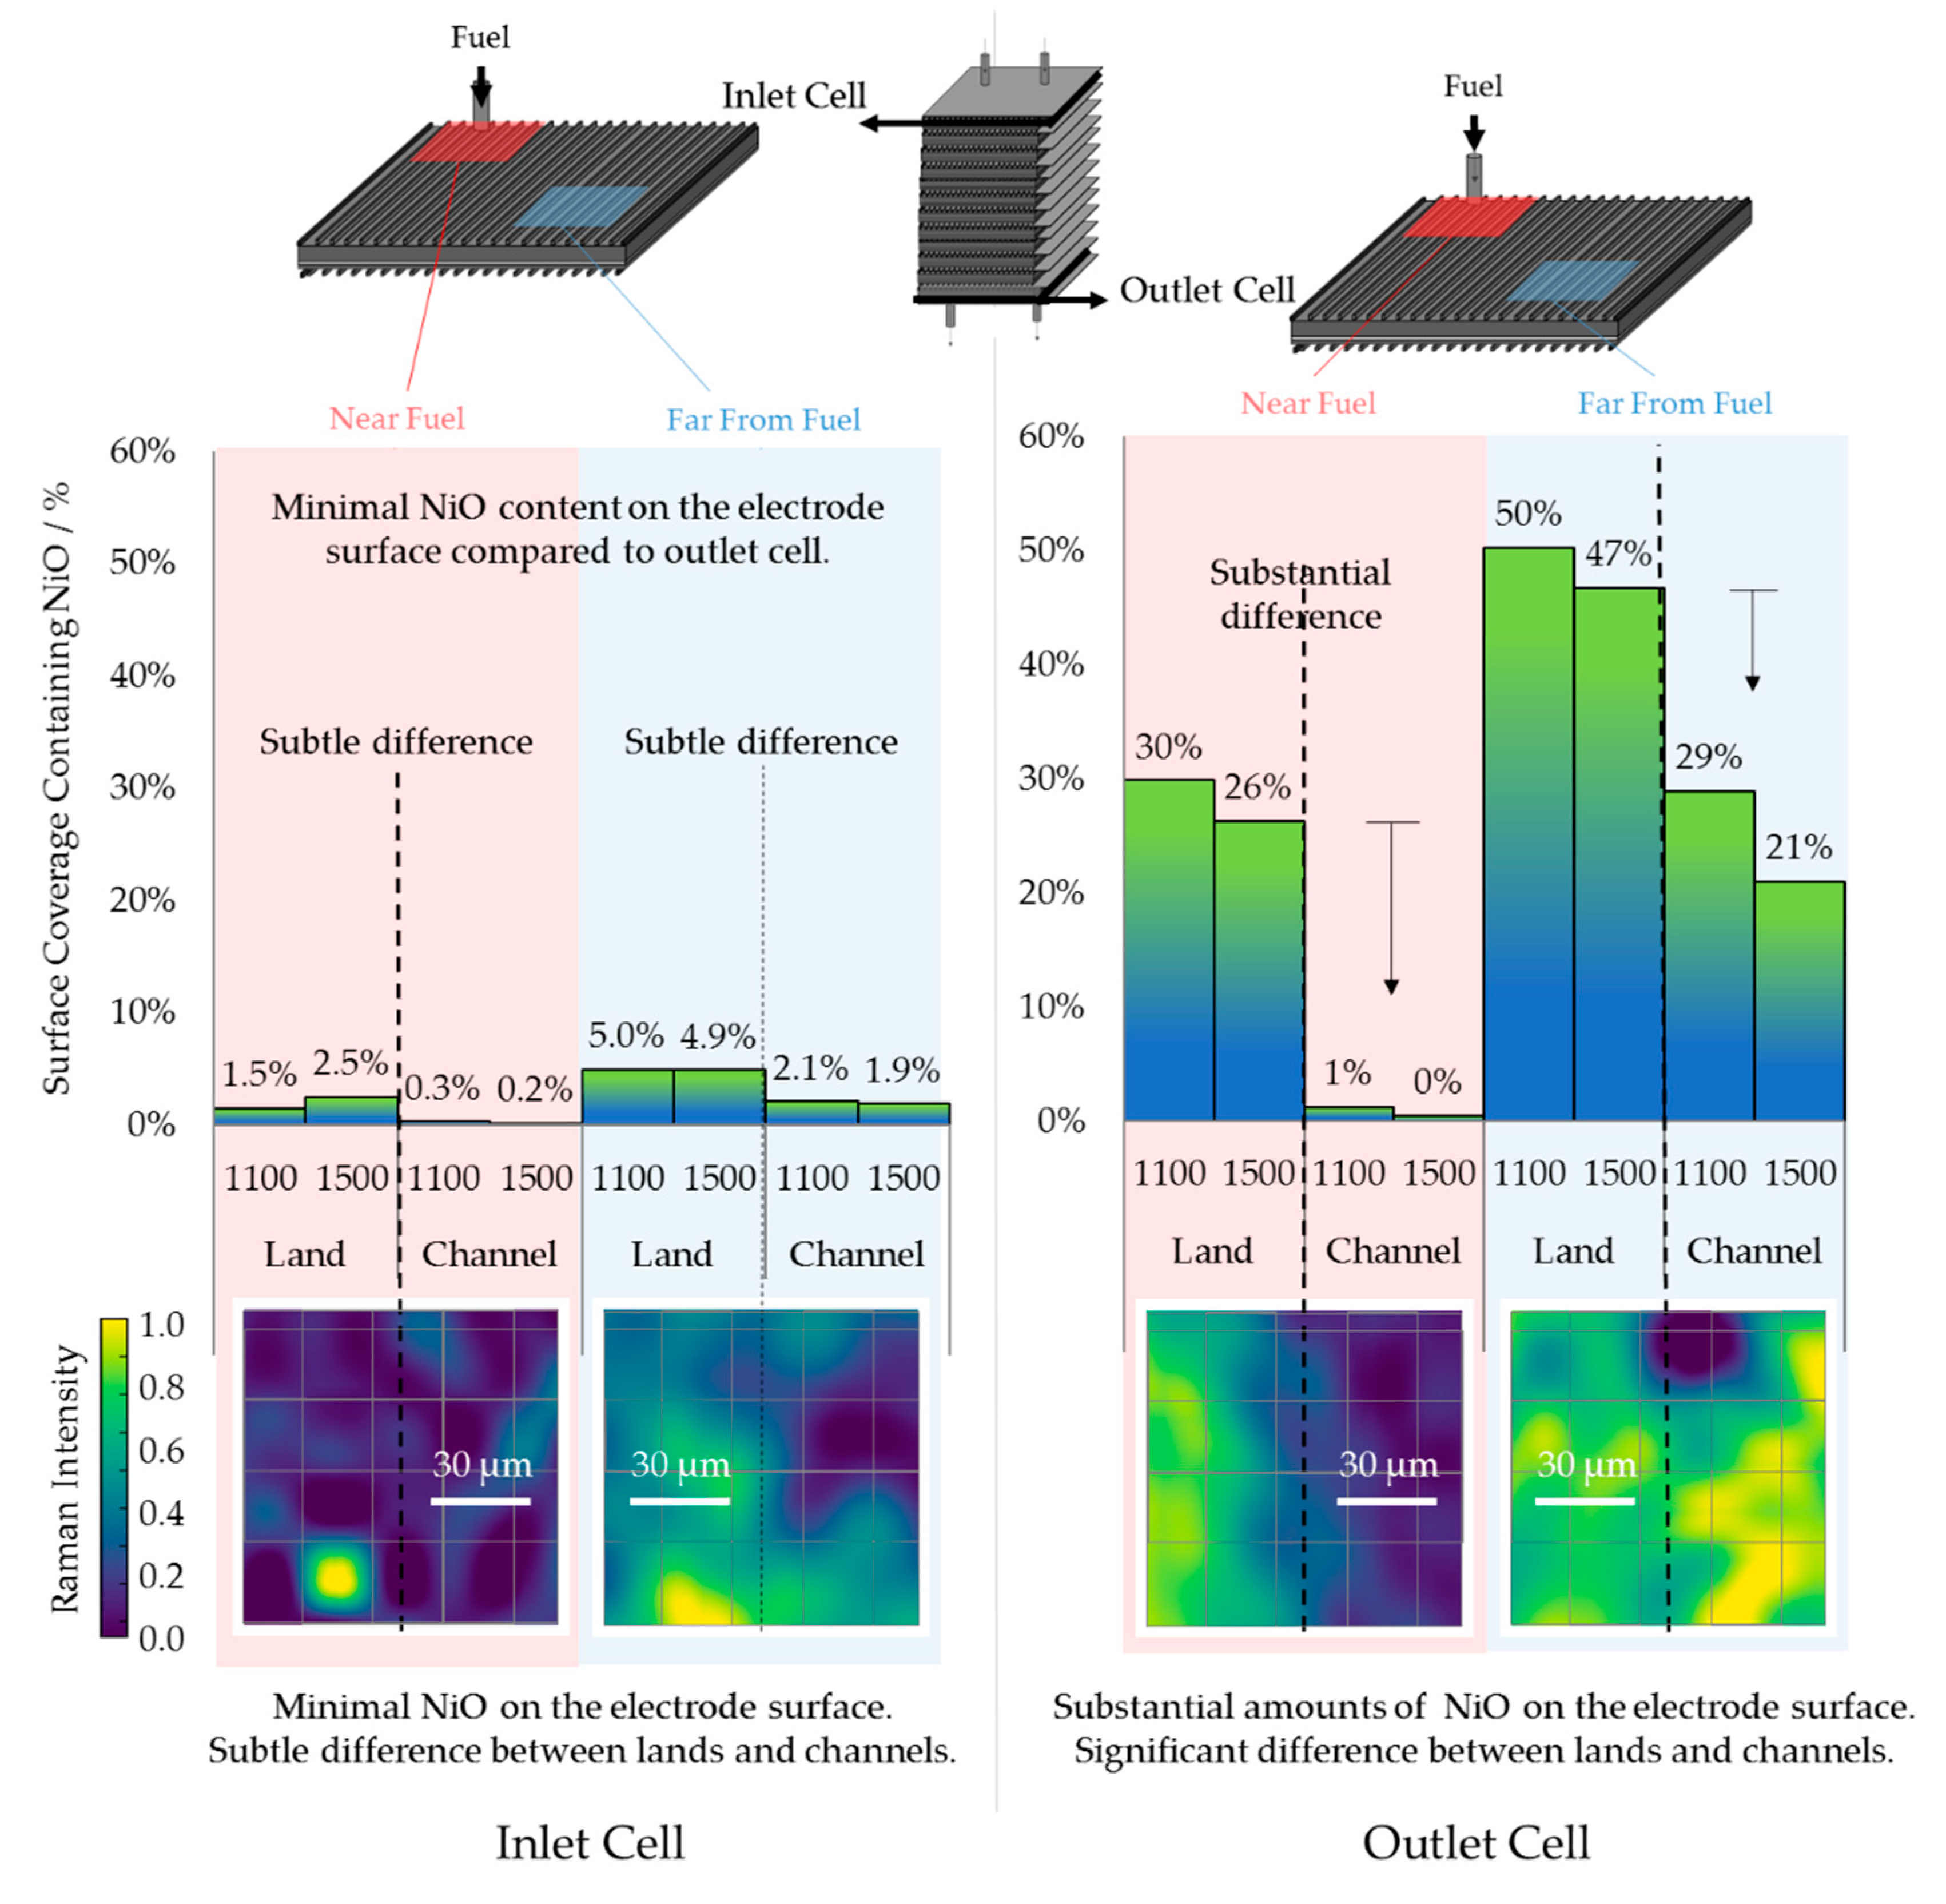
3.1. Chemical Analysis

As discussed, the cell anode is often deposited as a metal oxide, in this case NiO, which has been mixed with a ceramic to form a cermet material such as NiO–YSZ. In order to draw a current from the anode, the oxide within the cermet must be reduced to its metallic form producing Ni–YSZ. The post-mortem of the stack revealed visually green regions on the anode surface; via optical inspection, NiO is typically green, whereas Ni is grey or black in color. Figure 2a displays a single Raman scattering pattern collected from a green region of the cell surface. Additional information can be found within the (Supplementary Material Table S4). This single pattern has distinct peaks at ca. 1100 cm−1 and 1500 cm−1 that can be anticipated in the presence of NiO. In addition, there are also several other peaks (indicated in red) where the YSZ scattering can be expected [37,38,39]. To accompany this single pattern, Figure 2b,c display Raman scattering patterns that have been collected via 1D line profiles near and far from the fuel inlet, respectively. Within these plots, regions of bright white represent high count intensity and regions of dark black represent low count intensity. The single pattern and two 1D line profiles are aligned so that the NiO and YSZ peaks can be evaluated across the cell surface. For instance, the line scan taken at the cell inlet displays periodic regions of high and low count intensities, whereas the line profile taken far from the inlet does not. This suggests two things: firstly, the NiO peaks would not be present if the cell fully reduced; therefore, the reduction process was insufficient; and secondly, the degree of reduction varied across the cell; i.e., more of the anode was reduced close to the cell inlet, whereas reduction far from the inlet was relatively negligible. It was found via optical assessment that the regions of green and grey anode, i.e., high and low Raman count intensities associated with NiO in Figure 2b, aligned with the land and channels of the BPPs (See Figure S4). This suggested that reduction begins within the gas channel and has to propagate through the anode structure to reduce areas under the land. This was expected initially, as the channels were used for gas delivery and therefore would certainly see higher hydrogen partial pressures at the beginning of operation; however, the cell experienced ca. 3 h of fuel delivery, and therefore, negligible reduction, even under the land-contacts, was unexpected.
Another unexpected observation is the potential presence of monoclinic zirconia—particularly prominent in the Ni/NiO boundary regions (yellow arrows in Figure 2), where the peaks are brightest—however, the peaks extend throughout the entire channel. Zirconia is doped with yttria in order to stabilize the fluorite and tetragonal phases at lower temperatures, increasing the concentration of oxygen vacancies. If monoclinic zirconia is forming in these reduction/oxidation regions this could have detrimental ramifications for the electrochemical performance of the cell; a reduced number of oxygen vacancies may reduce the overall electrochemical activity, and thus efficiency and power density. However, the spikes in monoclinic/tetragonal concentrations are often convoluted and the authors would deem this inconclusive. The authors would encourage the use of other techniques such as synchrotron diffraction in order to obtain highly spatially resolved, low-noise crystallographic information that may confirm or refute this observation, and provide further insights.
To inspect this oxide/metallic interface further, two cells were removed from the stack—one from the stack inlet and one from the stack outlet, and 2D Raman maps were collected across the channel/land interface on the anode surface near and far from the fuel inlet, the results of which are displayed in Figure 3. Two main conclusions can be drawn from this figure: Firstly, the degree of reduction in the inlet cell is far greater than that of the outlet cell; i.e., even after 3 h of exposure to hydrogen, there remains a substantial reduction gradient across the stack; and secondly, there is consistently a higher NiO content under the BPP land-contact. As mentioned, the former observation was anticipated; generally, a higher hydrogen partial pressure provides a greater likelihood of water/steam formation through the reduction of NiO to Ni. The latter, however, was not anticipated and the prominence of the NiO/Ni boundary is significant; within 50 µm the surface NiO content climbs from ca. 1% to ca. 28% (averaged from the NiO 1100 and 1500 cm−1 Raman peaks).
Clearly, there is a gradient in the reduction extent across the stack, but reduction has also occurred heterogeneously across the cell surface, i.e., near and far from the fuel stream. It should be noted that although there was considerably greater homogeneity in the reduction near the fuel for the inlet cell, relative to the other locations, a small number of particle clusters ca. 20 µm in diameter (one pixel), remained unreduced. Moreover, regions of low Raman intensity do not indicate high porosity, only a lack of Raman active material, e.g., pore or metallic Ni. Therefore, in order to inspect microstructural variations, this study was extended through the use of X-ray CT and SEM imaging, assessed in the subsequent section.

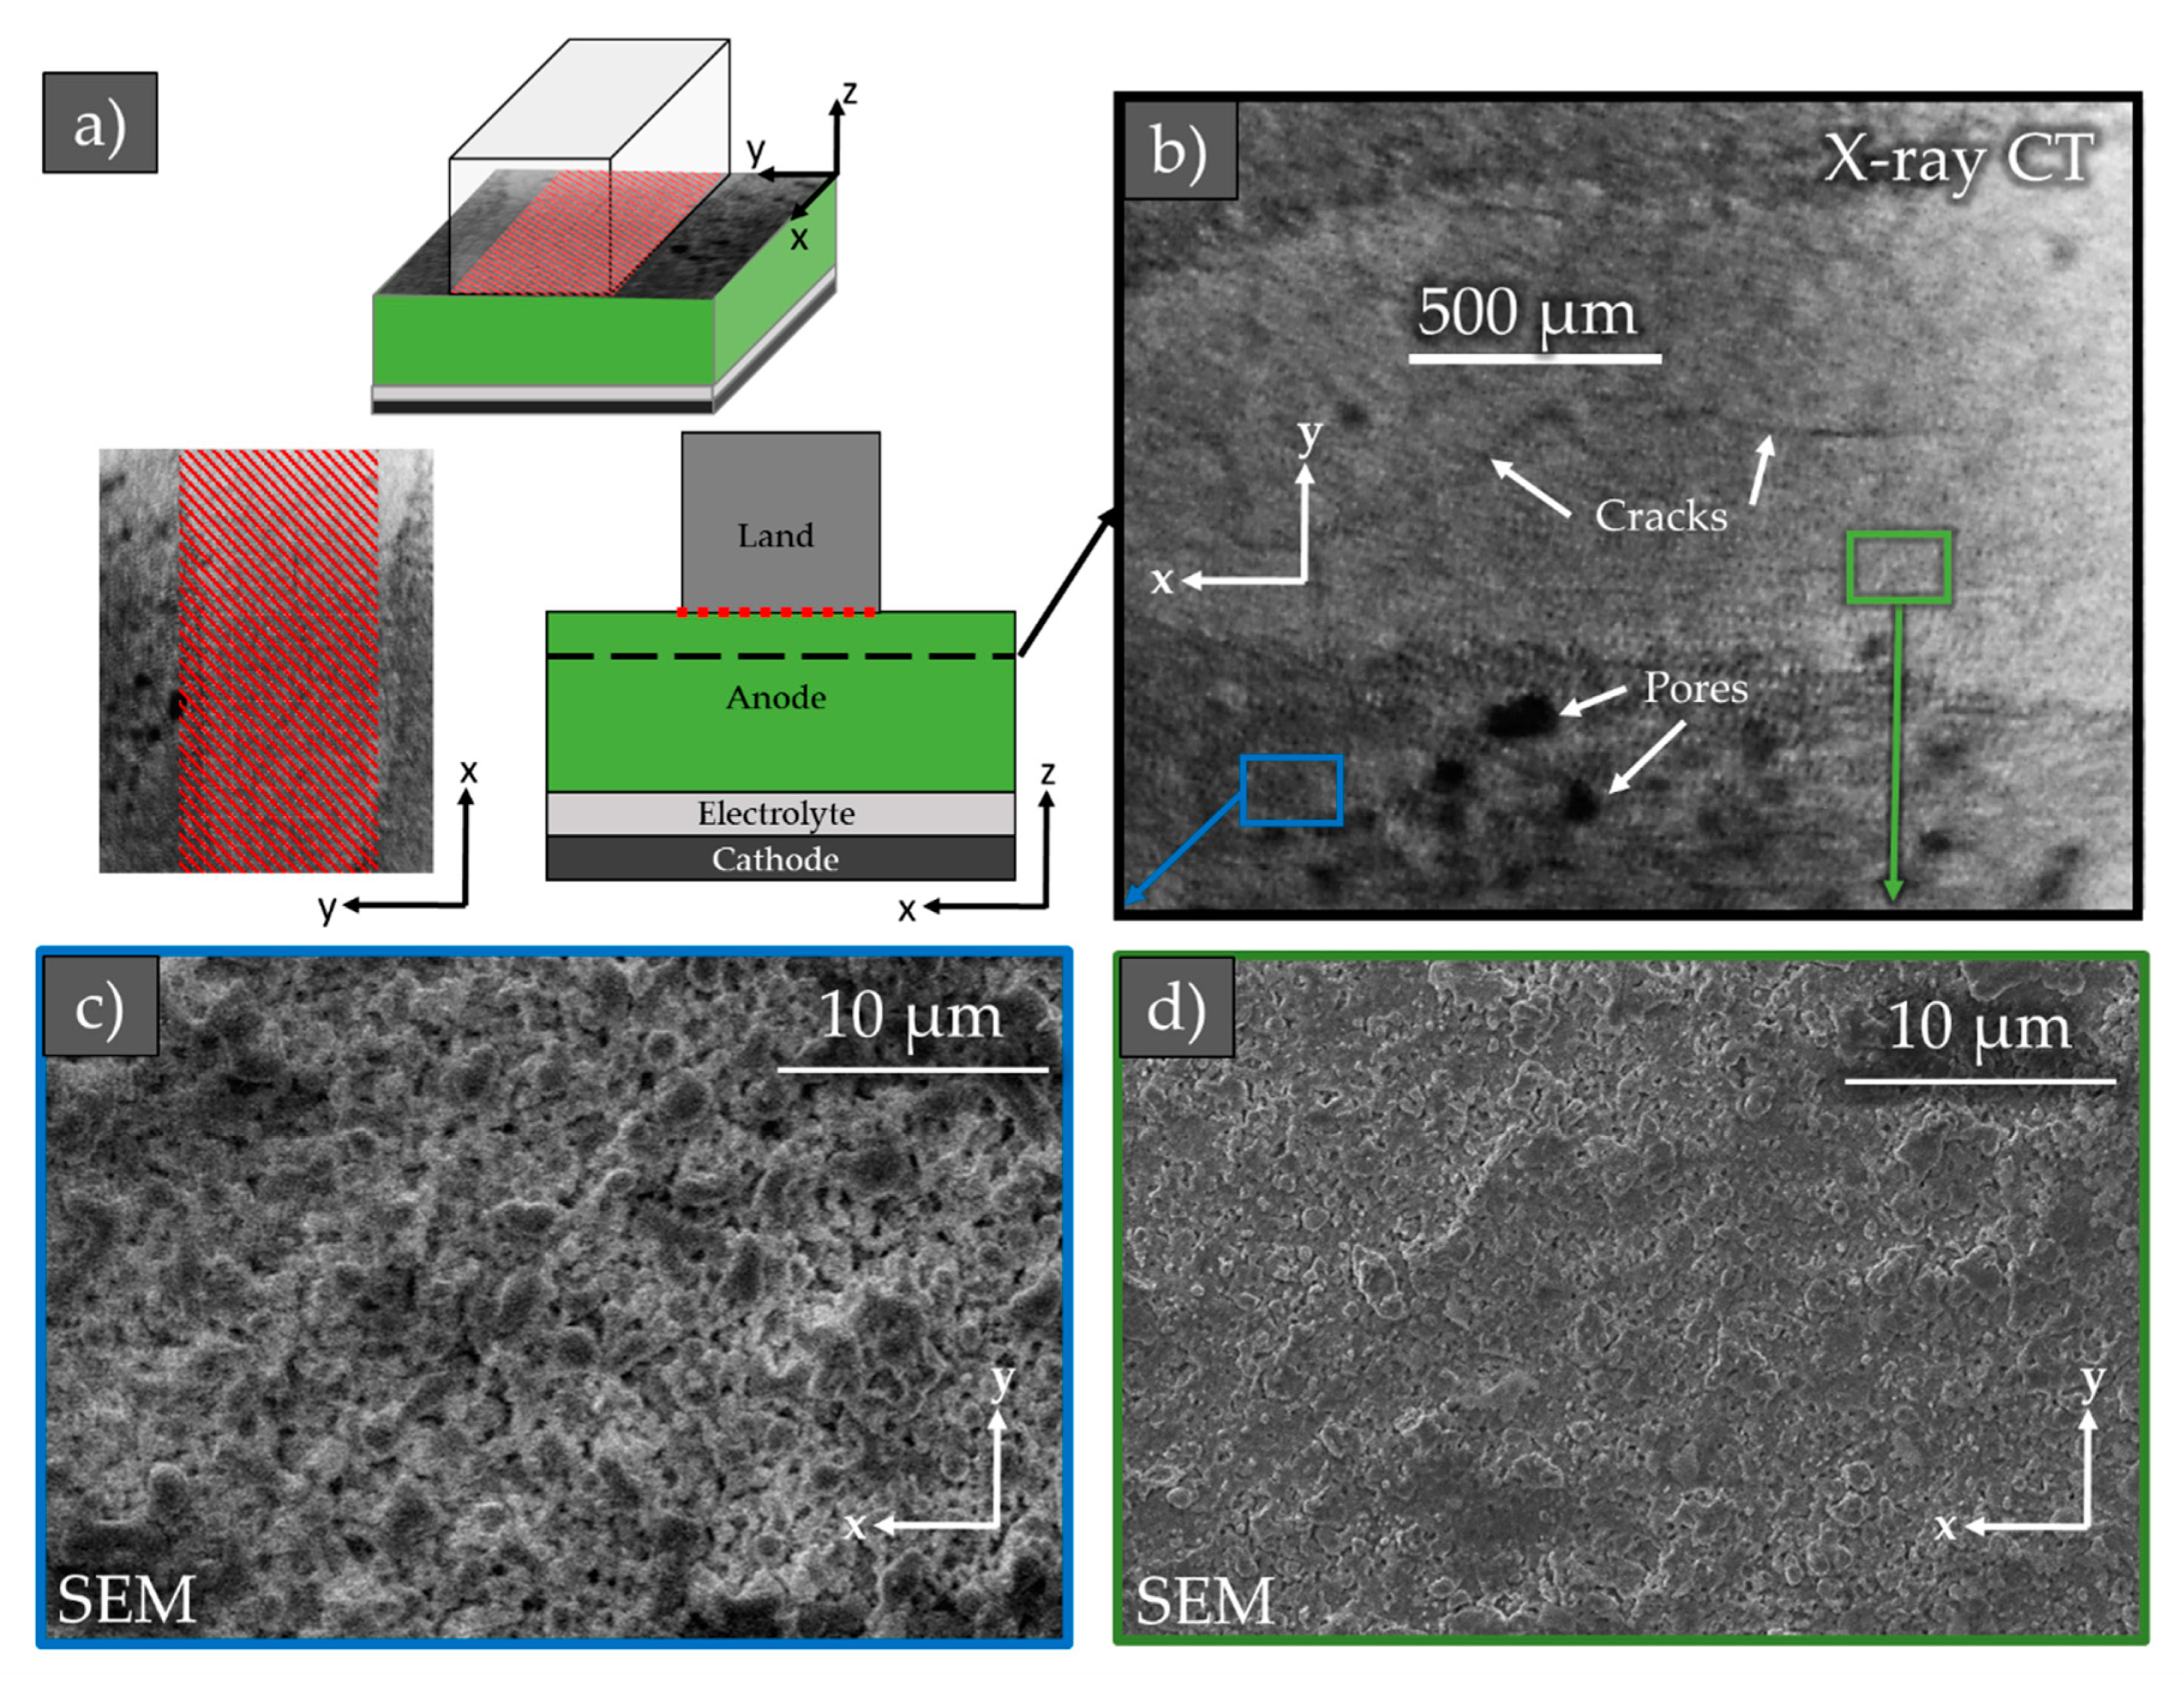
3.2. Microstructural Analysis

The reduction of NiO–YSZ to Ni–YSZ was expected to be accompanied by a porosity change that is dependent upon the initial composition of the anode, i.e., the amount of NiO in the pre-reduced form. Moreover, as mentioned, Raman is predominantly a surface technique, but the anode is composed of a complex 3D structure that extends beyond the surface and can be explored using 3D tomography techniques.
Figure 4 displays 3D reconstructed data from an X-ray tomogram collected from a sample of the cell removed from the stack outlet. This data allowed the authors to inspect the porosity variation, i.e., indirectly the NiO variation, below the surface of the cell. Within the figure there is a sub-surface ortho-slice view taken from the tomogram. The X-ray CT data suggests that regions below the land remain dense, whereas regions below the channel display a relatively lower density, corroborating the hypothesis that the regions below the channel are reduced first, as the route that the hydrogen must travel is shorter than the long meandering routes to below the land. Moreover, towards the cell center and gas inlet, the boundary between the NiO and Ni retracts into the land, again suggesting that the hydrogen content in the fuel stream has an influence on the degree of reduction contrast between the electrode below the land and channels.
The tomogram data also revealed several undesirable features, including cracking and heterogeneous pores. Predominantly, the cracking was observed under the land and extended to several millimeters, possibly as this is the main point of contact that will receive the compression loading of the unit. Under the channels, the structure displayed several heterogeneous pores that were hundreds of microns in diameter. For comparison, SEM images are also presented from the anode surface below the land and channel. Additional images can be found withn the Supplementary Material however it should be noted that the artifacts observed in the NiO SEM images were due to poor conductivity and sample movement, common for materials with low electronic conductivities such as NiO–YSZ. Although these images are limited to the anode surface, they provide higher spatial resolutions that magnify the contrasting microstructures. High resolution 3D structural information [28,40] may be required to confidently determine the cause of the heterogeneous pore and crack formation. However, the fact that these are exclusively located under the channel and land, respectively, does suggest that this is an operational defect, rather than something induced during fabrication.

4. Discussion and Conclusions

This paper investigates the potential causes of the failure of a commercial SOFC stack. It is concluded that the reduction step, during operational start-up, was insufficient in reducing the NiO to Ni within the anode. Consequently, there was a heterogeneous distribution of active material and an insufficient volume of catalyst to reach the target OCP and electrical power output.
Investigations via Raman spectroscopy are limited to surface information but allow for a detailed chemical analysis, particularly when resolved spatially via line scans or 2D mapping. The chemical analysis in this study revealed three key findings: the degree of NiO to Ni reduction can vary across the cell surface, throughout the stack and between land and channel boundaries. The severity of the heterogeneities is thought to be due to the local content of hydrogen in the gas stream, influenced by two factors: the proximity to the cell or stack inlet, and the length that the hydrogen must travel through the tortuous anode microstructure.
The X-ray CT data corroborated the chemical analysis using the cell density as an indirect measurement for the degree of cell reduction. A single sample was inspected from the stack outlet with focus placed upon the interface between the land and channel contact onto the anode. The 3D reconstruction exposed variation that extended beyond the cell surface, suggesting not only heterogeneities across the cell surface but also into the anode thickness, which again, is thought to be driven by the local hydrogen content in the gas stream.
The observation of a strong relationship between hydrogen content in the fuel stream and the degree of NiO reduction was anticipated; the unforeseen observation in this work was the severity of the reduction contrast throughout the stack and across the cell surface, even after hours of exposure to a reducing environment—particularly at the land–channel BPP interface where NiO content was observed to rise up to 30% across a 20 µm boundary, accompanied by significant porosity variations and undesirable microstructural features such as cracks and heterogeneous voids. As a consequence of these harsh boundaries, the spatiotemporal stress distribution within the stack increases in complexity from the current literature. Therefore, factors such as novel BPP contact design and the temporally-resolved local tortuosity-factors should be incorporated in computational modelling for operational start-up protocol optimization. For instance, at the component level, wider or deeper channels towards the stack inlet may allow for greater partial pressure control and uniformity throughout the stack; similarly, the use of novel manifolds and/or multi-feed systems may aid in both temperature regulation and local oxygen content. Moreover, porous or high-precision tier designs have proven useful for other fuel cells [41,42] and may be employed for SOFC BPPs to offer greater lateral diffusion, thereby reducing the severity of the oxide gradient at the land–channel interface. These, however, should be balanced with interfacial contact and compression-induced stress, and may be explored through future work via advanced computational modeling and experimental validation.
This work demonstrates the powerful combination of chemical and structural analysis that can be applied to not only SOFC stacks but also analogous systems. Fuel cells are becoming increasingly favorable as transitional technologies; consequently, it is imperative that the operational procedures are optimized in order to promote longevity and competitive performance, because only then will fuel cells be considered as viable alternatives to traditional carbon-intensive technologies. Future work may explore various start-up procedures in more detail using a similar analysis methodology as that which has been discussed here, elucidating the optimum conditions for cell operation and lifetime.

Supplementary Materials

The following are available online at https://www.mdpi.com/1996-1073/13/14/3552/s1: Table S1: Technical information as provided by the supplier. Figure S1: Schematic diagram of the experimental setup for the operation of a 2 kWel,DC fuel cell stack (SOFCMAN Ningbo, China) comprised of 30 planar 14 × 14 cm anode-supported cells and a configuration of Ni–YSZ/YSZ/CGO/LSCF-CGO, and operating on pre-heated hydrogen and air feeds. Table S2: Variation of average cell voltage and stack temperature during the reduction of the 30 cell SOFC stack. Table S3: Polarization data from the 30 cell SOFC stack at ca. 783 °C. Figure S2: Electrochemical data extracted from the SOFC stack: polarization curves collected at 783 °C with flowrates of 14 and 79 L min−1 of hydrogen and air on the anodes and cathodes, respectively, during (a) increasing and (b) decreasing current, and (c) the stack potentials for the post-reduction cycle (after ca. 4 h reduction under H2), pre-operation, post-operation and after a cell or cells failed due to a leak. Figure S3: SOFC stack (a) prior to the test; (b and c) after the test; (d) during the leak detection test. Table S4. Various NiO and YSZ peak locations. Figure S4: Correlating the positioning of the a) BPP, b) green/grey interface and c) Raman active interface. Figure S5: SEM images under the channel where the material is predominantly reduced Ni. Figure S6: SEM images under the land where the material is predominantly reduced NiO. Figure S7: EDX profiles to accompany the SEM images in Figures S5: (top) and S6 (bottom).

Author Contributions

Conceptualization, T.M.M.H., S.A.N., D.J.B. and V.M.; methodology, T.M.M.H. and S.A.N.; software, M.D.R.K.; validation, all authors; formal analysis, T.M.M.H. and S.A.N.; investigation, T.M.M.H., S.A.N., M.E., J.B.R. and M.M.; resources, D.J.L.B., P.R.S. and V.M.; data curation, T.M.M.H. and S.A.N.; writing—original draft preparation, T.M.M.H. and S.A.N.; writing—review and editing, all authors; visualization, T.M.M.H. and S.A.N.; supervision, T.M.M.H., S.A.N., D.J.L.B., P.R.S. and V.M.; project administration, T.M.M.H. and S.A.N; funding acquisition, D.J.L.B., P.R.S. and V.M. All authors have read and agreed to the published version of the manuscript.

Funding

The research conducted at University College London was funded by the EPSRC EP/M014045/1, EP/P009050/1, EP/L015749/1, and the Royal Academy for Engineering CiET1718\59. The Faraday Institution (faraday.ac.uk; EP/S003053/1), grant number FIRG001 and FIRG003. The University College London Doctoral Prize Fellowship scheme EP/M507970/1 and the UKIC Postgraduate Fellowship Scheme ICRF1718\1\34. At Cranfield, this work is part of the “Balanced Energy Network” project supported by InnovateUK Integrated Supply Chains for Energy Systems grant (InnovateUK reference: 102624). The consortium consists of ICAX Ltd., London South Bank University, Terra Firma Ground Investigations Ltd., Upside Energy Ltd., Mixergy Ltd., Origen Power Ltd., and Cranfield University.

Acknowledgments

The Authors would like to thank Howard Smith for his kind help and support during this work.

Conflicts of Interest

The authors declare no conflict of interest.

References

  1. Choudhury, A.; Chandra, H.; Arora, A. Application of solid oxide fuel cell technology for power generation—A review. Renew. Sust. Energ. Rev. 2013, 20, 430–442. [Google Scholar] [CrossRef]
  2. Stambouli, A.B.; Traversa, E. Solid oxide fuel cells (SOFCs): A review of an environmentally clean and efficient source of energy. Renew. Sust. Energ. Rev. 2002, 6, 433–455. [Google Scholar] [CrossRef]
  3. Motoc, A.M.; Valsan, S.; Slobozeanu, A.E.; Corban, M.; Valerini, D.; Prakasam, M.; Botan, M.; Dragut, V.; Vasile, B.S.; Surdu, A.V.; et al. Design, Fabrication, and Characterization of New Materials Based on Zirconia Doped With Mixed Rare Earth Oxides: Review and First Experimental Results. Metals 2020, 10, 746. [Google Scholar] [CrossRef]
  4. Vecino-Mantilla, S.; Quintero, E.; Fonseca, C.; Gauthier, G.H.; Gauthier-Maradei, P. Catalytic steam reforming of natural gas over a new Ni exsolved Ruddlesden-Popper manganite in SOFC anode conditions. ChemCatChem 2020, 12. [Google Scholar] [CrossRef]
  5. Gulicovski, J.; Nenadović, S.; Kljajević, L.; Mirković, M.; Nišavić, M.; Kragović, M.; Stojmenović, M. Geopolymer/CeO2 as Solid Electrolyte for IT-SOFC. Polymers 2020, 12, 248. [Google Scholar] [CrossRef] [Green Version]
  6. Udomsilp, D.; Rechberger, J.; Neubauer, R.; Bischof, C.; Thaler, F.; Schafbauer, W.; Menzler, N.H.; de Haart, L.G.; Nenning, A.; Opitz, A.K.; et al. Metal-Supported Solid Oxide Fuel Cells with Exceptionally High Power Density for Range Extender Systems. Cell Reports Phys. Sci. 2020, 100072. [Google Scholar] [CrossRef]
  7. Zhu, B.; Fan, L.; Kim, J.S. and Lund, P.D. Electrolyte-Free SOFCs: Materials, Technologies, and Working Principles. In Solid Oxide Fuel Cells: From Electrolyte-Based to Electrolyte-Free Devices; Zhu, B., Raza, R., Fan, L., Sun, C., Eds.; John Wiley & Sons: Weinheim, Germany, 2020; pp. 173–211. [Google Scholar] [CrossRef]
  8. Hagen, A.; Barfod, R.; Hendriksen, P.V.; Liu, Y.L.; Ramousse, S. Degradation of anode supported SOFCs as a function of temperature and current load. J. Electrochem. Soc. 2006, 153, A1165–A1171. [Google Scholar] [CrossRef]
  9. Badwal, S.P.S. Stability of solid oxide fuel cell components. Solid State Ion. 2001, 143, 39–46. [Google Scholar] [CrossRef]
  10. Yokokawa, H.; Tu, H.; Iwanschitz, B.; Mai, A. Fundamental mechanisms limiting solid oxide fuel cell durability. J. Power Sources 2008, 182, 400–412. [Google Scholar] [CrossRef]
  11. Iwanschitz, B.; Sfeir, J.; Mai, A.; Schütze, M. Degradation of SOFC anodes upon redox cycling: A comparison between Ni/YSZ and Ni/CGO. J. Electrochem. Soc. 2010, 157, B269–B278. [Google Scholar] [CrossRef]
  12. Robinson, J.B.; Brown, L.D.; Jervis, R.; Taiwo, O.O.; Heenan, T.M.M.; Millichamp, J.; Mason, T.J.; Neville, T.P.; Clague, R.; Eastwood, D.S.; et al. Investigating the effect of thermal gradients on stress in solid oxide fuel cell anodes using combined synchrotron radiation and thermal imaging. J. Power Sources 2015, 288, 473–481. [Google Scholar] [CrossRef]
  13. Maher, R.C.; Cohen, L.F.; Lohsoontorn, P.; Brett, D.J.L.; Brandon, N.P. Raman spectroscopy as a probe of temperature and oxidation state for gadolinium-doped ceria used in solid oxide fuel cells. J. Phys. Chem. A 2008, 112, 1497–1501. [Google Scholar] [CrossRef]
  14. Maher, R.C.; Shearing, P.R.; Brightman, E.; Brett, D.J.; Brandon, N.P.; Cohen, L.F. Reduction dynamics of doped ceria, nickel oxide, and cermet composites probed using in situ raman spectroscopy. Adv. Sci. 2016, 3, 1500146. [Google Scholar] [CrossRef] [PubMed] [Green Version]
  15. Brightman, E.; Maher, R.; Offer, G.J.; Duboviks, V.; Heck, C.; Cohen, L.F.; Brandon, N.P. Designing a miniaturised heated stage for in situ optical measurements of solid oxide fuel cell electrode surfaces, and probing the oxidation of solid oxide fuel cell anodes using in situ Raman spectroscopy. Rev. Sci. Instrum. 2012, 83, 053707. [Google Scholar] [CrossRef]
  16. Deleebeeck, L.; Shishkin, M.; Addo, P.; Paulson, S.; Molero, H.; Ziegler, T.; Birss, V. Activation of H 2 oxidation at sulphur-exposed Ni surfaces under low temperature SOFC conditions. Phys. Chem. 2014, 16, 9383–9393. [Google Scholar] [CrossRef] [PubMed]
  17. Brightman, E.; Ivey, D.G.; Brett, D.J.L.; Brandon, N.P. The effect of current density on H2S-poisoning of nickel-based solid oxide fuel cell anodes. J. Power Sources 2011, 196, 7182–7187. [Google Scholar] [CrossRef]
  18. Nurk, G.; Huthwelker, T.; Braun, A.; Ludwig, C.; Lust, E.; Struis, R.P.W.J. Redox dynamics of sulphur with Ni/GDC anode during SOFC operation at mid-and low-range temperatures: An operando S K-edge XANES study. J. Power Sources 2013, 240, 448–457. [Google Scholar] [CrossRef] [Green Version]
  19. Izzo, J.R.; Joshi, A.S.; Grew, K.N.; Chiu, W.K.; Tkachuk, A.; Wang, S.H.; Yun, W. Nondestructive reconstruction and analysis of SOFC anodes using X-ray computed tomography at sub-50 nm resolution. J. Electrochem. Soc. 2008, 155, B504–B508. [Google Scholar] [CrossRef] [Green Version]
  20. Shearing, P.R.; Gelb, J.; Brandon, N.P. X-ray nano computerised tomography of SOFC electrodes using a focused ion beam sample-preparation technique. J. Eur. Ceram. 2010, 30, 1809–1814. [Google Scholar] [CrossRef]
  21. Guan, Y.; Li, W.; Gong, Y.; Liu, G.; Zhang, X.; Chen, J.; Gelb, J.; Yun, W.; Xiong, Y.; Tian, Y.; et al. Analysis of the three-dimensional microstructure of a solid-oxide fuel cell anode using nano X-ray tomography. J. Power Sources 2011, 196, 1915–1919. [Google Scholar] [CrossRef]
  22. Laurencin, J.; Quey, R.; Delette, G.; Suhonen, H.; Cloetens, P.; Bleuet, P. Characterisation of Solid Oxide Fuel Cell Ni–8YSZ substrate by synchrotron X-ray nano-tomography: From 3D reconstruction to microstructure quantification. J. Power Sources 2012, 198, 182–189. [Google Scholar] [CrossRef]
  23. Heenan, T.M.M.; Lu, X.; Iacoviello, F.; Robinson, J.B.; Brett, D.J.L.; Shearing, P.R. Thermally Driven SOFC Degradation in 4D: Part I. Microscale. J. Electrochem. Soc. 2018, 165, F921–F931. [Google Scholar] [CrossRef] [Green Version]
  24. Heenan, T.M.M.; Lu, X.; Robinson, J.B.; Iacoviello, F.; Brett, D.J.L.; Shearing, P.R. Thermally Driven SOFC Degradation in 4D: Part II. Macroscale. J. Electrochem. Soc. 2018, 165, F932–F941. [Google Scholar] [CrossRef] [Green Version]
  25. Feser, M.; Gelb, J.; Chang, H.; Cui, H.; Duewer, F.; Lau, S.H.; Tkachuk, A.; Yun, W. Sub-micron resolution CT for failure analysis and process development. Meas. Sci. Tehcnol. 2008, 19, 094001. [Google Scholar] [CrossRef]
  26. Graham, M.J.; Cohen, M. On the Mechanism of Low-Temperature Oxidation (23°–450° C) of Polycrystalline Nickel. J. Electrochem. Soc. 1972, 119, 879–882. [Google Scholar] [CrossRef]
  27. Sarantaridis, D.; Atkinson, A. REDOX Cycling of Ni-Based Solid Oxide Fuel Cell Anodes: A Review. Fuel Cells 2007, 7, 246–258. [Google Scholar] [CrossRef]
  28. Shearing, P.R.; Bradley, R.S.; Gelb, J.; Tariq, F.; Withers, P.J.; Brandon, N.P. Exploring microstructural changes associated with oxidation in Ni–YSZ SOFC electrodes using high resolution X-ray nano-CT computed tomography. Solid State Ion. 2012, 216, 69–72. [Google Scholar] [CrossRef]
  29. Heenan, T.M.M.; Finegan, D.P.; Tjaden, B.; Lu, X.; Iacoviello, F.; Millichamp, J.; Brett, D.J.; Shearing, P.R. 4D nano-tomography of electrochemical energy devices using lab-based X-ray imaging. Nano Energy 2018, 47, 556–565. [Google Scholar] [CrossRef]
  30. Ding, K.; Zhu, M.; Han, Z.; Kochetov, V.; Lu, L.; Chen, D. Momentum-species-heat-electrochemistry distribution characteristics within solid oxide fuel cell stack with complex inter-digital fuel channels. Ionics 2020, 1–12. [Google Scholar] [CrossRef]
  31. Son, J.; Hwang, S.; Hong, S.; Heo, S.; Kim, Y.B. Parameter Study on Solid Oxide Fuel Cell Heat-Up Process to Reaction Starting Temperature. Int. J. Precis. Eng. Manuf.-Green Tech. 2019, 1–11. [Google Scholar] [CrossRef]
  32. Pan, J.; Yang, J.; Yan, D.; Pu, J.; Chi, B.; Li, J. Effect of thermal cycling on durability of a solid oxide fuel cell stack with external manifold structure. Int. J. Hydrog. Energy 2020, 45, 17927–17934. [Google Scholar] [CrossRef]
  33. Lyu, Y.; Xie, J.; Wang, D.; Wang, J. Review of cell performance in solid oxide fuel cells. J. Mater. Sci. 2020, 1–24. [Google Scholar] [CrossRef]
  34. Nabavi, S.A.; Erans, M.; Manović, V. Demonstration of a kW-scale solid oxide fuel cell-calciner for power generation and production of calcined materials. Appl. Energy 2019, 255, 113731. [Google Scholar] [CrossRef]
  35. Oliphant, T.E. Python for scientific computing. Comput. Sci. Eng. 2007, 9, 10–20. [Google Scholar] [CrossRef] [Green Version]
  36. Hunter, J.D. Matplotlib: A 2D graphics environment. Comput. Sci. Eng. 2007, 9, 90. [Google Scholar] [CrossRef]
  37. Lughi, V.; Clarke, D.R. High temperature aging of YSZ coatings and subsequent transformation at low temperature. Surf. Coat. Technol. 2005, 200, 1287–1291. [Google Scholar] [CrossRef]
  38. Clarke, D.R.; Adar, F. Measurement of the crystallographically transformed zone produced by fracture in ceramics containing tetragonal zirconia. J. Am. Ceram. Soc. 1982, 65, 284–288. [Google Scholar] [CrossRef]
  39. Mironova-Ulmane, N.; Kuzmin, A.; Steins, I.; Grabis, J.; Sildos, I.; Pärs, M. Raman scattering in nanosized nickel oxide NiO. In Journal of Physics: Conference Series, Proceedings of the Functional Materials and Nanotechnologies, Riga, Latvia, 2–4 April 2007; IOP Publishing: Bristolm, UK, December 2007; Volume 93, No. 1; p. 1012039. [Google Scholar] [CrossRef]
  40. De Angelis, S.; Jørgensen, P.S.; Tsai, E.H.R.; Holler, M.; Kreka, K.; Bowen, J.R. Three dimensional characterization of nickel coarsening in solid oxide cells via ex-situ ptychographic nano-tomography. J. Power Sources 2018, 383, 72–79. [Google Scholar] [CrossRef] [Green Version]
  41. Cho, J.I.S.; Marquis, J.; Trogadas, P.; Neville, T.P.; Brett, D.J.L.; Coppens, M.O. Optimizing the architecture of lung-inspired fuel cells. Chem. Eng. Sci. 2020, 215, 115375. [Google Scholar] [CrossRef]
  42. Grigoriev, S.A.; Millet, P.; Volobuev, S.A.; Fateev, V.N. Optimization of porous current collectors for PEM water electrolysers. Int. J. Hydrog. Energy 2009, 34, 4968–4973. [Google Scholar] [CrossRef]
Figure 1. Illustrations of a solid oxide fuel cell (SOFC) stack: (a) the cross-section from a stack composed of two cells simplified in 2D; (b) a twelve cell stack in 3D; and (c) an exploded image of a two cell stack, with magnification of the cell surface and gas channels. Note that the stack investigated in this work comprised 30 cells.
Energies 13 03552 g001
Figure 2. Raman spectroscopy line scans from a partially-reduced SOFC anode: (a) Raman intensity profile taken from a green region with particular peaks of interest highlighted (Ni-based in green, YSZ-based in red); line scans whereby black and white respectively refer to high and low Raman intensities for the anode surface (b) near and (c) far from the fuel inlet.
Energies 13 03552 g002
Figure 3. Raman spectroscopy mapping of the anode surface at various locations within an SOFC stack. Surface coverage was calculated for both 1100 and 1500 cm−1 Raman peaks. Raman maps are reported from the 1100 cm−1 peak. Gridlines indicate approximate spatial resolution.
Energies 13 03552 g003
Figure 4. Microstructural information obtained from an SOFC cell: (a) geometric reference for the X-ray and electron imaging; (b) a sub-surface ortho-slice image taken from an X-ray CT tomogram; and SEM images of (c) the Ni-dominated channel and (d) NiO-dominated land. Raw SEM images can be found within the (Supplementary Material Figures S5–S7).
Energies 13 03552 g004

