Article

Extending the Application of the Smart Readiness Indicator—A Methodology for the Quantitative Assessment of the Load Shifting Potential of Smart Districts

by
Thomas Märzinger
1 and
Doris Österreicher
2,*
1
Department of Material Sciences and Process Engineering, Institute for Chemical and Energy Engineering, University of Natural Resources and Life Sciences, 1190 Vienna, Austria
2
Department of Landscape, Spatial and Infrastructure Sciences, Institute of Spatial Planning, Environmental Planning and Land Rearrangement, University of Natural Resources and Life Sciences, 1190 Vienna, Austria
*
Author to whom correspondence should be addressed.
Energies 2020, 13(13), 3507; https://doi.org/10.3390/en13133507
Submission received: 2 June 2020 / Revised: 1 July 2020 / Accepted: 3 July 2020 / Published: 7 July 2020
(This article belongs to the Special Issue Evaluation of Energy Efficiency and Flexibility in Smart Buildings)

Abstract

:
In 2018, the revised Energy Performance of Buildings Directive (EPBD) included for the first time the application of a smart readiness indicator (SRI). Based on the fact that load shifting in and across buildings plays an increasingly important role to improve efficiency and alleviate the integration of renewable energy systems, the SRI is also aimed at providing an indication of how well buildings can interact with the energy grids. With the clustering of buildings into larger entities, synergies related to the integration of renewable energy and load shifting can be efficiently exploited. However, current proposals for the SRI focus mainly on qualitative appraisals of the smartness of buildings and do not include the wider context of the districts. Quantitative approaches that can be easily applied at an early planning stage are still mostly missing. To optimize infrastructure decisions on a larger scale, a quantifiable perspective beyond the building level is necessary to evaluate and leverage the larger load shifting capacities. This article builds on a previously published methodology for smart buildings with the aim to provide a numerical model-based approach on the assessment of whole districts based on their overall energy storage capacity, load shifting potential and their ability to actively interact with the energy grids. It also delivers the equivalent CO2 savings potential compared to a non-interactive system. The methodology is applied to theoretical use cases for validation. The results highlight that the proposed quantitative model can provide a meaningful and objective assessment of the load shifting potentials of smart districts.

1. Introduction

At the end of 2019, the newly elected President of the European Commission published the European Green Deal [1], a roadmap for transforming the EU’s economy towards sustainability. The goal is for the EU to be climate neutral in 2050 by boosting the efficiency and use of resources, moving to a clean and circular economy and restoring biodiversity and cutting pollution. The de-carbonization of the energy sector, as well as ensuring that buildings become more energy efficient, is amongst the key actions in this long-term strategy. The subsequent proposal for the first European Climate Law [2] aims to ensure that all EU policies contribute to the European Green Deal and that all sectors of the economy and society will play their part. With over 40% of the global energy consumption being attributed to the construction and use of buildings [3,4] and the European building sector being responsible for an estimated 39% of final energy consumption [5] it is evident, that any future oriented government must include buildings and their associated infrastructure at the core of its roadmaps.
Currently EU legislation related to energy use in buildings is based on the Energy Efficiency Directive [6], the Renewable Energy Directive [7], and Energy Performance of Buildings Directive (EPBD) [8], with each directive providing the framework conditions for the national regulations and standards. The EPBD, which came into force for the first time in 2002 has since then be twice revised in 2010 and 2018 [9], with each new version imposing yet stricter regulations on energy efficiency in buildings. In the last amendment the EPBD included for the first time the development and application of a so-called smart readiness indicator (SRI), which should describe how well the building can interact with the grid, manage and optimize itself, and relate information to and from its occupants. Since the SRI has not been fully elaborated in the regulative document, a study has subsequently been commissioned by the EC in order to provide guidance and a coherent framework for the member states [10,11]. The study provides a calculation framework for the assessment of the SRI that is based on qualitative indicators in a matrix approach that covers a series of impact criteria, domains and domain services. The framework focuses mostly on a qualitative assessment that is dependent on certified assessors, thus adding the danger of subjectivity to the process. Since its publication the consortium has carried out several tests to validate the process. An independent study also concluded that the approach shows limitations, particularly when applied to colder climates [12]. Another recently published analysis highlights the inherent subjectivity of the proposed solution as it documents how two independent research groups carrying out the assessment on the same buildings came to highly diverging results [13]. It is expected that more appraisals will follow to assess whether the initial proposal poses a viable way forward. The member states of the European Union will finally have to jointly or individually decide on the specific process to be implemented in their countries.
In a position paper of the “Annex 67: Energy Flexible Buildings” of the International Energy Agency (IEA) the authors argue, that there is a need for a quantitative analysis of buildings’ energy flexibility [14]. Whilst a market model is proposed as an assessment, this is not considered entirely future proof, as costs and markets are subject to change [15]. One of the key objectives of the SRI is the assessment of the load shifting potentials of buildings, however this aspect is not explicitly quantified within the above-discussed study [10,11]. Also, the district is not considered, even though the clustering of larger entities becomes more important as load shifting capabilities increase. In a previous publication [16], the authors of this article have already proposed a methodology to integrate a quantitative assessment of the load shifting potential of buildings in order to support an objective judgment and subsequent implementation of the SRI. Based on the definition of the SRI in that paper, conclusions can be drawn on the load shifting potential of buildings. Following the publication, the authors have consulted with relevant stakeholders to gather feedback on the proposed methodology and to identify relevant research gaps.
This article consequently builds on the previously published methodology with the aim to provide a coherent assessment to support the optimization of infrastructure decisions on a larger scale based on the hypothesis that a perspective beyond the building level is necessary to leverage potential load shifting capacities of the built environment. The underlying hypothesis is, that the methodology for the SRI can also be expanded to larger entities, such as districts or cities and that it can provide an adequate approximation for the potential CO2 savings. The subsequent research questions follow this hypothesis and can be summarized as follows: (1) How can the definition of the SRI be extended in terms of an efficiency limit? (2) Can the assessments for buildings be meaningfully extended to groups of buildings and larger districts? (3) Can the equivalent CO2 savings potential be derived from the methodology?
As a result, the objective of this study is the adaptation and enlargement of the methodology to also include larger entities as well as infrastructure and CO2 assessments on a district scale. The aim is to provide a numerical model-based approach on the assessment of whole districts based on their overall energy storage capacity, load shifting potential and their ability to actively interact with the energy grids. In addition to the district SRI and the district load shifting potential it also provides an estimation of the equivalent CO2 savings compared to a system that does not include the building’s load shifting potential. Comparably to the first publication, the approach is applied to theoretical use cases for validation. It shows that a comprehensive quantitative approach can provide meaningful result also on a district level, thus delivering important answers to the question of how much buildings can contribute to actively store and dispatch energy within a district or larger urban quarter.
The following Section 2 highlights the current state of the art and subsequent research gap this publication is addressing in the context of the assessments of smart districts. The regulative framework conditions are briefly outlined, followed by an account of state-of-the-art research related to the load shifting potential in buildings in combination with the increased use of renewable energy systems (RES). The particular focus on smart districts is seen as the logical intermediate step between smart buildings and smart cities. Section 3 describes the overall methodology, respective equations and derivations for the assessment. In Section 4 the approach is tested on a theoretical use case on a small representative district in the City of Vienna. The discussion in Section 5 finally provides a review of this extended methodology, its limitations, as well as potential for a wider application with the goal that the member states include an objective and quantitative assessment within their new regulations related to the Smart Readiness Indicator.

2. Background

Buildings play undoubtedly a crucial role within a sustainable and fossil-free energy system. Whilst the focus on the single entity is hugely relevant in order to develop highly efficient materials, structures and system, the enlargement of the perspective to bigger entities can be crucial to leverage the full potential of connected systems. Especially in dense urban environments, buildings cannot only be viewed as detached elements, but must be perceived within a wider neighborhood in their urban morphological and societal context. Resilient urban development thus sets a particular focus on concepts for sustainable, efficient, and green districts [17]. The de-carbonization of the energy systems will heavily rely on the widespread integration of RES. But since demand and supply can be deeply asynchronous, demand response management and storage potentials must be implemented to match the scale of renewables. Energy grids can provide the required transfer for electrical and thermal energy. Whilst on the building level infrastructure considerations are mostly dependent on the already existing infrastructure on a particular building site, planning on a district scale offers a broader range of options. In addition to larger urban or regional networks, small-scale infrastructure, such as district heating or cooling networks, can be included at this scale.

2.1. Regulative Background and Current Developments on the SRI

Within the latest revision of the EPBD the regulators also foresee a Smart Readiness Indicator (SRI) that rates a building to use information and communication technology (ICT) to adapt the operation of the building to the needs of the occupants and the grid [9]. As a support mechanism, the European Commission has funded a study to provide a coherent methodology for the assessment of the SRI for the member states [10]. After the publication of the original findings in 2018, the consortium subsequently started a stakeholder consultation process to review the applicability of their proposal. This process included the review of a series of topics, including cost and cost-benefits, climatic specificities, scoring system and testing. They also implemented two expert topical stakeholder working groups focused on SRI value proposition and implementation as well as SRI calculation methodology. The findings of the process and adaptations have been summarized in the interim report of the Second Technical Support Study on the Smart Readiness Indicator for Buildings [11]. Related to their Task 1 on the technical support for the consolidation of the definition and the calculation methodology of the SRI, the study concludes that the proposed SRI methodology builds on assessing the smart readiness service in a building. These services improve the performance of the building in regard to energy efficiency, responds to user requirements and support the interaction with the grid. The proposal includes both a simplified and detailed assessment method and the overall methodology has also been tested on 112 test cases [11]. Compared to the initial study, the revised version after the consultation process has not significantly changed other than refinement of the indicators as outlined above. The methodology still relies heavily on qualified assessors and thus on a subjective and quantitative approach. The latest report states that the reliability of and trust in the experts to deliver the scheme will be a key success factor and that high-quality training will be required [11]. It should also be noted that the methodology relates mostly to the electricity demand (as outlined under point 3 in the reference stated above) and does not equally consider flexibility in thermal demand.
Whilst the implementation of the EPBD is up to the individual member states, the Concerted Action on Energy Performance of Buildings Directive (CA EPBD), which is funded under the European Unions’ Horizon 2020 program, aims at exchanging knowledge and best practices in the field of energy efficiency amongst the European member countries [18]. Subsequently the SRI and potential methodologies associated with its integration into national building codes will also most likely be discussed within this working group. As the CA EPBD also publishes country reports on the status of the implementation of the EPBD in the member states, it remains to be seen how the SRI methodology as proposed in the above study will be applied throughout Europe.
Nevertheless, it is clearly understood, that the Energy Performance certificates (EPCs), which are an inherent part of the EPBD play a crucial role in transforming the building market and that the directive as such already has been shown to be an effective policy [19,20]. Education and training as well as interdisciplinarity are essential cornerstones in driving the EPBD forward to improve the performance of buildings [21]. The EPCs should ideally provide easily accessible data on building performance and can support the identification and subsequent refurbishment of underperforming buildings [22]. The recently added SRI can also serve as a useful source of information to enhance public awareness on the smartness of a building, however similarly to the EPC, it is key that the indicator is easy to use, transparent and based on reliable data.
The discussion of the regulatory background shows, that policy related to the assessments of buildings are both highly relevant, but there is an evident need for easily applicable and reliable tools that provide an objective assessment. Currently, this aspect is still mostly missing within the context of the SRI.

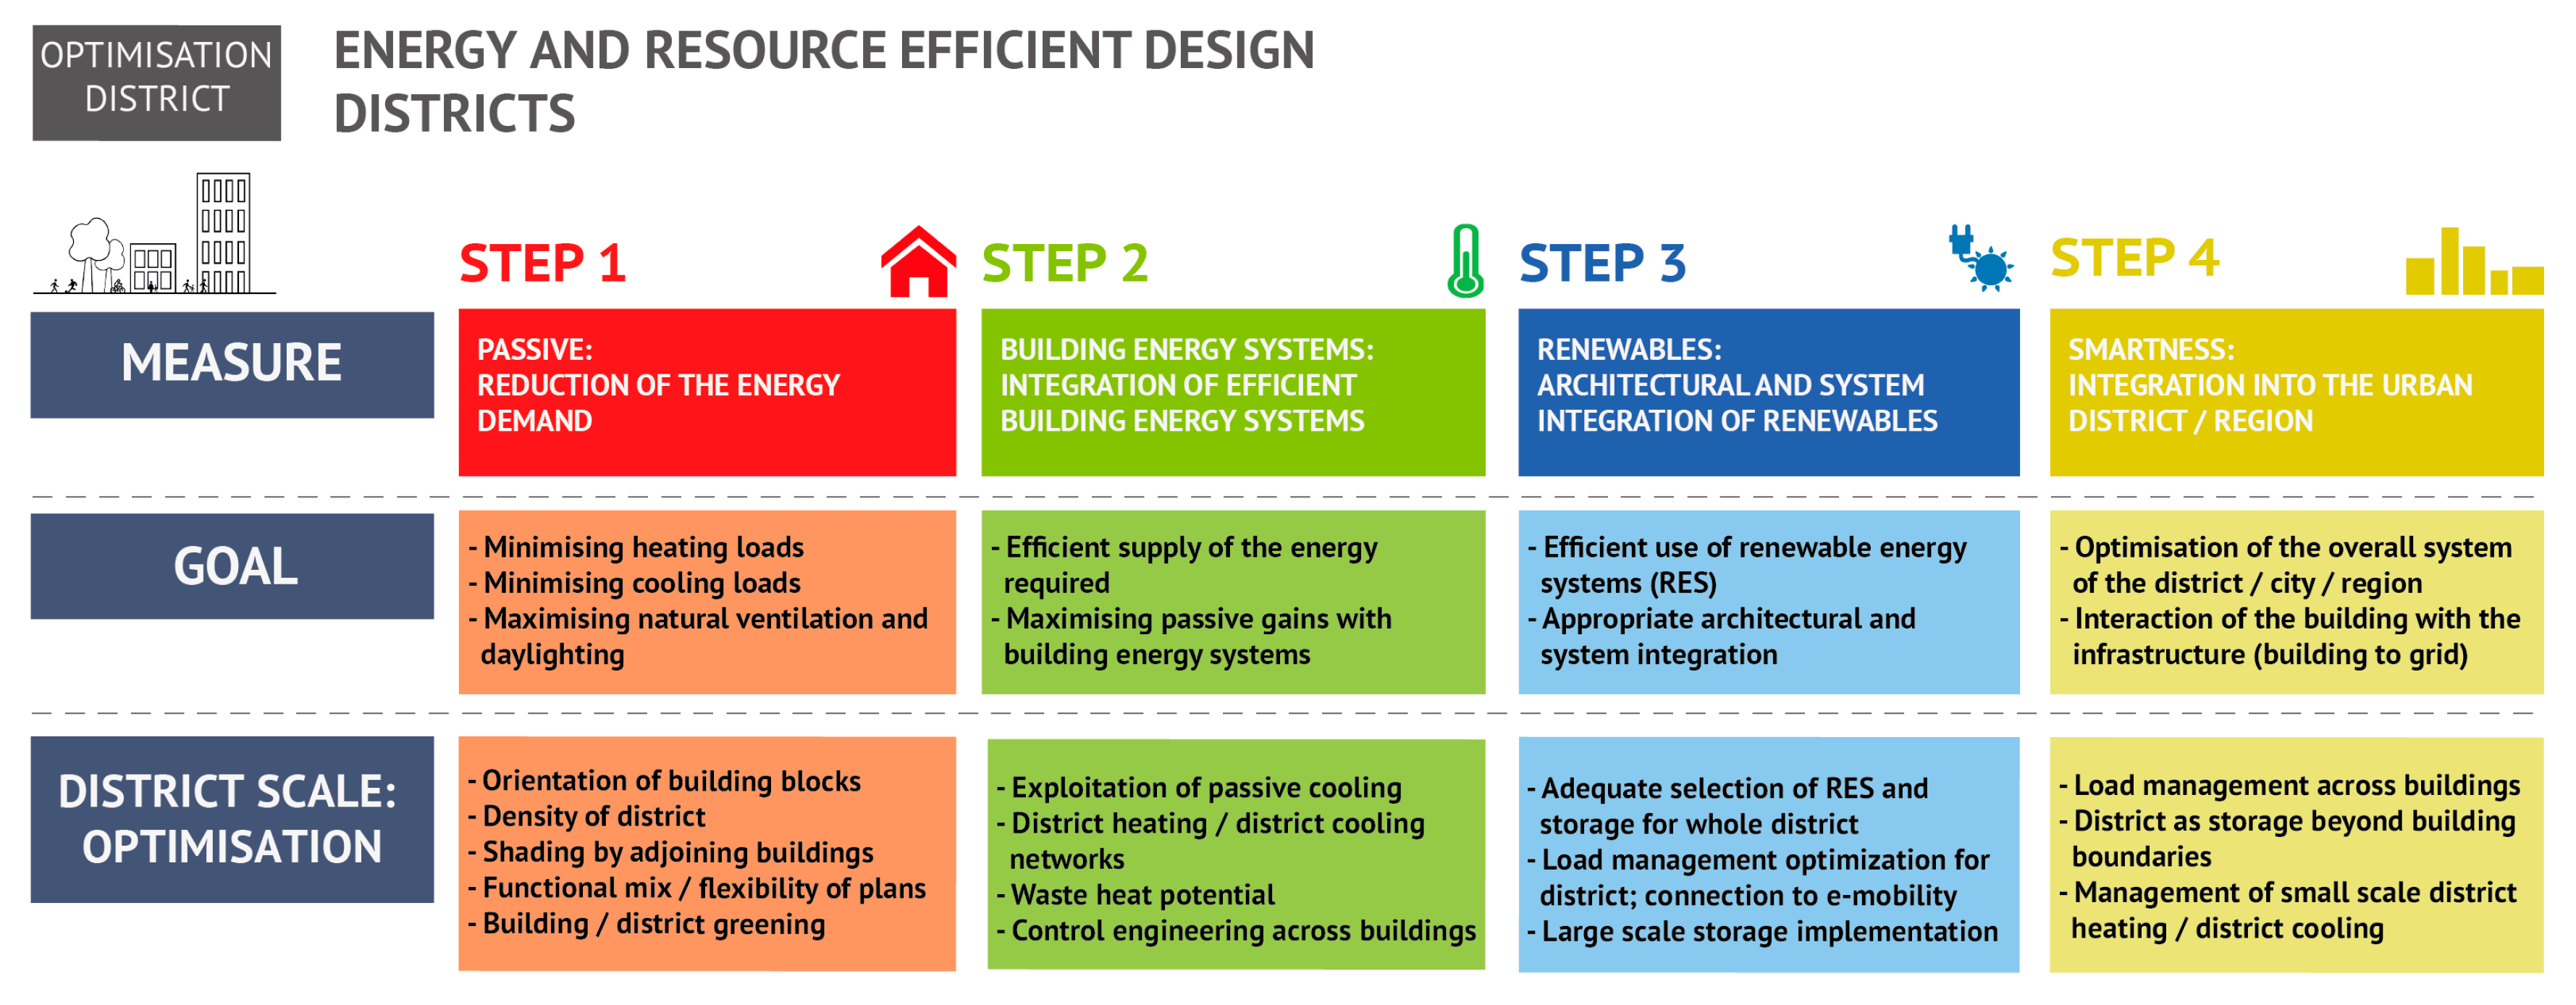
2.2. Smart Districts

The terminology “smart” has in recent years been extensively used and elaborated on. There are several definitions, when it comes to the labelling of smart buildings or smart districts. Wiggington and Harris conclude that there exist more than 30 separate definitions on the term intelligence in relation to buildings [23]. Other literature on the subject states that intelligent buildings are clearly multi-faceted and whilst they can be summarized by a series of characteristics that include aspects ranging from user safety and comfort to resources, a universal description is challenging [24]. Whilst smartness has been mainly used as a label for buildings and cities, the intermediate scale of the district gains in importance as local energy solutions emerge.
Within the contact of this approach, the smartness mostly related to the efficient use of resources and energy. From an architectural perspective, the planning of a building is mostly limited and defined by the actual plot of the construction. Nevertheless, urban planning considerations as well as scale, morphology and societal setting amongst others heavily influence the design. Energy efficiency is also largely dependent on the immediate context relating to climate, resources, and infrastructure. Incorporating a systemic view beyond the building’s edge towards the district can provide added value, as concepts for sustainable neighborhoods play a fundamental role in the development of resilient cities [17].
Following the logic of resource and energy efficient design on a buildings scale [25], the district offers the benefit of the systemic perspective and can subsequently deliver optimization beyond the single entity. Especially when it comes to building renovation, clustering buildings with different thermal qualities and connected energy generation, supply and storage systems can achieve significant primary energy savings with minimal physical intervention compared to the renovation of single entities alone [26].
The steps as outlined in Figure 1 describe the methodology for the development of energy concepts at district scale. In step 1, the passive aspects, defined by the architecture (shape, form, envelope, mass) are the first key measures to reduce the actual energy demand for heating, cooling, lighting and ventilation. At the district scale the influencing factors include the orientation of the building blocks, the density and the functional mix of the various entities. The 2nd step relates to the energy systems and focus on the energy networks, the use of waste heat potential and the efficient control management across buildings. In step 3 the adequate selection of RES and respective energy storage solutions is key to move towards zero-carbon district solutions. The overall load management as well as small scale district heating or cooling grids are relevant aspects in step 4, where the overall district in connection to the larger urban entity or region signifies the move towards smart district and subsequently smart city solutions.
There is however still the question how the domains of the smart buildings can be connected to the district and subsequently to the city to ensure interoperability, especially when it comes to digital planning tools but also for operational purposes. In a recent publication where the interoperability of smart buildings into smart city platforms was evaluated, the authors concluded that the five aspects of smart energy, smart mobility, smart life, smart environment and smart data were the key domains related to the interconnectivity between the scales. Subsequently, smart building integration into a smart city has been defined to set out the framework for the various integration levels [27]. On a building scale there are already several assessments in place that are aimed at quantifying the intelligence or smartness of a building, several of which have been analyzed within the context of the named publication. The building intelligent quotient (BIQ) program developed by the BIQ Consortium consisting of CABA (Continental Automated Building Association) members, is a program aimed at evaluating building intelligence. Whilst it is mainly focused on building automation and control, it should function by its own definition as an evaluation tool for a buildings’ smartness [28]. The Honeywell Smart Building Score (HSBS) provides a rating on 15 technology asset groups that make a building green, safe, and productive, and similarly offers a broad approach on the rating of devices, software, and control mechanisms within a building [29]. Both ratings encompass a rather complex and elaborate process and mainly focus on intelligent control mechanism and appliances rather than on load management, which provides an entirely different approach as outlined in this paper. In addition, they are also focused on a technology and device-oriented approach, which would need to be adapted as new technologies emerge.
Whilst the assessment of energy flows in buildings is already mostly considered standard practice with more or less detail, the district scale requires a different set of models as other aspects, such as mobility, networks and other infrastructure (e.g., waste heat from industrial processes) need to be factored in. In order to identify optimal strategies at the district level, methodologies should include qualitative and quantitative evaluation procedures based on reciprocal impacts [30]. However, there is also a need for district and energy models that go beyond the scientific community to be applied in practical design developments. Focusing especially on the planning community, the CityCalc tool has been developed to provide a quick assessment for urban planning competitions and initial planning phases [31,32]. Spatial-temporal modeling and thus dynamic assessments on a district scale can also be carried out by the CEA (city energy analyst) [33], a free open-source GIS-(geographic information systems) integrated system that has been conceived as an urban building simulation platform for the analysis and scenario comparison of energy demand, associated CO2 emissions, financial benefits and production optimization for districts [34,35]. GIS based data analysis coupled with energy workflow modelling can be of particular importance for integrated urban platforms, that aim at modelling a diverse range of CO2 emission related domains such as energy, resources and mobility. Such multi-domain tools can help to identify, e.g., high impact districts in need of modernization within the different urban sectors [36].
In a recent study, several urban energy-planning tools have been assessed based on their overall user friendliness related to spatial scale, output time and energy services with a few having been considered suitable for widespread use [37]. District energy modeling also supports the development of adequate technical and economical solutions for the existing building stock, as energy efficiency and renewable energy measures can be potentially more cost-effectively integrated at a multi-building scale. IEA Task 75 is specifically dedicated to the development of solutions for existing urban districts [38]. These developments show, that there is a noticeable shift towards the system perspective, which becomes ever more important, as with the exponential increase in information and communication technology, buildings act as distributed consumers, producers and storage of energy and thus develop into active players in the energy system. Similarly, the clustering of buildings to larger entities becomes more relevant as synergies related to energy efficiency and renewable energy sources can be exploited [14,15].
In his recently published book on the Green New Deal, the economist Jeremy Rifkin argues that a factor in his so called third industrial revolution towards a de-carbonized energy system lies in the digitalization of the energy networks. He stipulates that paradigm changes can occur when new communication technology converges with new energy sources and new forms of mobility. Thus he concludes that the world is on verge of a third industrial revolution as the Internet is connected to the energy system and to the mass transport systems of e-mobility [39]. Consequently, the assessment of the flexibility of buildings is significant in this context.

2.3. The Potential of Load Shifting in Buildings for the Integration of RES

The transition towards a sustainable energy system relies heavily both on the lowering of the overall demand and the provision of the required energy by renewable sources. The transformation from a centralized market to an intelligent smart grid requires a fundamental change in how we conceive the production, distribution, storage, and supply of energy [40]. As outlined above, in this context, buildings play a crucial role as they are significant consumers of energy but can at the same time provide surface areas for the integration of de-centralized solar energy systems and storage potential by means of their thermal mass and building services systems.
Aggregating buildings for cooperative energy management can yield substantial energy savings by exploiting their load shifting capabilities and utilizing shared energy systems. Aggregating buildings to clusters allow the exploitation of the variation in energy demand in different building types [15]. Determining efficient control strategies to allow a data driven and robust optimization strategy are necessary to use the potentials at a larger scale [41]. For electrical smart grids (SGs) the integration of renewable energy (RE) generation also depends largely on efficient demand response (DR). Increasing the share of RES implies that both storage systems and DR have to be jointly considered as with an increasingly higher share of RES the flexibility in the grids decrease without adequate management of demand and supply. Studies undertaken in specific micro-grids analyzing the effects of high renewable energy penetration highlight that adequate methods must be applied for an effective demand response management [42]. In order to provide de-centralized storage devices in buildings that increase the participation of end-users in the operation of the grids, micro-storage solutions must be properly planned and managed in order to provide optimized results [43]. Peer to peer (P2P) energy trading can also enable direct energy trading between energy consumers and prosumers. This reduces the exchange between the microgrid and the large-scale utility grids and can subsequently support the wide-ranging penetration of renewable energy into the power grid [44].
Whilst the electrical load shifting undoubtedly dominates the discussions related to smart grids, the thermal integration and consideration of intelligent thermal grids must not be neglected. Integrating PV (photovoltaic) systems in buildings, the so-called building integrated PVs (BIPVs) can, from an architectural and building technical point of view, more easily be achieved compared to solar thermal systems. There is nevertheless still a demand to also incorporate thermal renewables into the urban fabric. Solar thermal collectors, heat pumps, systems based on biomass or waste heat from auxiliary sources can all provide low emission alternatives to fossil-based systems. In a forecast scenario for the European heating and cooling fuel deployment an increase in the share of renewable energy from 16.7% in 2012 to 25.9% in 2030 is possible under the current policy scenario. This is driven mostly by an increased deployment of RES and a simultaneously falling final energy demand due to stricter building efficiency [45].
There is a growing awareness, that district heating networks should also react to the de-centralization of the energy market and subsequently allow the integration of small-scale supply, mostly based on RES, into their systems [46]. This would also allow the use of so-called waste heat (usually low temperature heat) from industrial processes, wastewater or reject heat from cooling systems. Several studies suggest that there is a significant potential to exploit these yet untapped resources [47,48]. Especially data centers, with their large demand in power and cooling energy represent both a potential for waste heat as well as renewable energy integration. A recent study has found that regional climate studies can provide an effective way of improving the efficiency of data centers in both the upstream renewable energy supply and the downstream waste heat reuse [48].
Although supply temperature from so called prosumers (customers that consume as well as produce energy) is usually lower than typical supply temperature, the thermal networks need to effectively manage and control their system to increase the share of decentralized renewable integration [49]. A thorough analysis on the exact scale and potential of the renewable input is however crucial to determine the feasibility of the de-centralized option. Defining a model that combines prosumers, central supply as well as market and emissions aspects can be accomplished by applying stochastic optimization algorithms. However, achieving a fair distribution of economic benefits between a central heat plant and multiple consumers remains a challenging task [50].
A study comparing several scenarios from the (classical) central heat-plant setup, to an agent-based approach and prosumer centric solutions comes to the conclusions that no approach has emerged as superior to the others and that each solution is justified under certain circumstances. It stresses subsequently that mathematical optimization is crucial in determining the best way forward [51]. While economic benefits are achieved in most scenarios, it is a non-trivial task to construct a market model that distributes these benefits in a fair way between the central heat plant and the prosumers.
Focusing on exergy with the aim to use energy efficiently and reduce carbon emissions presents yet another modelling approach. By considering the match between the grade of energy on the demand and supply side analytical models can provide useful decision support for the planning of low- or zero energy districts [52]. Combining heating and power models by providing modeling solutions for the design of co-generation is an essential cornerstone on the development of decision support mechanisms at the district scale. Multi-criteria optimization allows the focus not just on minimization of operation and maintenance system costs, but also taking into account time-varying loads, tariffs, and ambient conditions [53]. The intelligent coupling of heat and power demand and supply and subsequent co-generation is of particular importance on that scale as thermal and electrical loads can more efficiently be balanced on multiple and different building types with varying demands. Integrating renewable energy systems thus requires a multi-objective approach that considers both economical as well as environmental functions [54]. Quantifying relevant characteristics regarding the generation, distribution, and storage of energy in districts consequently represents a highly relevant aspect in the increased integration of RES into the urban environment. Current assessments and simulation tools on a district scale address the energy related aspects, however load shifting is still mostly considered from the perspective of the utility provider and thus mostly neglected in appraisals focusing on the characteristics of smart buildings and districts.

3. Methodology

Following the initial concept for the development of a quantitative approach on a building scale, the below outlined methodology aims at upscaling the concept to a bigger dimension. The numerical model-based approach provides an assessment of whole districts (or even larger entities) based on their overall energy storage capacity, load shifting potential and their ability to actively interact with the energy grids. With this methodology, districts or larger conglomerates of buildings can be rated and subsequently categorized with a single indicator per energy type. In addition, the resulting CO2 savings potential compared to an equivalent non-interactive system can be defined, which in turn highlights the probable benefits of the load shifting. This last aspect is of particular importance for future funding schemes or other incentives tied to CO2 emission savings. Since load shifting increases the efficiency of the overall system and subsequently the efficient use of renewable energy, the equivalent savings should be calculated and highlighted. Subsequently the proposed methodology aims at providing an answer to the following questions:
“What is the potential of the district to take energy from the grid, store it over a certain period of time and again dispatch it back to the grid? What are the potential CO2 emission savings associated with the load shifting potential of the district?”
In a first step, the previously published methodology is improved based on stakeholder feedback. Based on the adapted equations, the approach is enlarged from the single building to multiple buildings thus allowing the application on a whole district or any bigger logically connected series of buildings. The last sub-section finally provides an estimation for the equivalent CO2 savings, which might be of particular importance for the communication of the benefits of increasing the load shifting capabilities in buildings.

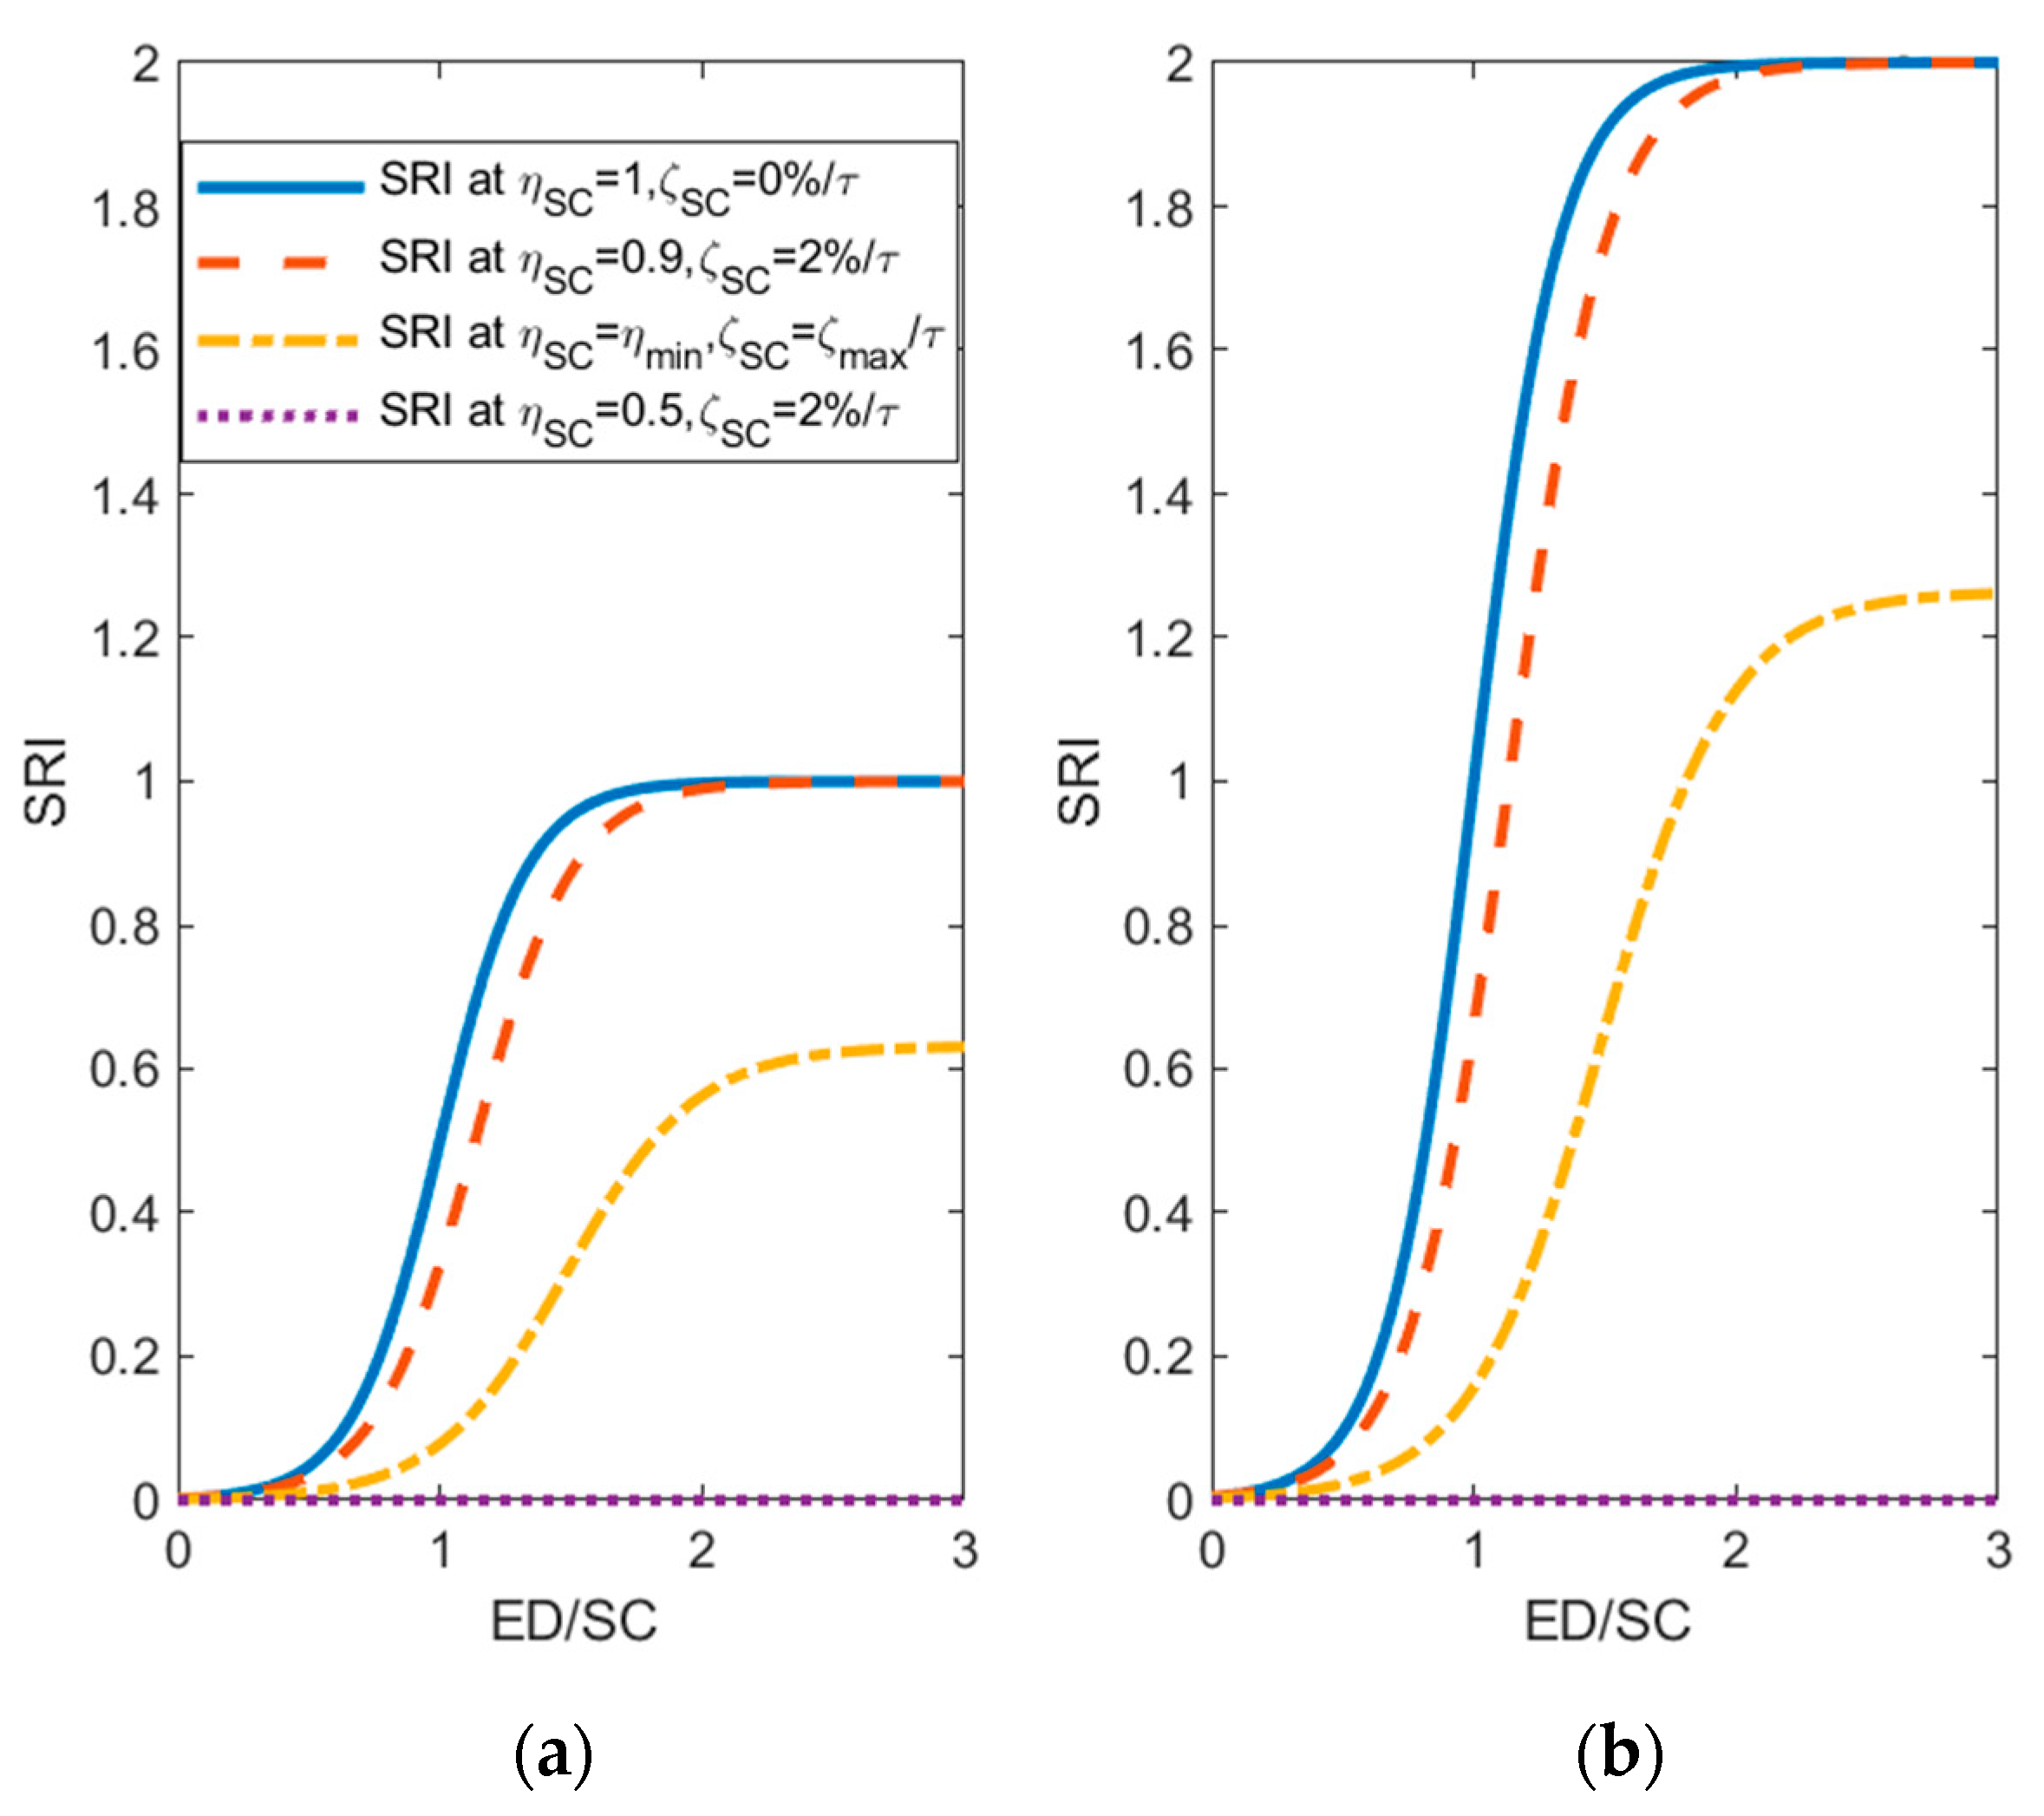
3.1. Adaptation of the Previously Published Methodology

Following the publication of the initial methodology on the quantitative assessment of the load shifting potentials in buildings [16], a series of discussions were held with relevant stakeholders to gain insight related to the usefulness and potential application of the methodology. Whilst the overall approach to provide a simplified numerical assessment has been positively acknowledged, it has been critically reviewed, that the proposed calculation does not require minimum efficiency standards related to the storage system. It was noted that this could essentially mean that a series of highly inefficient (and potentially environmentally adverse) storage technologies could result in an equally good SRI as highly efficient (and less ecologically detrimental) systems. This could be of particular importance if the SRI is used in future application for any funding mechanisms. Thus, in order not to favor cheap and inefficient storage technologies via the definition of the SRI, the original approach has been extended by a simple extension to include a barrier in regard to minimal efficiency related to the storage type and system.
The preceding equation with the variables as outlined below has been originally published [16] and reads as follows:
S R I = A C ( 1 + e 6 ( ( S C E D η S C ( 1 ζ S C ) ) 1 ) )
where ED refers to the energy demand of the building per energy source for the selected time period τ, SC, the storage capacity of the respective storage in the building, and ηSC, the efficiency factor of the storage capacity (here the efficiency for loading as well as unloading the storage must be considered). ηSC = ηC * ηD. ηC denotes the efficiency factor of the storage capacity for charge. ηD refers to the efficiency factor of the storage capacity for discharge, ζSC, the storage loss during the selected period in full storage (e.g., through self-discharge or associated heat losses), and AC the activity coefficient for the building.
Depending on the activity of the building, four different activity coefficients have previously been distinguished: (1) no grid available n/a; (2) no interaction with the grid, the activity coefficient is 0; (3) passive interaction with the grid, the activity coefficient is 1; (4) active interaction with the grid the activity coefficient is 2. (“…In this context “no interaction with the grid” means that no storage or load shifting potential is available, the building is a simple consumer. A “passive interaction with the grid” requires the building to offer storage and/or load shifting potential to the grid. The load shifting is however only one-directional from the grid to the building. The “active interaction with the grid” stands for an energy flexible building that provides storage and/or load shifting capabilities and offers bi-directional load shifting from the grid to the building as well as from the building to the grid. This building would be able to produce as well as consume energy and consequently be a prosumer…”) [16].
From this equation the required characteristics for the SRI methodology can be achieved. An initial validation of the methodology has also been described in the previous publication [16]. Following the comments for improvements as outlined above, a function has been added to regulate the SRI regarding the storage efficiency. The following variables are necessary for the amendment of the equation:
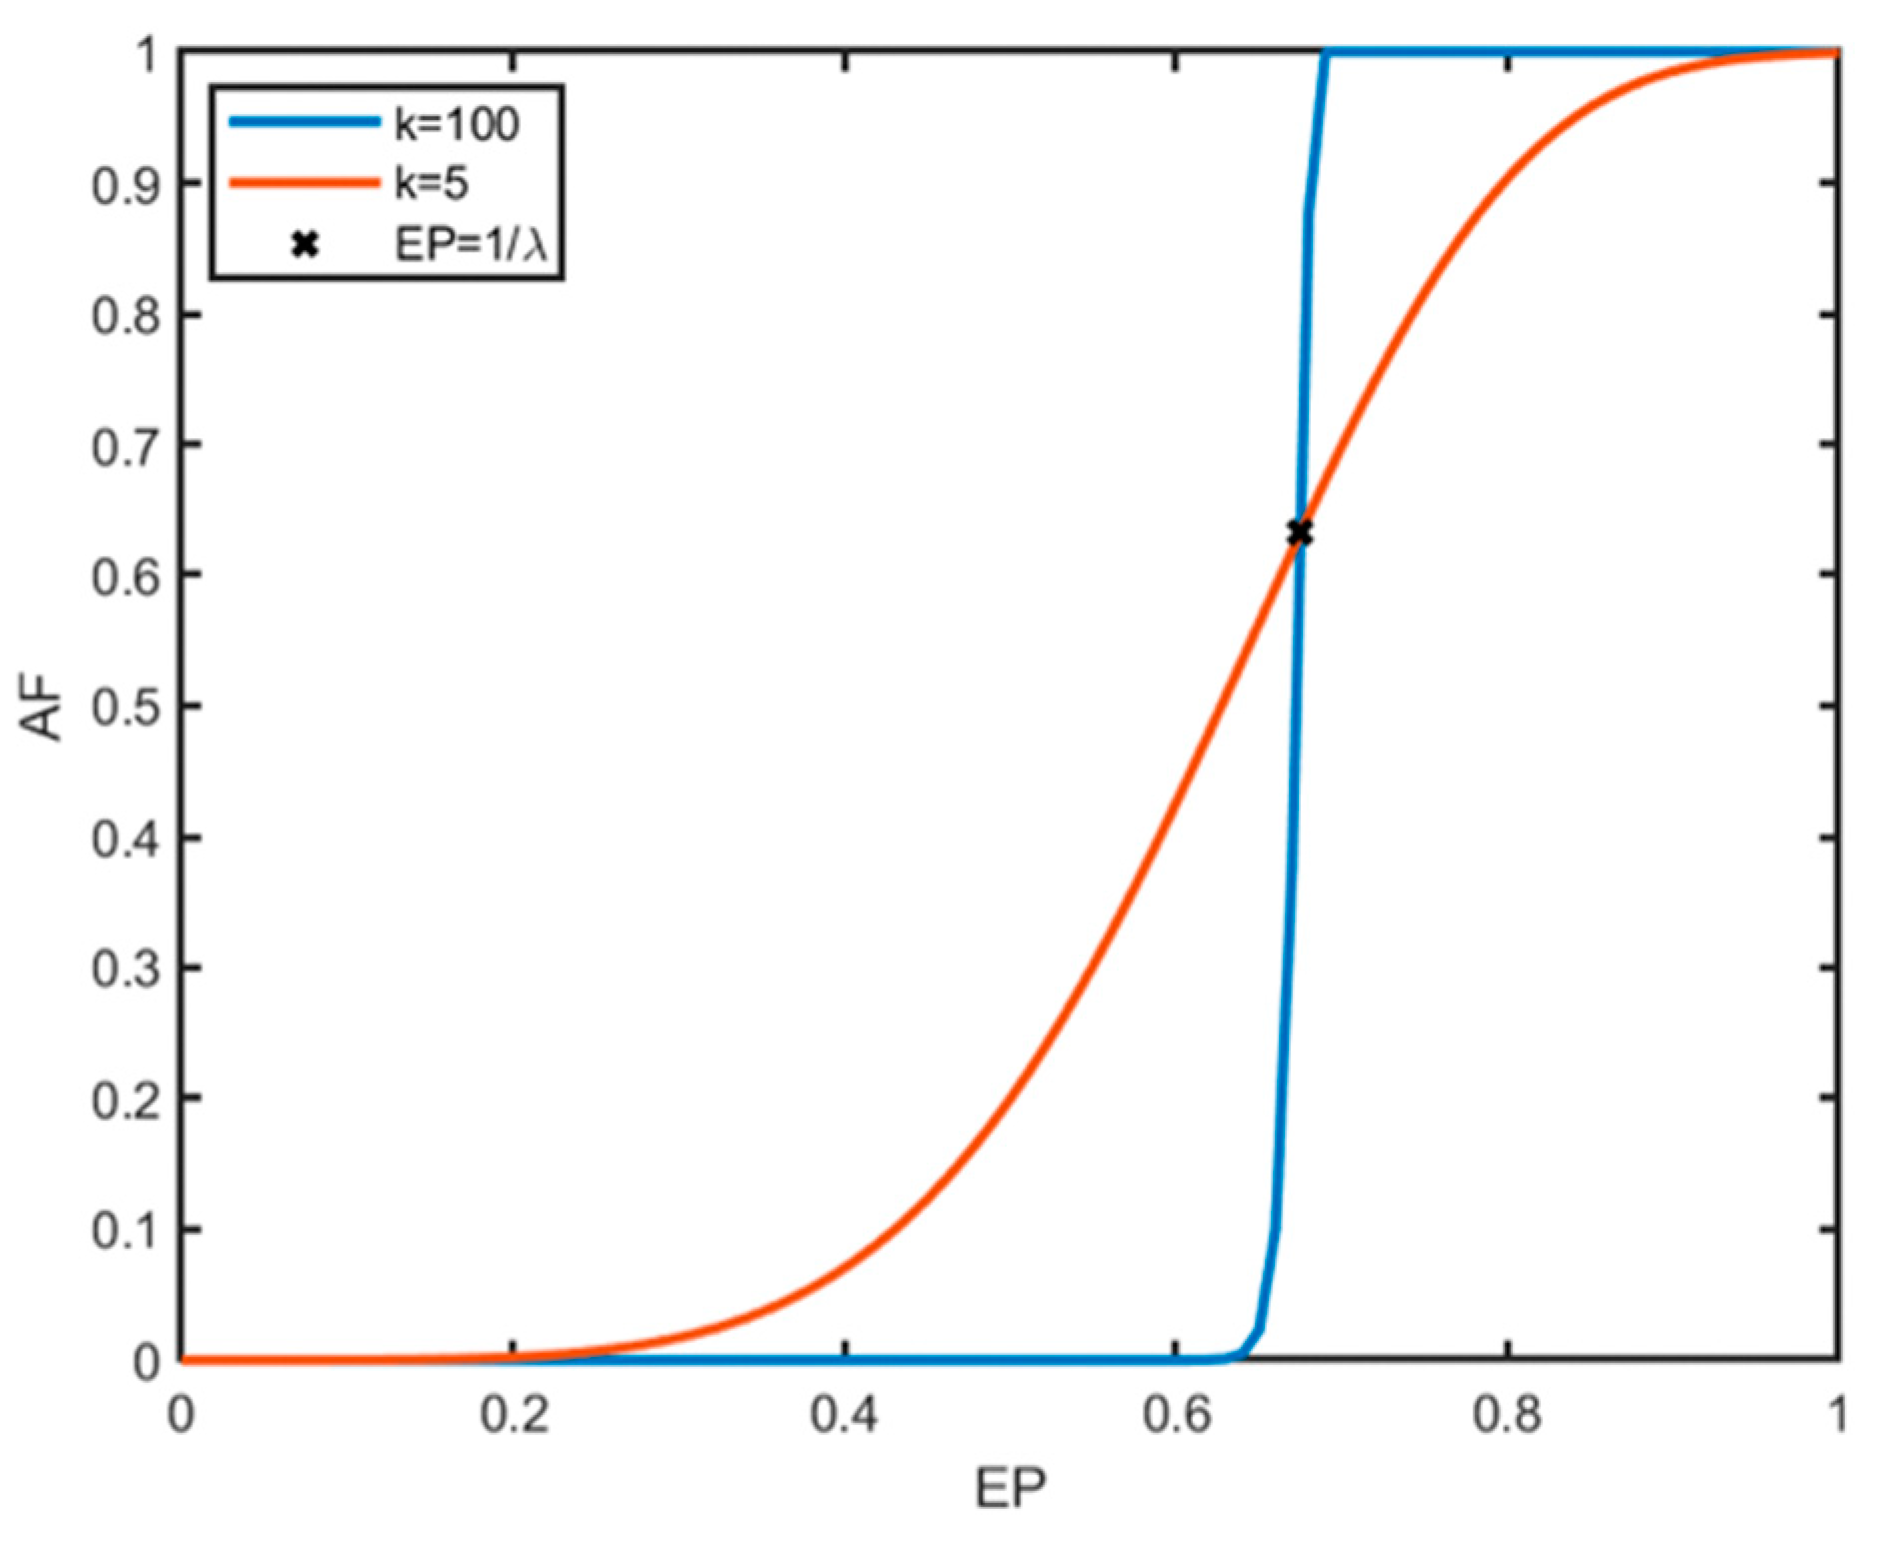
  • AF: Attenuation Factor to regulate the SRI related to storage efficiency.
  • E P m i n : Definition of the required minimal efficiency of the storage system. Substitute for the definition: E P m i n : = η m i n · ( 1 ζ m a x ) with η m i n the minimal required efficiency factor and ζ m a x the maximal required losses.
  • Λ: Definition point of the minimal efficiency λ = 1 / E P m i n . At this point the Attenuation Factor (AF) is always 0.63.
  • k: defines how fast the SRI veers with a low efficiency towards 0. With a low k the SRI is slowly reduced. With a high k the AF (SRI will be cut off) is rapidly reduced with minimal efficiency from 1 to 0.
  • EP: Energy Performance, i.e., the efficiency of the system E P : = η S C · ( 1 ζ S C ) .
    A F = 1 e ( λ · E P ) k
As shown in Figure 2 the pinch-off characteristics of k influence the overall energy performance as there is a vast difference if k = 5 or k = 100 as displayed in the figure. The graphic shows the main properties of the function used to calculate the Attenuation Factor (AF). The x shows the definition point for the minimum acceptable efficiency of the storage system. Based on this limit, the parameter k can be used to define how quickly the SRI approaches zero when the EP decreases. A version for a slow decline is shown for the curve k = 5. The curve with k = 100 shows a rapid decline of the SRI for a decreasing EP. That means with a large k a cut off of the SRI, by a continuous function, is achieved at the definition limit for the minimal EP. In this case, if the EP is greater than EPmin, the SRI remains the same as in the first definition and consequently the basic properties are retained. In Figure 2, Equation (2) has been applied.
Following this logic, the SRI including the above outlined function for the regulation of the storage efficiency can be derived as follows based on Equations (1) and (2):
S R I = A C e ( η S C · ( 1 ζ S C ) η m i n · ( 1 ζ m a x ) ) k ( 1 + e 6 ( ( S C E D · η S C · ( 1 ζ S C ) ) 1 ) )
Based on this adapted equation the required characteristics for the SRI methodology can be achieved. The new function now considers the regulation of the storage efficiency and thus avoids the use of potentially inefficient storage technologies.
Figure 3 below depicts the SRI curves based on the modified Equation (3) for the various activity coefficients. Graph (a) shows the SRI curves with the activity coefficient 1 and (b) shows the SRI curves with the activity coefficient 2. Both SRIs are calculated with a k = 100.
It is shown that, with a high k, the curve with the EPmin (definition of the minimal efficiency and maximum losses, yellow curve) reaches a maximum exactly at 0.63 with the AC = 1 and 1.26 with the AC = 2. However, with the same k, an EP lower than EPmin results in a SRI = 0. Consequently, a bad storage efficiency cannot be compensated with a high storage capacity. In Figure 3, Equation (3) has been applied.

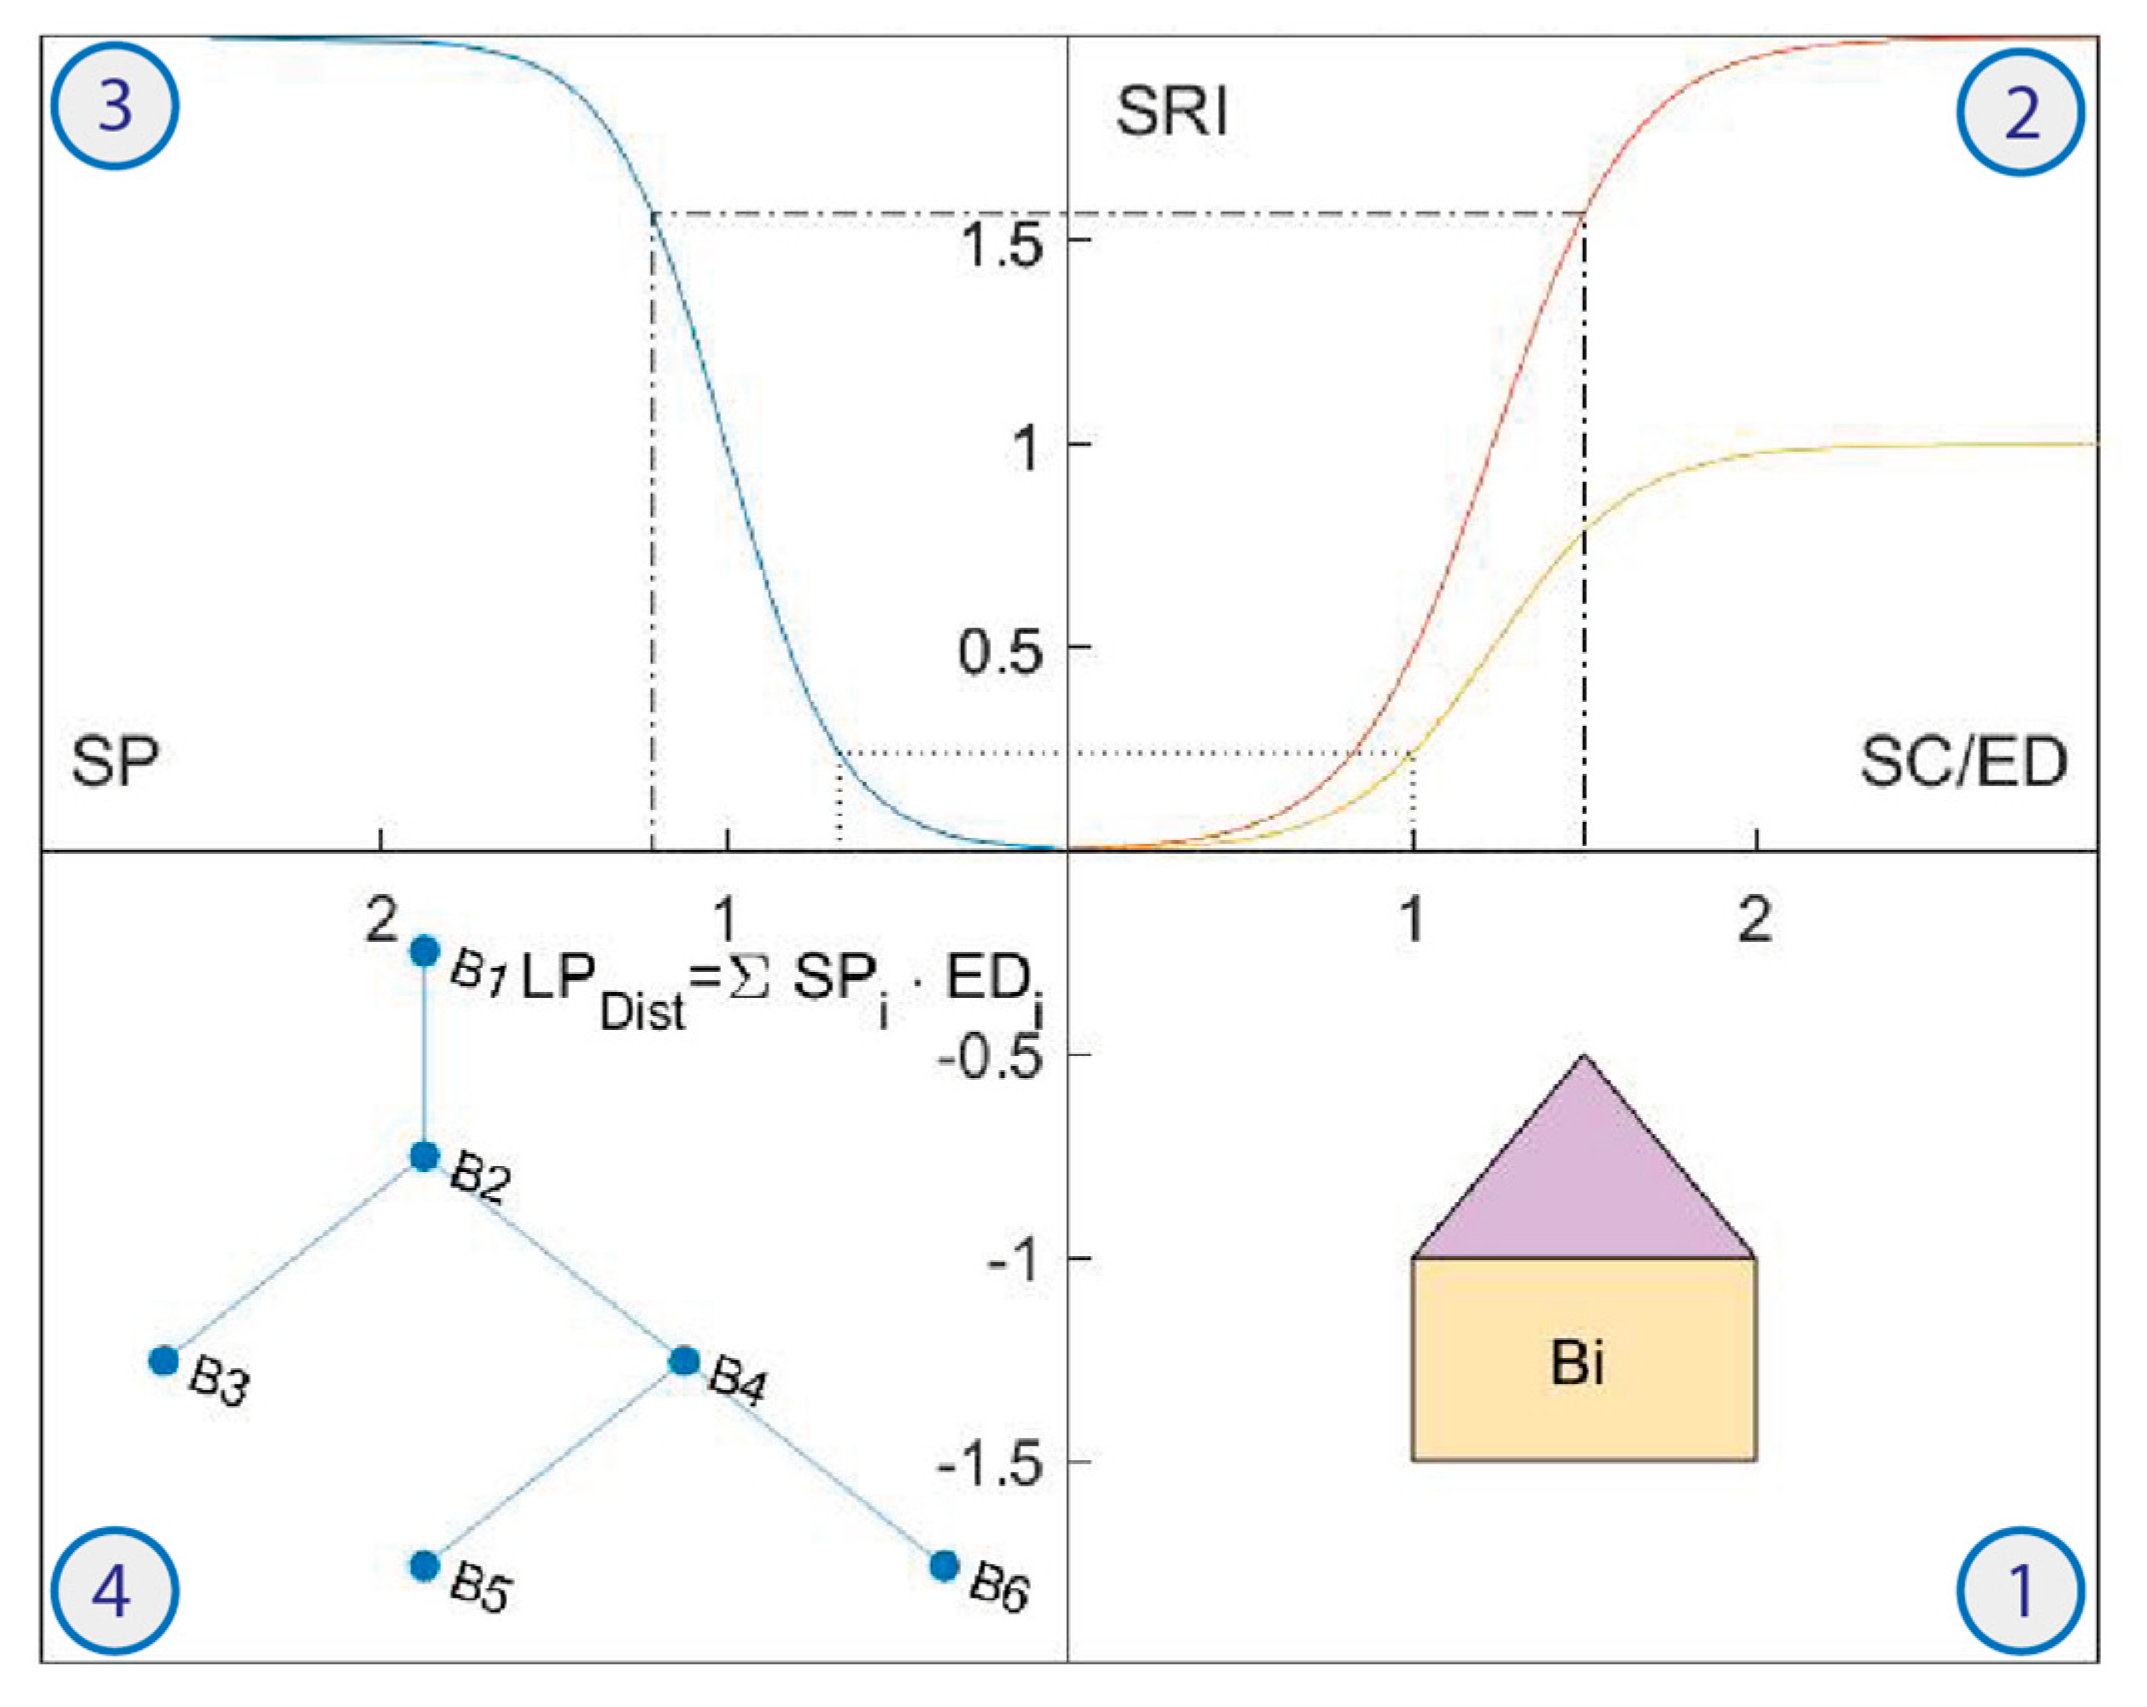
3.2. Enlargement to the District Scale

In order to enlarge the methodology to the district scale, the following variables are added:
N 
Number of buildings
EDi 
Energy demand of the building i per energy source for the selected time period τ.
SRIi 
SRI for the building i.
EDDist 
Energy demand for the whole district.
SRIDist 
SRI for the whole district.
S R I D i s t : = i = 1 N ω i · S R I i
With the weighting factor as follows:
ω i : = E D i E D D i s t
The weighting factor has been included in order to ensure a fair comparability of districts with different characteristics. Therefore, this does not represent an average of the district’s SRI, but rather a weighted average based on the respective share of energy consumption in relation to the total energy consumption of the district. For example, if a commercial entity has a low SRI with a very high ED, then a single building with a high SRI and low ED does not compensate for this.
The EDDist can subsequently defined as follows:
E D D i s t : = i = 1 N E D i
Out of the above equations, the load shifting potential for the whole district can be derived. Based on the calculation as outlined in the previous publication [16], the equation to estimate the storage potential reads as follows:
S P = min ( 5 2 , max ( 0 , ln ( 2 S R I 1 ) 6 + 1 ) )
The estimation of the storage potential of a building is derived from the SRI. The reverse function is based on the following assumption: The losses and efficiencies were already taken into account when calculating the SRI. For this reason, and the fact that the SRI is monotonically increasing in terms of storage efficiency a higher efficiency subsequently implies a higher SRI. The efficiency for the inverse was chosen with 1, thus the equation is defined as:
η S C · ( 1 ζ S C ) = 1
Subsequently the energy that can be taken from storage is calculated based on the time τ. Also, the storage potential of the building is defined with:
S P : = S C E D
In order to maintain the properties of the SRI with regard to the building as consumer (one-directional) or prosumer (bi-directional) the activity coefficient for the inverse is set to 2 (AC = 2). This is following the assumption that a storage with an AC = 1 is expected to be less active in shifting loads than a storage with an AC = 2. Based on the definition of the SRI and the above assumptions:
S R I = A C ( 1 + e 6 ( ( S C E D · η S C · ( 1 ζ S C ) ) 1 ) ) = 2 1 + e 6 ( S P 1 )
Following these equations, the SP can be derived as follows:
S P = 1 ln ( 2 S R I 1 ) 6
In the extreme areas of SRI = 0 and SRI = 2 the estimate obtained needs to be reasonably limited. This means that since the approach function is defined on , it must still be restricted to 0 + . Furthermore, due to rounding errors in the range of S R I 2 , errors could occur which should be limited by an upper bound. As a suggestion 2.5 was chosen as the upper bound for this study. Based on these assumptions, the storage potential for buildings can be defined as follows:
S P = min ( 5 2 , max ( 0 , 1 ln ( 2 S R I 1 ) 6 ) )
With the equation to calculate the storage potential for the whole district:
L P D i s t : = i = 1 N S P i E D i
With the individual coefficients as follows:
SP 
Storage potential of the building (Relationship of SC/ED; dimensionless).
LPDist 
Load shift potential for the whole district.
Bi 
Building i.
SPi 
Storage potential for building i.
EDi 
Energy demand for building i.
N 
Number of Buildings.
The load shifting potential for the whole district serves as an approximation as derived from the SRI, the SP and the ED as outlined in the above equations and displayed in Figure 4 In this figure, in field 2 Equation (3) has been applied, in field 3 Equation (12) has been applied, and in field 4 Equation (13) has been applied.
The general assumption is that only buildings with an activity coefficient of 2 (active interaction) can fully and actively contribute to the load shifting potential in grids. An activity coefficient of 1 (passive interaction) could only contribute to peak shaving but cannot be considered to be fully contributing to the load shifting potential of the district.
  • Step 1: At this first step the level of the individual i-number of building includes the data from the energy performance certificate.
  • Step 2: At this second step, the SRI has been calculated for the i-number of buildings with the interaction between the energy grid and the building considered separately at this point.
  • Step 3: In the third step an a-priori assessment of the storage potential is created from the SRI, which is based on the storage capacity (SC) and energy demand (ED) of the i-number of buildings. At this step the proportion of the storage potential (SP) of the building that is available for a load shifting for the grid is calculated. A building that cannot feed any energy back into the grid is related to a low SP. Thus, a building that cannot shift loads bi-directionally has to consume the stored energy itself, which is less beneficial to the network.
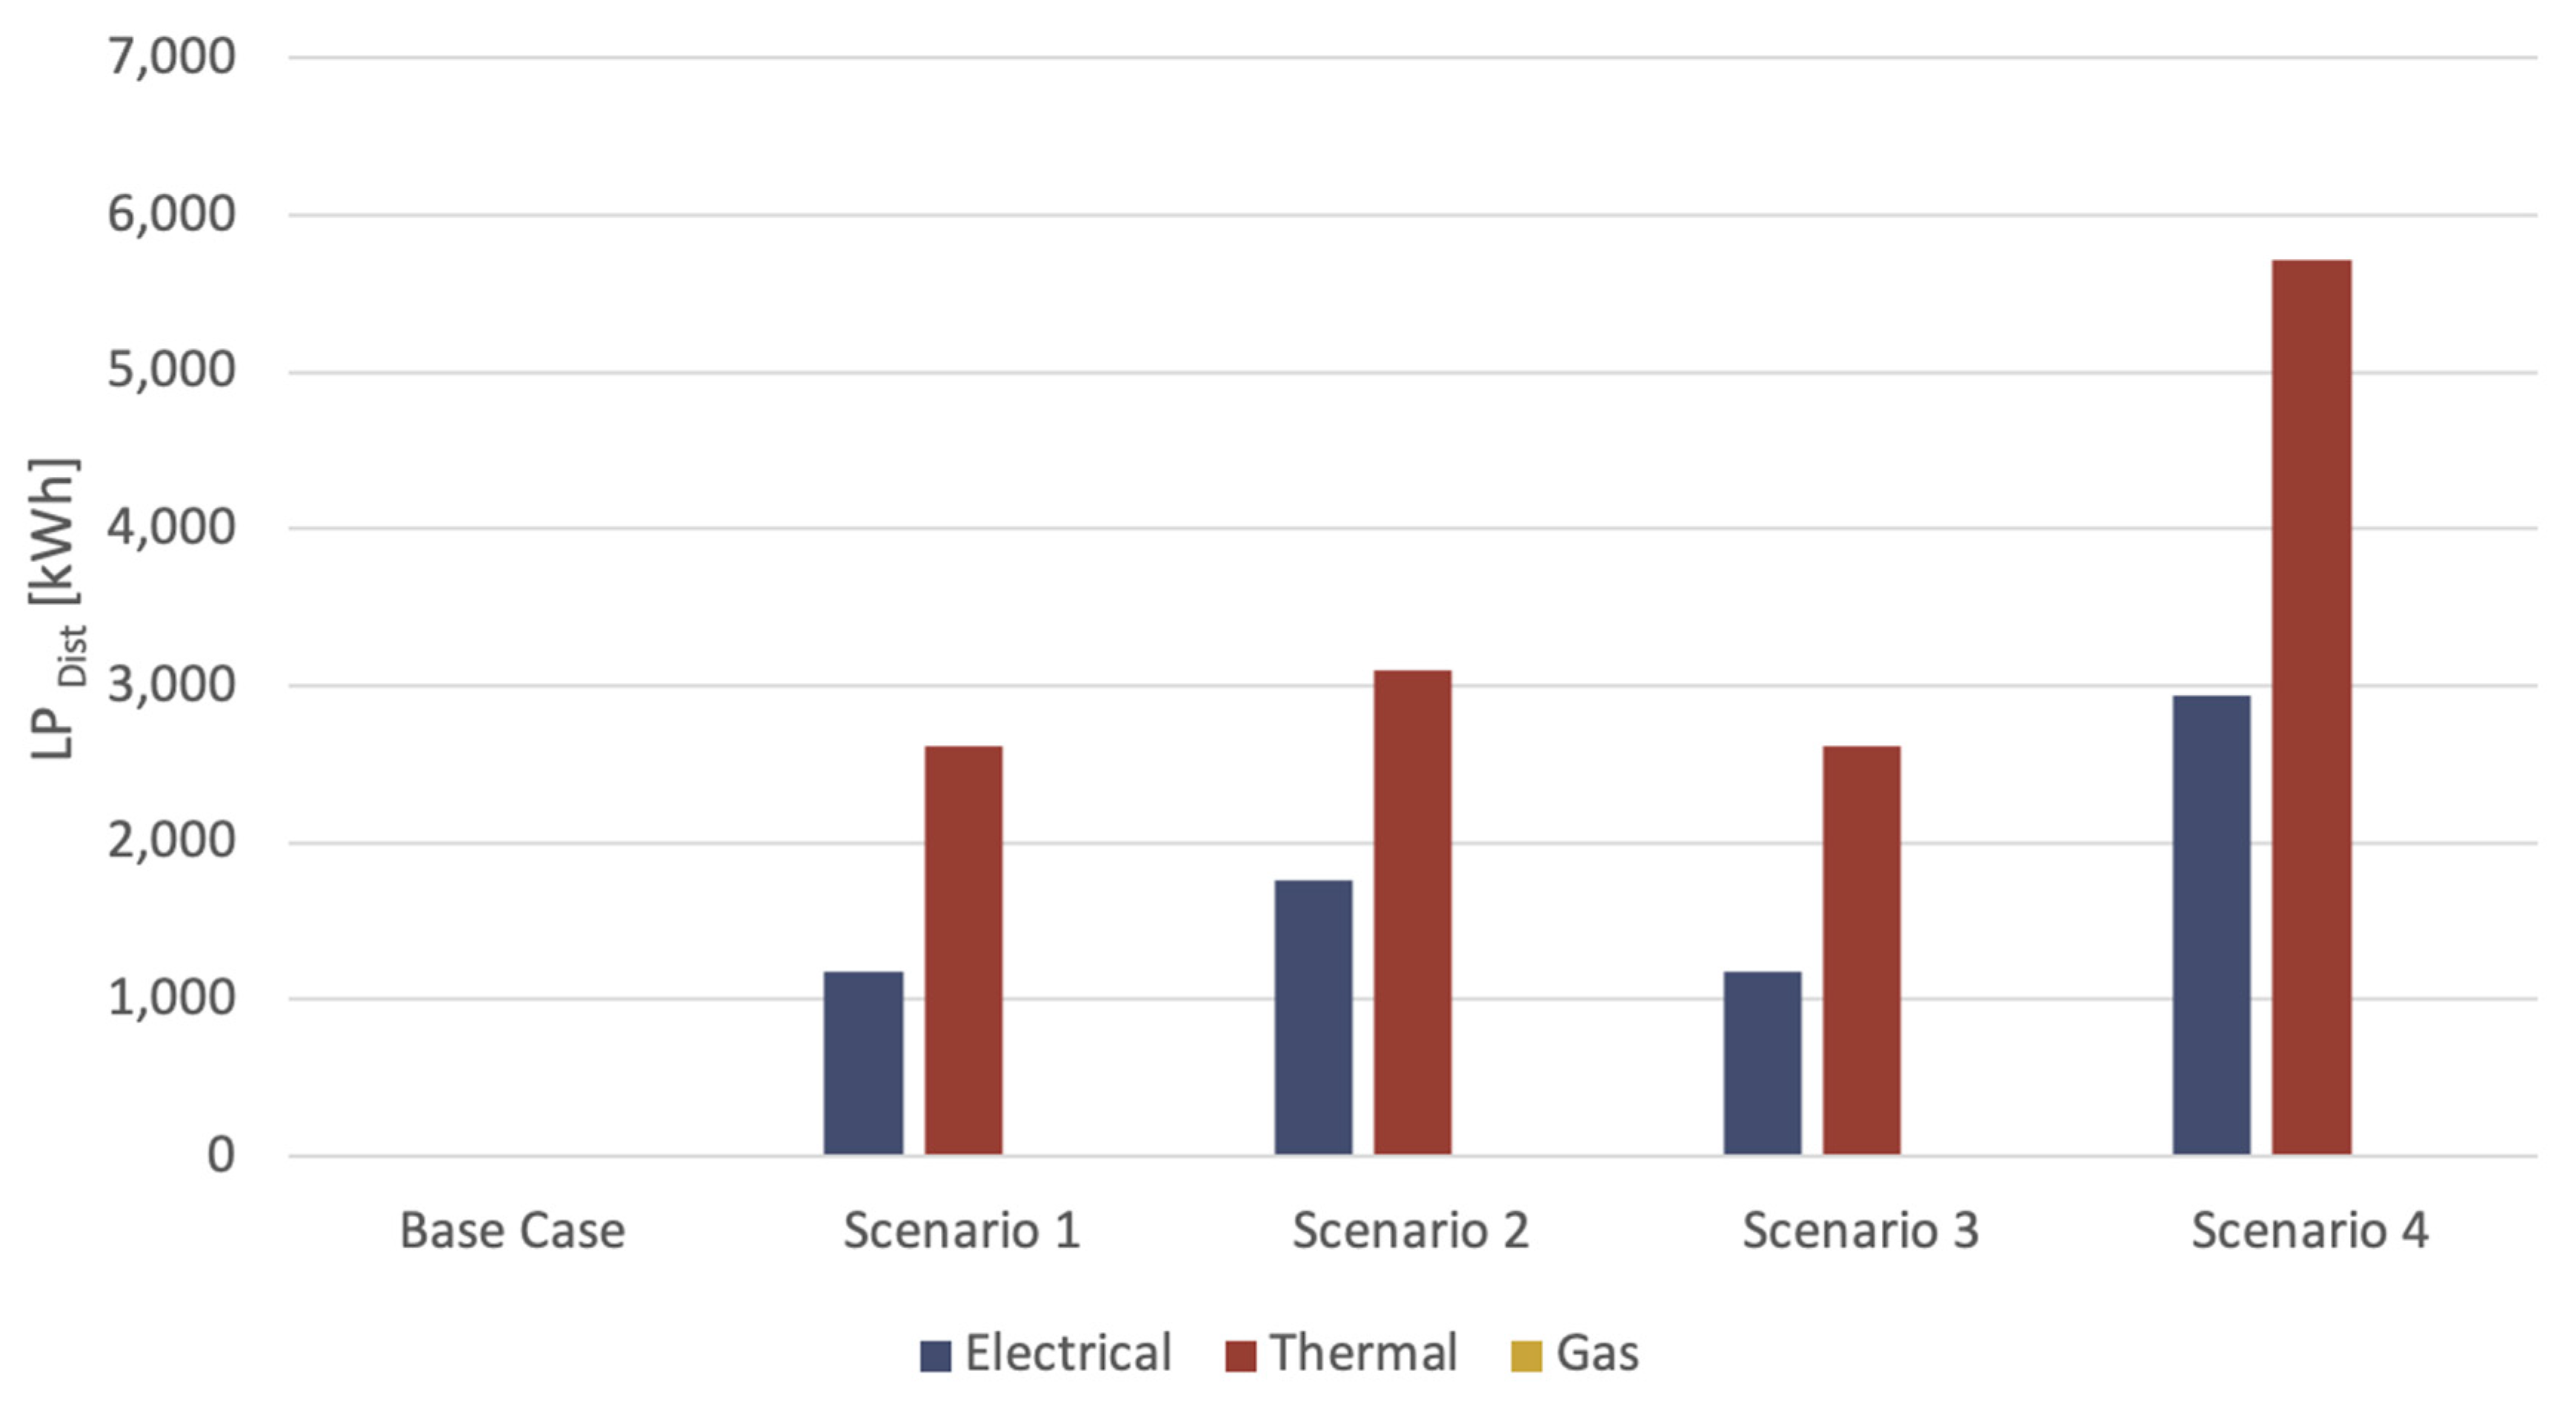
  • Step 4: In this fourth step, the product of the storage potential (SP) and energy demand (ED) over all buildings within the district delivers an a priori assessment of the load shifting potential (LPDist) for a whole district.
As outlined above, the SRI and its subsequent calculations are solely derived from planning data and does not include any monitoring or real time measured data. It gives decision making support in the planning phase and provides answers to the question of how much energy can be theoretically shifted from the grids to the building in addition to the district’s own consumption in the time span τ. The calculation provides an approximate order to magnitude for planning purposes only. Thus, this assessment is intended to be applied for a preliminary load shifting analysis of whole districts in regard to their various networks (electrical, thermal, gas).

3.3. Approximation of CO2 Savings Potential

Whilst the load sifting potential (LP) provides a relevant number for the assessment of whole districts and cities, it will remain closely linked to infrastructure planning decisions. Arguably, load shifting alone does not necessarily increase efficiency of the system. However, if it is linked with the potential to store and dispatch renewable energy, emissions related savings can evidently be made. Especially wind and solar energy is heavily dependent on current and regionally localized weather occurrences. Thus, at times there can either be too much or not enough renewable energy in the system, which would result in wind or solar system being switched off to prevent an overload for the former or fossil-based systems to substitute the remaining demand for the latter. As outlined in the background section, in this context, storage plays an existential role.
Subsequently the assumption is, that a widespread expansion of energy storage enables a higher proportion of renewable energy to be efficiently used. In the area of thermal energy sources, it is also possible to use waste heat (i.e., low temperature heat from buildings or processes) through sufficient storage distribution in the network. Centered on this logic, the following procedure is recommended as a basis for presenting a possible CO2, saving potential based on the SRI. From the estimate of the load shift potential (LP), an estimate for the potential CO2 savings can be derived:
C O 2 a = ( C O 2 C u r r C O 2 r e n e w ) L P D i s t y e a r τ
With the individual coefficients as follows:
CO2Curr 
Actual CO2 emissions per kWh.
CO2renew 
CO2 emissions per kWh from renewable energy sources.
CO2a 
Potential total CO2 savings per year.
The calculation follows the postulation that currently renewable energy production cannot be fully exploited due to limited storage capacities. Thus e.g., wind turbines must be switched off in times of energy overload in the grid. On the other hand, when there is no wind, the energy must be produced from conventional, mostly fossil-based sources. With a SRI > 0, the district can store renewable energy in the amount of LPDist if the grid cannot take up any more energy. If subsequently energy is in demand again, it can be re-loaded back from the districts to the grid. The extent of the potential total CO2 savings per year can thus be calculated based on the difference between the CO2 amount of the type of energy produced multiplied by the amount of energy that can be additionally produced due to the storage capacities of the district.
It should be noted that, since the methodology is focused on load shifting, the resulting CO2 savings are equivalent to potential savings only. That means, without a corresponding renewable energy generation, there are obviously no CO2 savings in this context.

4. Application of the Methodology in Theoretical District Use Case

Following the testing of the previously published methodology on the building scale with the use of different building types, the extended methodology has subsequently been applied to a whole district. The selected theoretical use case should include multiple buildings of different size, type and age. For this purpose, a building block situated in the 12th district of the City of Vienna has been used as the SRI has also previously been tested on these buildings [55]. The small district includes nine buildings, differing in type and age, ranging from an erection date of the 1900s to a building constructed in 2010. One of the buildings is for office use while the others are multi-family residential buildings. To simplify the assessment the inner courtyard buildings have been omitted (as no specific use could be determined for these edifices) and the retail areas on the ground floor have been left out. Figure 5 shows a partial land use plan of the City of Vienna, highlighting the selected district as well as an aerial view of the building block.

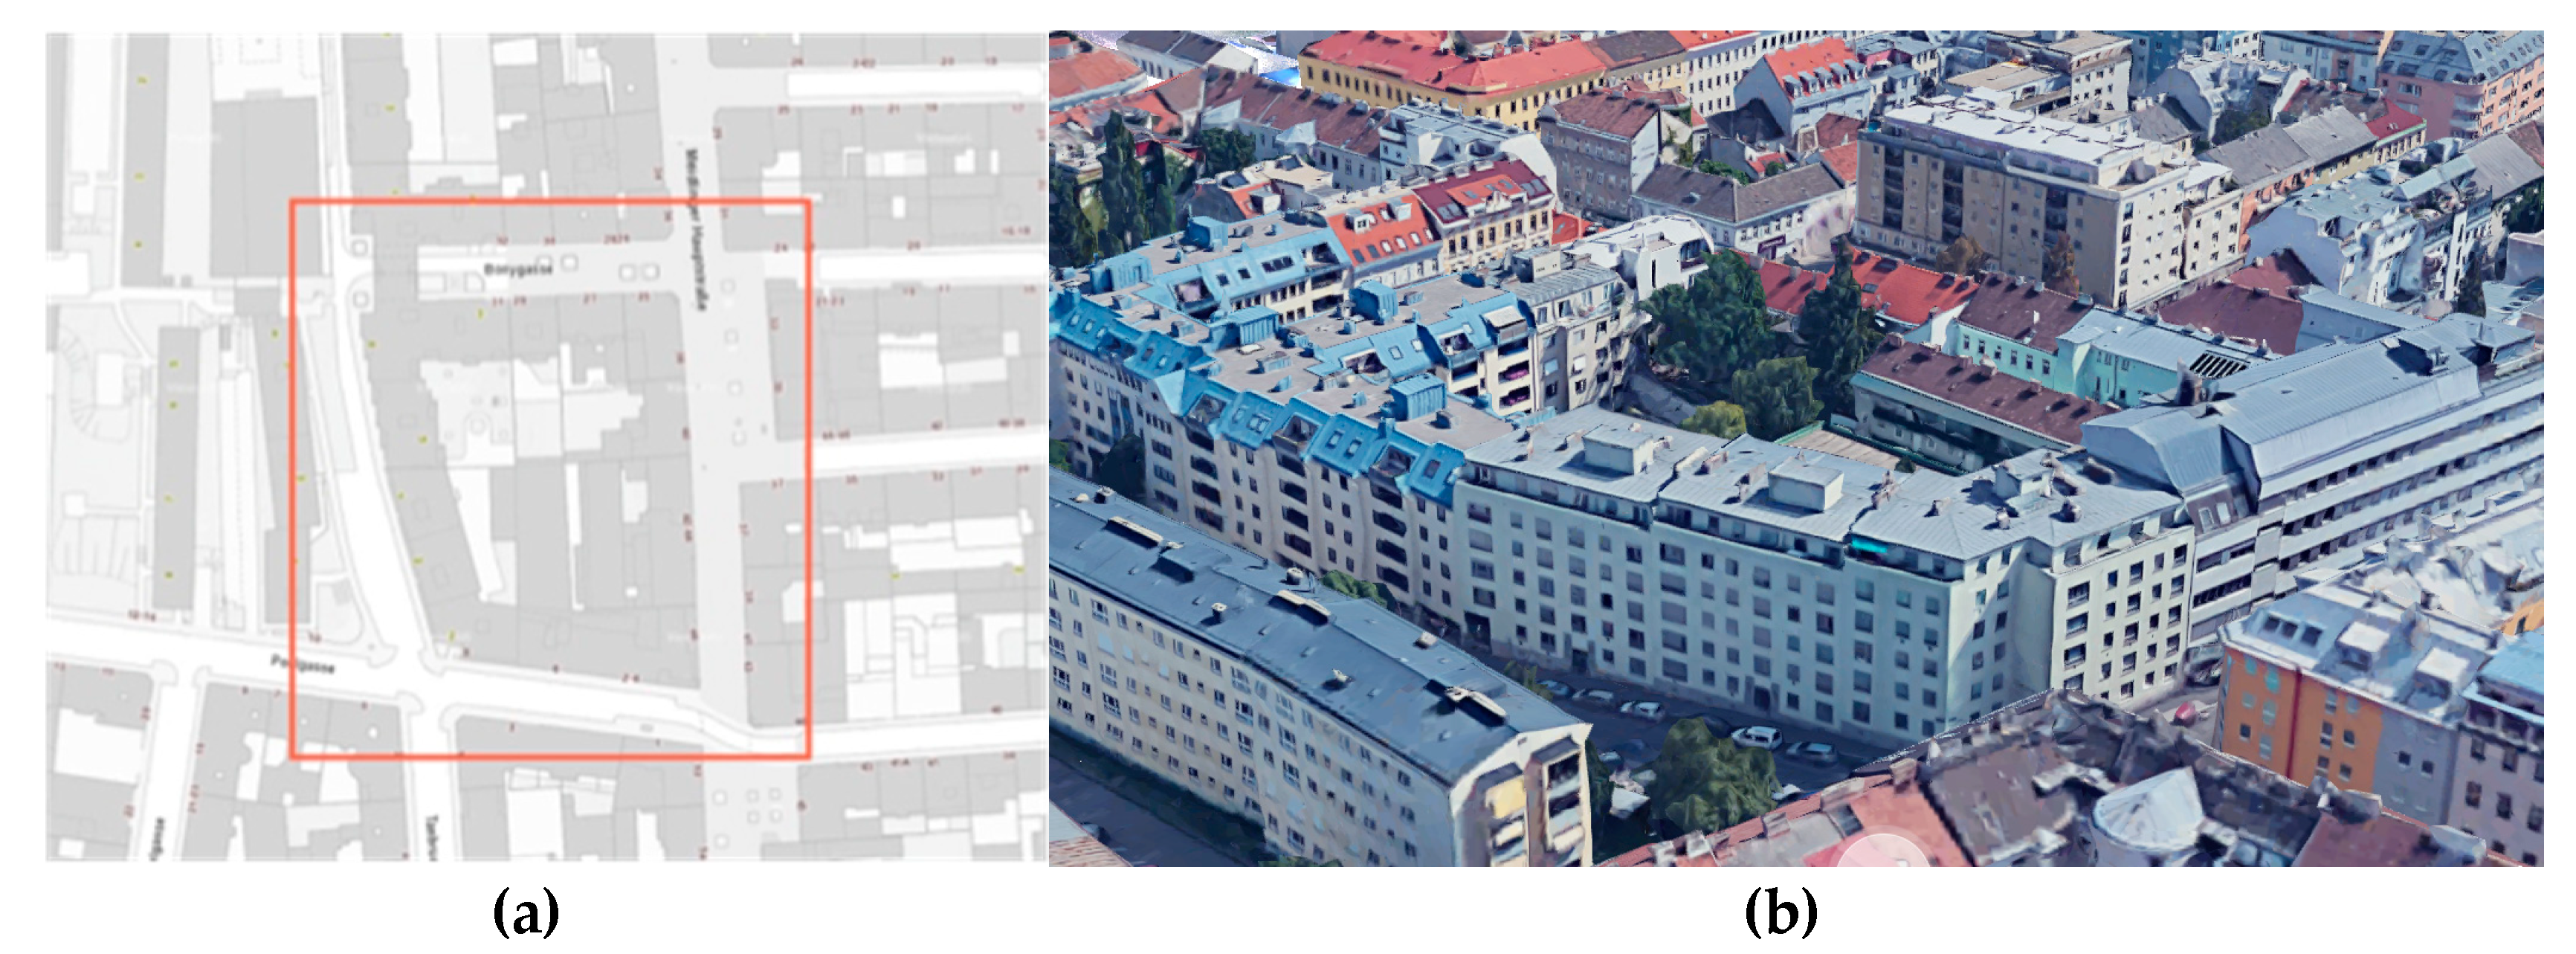
4.1. Description of Theorectical District Use Case

The building data for this district has been derived from a series of publicly available data, such as the land use plan of the City of Vienna [56] and imagery derived from Google maps [57]. Data on typical energy usage depending on the type and age of the building as well as the assumptions on typical heating, cooling and ventilation systems have been based on the Tabula database [58]. It should be noted that, for planning purposes, actual building data derived from, e.g., the Energy Performance Certificate (EPC) or monitored data, should be given preference to proxy data derived from generic databases. However, for the purpose of this study, the accuracy of the energy figures for the base case are of lesser importance, as the aim is solely to assess, whether the proposed methodology can be applied for different types of scenarios for whole districts.
For the assessment of the load shifting potential of the selected district, various scenarios have been defined to cover a wide range of possibilities. The selected options follow a previously carried out study on the SRI validation and are expanded in regard to the scenarios as well as the calculation for the whole district assessment as described in Section 3 above.
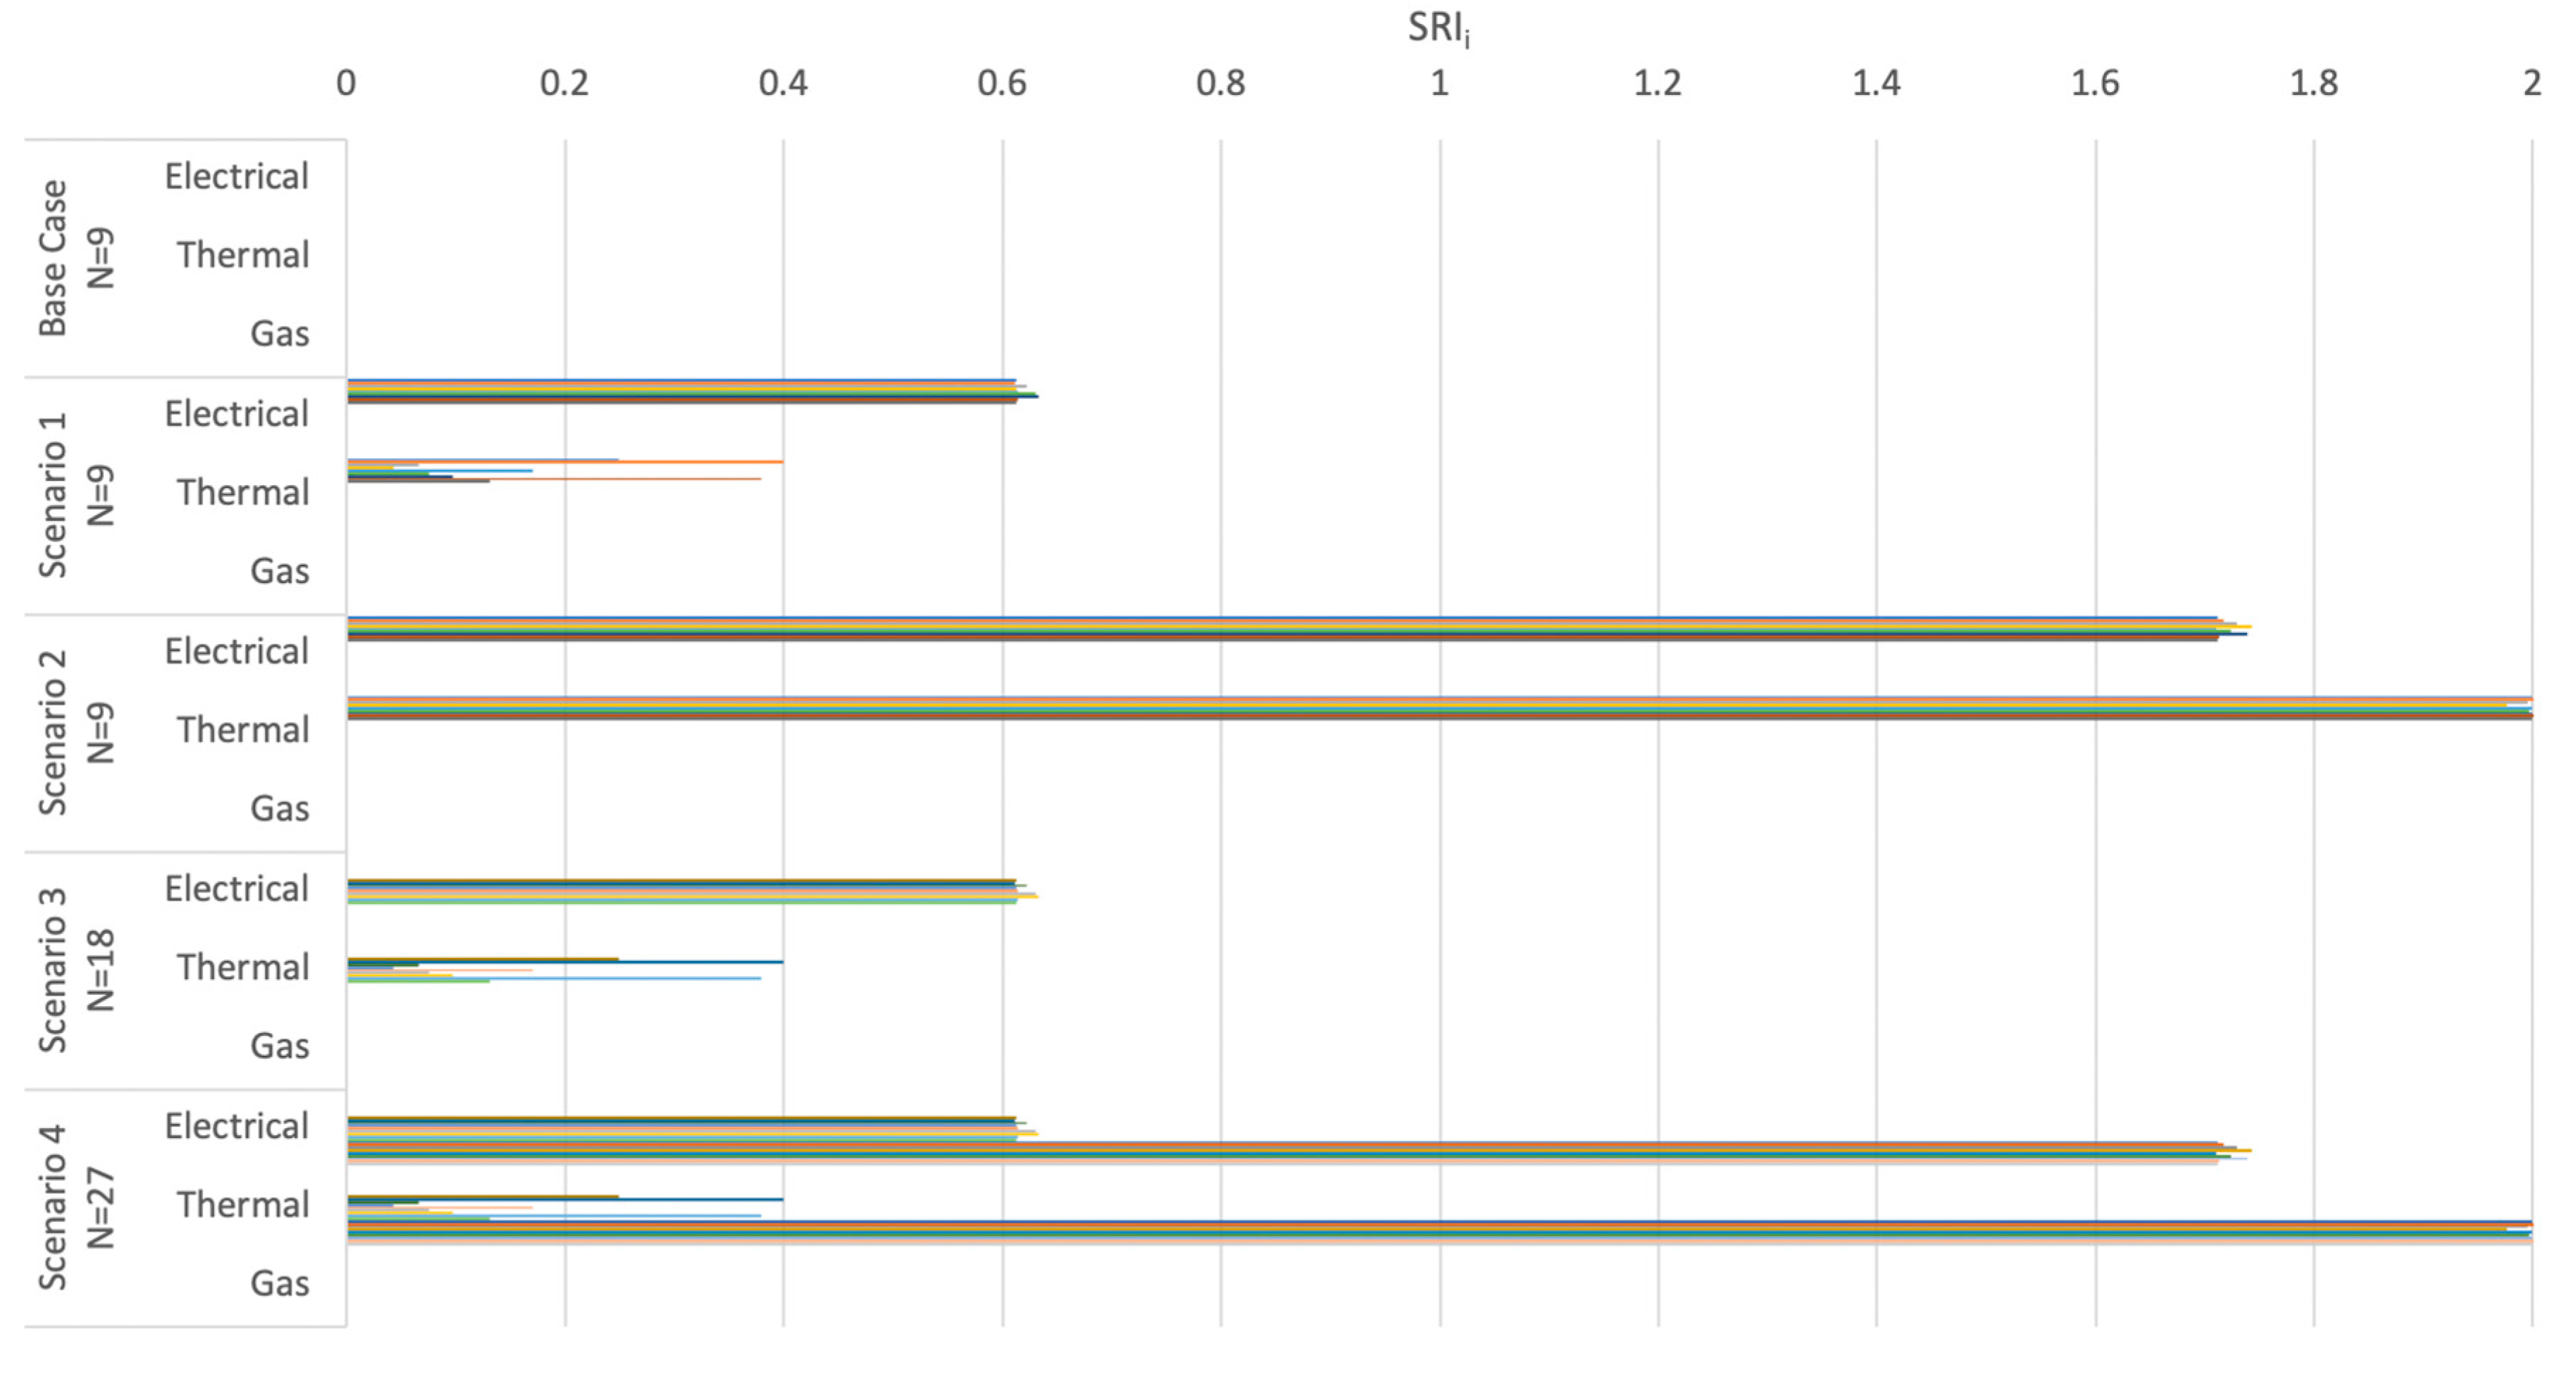
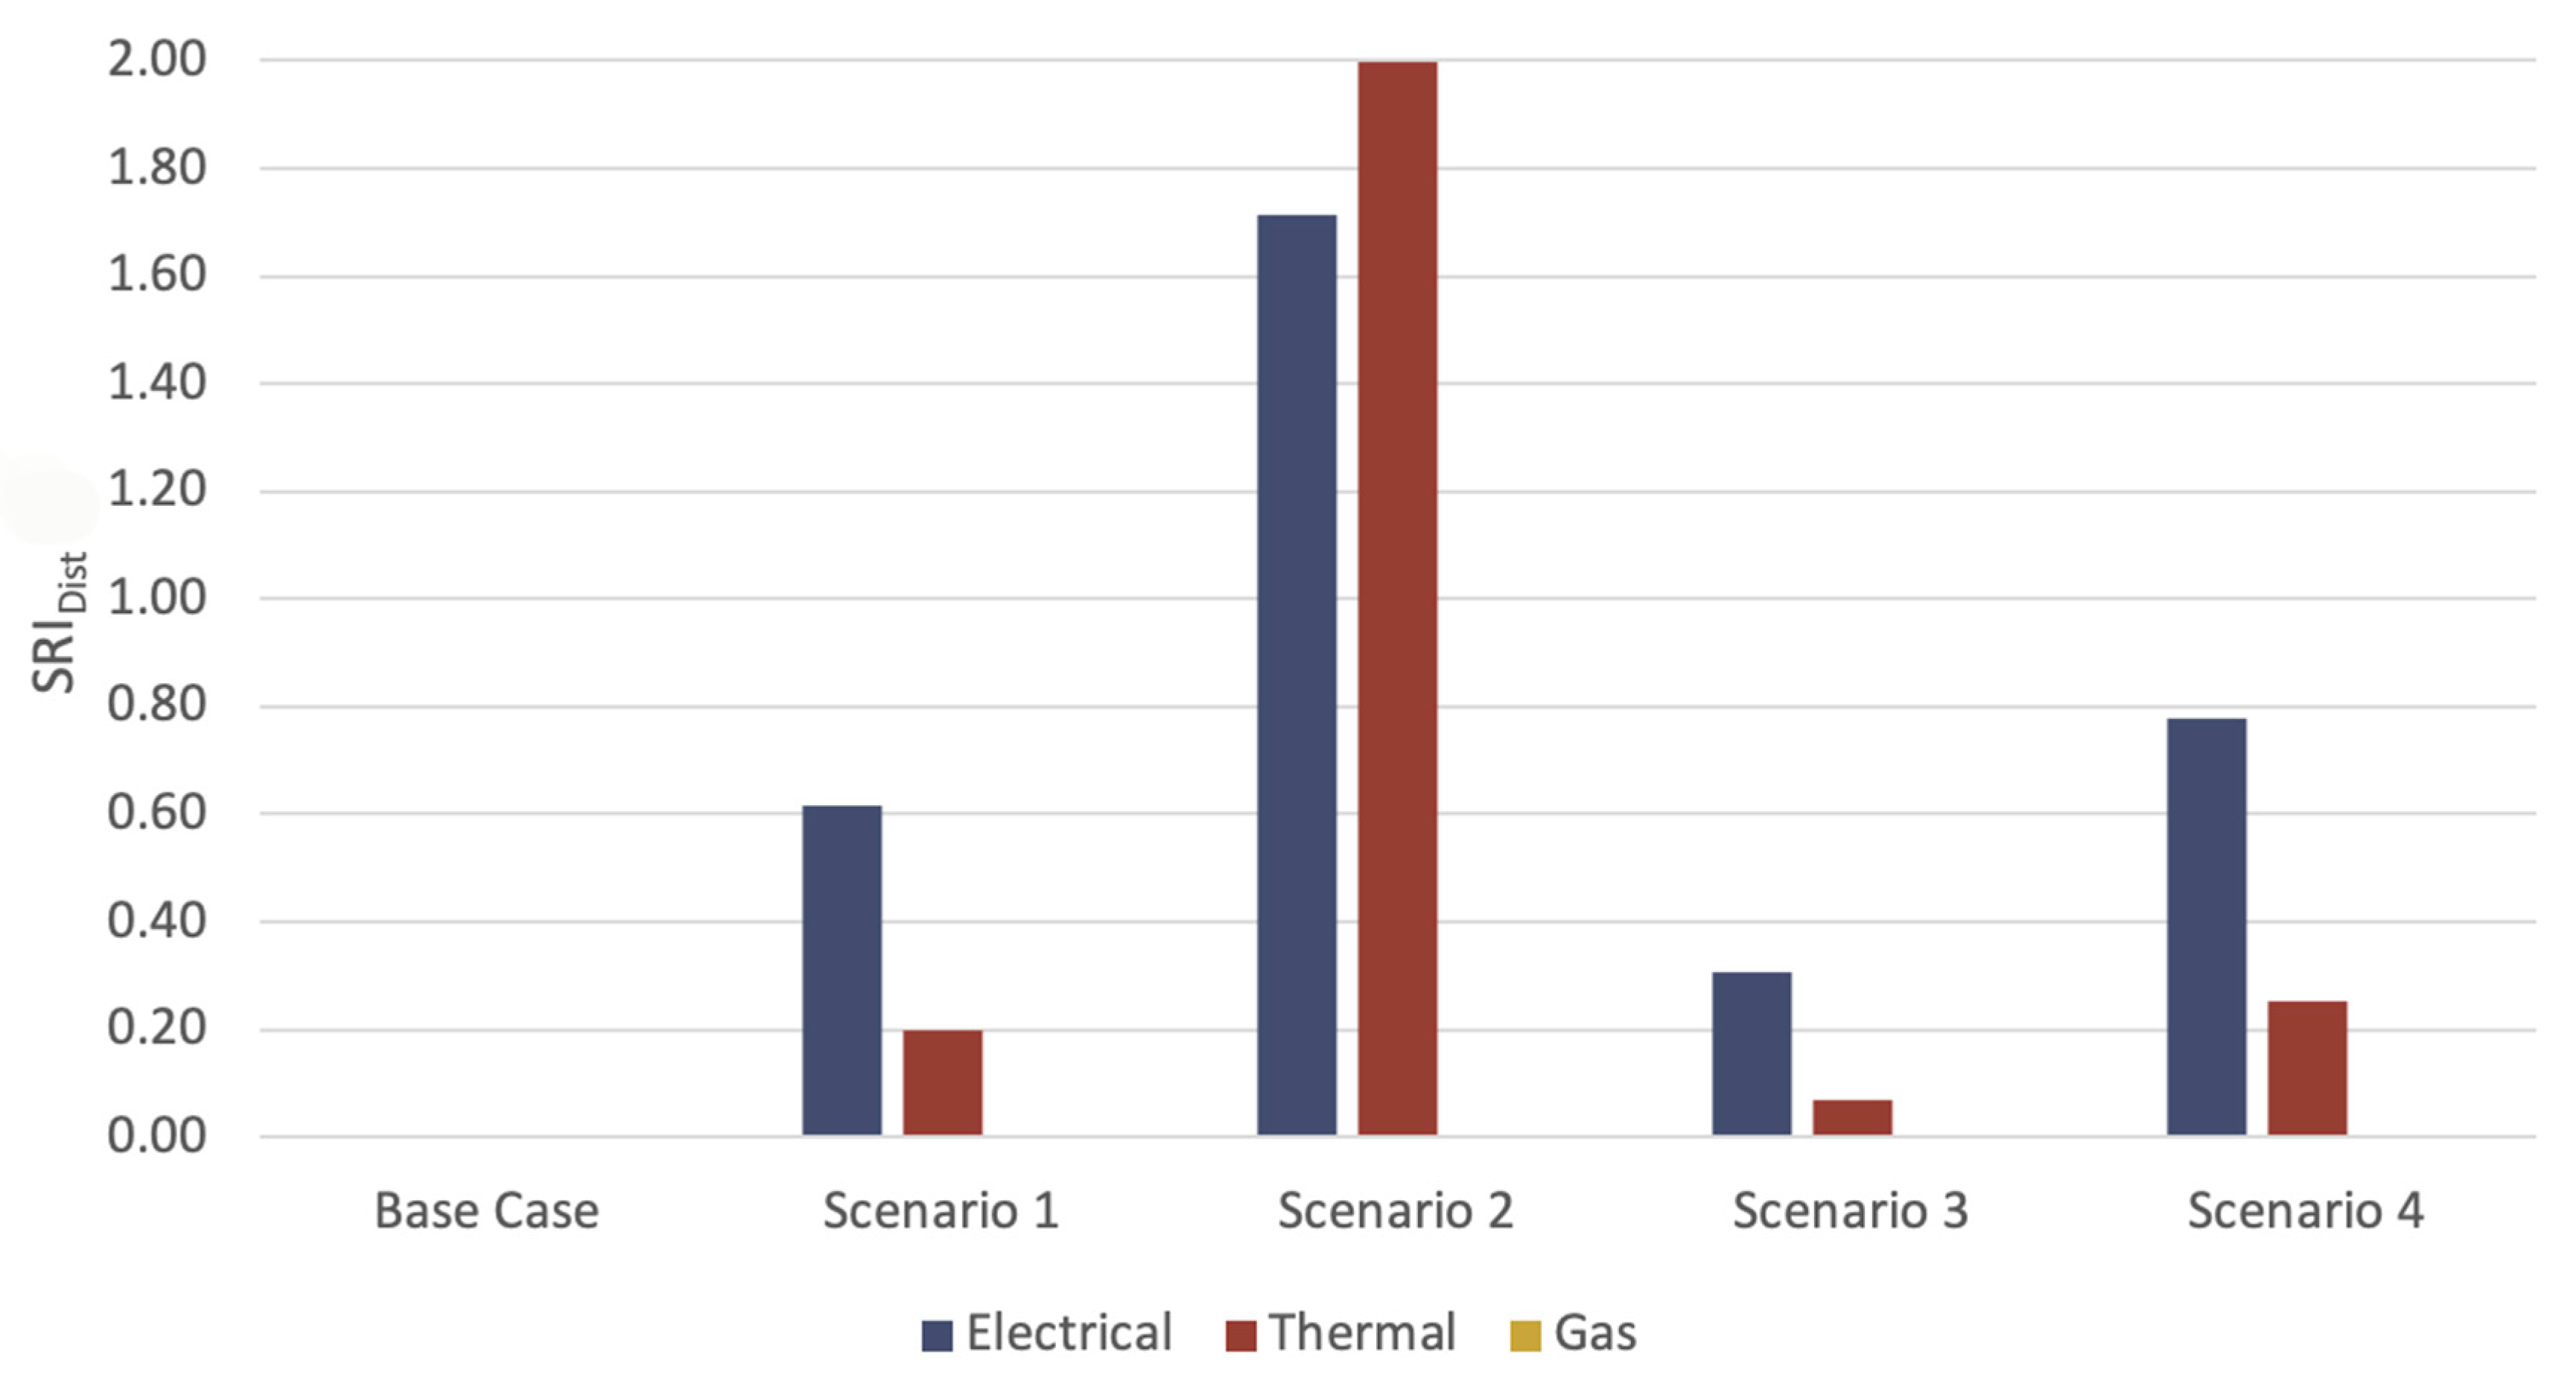
  • Base Case: For the base case the buildings have been assessed according to the generic data as outlined above. For this case it is assumed that the buildings cannot store, actively load or unload energy to and from the grid. The activity coefficient (AC) is subsequently assumed to be either not available (n/a) in case of e.g., a thermal energy network or (0) where there is no active interaction with the grid, e.g., relating to power or gas.
  • Scenario 1: For the first new scenario, a moderate refurbishment of the building envelope is assumed with a 50% improvement compared to the base case. In addition, the gas connection is substituted with a one-directional thermal grid connection and electrical batteries are considered for residential as well as office buildings.
  • Scenario 2: In this scenario, the building shell is improved by 90% compared to the base case, thus a high-performance building shell has been implemented. Similar to scenario 1, the gas connection has been severed and the buildings are connected to a low temperature bi-directional district heating system. RES and batteries are included in all buildings.
  • Scenario 3: For this scenario the district is doubled in size (18 buildings compared to 9 buildings of the above scenarios) and constitutes a mix of the Base Case and Scenario 1. It is assumed that half of the buildings remain as described in the base case (i.e., un-refurbished) and the other half is considered with a moderate refurbishment as described in Scenario 1.
  • Scenario 4: In this scenario, the district is tripled in size (27 buildings) and constitutes a mix of the Base Case, Scenario 1 and Scenario 2. It is assumed that one third of the buildings remains as described in the base case (i.e., un-refurbished), one third is refurbished and follows the characteristics of Scenario 1 and the remaining third follows Scenario 2.
For Scenarios 3 and 4 a double and triple size of the original Base Scenario has been defined. This has been done in order to demonstrate the overall weighting of the SRI across the district. As outlined in Equations (4)–(6) above, a specific weighting factor has been integrated to ensure that districts with different characteristics can be fairly compared. As the SRIDist is a single number it needed to be avoided that the SRI represents a simple average across all buildings but rather a weighted average based on the respective share of energy consumption in relation to the total energy consumption of the district.
In Table 1, a description of the energy related properties for the base case as well as subsequent scenarios is outlined.

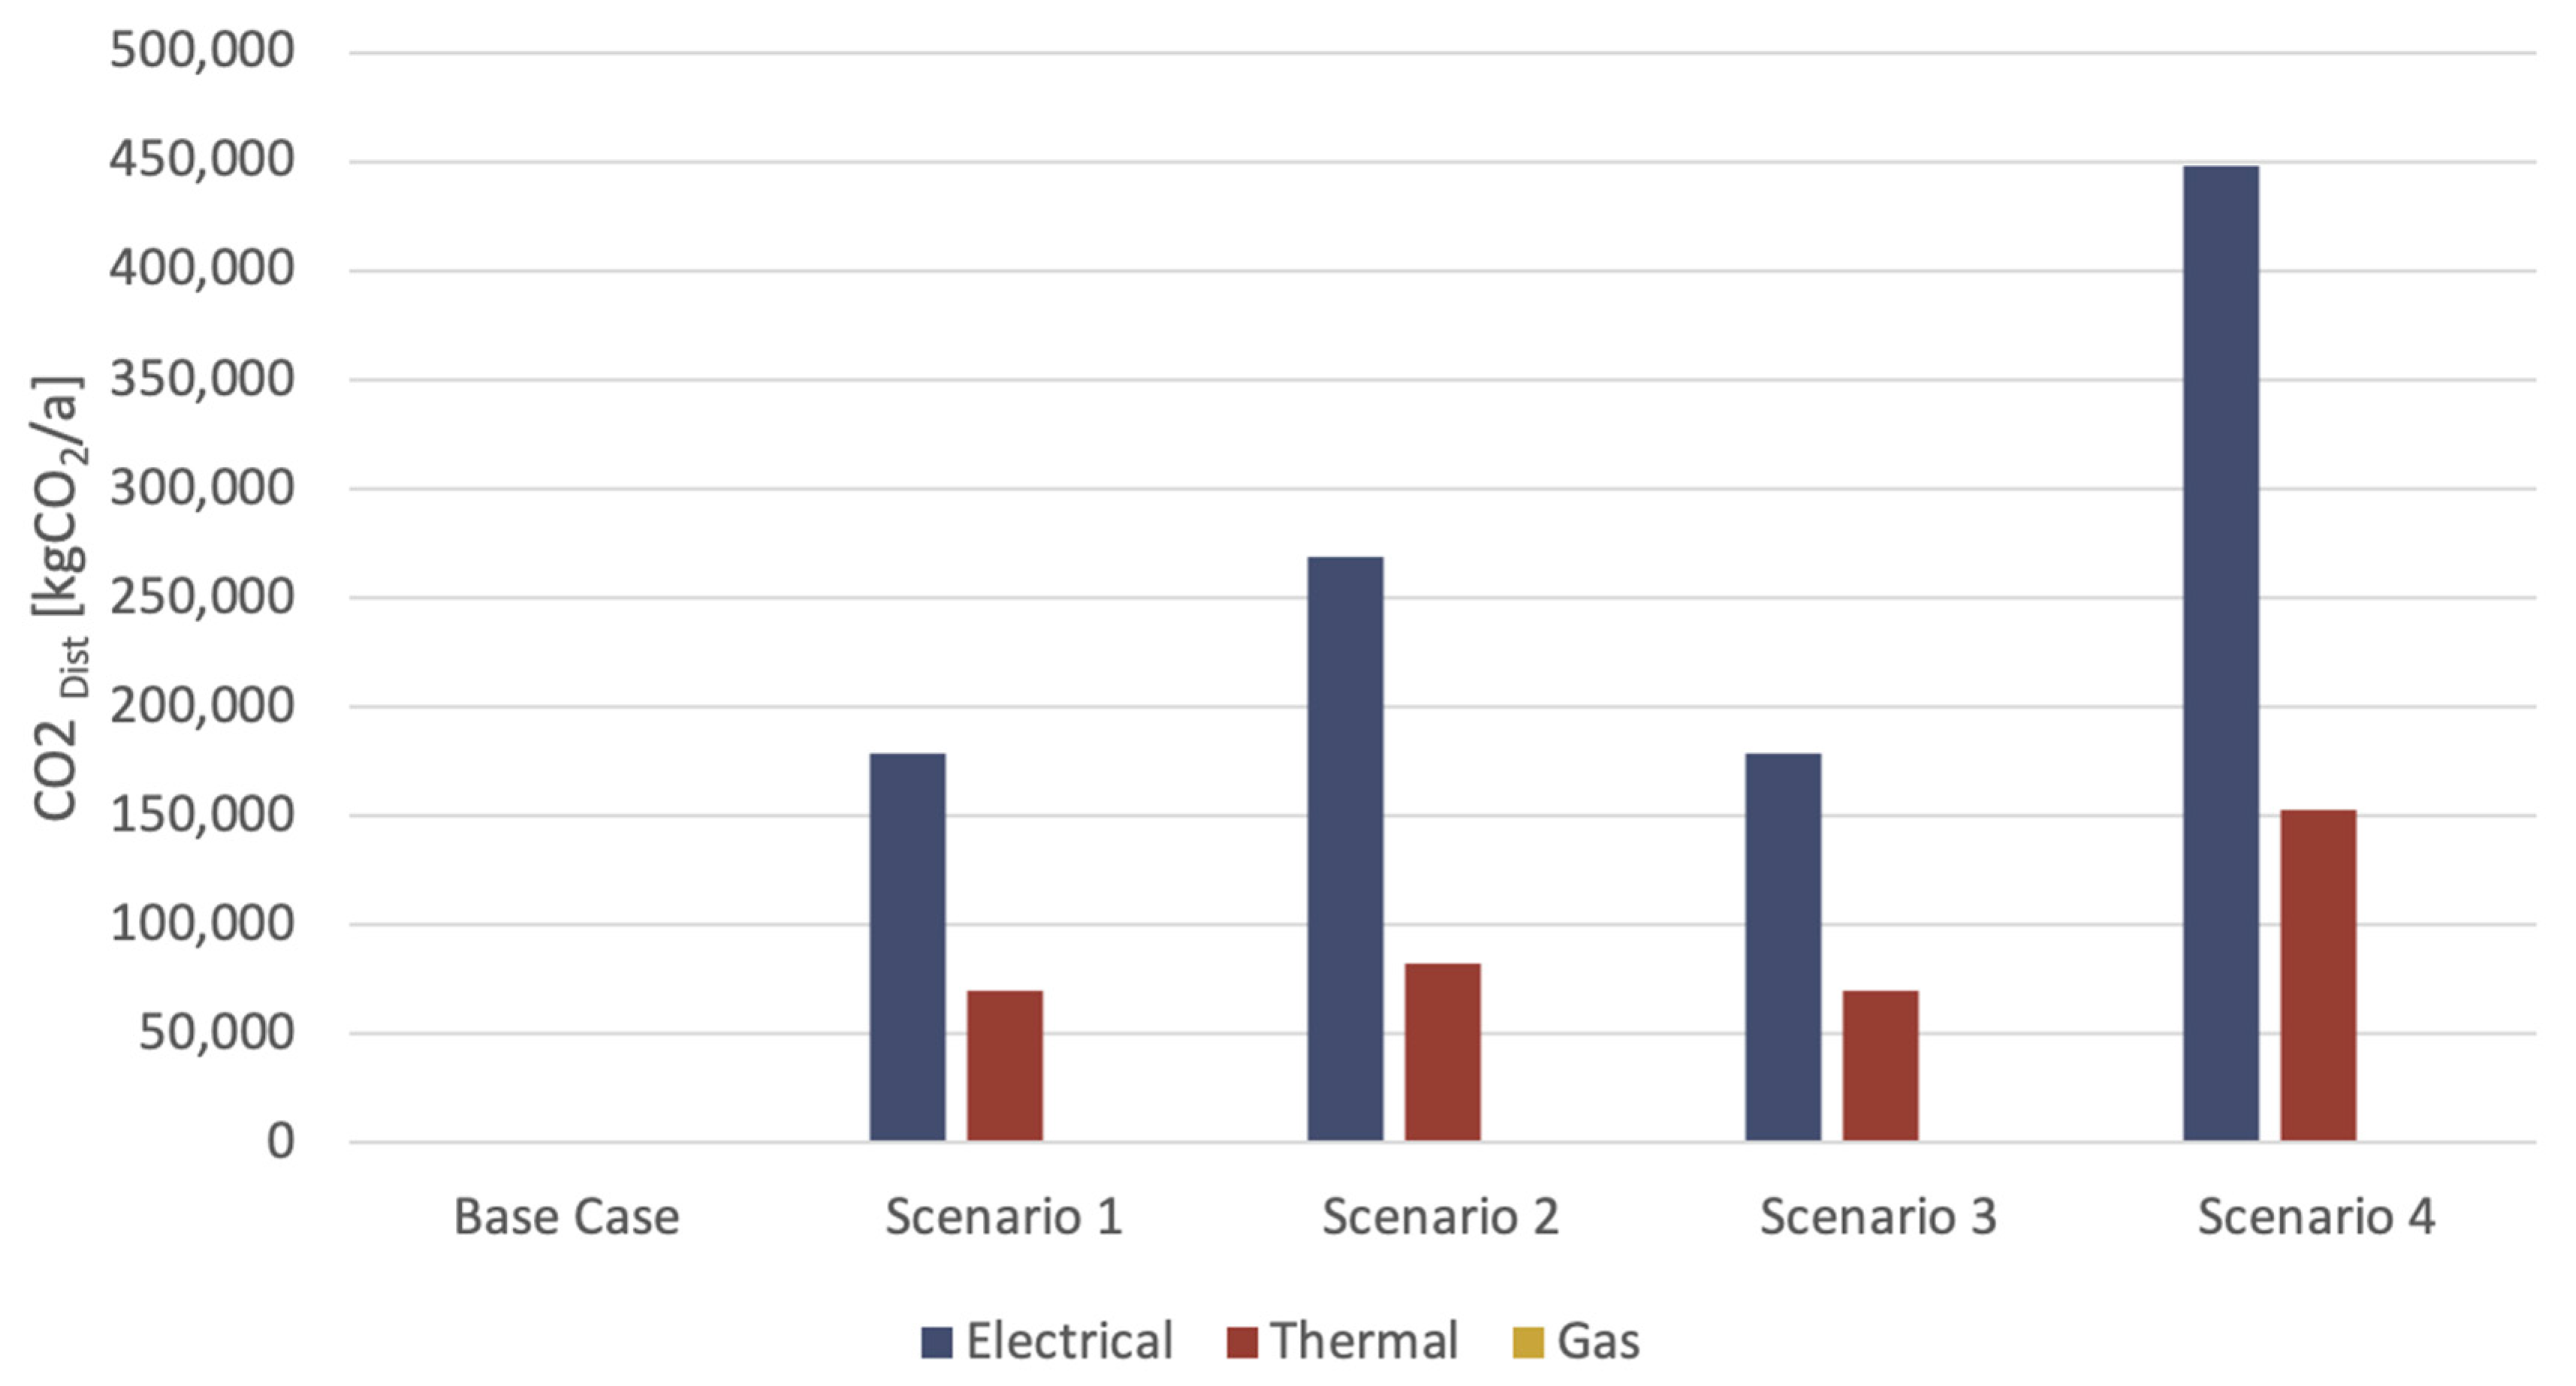
4.2. Results of Theoretical District Use Case

The results of the theoretical use case comprising of the base case and four scenarios are displayed in the following figures. In Figure 6, the SRI is shown per building for each scenario. It can be seen that, whilst the base case, Scenario 1 and 2, is comprised of nine buildings in the district (N = 9), in Scenario 3, the district is doubled in size with 18 buildings (N = 18), and in Scenario 4, tripled with 27 buildings (N = 27). The SRIi for the base case is “0” as the activity coefficient is also “0” (i.e., no interaction with the grid, buildings are simple consumers). The SRI for all other buildings varies dependent on type, size, interaction potential and storage capacity. In Figure 6, Equation (3) has been applied.
In Figure 7 the SRIDist for the various scenarios is displayed on a district scale. Since the base case has an activity coefficient of “0” the SRI for the base case for the district is equally “0”. Scenario 1 rates already better, however Scenario 2, with the optimized refurbishment option and active storage potential for both electrical and thermal provides the best result. The mix of base case and Scenario 1 which is displayed in Scenario 3 is obviously less good than Scenario 1 as the SRI is weighted across the district. With half the buildings in Scenario 3 being un-refurbished and offering no load shifting potential, the results are poorer. Scenario 4, which is a mix of the Base Case, Scenario 1 and Scenario 2 rates second best, as the base case takes up only a third of the overall scenario and the SRI is weighted across the district. The results highlight that the above described weighting factor does ensure an objective comparability across the various scenarios. In Figure 7, Equation (4) after Equation (5) after Equation (6) after Equation (3) have been applied.
The load shifting potential for the overall district is displayed in Figure 8. The LPDist represents, different to the SRIDist, a total figure. The results show, that Scenario 4 can provide with a total number of 27 buildings based on a mix of the base case, Scenario 1 and 2 the highest amount of load shifting in kWh. The base case obviously has no load shifting potential, as there is no interaction with the grid and the SRIDist as shown above is consequently “0”. Scenario 1 and Scenario 3 have exactly the same load shifting potential, as they have the same amount of buildings that offer the same storage capacities, as the base case buildings in Scenario 3 do not contribute at all to the load shifting. Scenario 4 offers the best results due to the highest number of buildings in the district (N = 27) and the relatively high storage capacity due to the mix of Scenario 1 and 2 (the base case buildings in this scenario equally do not contribute to the LPDist). In Figure 8, Equation (13) after Equation (12) after Equation (3) have been applied.
In Figure 9, the potential CO2 savings for the district are displayed. The results follow in tendency the results for LPDist as a higher load shifting potential results in increased CO2 savings. Similar to the above results, the Base Case does not save any emissions due to the lack of load shifting potential. Scenario 1 and Scenario 3 show the same results (as is also the case with LPDist) as they both feature the same load shifting potential and subsequently the same potential for emission savings. Scenario 2 and 4 also feature higher equivalent savings due to their higher storage capacity and improved activity (bi-directional connection).
Evidently, these figures vary, depending on the actual emissions of the energy system (CO2Curr, actual CO2 emissions per kWh) and the emissions from renewables in the energy system (CO2renew, CO2 emissions per kWh from renewable energy sources) as outlined in Equation (14). Since this theoretical use case is based in Vienna, the figures for electrical and thermal energy have been taken from the Austrian standards [59] with a noted power mix of 417 g/kWh CO2 and district heating from highly efficient CHP (combined heat and power) with 73 g/kWh CO2. Emissions from renewables have been calculated with 0 g/kWh CO2. Since the emissions from the current power mix are substantially higher than the emissions from the current thermal sources, the savings on the electrical side subsequently exceed the savings from the thermal side, even though the thermal load shifting potential as outlined in Figure 8 is higher in all four scenarios than the electrical load shifting potential. In Figure 9, Equation (14) after Equation (13) after Equation (12) after Equation (3) have been applied.

5. Discussion

In this study, an expanded methodology aims at providing a coherent quantitative assessment of whole districts based on their overall energy storage capacity, load shifting potential, their ability to actively interact with the energy grids and the resulting CO2 emission savings compared to a non-interactive system. As the previously published methodology has been discussed with selected stakeholders, an improvement has been undertaken in order to better adjust the SRI to efficiency standards. In the new version a cut-off for the efficiency of the storage system has been introduced so that large scale, but potentially inefficient storage systems cannot easily substitute smaller, but efficient ones. This is of particular importance in order to avoid that outdated and potentially environmentally harmful technologies are rewarded with a good result. Thus, the efficiency limit, as stated as one of the research questions, has been addressed.
The subsequent enlargement towards a district assessment demonstrates that the methodology can be adapted to bigger and spatially logical entities. The application of the methodology in a theoretical case study shows that the approach is suitable to define relevant indications of the load shifting potential by means of SRIDist and LPDist as both indicators deliver meaningful results in this context. A weighting factor that has been introduced for the SRIDist ensures that districts with different characteristics in terms of size, type and quality can be fairly compared. With this measure, an entity that has a low SRI can be avoided, but high energy demand cannot at the same time within a district be easily compensated with a single entity that has a high SRI but low energy demand. Consequently, the methodology has shown to be meaningfully extended to groups of buildings, thus answering to the second research question.
The SRIDist can also function as a benchmark as whole districts can be assessed based on their possibility for further development without relying on measured or monitored data from the energy providers. As outlined in Figure 7 and Figure 8, for example Scenario 1 and Scenario 3 can be compared based on their potential for expansion. Whilst Scenario 3 features twice as many buildings as Scenario 1, the LPDist is the same for both scenarios as the load shifting potential is the same across both districts as only half of the buildings in Scenario 3 provide storage capacity. However, from the SRIDist it can be clearly seen, that in Scenario 3 there is a considerable higher potential for further load shifting as the SRIDist is considerably lower in Scenario 3 than in Scenario 1. This shows that the SRIDist can provide a meaningful assessment and comparison of districts that usually greatly differ in size, type, as well as quality and number of buildings.
The approach is however solely focused on the load shifting potential and ability of the district to actively interact with the grid. This differentiates the methodology from other more interdisciplinary approaches such as those outlined, for example, by Garcia-Ayllon [60] and Sharifi [61] where many other factors such as, e.g., resources and governance, have been taken into account. Also, other schemes such as the BIQ [28] and the HSBS [29] rating, that have been comprehensively compared to the SRI by Apanaviciene et al. [27], deliver a much larger, complex set of indicators that are rather dependent on system and device assessment. Our observation offers information targeted on load shifting, thus providing a very focused assessment. The approach outlined in this paper is also not technology specific, but is based on certain qualities, that need to be achieved. This is crucial, as it decouples the methodology from the technology used and makes the approach future proof, as any new technology or device can be similarly represented within this novel approach. The methodology in this paper might therefore serve as one of a series of other quantitative indicators that can be integrated into broader assessments.
In relation to the possible CO2 savings as stated in the last research question, the methodology also provides a workable approach. When considering the systems of energy generation, energy transmission and consumers in relation to the same three systems and adding energy storage, a potential for CO2 savings can be generated. The assumption is that energy which comes from renewable sources cannot be produced on demand, but when it can be stored, it can be subsequently released on demand. It follows that there is the possibility that the magnitude of the LP energy from CO2 neutral but not demand-driven energy sources can be used. This results in a reduction in CO2-related energy and thus an indirect reduction in CO2 emissions from energy production. This definition provides a quantitative assessment of the proportional CO2 savings in relation to the load shifting potential.
Whilst the proposed indicators can be applied for different queries, the following key questions can be answered with the proposed approach: In which area does a high potential for load shifting measures in buildings exist? Which areas already provide enough smart buildings and renewable energy capacity in order to improve the network infrastructure? Is there enough load shifting potential from buildings near, e.g., a wind farm, in order to actively use it as storage? What are the prospective CO2 savings associated with the potential load shifting capacity of the district? For those and similar questions, the proposed initial assessment can provide meaningful results.
There are however also certain limitations to this approach. For one, the assessment of the LPDist is not based on actual load profiles and should therefore not be used as a substitute for an exact analysis. Whilst the methodology serves very well for an initial and quick assessment of the load shifting potential within a defined district it is neither intended nor suitable for detailed capacity sizing of energy infrastructure. Care should also be taken related to the choice and extent of the area (system boundaries of the district) under consideration. The SRIDist evaluates only the load shifting potential of buildings and does not take any information regarding the respective electrical, thermal or gas grids into account. Thus, any bottlenecks in the network infrastructure are not recognized. This means that just because the buildings are able to move a certain amount of energy it is not necessarily the case that the networks are also able to accommodate this. It is subsequently evident that the proposed indicators are centered around the assessment of buildings (or multiple buildings) rather than the energy infrastructure.
For further research, a verification of the indicator could be done with a comprehensive dynamic building simulation for the assessment of load shifting capacities, which is based on monitoring data from a wide range of different buildings types. Based on this assessment, the discrepancies of the monitored and subsequently simulated data with the results from the SRI methodology could be calculated. With this, the functions of the model could be calibrated in order to match the actual requirements. In addition, monitoring data derived from buildings varying in typology and energy profiles could be used to assess how well the calculated approximation matches the actual building data. A validation of that kind is planned for the future, once the SRI has to be implemented for Building Regulations purposes. Additionally, a similar indicator that assesses and highlights the free capacities in different network areas or network nodes could be considered. Conversely, one could also estimate for an area which SRIDist_Max or LPDist_Max the network infrastructure can endure and thus monitor the development of load shifting potentials and renewable integration in the area in order to be vigilant of potentially critical conditions related to the energy infrastructure.

6. Conclusions

This paper proposes a novel quantitative approach for the rating of the load shifting potential of smart districts and discusses qualitative and quantitative assessments related to energy load shifting at building and district level. The topic emerged from the new regulations in the Energy Performance of Buildings Directive (EPBD) where a smart readiness indicator (SRI) has been defined in order to rate buildings according to their ability to operate and communicate efficiently with energy grids. Current proposal on the rating of the SRI are mainly focused on qualitative approaches based on the assessments of experts. Also, they mainly focus on buildings without taking larger entities into account. As previous studies have shown, there is a clear need for a quantitative approach to allow objectivity and comparability of the results. The methodology proposed in this publication addresses this research gap. It builds on a previously published quantitative approach for smart buildings and extends the application to bigger entities. It also includes findings from stakeholder consultation and provides an improved version, taking efficiency standards related to energy storage systems into account. The novel SRIDist can be used to assess whole districts based on their overall energy storage capacity, load shifting potential and their ability to actively interact with the energy grids. In addition, it provides an approximation for CO2 savings in relation to a non-interactive system. The key aspect of the methodology is an application that integrates the use of building and energy data, that is relatively easily available without the need for monitored data that is either difficult to access or not available at all at an early planning stage. The methodology also does not rely on specific systems, but rather on qualities of a system, thus making the approach suitable for future technologies. The application in a theoretical district use case shows a logical distribution of SRI results across the different scenarios and supports the meaningfulness of an approximation of complex data within a comparable indicator. With a simple rating, load shifting potentials in districts can be more easily assessed, thus leading to a potentially higher integration of renewable energy sources with a volatile generation capacity. The research subsequently contributes with a theoretical framework to the increased exploitation of load shifting capacities in building and districts.

Supplementary Materials

Supplementary File 1

Author Contributions

Author D.Ö. contributed mainly to the conceptualization, methodology, writing of the original draft, review, and editing. Author T.M. contributed mainly to the methodology, the formal analysis, the validation, and the writing of the original draft. All authors have read and agreed to the published version of the manuscript.

Funding

This research is partly funded under the framework of the project “UrbanEnerPlan-Impact of urban planning related framework conditions on energy and resource-efficiency of new residential building developments in Vienna–Quantification of energy and urban planning related influencing factors” under the City of Vienna Jubilee Funds for the University of Natural Resources and Life Sciences, Vienna.

Acknowledgments

Supported by the University of Natural Resources and Life Sciences, Vienna Open Access Publishing Fund.

Conflicts of Interest

The authors declare no conflict of interest.

References

  1. European Commission. The European Green Deal; COM (2019) 640 Final; European Commission: Brussels, Belgium, 2019. [Google Scholar]
  2. European Climate Law. Available online: https://ec.europa.eu/clima/policies/eu-climate-action/law_en (accessed on 14 April 2020).
  3. World Business Council for Sustainable Development (WBCSD). Energy Efficiency in Buildings Transforming the Market; WBCSD: Geneva, Switzerland, 2009. [Google Scholar]
  4. Cao, X.D.; Dai, X.L.; Liu, J.J. Building energy-consumption status worldwide and the state-of-the-art technologies for zero-energy buildings during the past decade. Energy Build. 2016, 128, 198–213. [Google Scholar] [CrossRef]
  5. European Commission. Technology Assessment; COM (2013) 253 Final; European Commission: Brussels, Belgium, 2013. [Google Scholar]
  6. Directive 2012/27/EU of the European Parliament and of the Council of 25 October 2012 on Energy Efficiency; L315/1-56; Official Journal of the European Union: Brussels, Belgium, 2012.
  7. Directive 2009/28/EC of the European Parliament and of the Council of 23 April 2009 on the Promotion of the Use of Energy from Renewable Sources; L140/16-62; Official Journal of the European Union: Brussels, Belgium, 2009.
  8. Directive 2002/91/EU of the European Parliament and of the Council of 16 December 2002 on the Energy Performance of Buildings; L1/65; Official Journal of the European Union: Brussels, Belgium, 2003.
  9. Directive (EU) 2018/844 of the European Parliament and of the Council of 30 May 2018 Amending Directive 2010/31/EU on the Energy Performance of Buildings Directive 2012/27/EU on Energy Efficiency; L156/75; Official Journal of the European Union: Brussels, Belgium, 2018.
  10. Verbeke, S.; Ma, Y.; Van Tichelen, P.; Bogaert, S.; Gómez Oñate, V.; Waide, P.; Bettgenhäuser, K.; Ashok, J.; Hermelink, A.; Offermann, M.; et al. Support. for Setting Up a Smart Readiness Indicator for Buildings and Related Impact Assessment, Final Report; Study Accomplished under the Authority of the European Commission DG Energy 2017/SEB/R/1610684; Vito NV: Mol, Belgium, 2018. [Google Scholar]
  11. Verbeke, S.; Aerts, D.; Rynders, G.; Ma, Y.; Waide, P. 3rd Interim Report of the 2nd Technical Support. Study on the Smart Readiness Indicator for Buildings; Study Accomplished under the Authority of the European Commission DG Energy ENER/C3/2018-447/06; Vito NV: Mol, Belgium, 2020. [Google Scholar]
  12. Janhunen, E.; Pulkka, L.; Säynäjoki, A.; Junnila, S. Applicability of the Smart Readiness Indicator for Cold Climate Countries. Buildings 2019, 9, 102. [Google Scholar] [CrossRef] [Green Version]
  13. Vigna, I.; Pernetti, R.; Pernigotto, G.; Gasparella, A. Analysis of the Building Smart Readiness Indicator Calculation: A Comparative Case-Study with Two Panels of Experts. Energies 2020, 13, 2796. [Google Scholar] [CrossRef]
  14. Søren Østergaard, J.; Madsen, H.; Lopes, R.; Junker, R.G.; Aelenei, D.; Li, R.; Metzger, S.; Lindberg, K.B.; Marszal, A.J.; Kummert, M.; et al. Annex 67: Energy Flexible Buildings, Energy Flexibility as a Key Asset in a Smart Building Future Contribution of Annex 67 to the European Smart Building Initiative; Position Paper of the IEA Energy in Buildings and Communities Program (EBC) Annex 67 “Energy Flexible Buildings”; IEA: Paris, France, 2017. [Google Scholar]
  15. Vigna, I.; Pernetti, R.; Pasut, W.; Lollini, R. New domain for promoting energy efficiency: Energy Flexible Building Cluster. Sustain. Cities Soc. 2018, 38, 526–533. [Google Scholar] [CrossRef]
  16. Märzinger, T.; Österreicher, D. Supporting the Smart Readiness Indicator—A Methodology to Integrate A Quantitative Assessment of the Load Shifting Potential of Smart Buildings. Energies 2019, 12, 22. [Google Scholar] [CrossRef] [Green Version]
  17. Bott, H.; Grassl, G.C.; Anders, S. Nachhaltige Stadtplanung, Konzepte für nachhaltige Quartiere; Detail: München, Germany, 2013; ISBN 978-3955531935. [Google Scholar]
  18. Concerted Action Energy Performance of Buildings Directive. Available online: https://epbd-ca.eu (accessed on 14 April 2020).
  19. Fokaides, P.A.; Polycarpou, K.; Kalogirou, S. The impact of the implementation of the European Energy Performance of Buildings Directive on the European building stock: The case of the Cyprus Land Development Corporation. Energy Policy 2017, 111, 1–8. [Google Scholar] [CrossRef]
  20. Lopez-Ochoa, L.M.; Las-Heras-Casas, J.; Lopez-Gonzalez, L.M.; Olasolo-Alonso, P. Towards nearly zero-energy buildings in Mediterranean countries: Energy Performance of Buildings Directive evolution and the energy rehabilitation challenge in the Spanish residential sector. Energy 2019, 176, 335–352. [Google Scholar] [CrossRef]
  21. Brunsgaard, C.; Dvorakova, P.; Wyckmans, A.; Stutterecker, W.; Laskari, M.; Almeida, M.; Kabele, K.; Magyar, Z.; Bartkiewicz, P.; Op’t Veld, P. Integrated energy design—Education and training in cross-disciplinary teams implementing energy performance of buildings directive (EPBD). Build. Environ. 2014, 72, 1–14. [Google Scholar] [CrossRef]
  22. Li, Y.; Kubicki, S.; Guerriero, A.; Rezgui, Y. Review of building energy performance certification schemes towards future improvement. Renew. Sustain. Energy Rev. 2019, 113, 13. [Google Scholar] [CrossRef]
  23. Wigginton, M.; Harris, J. Intelligent Skins; Butterworth-Heinemann: Oxford, UK, 2002. [Google Scholar]
  24. Omar, O. Intelligent building, definitions, factors and evaluation criteria of selection. Alex. Eng. J. 2018, 57, 2903–2910. [Google Scholar] [CrossRef]
  25. Österreicher, D. Methodology towards integrated refurbishment actions in school buildings; Special Issue: Addressing Sustainable Building Refurbishment: A Journey through Energy Optimization and Structural Retrofit. Buildings 2018, 8, 42. [Google Scholar] [CrossRef] [Green Version]
  26. Conci, M.; Schneider, J. A District Approach to Building Renovation for the Integral Energy Redevelopment of Existing Residential Areas. Sustainability 2017, 9, 747. [Google Scholar] [CrossRef] [Green Version]
  27. Apanaviciene, R.; Vanagas, A.; Fokaides, P.A. Smart Building Integration into a Smart City (SBISC): Development of a New Evaluation Framework. Energies 2020, 13, 2190. [Google Scholar] [CrossRef]
  28. Building Intelligence Quotient. Available online: http://www.building-iq.com/biq/index.html (accessed on 30 May 2020).
  29. Honeywell and Ernst & Young LLP. Smart Buildings Make Smart Cities; Honeywell Smart Building Score; Green. Safe. Productive; Honeywell International Inc.: Gurgaon, India; Available online: http://smartbuildings.honeywell.com/hsbs_home (accessed on 30 May 2020).
  30. Mattoni, B.; Nardecchia, F.; Bisegna, F. Towards the development of a smart district: The application of an holistic planning approach. Sustain. Cities Soc. 2019, 48, 17. [Google Scholar] [CrossRef]
  31. CityCalc. Available online: http://citycalc.com (accessed on 19 April 2020).
  32. Smutny, R.; Österreicher, D.; Sattler, S.; Treberspurg, M.; Battisti, K.; Gratzl, M.; Rainer, E.; Staller, H. Low-tech solution for Smart Cities—Optimization tool CityCalc for solar urban design. In Proceedings of the International Conference on Urban Planning and Regional Development in the Information Society GeoMultimedia, Hamburg, Germany, 22–24 June 2016; Schrenk, M., Popovich, V., Zeile, P., Elisei, P., Beyer, C., Eds.; Real Corp 2016 Proceedings: Hamburg, Germany, 2016; ISBN 978-3-9504173-0-2. [Google Scholar]
  33. City Energy Analyst. Available online: https://cityenergyanalyst.com (accessed on 19 April 2020).
  34. Fonseca, J.A.; Schlueter, A. Integrated model for characterization of spatiotemporal building energy consumption patterns in neighborhoods and city districts. Appl. Energy 2015, 142, 247–265. [Google Scholar] [CrossRef]
  35. Fonseca, J.A.; Nguyen, T.A.; Schlueter, A.; Marechal, F. City Energy Analyst (CEA): Integrated framework for analysis and optimization of building energy systems in neighborhoods and city districts. Energy Build. 2016, 113, 202–226. [Google Scholar] [CrossRef]
  36. Eicker, U.; Weiler, V.; Schumacher, J.; Braun, R. On the design of an urban data and modeling platform and its application to urban district analyses. Energy Build. 2020, 217, 19. [Google Scholar] [CrossRef]
  37. Ferrari, S.; Zagarella, F.; Caputo, P.; Bonomolo, M. Assessment of tools for urban energy planning. Energy 2019, 176, 544–551. [Google Scholar] [CrossRef]
  38. IEA EBC Annex 75—Cost-Effective Building Renovation at District Level Combining Energy Efficiency & Renewables. Available online: http://annex75.iea-ebc.org (accessed on 19 April 2020).
  39. Rifkin, J. The Green New Deal: Why the Fossil Fuel Civilization Will Collapse by 2028, and the Bold Economic Plan. to Save Life on Earth; St. Martins Press: New York, NY, USA, 2019; ISBN 978-1250253200. [Google Scholar]
  40. Aichele, C.; Doleski, O.D. Smart Market—Vom Smart Grid zum intelligenten Energiemarkt; Springer Vieweg: Wiesbaden, Germany, 2014. [Google Scholar] [CrossRef]
  41. Darivianakis, G.; Georghiou, A.; Smith, R.S.; Lygeros, J. The Power of Diversity: Data-Driven Robust Predictive Control for Energy-Efficient Buildings and Districts. IEEE Trans. Control Syst. Technol. 2019, 27, 132–145. [Google Scholar] [CrossRef] [Green Version]
  42. Hakimi, S.M.; Hasankhani, A.; Shafie-khah, M.; Catalão, J.P.S. Demand response method for smart microgrids considering high renewable energies penetration. Sustain. Energy Grids Netw. 2020, 21, 100325. [Google Scholar] [CrossRef]
  43. De Paola, A.; Angeli, D.; Strbac, G. Distributed Control of Micro-Storage Devices with Mean Field Games. IEEE Trans. Smart Grid 2015. [Google Scholar] [CrossRef] [Green Version]
  44. Zhang, C.; Wu, J.; Zhou, Y.; Cheng, M.; Long, C. Peer-to-Peer energy trading in a Microgrid. Appl. Energy 2018, 220, 1–12. [Google Scholar] [CrossRef]
  45. Fleiter, T.; Steinbach, J.; Ragwitz, M.; Arens, M.; Aydemir, A.; Elsland, R.; Fleiter, T.; Frassine, C.; Herbst, A.; Hirzel, S.; et al. Mapping and Analyses of the Current and Future (2020–2030) Heating/Cooling Fuel Deployment (Fossil/Renewables); European Commission Directorate-General for Energy: Brussels, Belgium; Luxembourg, 2016; Available online: https://ec.europa.eu/energy/sites/ener/files/documents/mapping-hc-excecutivesummary.pdf (accessed on 27 April 2020).
  46. Loibl, W.; Stollnberger, R.; Österreicher, D. Residential Heat Supply by Waste-Heat Re-Use: Sources, Supply Potential and Demand Coverage-A Case Study. Sustainability 2017, 9, 250. [Google Scholar] [CrossRef] [Green Version]
  47. Lichtenwoehrer, P.; Erker, S.; Zach, F.; Stoeglehner, G. Future compatibility of district heating in urban areas—A case study analysis in the context of integrated spatial and energy planning. Energy Sustain. Soc. 2019, 9, 12. [Google Scholar] [CrossRef] [Green Version]
  48. Huang, P.; Copertaro, B.; Zhang, X.X.; Shen, J.C.; Lofgren, I.; Ronnelid, M.; Fahlen, J.; Andersson, D.; Svanfeldt, M. A review of data centers as prosumers in district energy systems: Renewable energy integration and waste heat reuse for district heating. Appl. Energy 2020, 258, 20. [Google Scholar] [CrossRef]
  49. Brand, L.; Calven, A.; Englund, J.; Landersjo, H.; Lauenburg, P. Smart district heating networks—A simulation study of prosumers’ impact on technical parameters in distribution networks. Appl. Energy 2014, 129, 39–48. [Google Scholar] [CrossRef]
  50. Lichtenegger, K.; Wöss Halmdienst, C.; Höftberger, E.; Schmidl, C.; Pröll, T. Intelligent heat networks: First results of an energy information-cost-model. SEGAN 2017, 11, 1–12. [Google Scholar] [CrossRef]
  51. Lichtenegger, K.; Leitner, A.; Märzinger, T.; Mair, C.; Moser, A.; Wöss, D.; Schmidl, C.; Pröll, T. Decentralized heating grid operation: A comparison of centralized and agent-based optimization. Sustain. Energy Grids Netw. 2020, 21, 100300. [Google Scholar] [CrossRef]
  52. Kilkis, S. Energy system analysis of a pilot net-zero exergy district. Energy Convers. Manag. 2014, 87, 1077–1092. [Google Scholar] [CrossRef]
  53. Bischi, A.; Taccari, L.; Martelli, E.; Amaldi, E.; Manzolini, G.; Silva, P.; Campanari, S.; Macchi, E. A detailed MILP optimization model for combined cooling, heat and power system operation planning. Energy 2014, 74, 12–26. [Google Scholar] [CrossRef]
  54. Bracco, S.; Delfino, F.; Ferro, G.; Pagnini, L.; Robba, M.; Rossi, M. Energy planning of sustainable districts: Towards the exploitation of small size intermittent renewables in urban areas. Appl. Energy 2018, 228, 2288–2297. [Google Scholar] [CrossRef]
  55. Österreicher, D.; Märzinger, T. Assessing the Load Shifting Potential in Buildings—Application of a Methodology for the Smart Readiness Indicator on a Theoretical Use Case in the City of Vienna. In Proceedings of the SBE 19 Malta Sustainable Built Environment; International Conference on Sustainability and Resilience, Valetta, Malta, 21–22 November; ISBN 978-99957-1-613-4 (ebook).
  56. Available online: https://www.wien.gv.at/flaechenwidmung/public/start.aspx (accessed on 13 April 2020).
  57. Google Maps. Available online: https://www.google.com/maps/place/Tivoligasse (accessed on 13 April 2020).
  58. Available online: http://episcope.eu/building-typology/tabula-webtool/ (accessed on 13 April 2020).
  59. OIB Austrian Institute of Construction Engineering. OIB Guideline 6, Energy Saving and Heat Insulation; OIB-330.6-026/19; Austrian Institute of Construction Engineering: Vienna, Austria, 2019. [Google Scholar]
  60. Garcia-Ayllon, S.; Miralles, J.L. New Strategies to Improve Governance in Territorial Management: Evolving from “Smart Cities” to “Smart Territories”. Procedia Eng. 2015, 118, 3–11. [Google Scholar] [CrossRef] [Green Version]
  61. Sharifi, A. A typology of smart city assessment tools and indicator sets. Sustain. Cities Soc. 2020, 53, 15. [Google Scholar] [CrossRef]
Figure 1. Methodology for resource and energy efficient design at district scale, author’s graphic adapted from [25].
Energies 13 03507 g001
Figure 2. Pinch-off characteristics relating to k.
Energies 13 03507 g002
Figure 3. Pinch-off characteristics relating to k with Activity Coefficient 1 (a) and Activity Coefficient 2 (b).
Energies 13 03507 g003
Figure 4. Assessment of the load shifting potential of the whole district.
Energies 13 03507 g004
Figure 5. Partial land use map of the City of Vienna with the selected district highlighted in red (a) and aerial view of the selected district (b) [56,57].
Energies 13 03507 g005
Figure 6. Smart Readiness Indicator for the individual buildings (SRIi) per district for the Base Case and Scenarios 1–4.
Energies 13 03507 g006
Figure 7. Smart Readiness Indicator District (SRIDist) for the Base Case and Scenarios 1–4.
Energies 13 03507 g007
Figure 8. Load Shifting Potential (LPDist) for the Base Case and Scenarios 1–4.
Energies 13 03507 g008
Figure 9. CO2 equivalent savings (CO2 Dist) for the Base Case and Scenarios 1–4.
Energies 13 03507 g009
Table 1. Description of energy related properties for base case and scenarios, extended from [55].
ScenarioNo. of BuildingsBuilding EnvelopeElectrical Storage/GridThermal Storage/GridGas Storage/Grid
Base Case9Un-refurbishedNo active storage; one directional connectionNo active storage; no thermal gridNo active storage; one directional connection
Scenario 19Improved by 50%Active storage bi-directional connectionNo active storage; one-directional connection (thermal grid)No connection
Scenario 29Improved by 90%Active storage bi-directional connectionActive storage bi-directional connection (thermal grid)No connection
Scenario 318Half of the district (9 buildings) as per Base Case/other half of the district (9 buildings) as per Scenario 1
Scenario 427One third of the district (9 buildings) as per Base Case/one third of the district (9 buildings) as per Scenario 1/one third of the district (9 buildings) as per Scenario 2

