1. Introduction
Before green-thinking era (we refer the last decades where governments, in general, are supporting the sustainability), energy consumption efficiency was not considered in terms of pollution and green behavior. The most relevant feature was the efficiency in terms of the ratio of the comfortability (temperature) to cost. Currently, the evidence of climate change, motivates governments to regulate the emissions to the atmosphere and pollution in general (earth, air, water). In the 90s, a relevant milestone was achieved: the low-energy building. Swedish and Danish governments published laws requesting that all new buildings required fulfilling the standard. Many of the equipment and devices needed to reduce energy consumption were already available in the market. Among others, we can highlight thick insulation, minimized thermal bridges, airtightness, insulated glazing and HVAC. Then, the passive house was born in May 1988. The impact of this announcement was different along with countries [
1,
2].
Buildings energy efficiency refers to achieving the same comfort and service with the lowest energy consumption. Higher efficiency contributes to the sustainability of smart cities given it reduces the energy cost and contributes to the reduction of emissions to the atmosphere. Achieving a high energy efficiency is the results of the combination of different factors, including construction materials, orientation, heating system, cooling system, surrounding area, etc. These goals are reached easily when they are considered in the design phase [
3]. Afterwards, increasing energy efficiency requires more efforts. Some examples to improve the efficiency are encouraging users to be friendly with the environment and do not waste energy, auditing the building to discover possible strategies, using more efficient appliances or equipment, avoid air flows, etc.
Since buildings, whether they are aimed at housing, factories, business, governmental, shopping or hospitals, are responsible for 40% of the global energy use, an effort is being made to design and develop more energy efficiency to reduce the overall maintenance costs of buildings. These settings automatically optimize the use of heating, cooling and lighting systems. The sensors can control the temperature and the light, for example, to lower the heating or turn off the lights according to the number of inhabitants. They can also detect smoke or water leaks and also warn of possible accidents before they occur.
Energy efficiency has become a quality indicator in ascending relevance which is being assumed as a competitiveness advantage for governmental/public services, business, sports, entertainment, industry and private activities. The improvement of energy efficiency requires the access to the various types of equipment, elements, devices, energy sources, metering, etc., as well as the interaction with the occupants of the facilities under assessment to obtain meaningful information of the environment, including external data sources such as weather monitoring stations and energy suppliers performance. Moreover, if we equip the smart building with intelligence capabilities by using artificial intelligence together with accurate building thermal modeling techniques and technologies, the smart building will be able to
learn from the performance and environmental parameters’ history, (which could be featured by new analytics techniques) while making decisions in real-time to achieve the highest energy efficiency [
4].
The environmental sustainability challenges have attracted in the last decades a huge research activity aimed at designing management systems for energy-efficient and smart buildings. To face such purpose, engineers and scientists base their designs on sets of a variety of sensors, to monitor how the energy is consumed at every facility and equipment of the building, and a smart system which collects and processes the available data to make the appropriate decision to reach the highest energy efficiency. In [
5], the authors propose the use of a linear regression-based system model to analyze the collected data of the energy consumption measured in two actual smart homes. To improve the results, the datasets considered in this approach include operational data from both smart homes. These data were collected as part of the
Smart project conducted by the authors.
The term Nearly zero-energy buildings (NZEB) refers to those showing very high energy performance, which is given by;
which is very low, nearly zero or equivalently the ratio self-produced-energy to overall-energy-consumption is very high, nearly one. Moreover, the low amount of energy which these buildings require is mostly produced from renewable sources [
6].
The generalized use of ICT and sensors (especially wireless sensors) makes their price drop, becoming affordable devices which were installed in buildings for monitoring both ambient and structural parameters. The rise of IoT devices has accelerated this process due to the development of several low-cost devices with wireless connectivity using a popular standard, and a certain data stage and data processing capabilities. All the data collected by the system can be processed and used by computing units to make decisions and, e.g., produce a better illumination of the room. Currently, the amount of datasets concerning different facts of the in-building life allows deriving value from their data using analytics to significantly outperform the energy efficiency of non-supervised buildings.
Smart buildings are composed of a set of communication technologies, sensors, actuators and computing devices, aimed at enabling different devices to communicate, share and exchange information, interact with the others, including external ones, and being managed, programmed, disabled, controlled and automated remotely [
7]. The total building energy consumption, including any energized system or device, has a remarkable impact on the environment at the world scale because of the CO
2 emissions to the atmosphere during the production process. Currently, there is a noticeable scientific activity in this field, and new technologies and techniques are being used to reduce the environmental impact by using the so-called green energies (suppliers of electrical energy generated by green sources: solar panels, wind generators, etc.) as well as energy harvesting, i.e., systems installed in the building to get energy independently of distribution-supplier companies. The systematic design and construction of smart buildings is needed to achieve the environmental compromises and sustainability objectives. Additionally, big data techniques are being used for several applications ranging in business, health, defense, communications, control prediction, forecast, etc., and are also applied in buildings to enhance the efficient use of resources.
The construction industry is already using smart technology to address the problem of energy efficiency. Buildings, whether homes, offices, factories, hospitals or other public and private spaces, are responsible for more than 40% of the global energy use and one-third of global greenhouse gas emissions, according to a report from the Program of the United Nations for the Environment (PUNE) in its Sustainable Buildings and Climate Initiative. The global focus on energy efficiency and the rapid growth of renewable energy sources and energy storage has important implications for the work of SEG 9 (Smart Home/Office Building Systems Especial Group. International Electrotechnical Commission). The latest technology materials and intelligent systems save energy, increase and improve the quality of the experience, whether at home, at work or in other buildings, such as hospitals or museums. For example, solar panels can meet the energy needs of a building, while systems that use sensors to control light, temperature and room occupancy allow automatic adjustments to optimize the use of heating, cooling and illumination systems.
Currently, renewable or green energies have a noticeable raising role in the definition of smart buildings and sustainability models. They provide the necessary energy independently of external sources. The most common situation is the existence of hybrid configurations where the main energy source comes from energy providers with a complementary renewable energy source, which is the energy contribution of buildings. Country to country, laws regulate the deployment and exploitation of green energies, and they constitute an obstacle to their installation. On the other hand, the installation costs are decreasing day by day as their use extends [
8,
9,
10,
11]. Smart buildings achieve their highest degree of precision when the resources available are used appropriately to obtain the lowest possible energy consumption and at the same time the maximum feeling of comfort for its occupants. The most important state-of-the-art properties in the field of smart buildings are based on the following key elements:
The hardware that hosts the required algorithms, and processes the acquired data to make decisions is made up of a high-performance computer.
The heart of the intelligent system is constituted by the set of data analysis and decision-making software tools, which can receive the data collected by the different sensors and measurement systems, as well as other relevant data from different sources of information, such as those coming from sensor networks of nearby buildings.
Among the different functionalities it has, the intelligent system must be able to analyze the data from the different sources of information, whether internal or external to the building, in order to make the most accurate decision possible.
Tools based on data analytics techniques are currently frequently used to obtain information from the collected data. These techniques can even determine trends so that they can anticipate certain events such as a sudden rise or fall in temperature outside the smart building. These tasks will be carried out more successfully the larger the amount of environmental data that can be obtained, e.g., by exchanging the collected data with nearby buildings.
Wireless sensor networks allow obtaining as much information as possible to form a set of data from the environment. For this, there are different types of environmental sensors available, aimed at energy management and building ventilation, heating and cooling systems. In other cases, it will be important that there is the possibility of measuring the levels of light intensity, i.e., the intensity of light, to adapt the lighting to the activity being carried out.
Measuring devices: To optimize energy efficiency, it is necessary to know which is the instantaneous energy consumption. However, to achieve a system as accurate as possible that is capable of managing the available energy in the most efficient way possible, it is necessary to have a history of the measurements that allows analyzing current and past measurements using the data analysis tools to make decisions and to know the current and expected consumption. Furthermore, these same actions can be extended to each of the equipment and devices to achieve the maximum possible granularity in energy management and provide the greatest possible comfort to the occupants of buildings, at the cost of an increase in price of system deployment.
The backbone of the system is the communications infrastructure. This system has a central role in smart buildings. They are the systems responsible for providing the adequate infrastructure to guarantee the flow of data between the different elements that are part of the intelligent building.
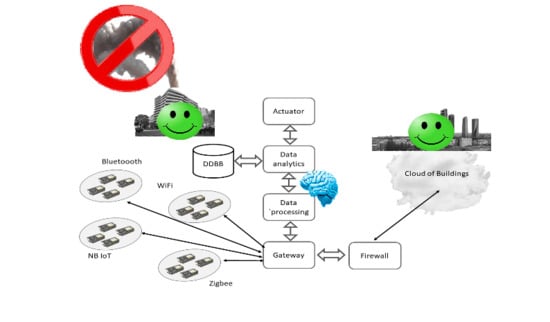
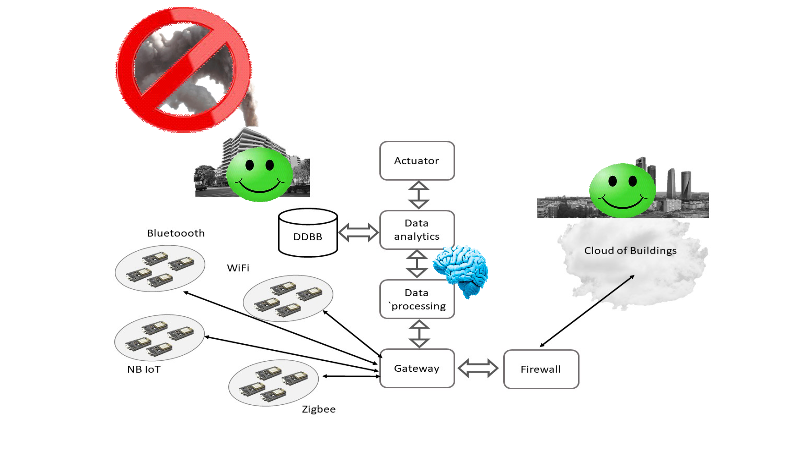
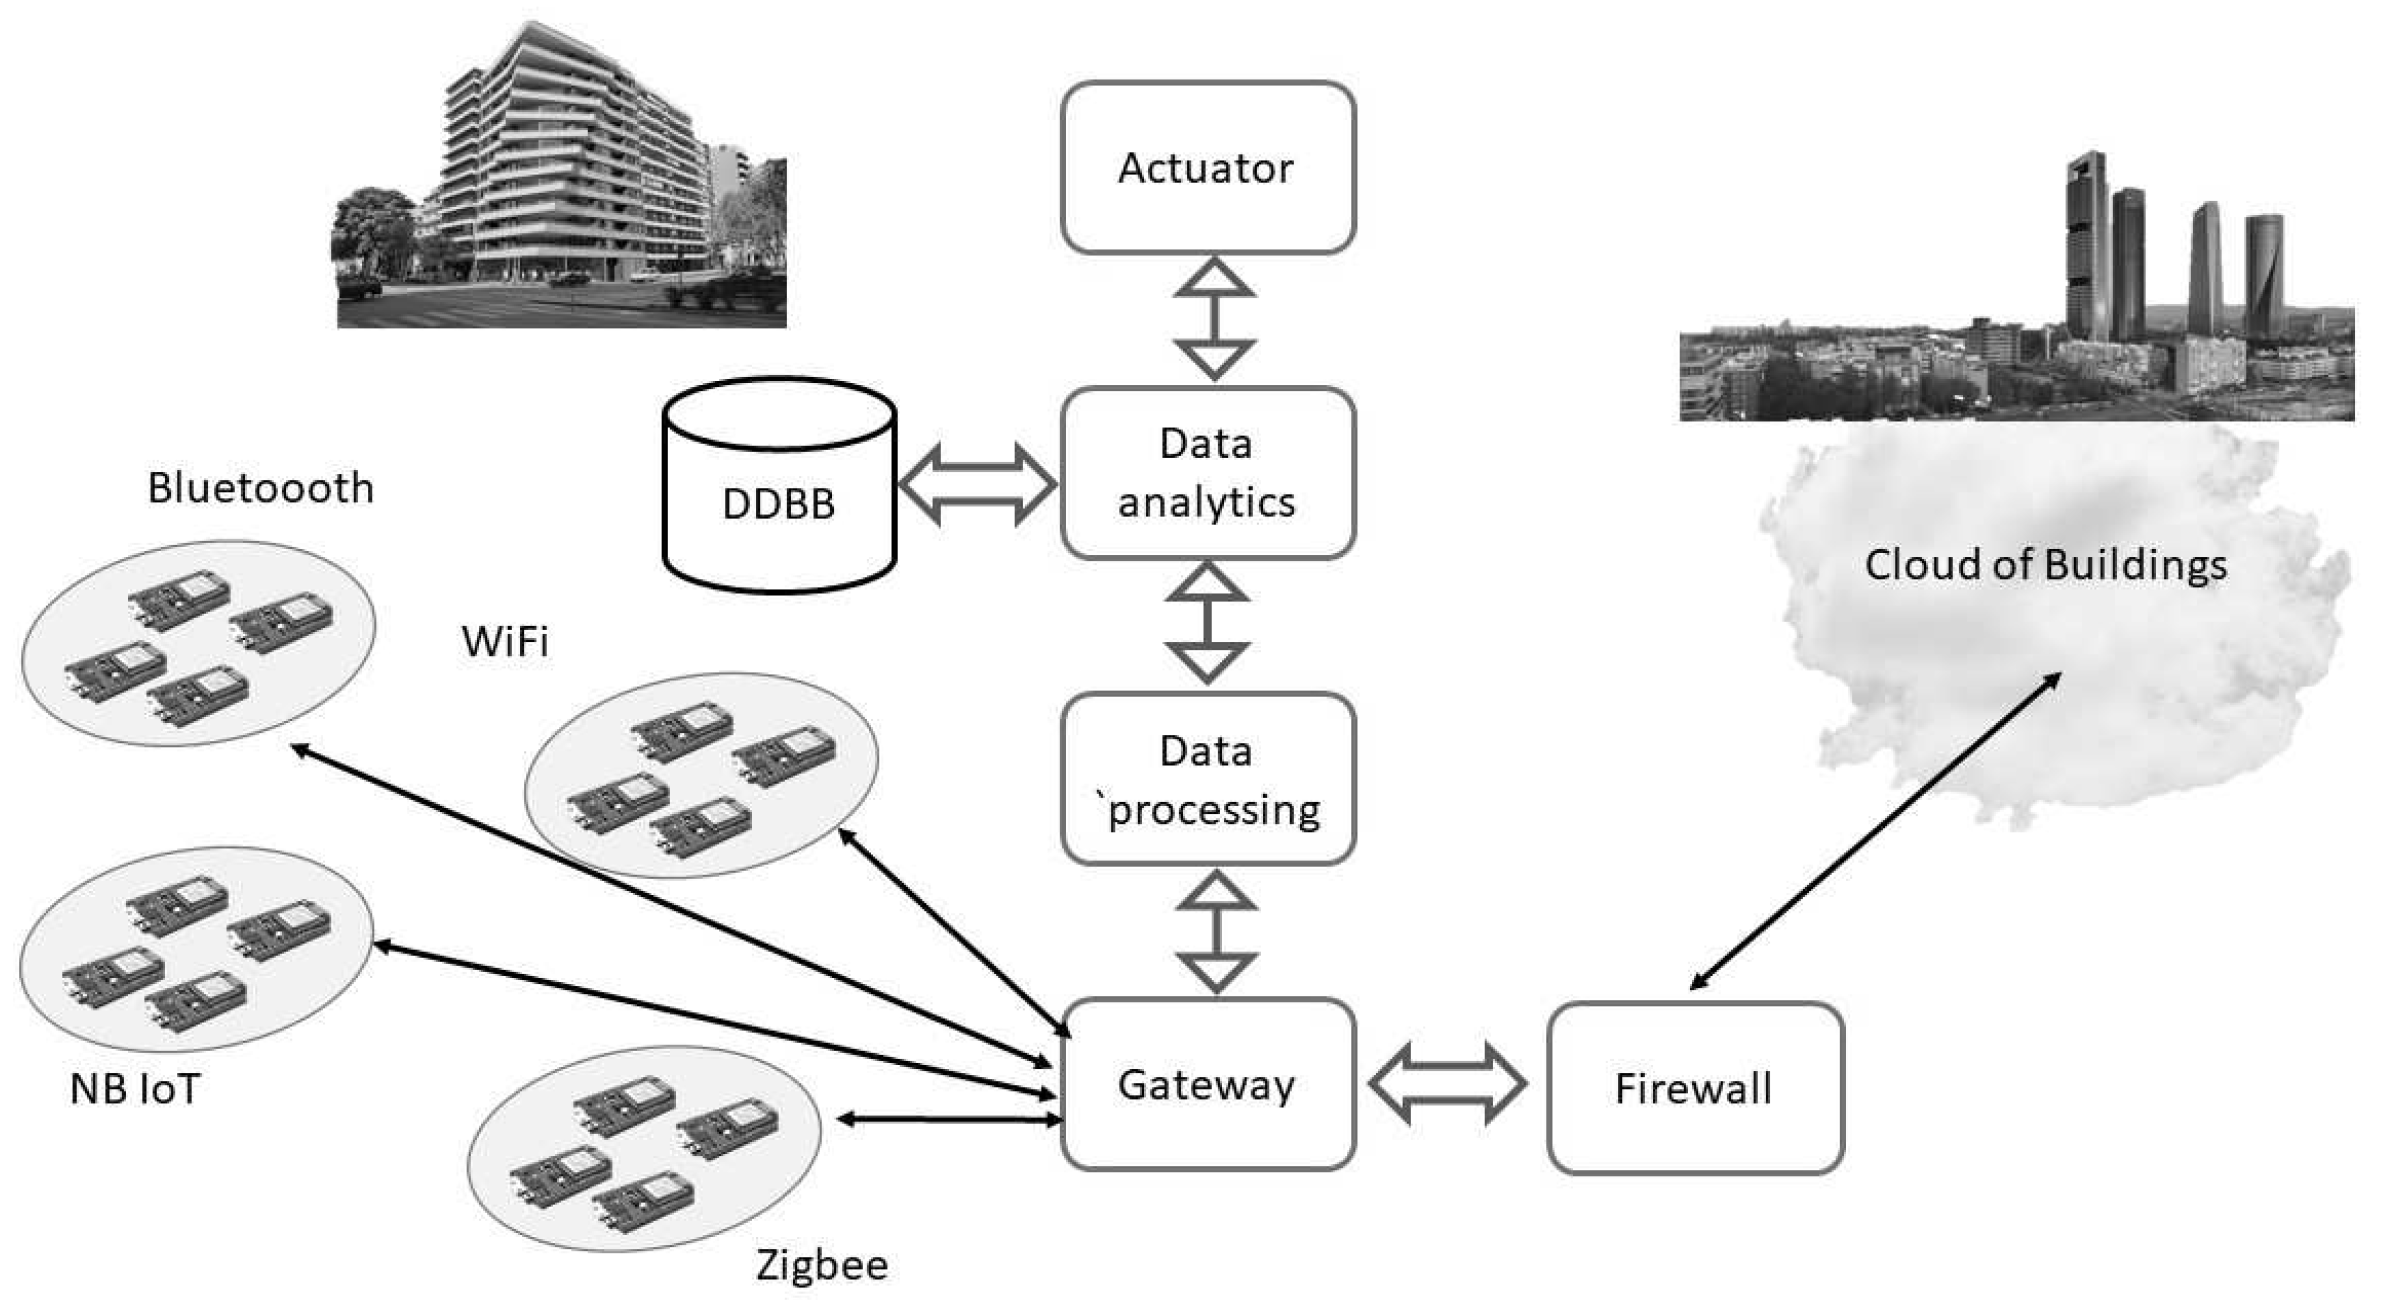
Figure 1 shows a potential scenario where the equipment and devices deployed in the smart building are depicted. It is common including databases to store different kinds of information, including backups, the sets of the collected data which could be used for different purposes: failure prediction, identification of facilities consuming more power, energy demand trends, etc. Sensing, metering devices and the actuator are connected to a gateway because the high probability of combined various communication standards. The firewall must provide the appropriate security.
In [
12], the authors propose a methodology to extract consumption patterns for electrical energy focusing on big data time series aimed at supporting managers and governments in making decisions. The methodology developed in their research is based on the identifications and features extraction of key indices for clustering technique. The collected datasets are the records of energy consumption in the period 2011–2017 for eight representative buildings of a public university. Additionally, based on the patterns found out, the authors propose some good practices aimed at the optimization of the energy. The accuracy is a major goal in the investigation shown in this paper, and additional factors are considered in the model, as will be described below.
Considerable scientific research activity is related to the reduction of energy consumption in the sector of residential buildings due to the socio-economical, technological and environmental impact given it constitutes the major energy consumption and it will noticeably contribute to sustainability. An approach to achieve a realistic and accurate building thermal model to support the construction of buildings, materials and energy sources selection, and to audit the energy consumption in buildings.
The main objective of thermal modeling of buildings is to provide support for the evidence of improvement in energy efficiency, more specifically, the questions to be solved are those related to determining which is the most appropriate building thermal model in the context of smart grids. Thermal building models are classified according to three categories. The first category is defined based on the physical and basic principles of white-box modeling. The second one shows a much simpler structure in the case of a statistical model. The black-box is used to make predictions of energy consumption as well as the demand for heating or cooling systems. Finally, the third category is a grey-box hybrid method based on the use of both physical and statistical modeling techniques. The authors propose a detailed review of the main thermal models of buildings. The comparison and the simulation results obtained by the authors demonstrate that it is more effective for managing energy consumption in buildings.
In this investigation introduced in [
13], the authors describe the development and implementation of a statistical machine learning environment. The objective of the research is to study the effect of and a set of input variables that have been identified by the authors as relevant for the characterization of energy efficiency in buildings. Specifically, these identifying parameters are the relative compaction, the surface of the walls, the surface of the roof, the total height of the building, the orientation, the glazed surface and its distribution. Two variables are identified as outputs of this system, such as the heating load (HM) and the cooling load (CL) of a residential building. The authors systematically investigate the relationship between each of the input variables and the output variables. The authors employ a variety of classical parametric and non-parametric statistical methods as analysis tools, to identify what are the closest relationships between input and output variables, as well as the correlation between input variables. Once this relationship was established, the authors used a classical linear regression method versus a powerful non-linear non-parametric method, random forests, to estimate the output parameters. They perform comprehensive simulations on 768 different residential buildings, demonstrating that they can predict what the output is with great precision (Ecotec 0.51 and 1.42, respectively). The results of this research support the feasibility of using machine learning techniques to simulate the parameters of the behavior of buildings as a convenient and accurate approximation as long as the collected data keeps the features of those which was used for training, the data used to enter the mathematical model is appropriate.
To improve the energy efficiency in buildings some investigations are addressing the energy storage problem. In some periods there is an excess of energy production which is wasted if it cannot be stored for future usage. As an example, a borehole thermal energy storage system aimed at cooling season is analyzed in [
14]. For system performance analysis and improvement, energy efficiencies of the overall BTES are investigated and determined to be a maximum of 62%.
In this framework the main contributions of our research are:
review of the literature in the topics concerning the research,
analysis of the regulations and directives leading to NZEB,
identification of the construction element most impacting on thermal efficiency,
introduction of some construction/location elements which impact the building thermal model,
introduction and demonstration of the capabilities of machine learning technique applied to monitor, manage and process the collected and existing dataset to operate with the heating and cooling intelligent management systems the measurement of the environmental indoor and outdoor parameters.
The remaining part of this paper is organized as follows. In
Section 2 the concept of energy efficiency in buildings is introduced and an overview of the classification of buildings based on their energy efficiency is drawn referring to the diversity of regulations in distinct countries. Then, in
Section 3 the basic concepts concerning the buildings thermal model are introduced. Although the basis is the same, there are several models which could be used.
Section 4 introduces the growing relevance of ICT to achieve sustainability goals. ICT is currently the way to get large and enough amounts of data, process them and prepare for their application to improve energy efficiency, among other purposes. Afterwards,
Section 5 introduces the main tool used in this investigation, i.e., machine learning techniques, which are within the broad area of artificial intelligence, AI. In
Section 6, the material used in this investigation, the methods and methodology developed in this work are describer, and the results of the investigation are introduced and discussed in
Section 7. Finally, the major contributions of the investigation are drawn in
Section 8, and future research lines are introduced.
2. Building Energy Efficiency
The energy efficiency of a building is calculated by measuring the energy consumed during a year under normal conditions of use and occupation, in terms of heating, domestic hot water, ventilation, lighting, etc. These data express final values of energy consumption, measured in kilowatt-hours per square meter () in kilograms of CO2 per square meter of housing (), that correspond to a letter on the used scale. In other words, to measure the energy efficiency of a building, the indicators of annual CO2 emissions and the annual consumption of non-renewable primary energy recorded by that dwelling are used (annual energy demand for heating, cooling, annual emissions, etc.).
2.1. Energy Classification of a Building
Based on the measurements taken in the building, an energy certificate will be issued that determines the energy rating of that home based on a letter, alphabetically ranging from A to G. An efficient home with an energy rating (A) consumes up to 90% less energy than one rated at the lowest level; class B up to 70%; and class C, 35%. A building with high energy rating saves more energy than one with a low rating, and this is achieved by combining a set of measures which operates to globally reduce the energy consumption of the building.
2.2. Regulations
There exists neither worldwide common regulations nor global agreements aimed at increasing energy efficiency. Even in Europe, there are some common recommendations which are finally interpreted by each EU member [
15]. Nevertheless, each country has its domestic laws and regulations, or recommendations in such direction. In general, energy codes seem to be a very cost-effective regulatory tool whose utility extends out of energy savings, as follows. The energy technical building codes describe the energy efficiency requirements to meet in the construction of new buildings or renovation of old ones. These requisites can be used on building envelope qualification, and/or equipments such as HVAC, lighting and water heating [
16].
The current requirements for energy efficiency in buildings are based on the Technical Building Code (CTE) approved by Royal Decree 314/2006, of 17 March (Last update in 20 December 2019); and specifically in the Basic Document of Energy Saving (DB-HE) in its updated version [
17]. Thus, the DB-HE establishes, in its scope of application, the fulfillment of some basic requirements to achieve the objective of energy saving consisting of rational use of the available energy, increasing the efficiency and reducing their consumption to sustainable limits and also ensuring that part of this consumption comes from renewable energy sources, as a consequence of the characteristics of your project, construction, use and maintenance:
HE 0: Limitation of energy consumption.
HE 1: Limitation of energy demand [
18].
HE 2: Performance of thermal installations [
18].
HE 3: Energy efficiency of lighting installations.
HE 4: Minimum solar contribution of sanitary hot water (ACS).
HE 5: Minimum photovoltaic contribution of electrical energy.
The DB-HE0 establishes the limit value for energy consumption of non-renewable primary energy
. In residential buildings, the Equation (
2) and
Table 1 are used, where
is the EP limit of non-renewable primary energy,
is the basic value,
and
is the surface area of the building.
Each country around the world has its laws and regulations. Even in Europe, there is not a common harmonization to achieve sustainability goals. Nevertheless, the EU Commission approved some directrices to encourage countries to design and implement their plans in convergence with the global policy [
19].
3. Buildings Thermal Modeling
Buildings thermal modeling is aimed at characterizing the thermal properties of buildings, including all the construction elements, their materials, junctions, etc. This characterization is mainly addressed to determine the energy efficiency of the building and get recommendations to improve efficiency and saving energy/money. In the stage before construction starts, the most energy-efficient material for each building room or the most appropriate HVAC system should be installed to improve the energy efficiency [
20]. The model must also take into consideration the regulations applicable to the concrete building. As described above, these regulations are in general different in each country. Nevertheless, the common trend is limiting the maximum consumption and decreasing progressively such limit. In addition, some modeling approaches are found in the bibliography and it is strongly recommended using the one which best fits the real framework.
In general, system modeling is a relevant step in the design and implementation aimed at mathematically characterizing the performance of the system-under-test whose result is a set of equations relating the stimulus or input parameters and the output parameter or response, e.g., turning on the HVAC system and observing the effect on room temperature and energy consumption, deciding the energy source, i.e., primary or renewable, closing/opening windows.
To design appropriate strategies to minimize energy consumption in buildings, it is important to understand the dynamics of energy production and loss. In the case an accurate thermal model of the building is required, the analysis of the different construction elements of the building must be carried out. Detailed information of the building facilities and construction, including the basement, the roof, outdoors walls, etc., will be collected by using different techniques and technologies, such as wireless sensor networks (WSN) to collect a variety of information by using motes distributed across the building which incorporates distinct sensors (temperature, humidity, light intensity, airflow, presence of people, etc.). Proper techniques should be employed to collect, process and deliver the information to central nodes to make decisions. Below, the growing demand for ICT in buildings to achieve the goal of sustainability is introduced, as well as new techniques which provide relevant information on the energy performance of the building, such as thermographic images.
3.1. Constructive Elements That Define the Thermal Model
When designing a building thermally, concepts of space types and construction elements are used. The model of the building is made up of different types of spaces connected to each other and to the external environment by means of closings, gaps and thermal bridges.
3.2. Building Thermal Model Approaches
In [
21], the authors introduce the result from their investigation aimed at building thermal simulation of office buildings which was conducted in Jakarta, Indonesia. The authors used a simulation and visualization tool to develop their investigation, specifically at building design and simulation (based dynamic thermal simulation engine) stages. The simulation results draw that a reduction about 43% in the annual energy consumption is feasible. Furthermore, in the case of renovated buildings, and using new office design, the optimization of building envelope and efficient usage of office equipment and HVAC system, and implementing intelligent lighting, by presence detection, will reduce the energy consumption by 25%. Additionally, the choice of the proper material will reduce the energy consumption, e.g., improving glazing material would potentially provide an additional saving of 30%.
In [
22], the authors introduce their research whose goal focused on the detailed review of bibliography on building thermal modeling. The authors compare the different features and real performance and the authors conclude that the models’ comparison and simulation results demonstrate that the grey-box approach seems to be the one which better fits the real building energy consumption.
In general terms, the energy consumption in a building is affected by several parameters. Given this scenario, it is very difficult making the right decision on the most proper strategy to improve energy efficiency without the support of simulation CAD.
In the study introduced in [
23], the investigation attempts to collect an office building energy consumption from a simulation set-up using a commercial software. Two common energy sources are considered in this study: electricity and natural gas. In order to validate the collected data of the consumed energy monthly records are taken with the highest simulation error (around 1.6%). The authors propose in their work three different approaches in order to manage the energy consumption:
replacement of old single glazed windows with new featured profile and low-emission double-glazed windows,
installing on the external wall a thermal insulating cover,
using external horizontal shading instead internal shade.
The authors, after a careful analysis of the results, conclude that the implementation of the described strategies leads to the savings remarked in
Table 2. In order to check the validity of the drawn conclusion, the authors repeated the experiment one year after by replacing the installed windows by other with higher quality (low-emission double-glazed) and measuring the actual energy consumption. Then, they compared with the results of the simulation, and the results matched properly.
In [
24], the authors focus their investigation on the factors influence on building energy efficiency by developing a parametric analysis of both external and internal elements by using non-linear multivariate regression models. The external factors considered by the authors are such as outdoor temperature, direction and speed of wind, the influence of building surfaces solar orientation on heat gains. The indoor indicators which were considered in the work include: heating load, number of levels, air exchange rate, etc. The authors created a room dynamic simulation model using EnergyPlus software. The general structure of the multivariate non-linear regression model for inside air temperature determination is evaluated and selected. The impact of selected influencing factor is analyzed and the corresponding constant coefficients are obtained. Afterwards, the authors verify the non-linear regression model by analyzing simulation data. The authors determine the performance of the model by comparing to corrected determination coefficient (
) and Fisher’s criterion (
), which indicates the high agreement of the proposed multivariate non-linear regression model. The authors conclude that the approach used to generate the regression model can be used for other architectural and thermal properties of building envelope.
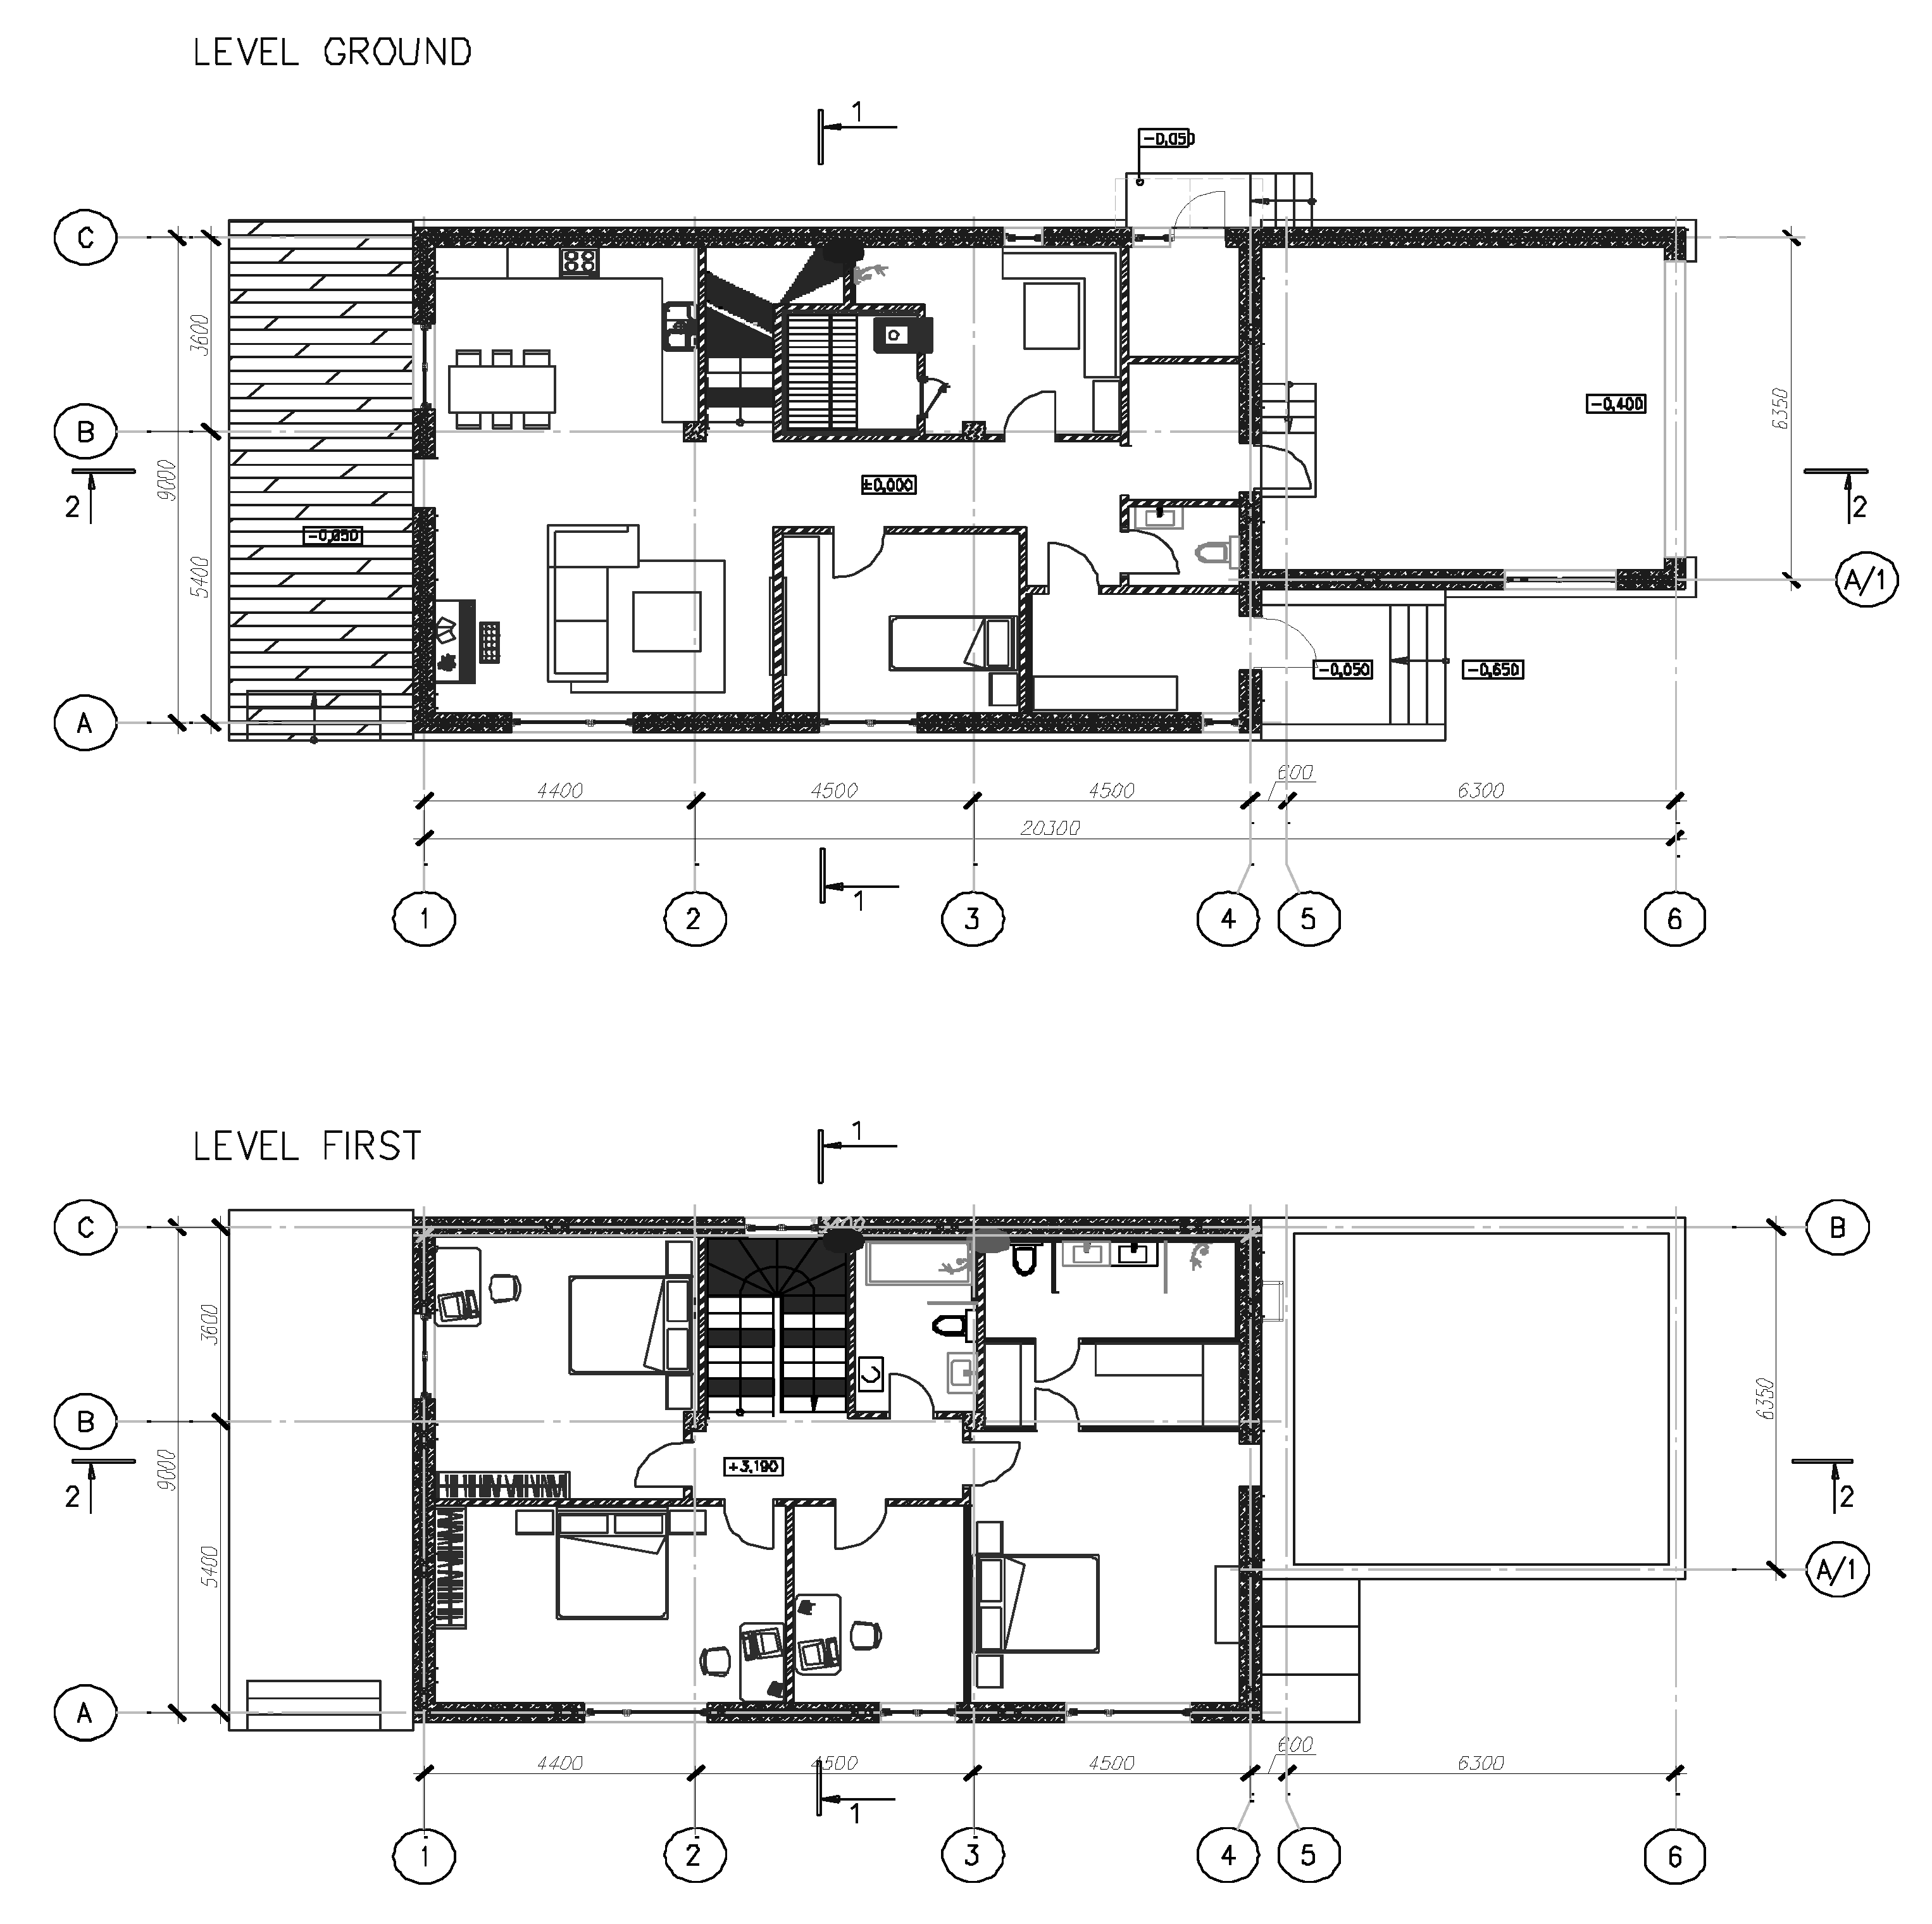
Figure 2 shows a typical single-family building which are becoming very popular in residential areas. The house consists of two floors connected by a stair. These details are relevant due to the potential creation of down-to-up air-flow, specially when under ceiling areas are rehabilitated. These houses appear in different dispositions where the most common is a multi-family land with one or two rows of sided single-family houses. In this case, houses do not have windows in two laterals in general. In other cases, houses are arranged as sided pairs. In our investigation, we searched for data basis corresponding to houses with similar disposition.
In this investigation, other external factors are considered as potential influencers on the building thermal model. Among the factors that are taken into account, and which may have the greatest impact on the thermal model of the building, we find the proximity to other dwellings or buildings, the height compared to seeing surrounding buildings or topography of the land (including vegetation), the proximity of asphalt areas, the proximity of wet areas (rivers, lakes) or areas with abundant and lush vegetation. Some of these elements can constitute natural or artificial barriers that cause the temperature of the building to change compared to others that do not have those barriers around them.
As for the elements of the construction itself, all the mobile elements are considered, such as the windows and doors accessing the home, whose tightness will have a great influence on the thermal model of the building. Likewise, other elements such as the existence of awnings, blackout blinds, etc. will be taken into account.
Currently, a building with very similar characteristics and disposition to that shown in
Figure 2 has been monitored since 6 months ago through a wireless sensor network composed of ZigBee motes which include a set of sensors: temperature, humidity, light intensity. In addition, other types of sensors and actuators have been installed, in particular, presence detectors to avoid forgetting lights switched on. Other sensors have also been installed to detect air flows and to adequately manage heating and cooling systems.
4. The Role of ICT in Smart Buildings
The reduction of energy consumption can be achieved through different strategies which are applied simultaneously to get the best performance. On the one hand, from the point of view of the building construction, we should choose those materials whose thermal behavior is more appropriate, i.e., conserving during the winter time the internal temperature of the building at a temperature that provides suitable comfort to occupants and, on the other hand, isolating in the summer from external heat. The reduction of energy consumption or, equivalently, the increase in energy efficiency, can be achieved by choosing those materials and construction elements that have the best possible thermal performance. A typical case are glass windows, which usually produce large energy losses showing a low performance. However, materials are in continuous evolution, the glass and the frame of the window as well. The thermal insulation of both the glass and the frame must be guaranteed, as well as a closure with the proper sealing so that no drafts are produced.
Information and communication technologies have a very important role in achieving the energy efficiency objectives of buildings.
In the data collection phase they are essential, so that sensors of different types can be installed in order to measure environmental parameters both inside and outside the buildings. Outdoors, more or less extensive areas can be covered depending on the precision of the environmental parameters that the Internet wants due to the size of the area considered to be included in the energy efficiency of the building.
Since the data rate you can handle with these devices is low, low-cost technologies and standards can be used.
Table 3 draws the comparative description of the most extended wireless communications standards for sensor networks where the principal features included are: Tx/Rx frequency band, the maximum transmit data rate, the maximum range to establish a reliable connection, the energy efficiency and deployment cost. The energy efficiency of the devices is a key parameter given in many applications they are powered by batteries, and they must guarantee a long operation time to reduce maintenance costs. Even in the case where they are powered from the supplied electricity, it must be energetically efficient in order for the smart building to keep being efficient [
25].
Two different sensor networks have been used in our research. In the case of the average of internal parameters of the building, Zigbee specks have been used, appropriate for the distances and area to be covered (the interior of the building). To cover the areas outside the buildings, another standard with greater reach has been used, such as LoRa. A simple get away provides the interconnection service of these networks to the Internet to collect all the data in a single database on a cloud server.
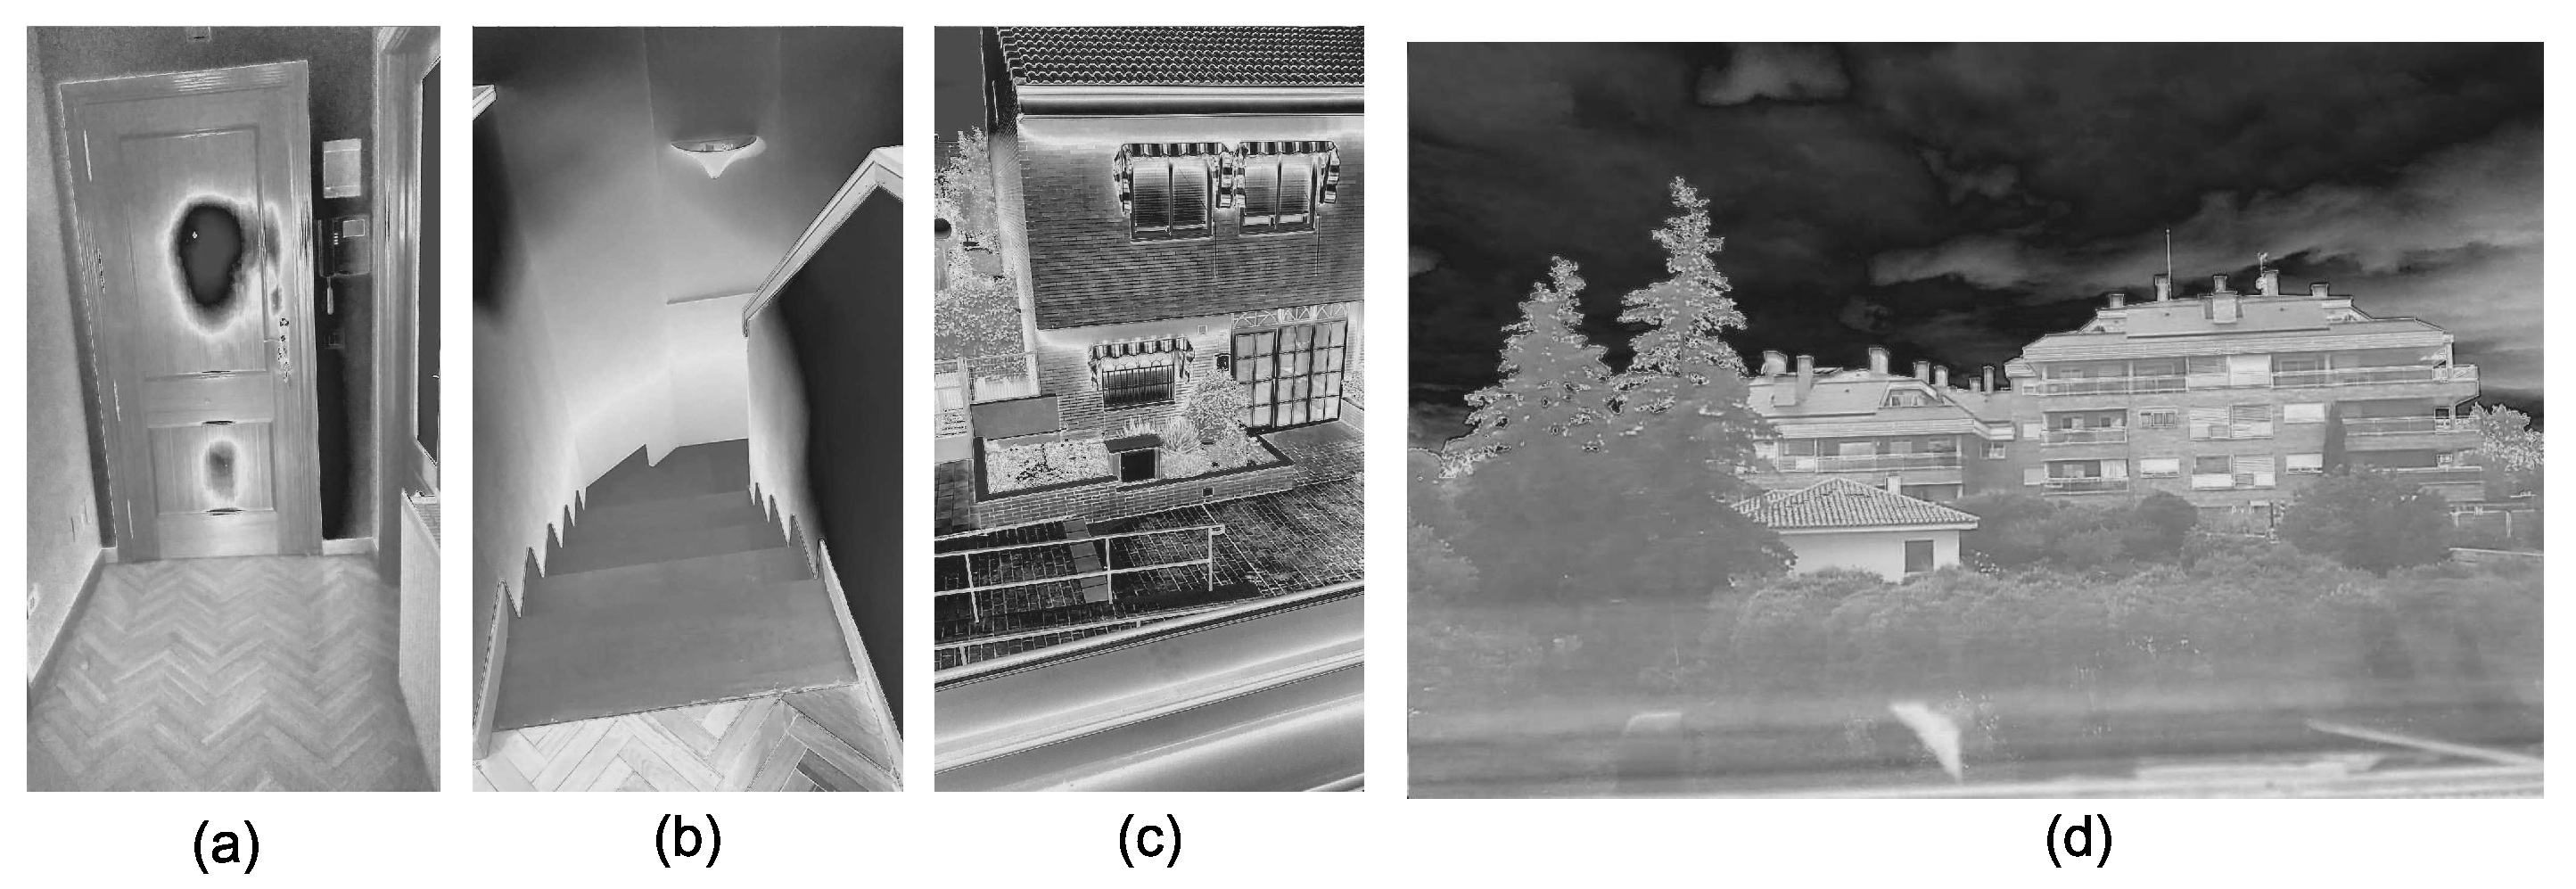
Another important source of information during fieldwork is the identification of construction elements of the building that could be the responsible for the energy efficiency drop by using thermal imaging cameras. These cameras can be used to perform internal/external inspection of the building, and its surroundings to identify elements which could impact the energy efficiency, and the internal construction elements, as those which allow acceding the building, e.g., main entrance door, garden door, garage access door.
Figure 3 shows thermographic images of a residential area single-family building, similar to that shown in
Figure 2, representing the main entrance door (a), the stairs connecting the ground level tp the first one (b), the main entrance wall (c) and the surrounding area (d). Considering
Figure 3a, corresponding to the internal part of the door to access the house, a significant temperature difference impairment is remarked, revealing air flow which contributes to decreasing the energy efficiency. In the figure, it is observed how the slit with the door closed shows a remarkable different color/tone due to the temperature difference because of the air flow. Additionally, based on thermographic pictures, the performance of windows/doors (hermetic featuring), surrounding area (other buildings, roads, vegetation), roof, etc. can be observed and analyzed to improve the accuracy of the building thermal model.
Additional strategies to improve the model accuracy by using the ICT is considering the variety of DDBB available with weather and environment information.
5. Artificial Intelligence: Machine Learning
Artificial intelligence (AI) and machine learning (ML) are under the attention of scientists and the industry because various reasons, where the most relevant are the capability to solve complex issues in a short time, and the capability of managing large amounts of data efficiently. A given problem can be complex and with lots of data to process. Facing the problem as a whole can be cumbersome. In this case, it is recommended scaling the building model to be more efficient.
Artificial intelligence is continuously expanding, spreading its influence and applicability to several fields faster than predicted. Currently, artificial intelligence is applied in a variety of fields, e.g., industrial sector, agriculture, education, smart grids, smart cities, smart buildings, etc.
The research introduced in this investigation presents the benefits of the application of machine learning techniques on smart buildings. Specifically, it shows the verification of building energy models. This assessment is carried out in order to verify their energy efficiency and, based on the models obtains an accurate prediction of a building before construction. It is an aspect that is topical today because it contributes to sustainability of smart cities and beyond.
Currently, the industry and scientists are investing a lot of efforts in developing and deploying artificial intelligence based solutions. Due to this evolution and the need for more efficient tools for developing new models, there are significant and growing branches in the development of tools aimed at creating GUI or automatic production of the model, saving many and shortening the time to market.
6. Materials and Methods
In this section, we describe the methodology and the main material used in this investigation.
6.1. Building Thermal Model Parameters and Features
One of the first tasks required to successfully develop the project is building an appropriate dataset according to the addressed goals. To produce such proper dataset, we need to identify which would be the parameters which can be taken under consideration to achieve the highest accuracy. One of the goals of the investigation is introducing new parameters and analyzing their impact on energy efficiency.
Table 4 shows the constructive elements that define the thermal model of a building. The scope of this investigation is not so detailed. Furthermore, in the review of datasets concerning buildings, such detailed information was not found.
Table 5 shows the characteristics of the enclosures, partitions and gaps. The insulation values of the construction elements will be collected in the execution project. These values will be calculated following the instructions of DA DB-HE/1 [
18].
6.2. Developing an ML Thermal Building Model
The task concerning developing an ML model is complex but it can produce multiple benefits. A major issue impacting the final result is identifying the problem to be solved, in this case, increasing the energy efficiency of buildings and predicting its level based on various parameters concerning building construction: type of building, construction materials, orientation, etc.
Developing a thermal model of the building using machine learning techniques involves a series of steps. The success of the model will depend on the work carried out in the putative steps that are summarized below, highlighting the most important aspects to consider. The definition of the problem description is the achievement of the objective with the maximum precision possible. Here, it is about the conception of the problem to be solved. In this particular problem, a large amount of information has been consulted, since there is a wide diversity at the global level of the regulations of each country, although the trend is clear in the same direction, i.e., the most restrictive aspects leading to sustainability through increased energy efficiency, and finally achieve the so-called nearby zero-energy buildings. This horizon results in the convergence process towards the zero emissions target.
After analyzing many documents concerning the norms and regulations in a number of countries, it was decided to use the Spanish one (the Technical Building Code) as a reference, in terms of their spirit they do not differ much from others, and these differences are rather limits of consumption with a tendency to convergence, given the economic dynamics of each country. Even in the European Union there is not a single regulation and each country presents to the Commission its plan to increase energy efficiency and reduce emissions to the atmosphere.
Next, we must pay special attention to the dataset to be used in the problem. Most of the responsibility of the accuracy of the model relies on the amount and quality of the collected dataset. Shortcuts in this task will lead to non-precise solutions which are not useful at all. Data acquisition must be appropriately planned to prepare appropriate training and the final goal verification datasets. The dataset acquisition is cumbersome, especially when the deployment of sensor networks results in high cost.
Table 6 list the parameters considered in the investigation. The first division separates stimulus from responses, and the inputs are grouped by the corresponding element.
An alternative, which has been chosen in our case for the investigation, is using information from datasets which were collected by other people. In this investigation, nearly 100 dataset sources were analyzed in order to determine their usability. The problem is to find out that, or those, which contains the required to solve the problem drawn.
Table 7 shows the most relevant sources of datasets.
Data acquisition process produces raw data which could be corrupted or disturbed by different sources causing inaccuracies on the collected data. Hence, the next step in the investigation was data preparation where raw data are preprocessed to produce a clean dataset containing meaningful information, specially when fostering data coming from different sources. For example, the use of common metrics for data coming from different sources, and do not mix Fahrenheit with Celsius, just decide which to use.
Sometimes, a simple visual inspection could attract our attention due to values unexpected, or finding text in a field where a number is expected.
Afterwards, taking into consideration the final goal, it is necessary to analyze the data to identify the features which characterize and influence the model under development. Usually, data preprocessing is the most time-consuming task to achieve an accurate model.
Based on the purpose and the available data, an appropriate algorithm must be pointed out. This task takes also time because there is already a large collection of machine learning algorithms and continuously new ones are developed by data science researcher. The selection of the algorithm is performed according to the ML problem. Then, the model validation is a must in order to guarantee the accuracy of the solution, i.e., the precision of the prediction it will produce for new datasets.
The strategy followed by the research group was taking advantage of the scalability of the problem, i.e., considering in the first stages a reduced number of parameters with two goals. The first one, is a practical point of view, starting with a simple system, with few variables to better follow-up the research success. Second, this strategy allows to identify potential problem and the individual impact of the considered elements.
7. Results and Discussion
In this section, we introduce the main and more meaningful results. As introduced in
Section 6, we propose a methodology where the analysis of the results is incremental and considers the scalability of the machine learning techniques, i.e., we can use a shorter or larger dataset including less or more parameters. In addition, some parameters are more impacting than others on energy savings. In summary, we develop a methodology which allows introducing new parameters in the model to evaluate their relevance and decide whether to use or withdraw it.
Here, we introduce some results and properties of the datasets used to provide a comprehensive knowledge of the problem and identify the parameter features which most influence the performance of the algorithms considered in this investigation. We take into account three approaches, where the meaning of “approach” concerns the number of parameters considered and the class of parameters. Following this idea, the first approach is the one which takes into account a bulk of parameters. The second approach is where a reduced number of parameters is considered, but without a detailed analysis of their properties. Finally, in the third approach, we analyze the properties of the parameters using data analytics techniques to choose those with higher entropy regarding the problem to solve: buildings classification in terms of energy efficiency. The aim is reducing the computational load for this task and using lower weight DDBB. This is one of the contributions of this work. Afterwards, if further refinement, i.e., higher accuracy, is required, it is feasible to add further meaningful parameters.
In this research, we use histograms and distribution intervals of parameters’ values to identify whether they are impacting in the classification problem. If the histogram of a given parameter concentrates on a certain value in a narrow distribution, it does not provide relevant information concerning most of the classification groups. A given parameter would be useful when it provides a minimum number of elements in each classification group; otherwise, they can be skipped.
In addition, we consider the scatterplot appropriate tools to determine the relationship and dependency between parameters. This analysis permits identifying, on one hand, the correlation between parameters and outputs, i.e., the most impacting parameters are strongly correlated to the outputs. On the other hand, the scatterplot allows identifying parameters which are strongly correlated which could reduce the number of required parameters to carry out the classification.
The results of the three approaches are drawn for six different classification algorithms. The results summary provide information concerning the accuracy of the classification algorithm for the different categories as well as other quality indicators, e.g., the popular F1-score, which is calculated as follows
where the
precision is defined as:
and
recall, sometimes named sensitivity, concerns the ability of the algorithm to correctly identify positive results to achieve the true positive rate, and it is calculated as follows:
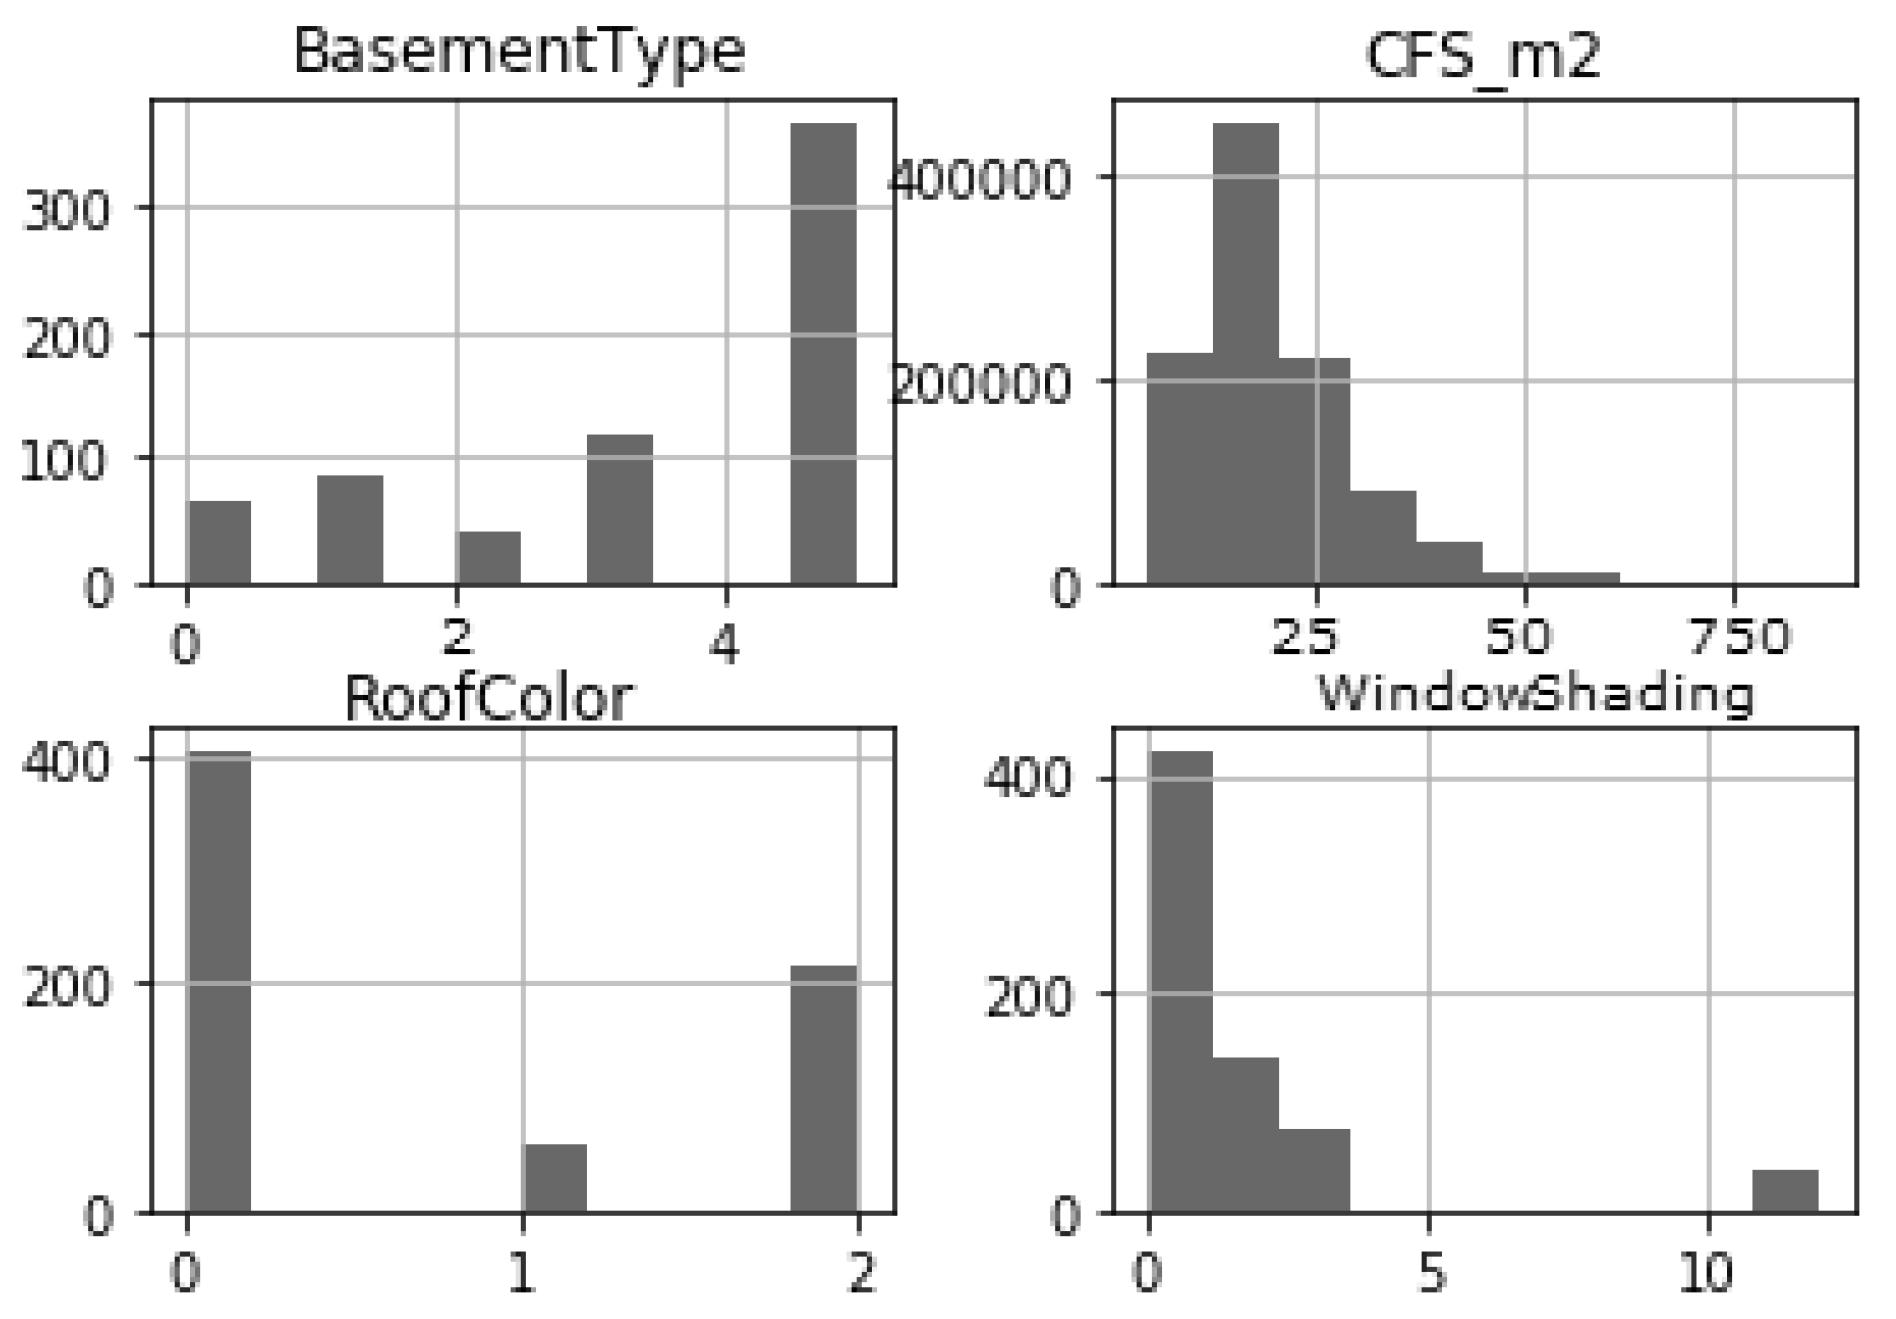
Figure 4 shows the histogram of some parameters for the first approach, which is required to detect impairments in the collected data, wrong records which can disturb the analysis and conduct to unexpected conclusions, etc. This methodology also gives us an overall view to predict the result. The histogram of the following parameters are presented here:
Basement type (BasementType) which concerns the quality and living preparation of the home basement (top left).
Surface of the building (CFD_m2, in square meters). Usually, larger surfaces require more energy for heating/cooling them (top right).
Color of the roof (RoofColor), where just three possibilities are allowed: fair, dark or medium (bottom left). Darker colors tend to absorb the solar radiations, contributing during winter to save some energy.
Windows shading (WindowsShading, bottom right), which during the summer contributes to reducing the energy consumption by keeping solar radiations.
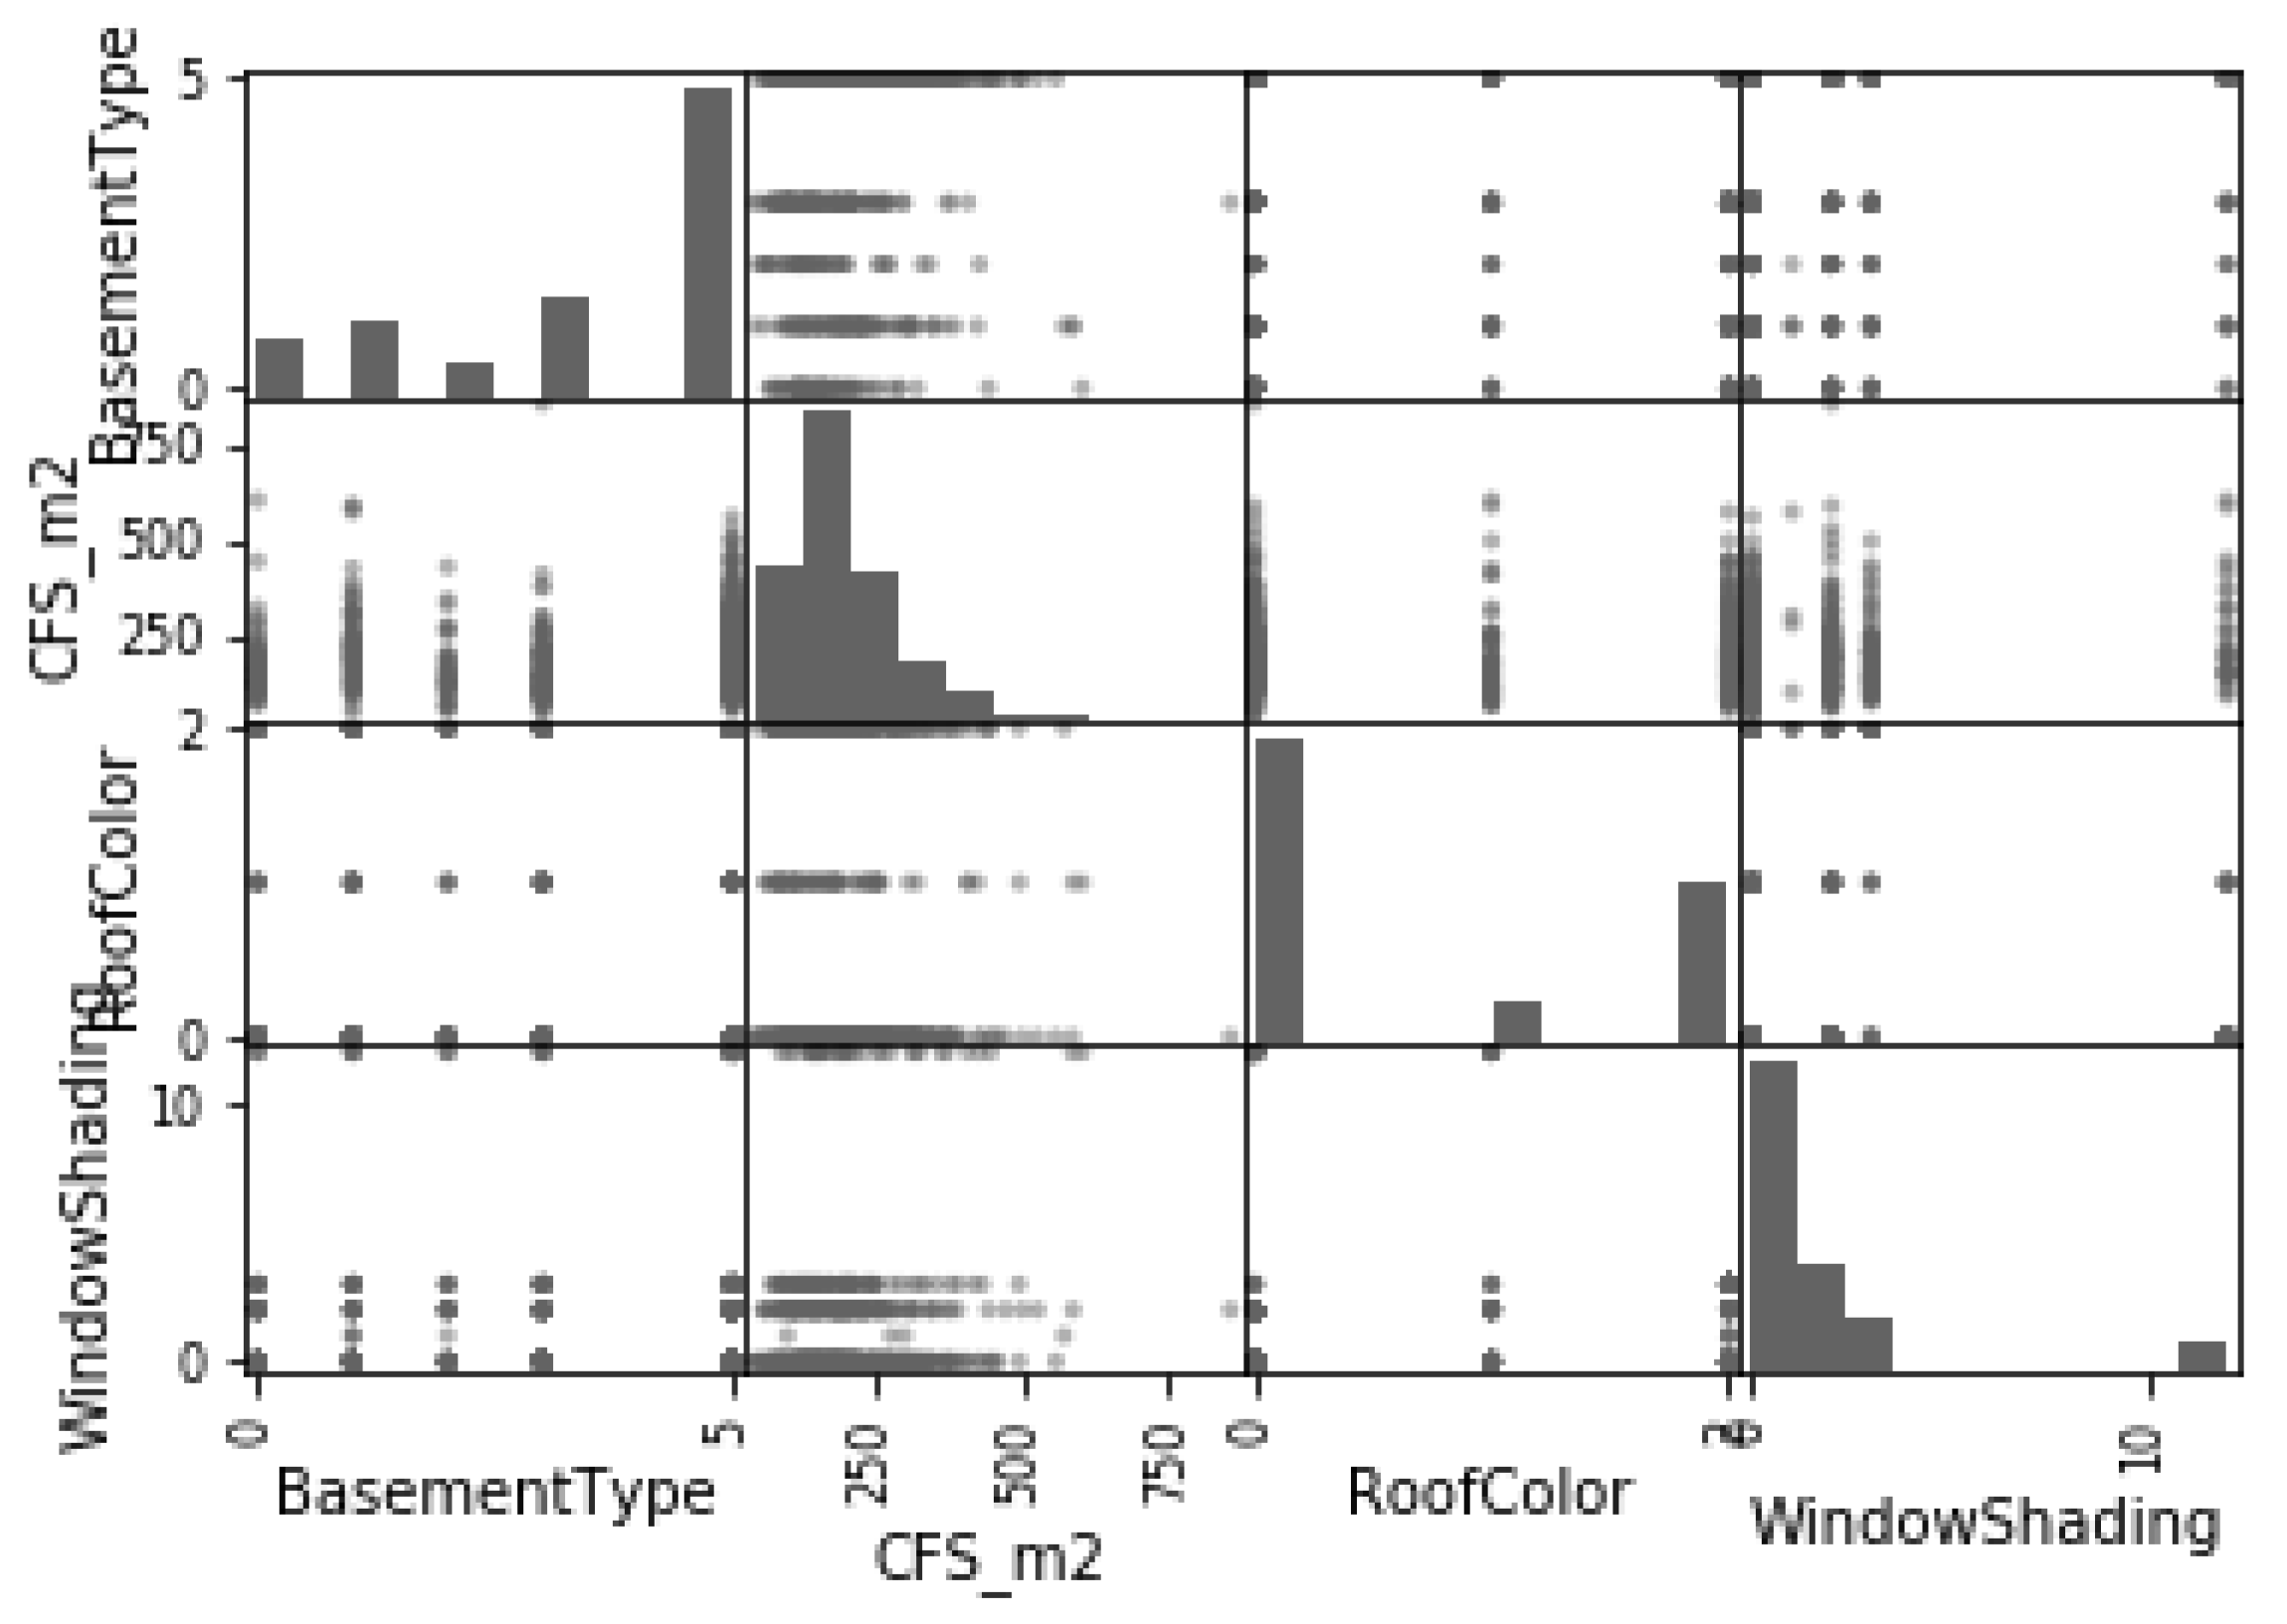
Figure 5 depicts the scatter-plot representation of some parameters considered in the first approach. Here, we can observe the relation between some of the parameters considered in this case. In this way, we can point out how strong is the correlation and it guides to make the decision on the most appropriate dataset.
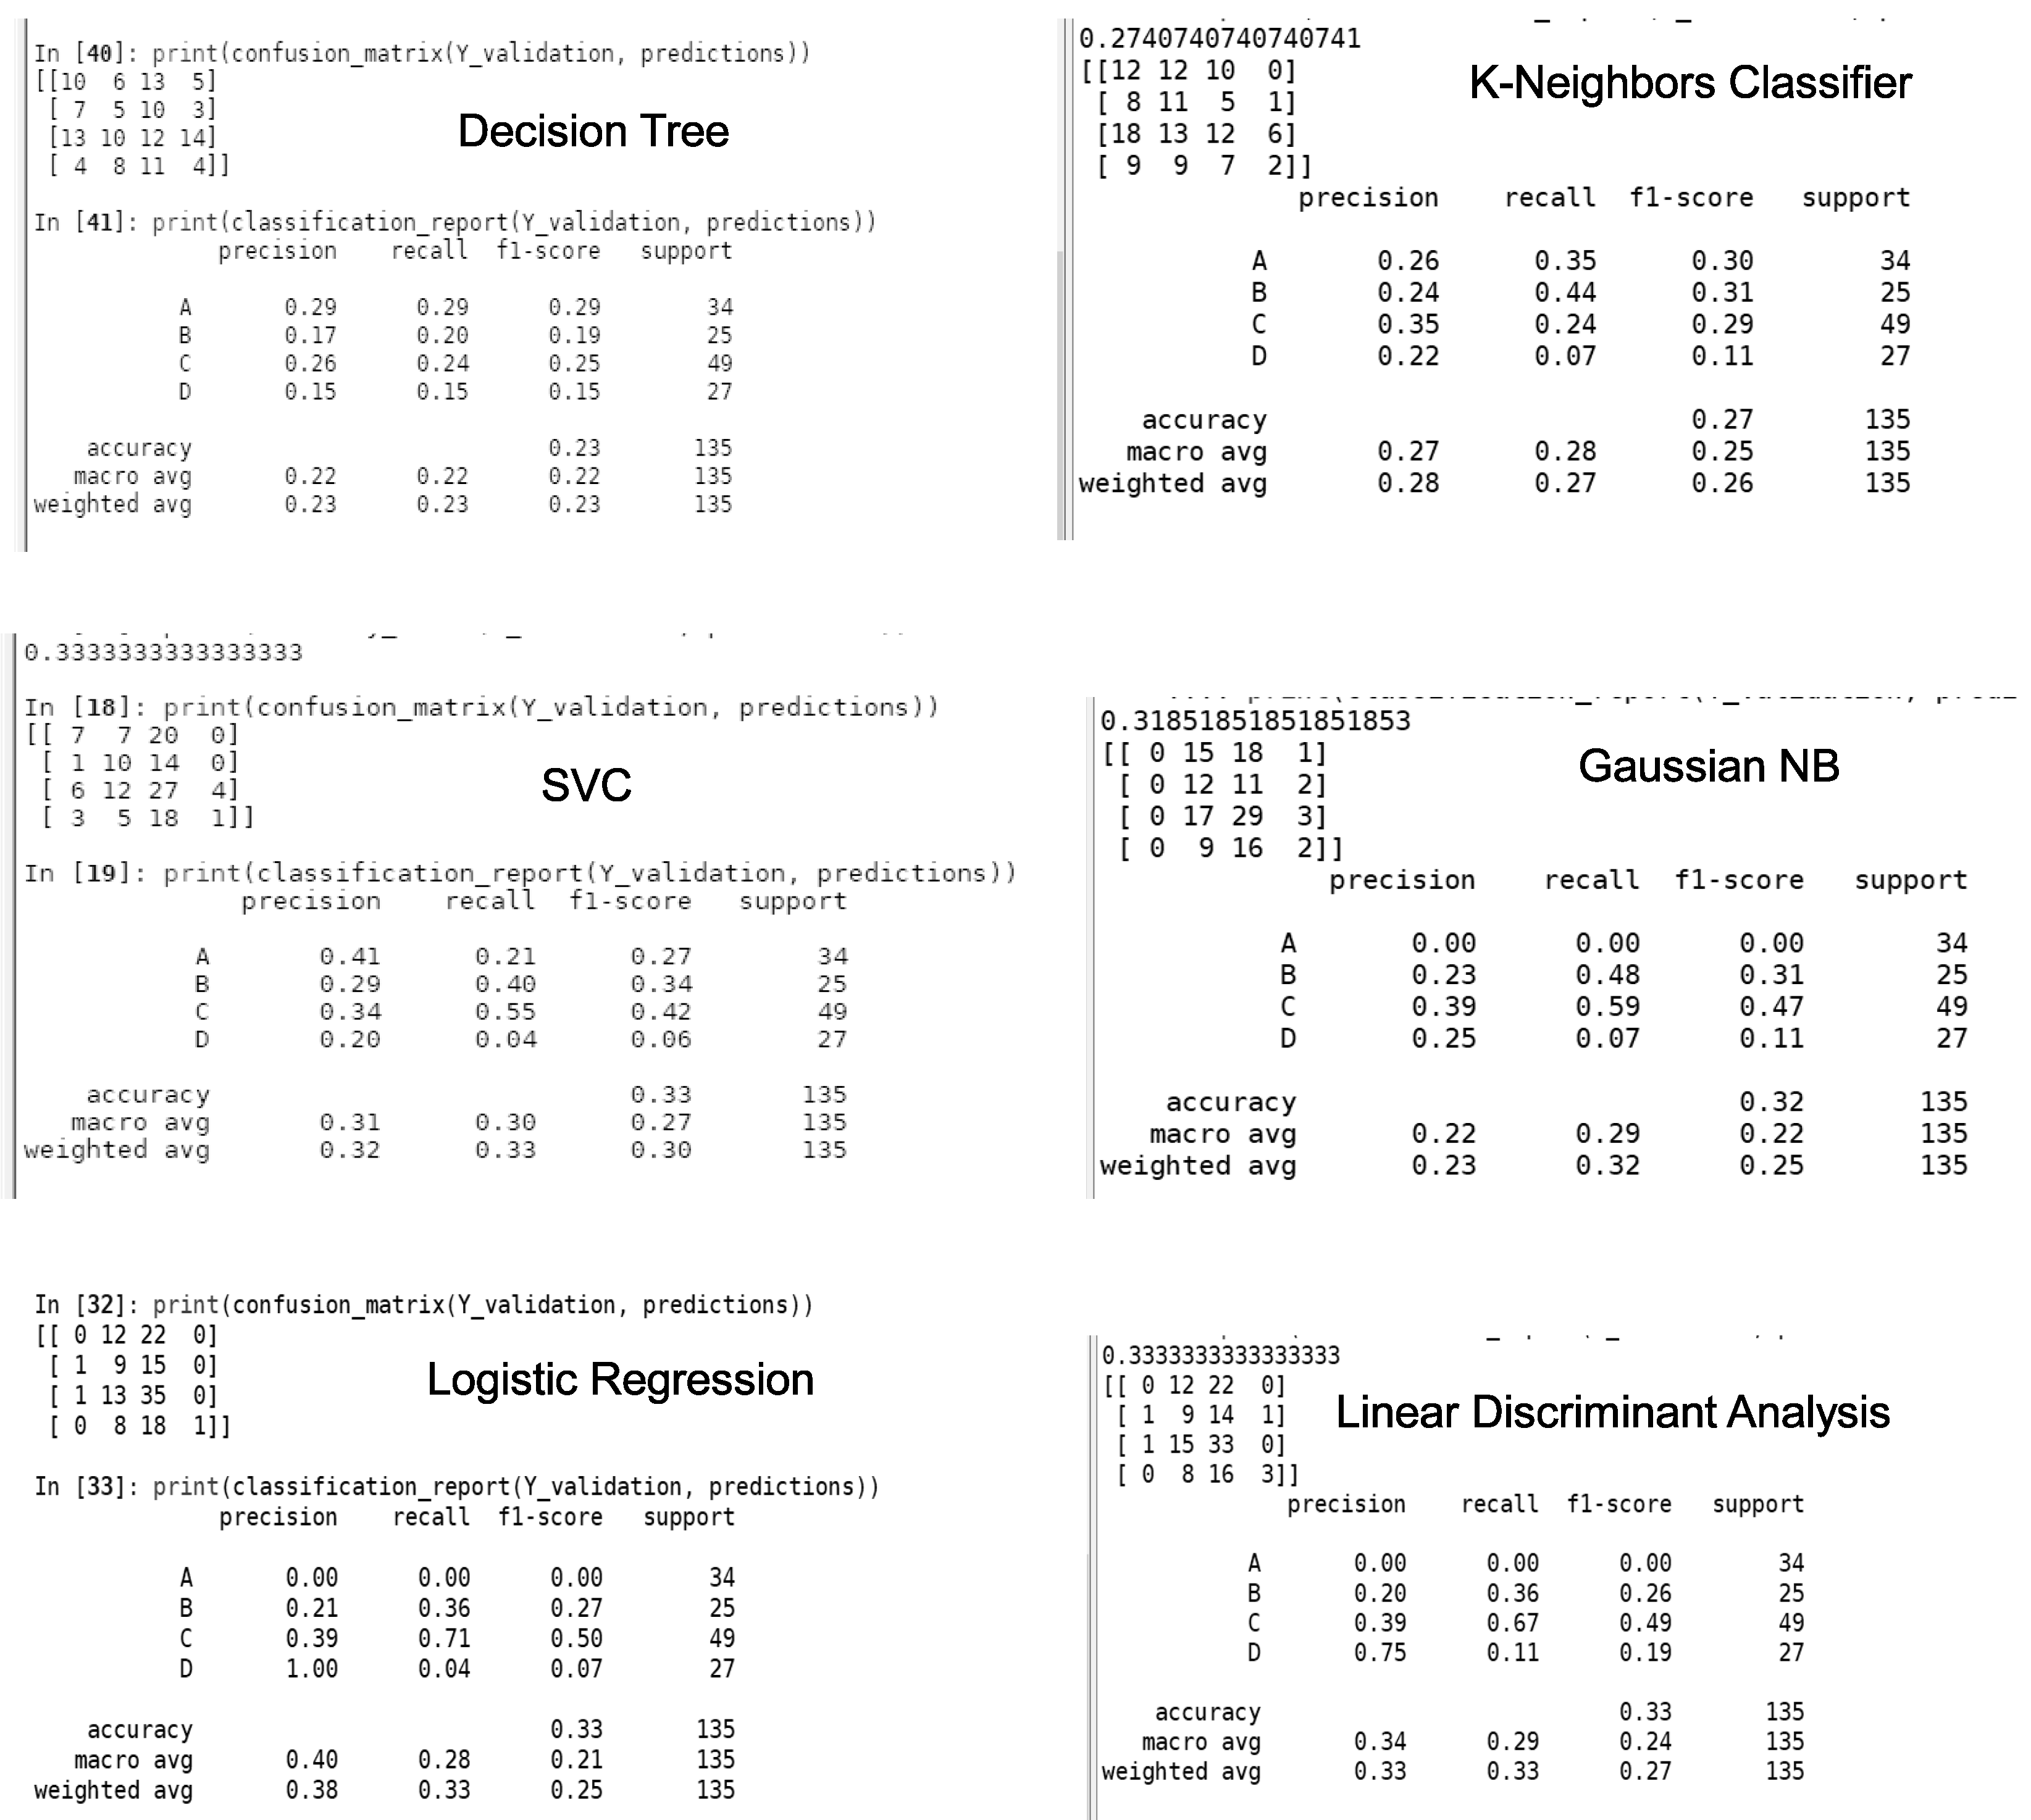
Figure 6 shows the performance of the different algorithms which are to perform the classification considered in the first approach. The results obtained are not satisfactory. Actually, the results are very unsatisfactory since after analyzing the results of the different records, it is deduced that in the best case the success rate is about 30%, it can be considered neither satisfactory nor representative of a reliable algorithm.
To find out a more reliable solution, we plan to review the methodology followed above to identify weaknesses and improve results. In order to find a more appropriate and reliable solution, a comprehensive analysis of the database is carried out, before developing the algorithm, to identify relationships between parameters and those directly related to energy efficiency. The database is analyzed again focusing on a specific dataset for which we perform a detailed analysis of the internal in the database where we find the parameters which are more relevant to the classification.
In the second approach, the parameters of the complete dataset have been analyzed again. The analysis in detail allows pointing out the noisy parameters, mismatches and potential wrong records. At the end of this review, the dataset parameters which seem to show a meaningless effect (or neglectable) are removed to avoid disturbing the algorithms’ performance. Finally, we identify those parameters that are the most relevant to the classification problem. The set of four parameters considered to implement the ML-based classifier algorithms is composed of:
the annual energy expenditure (P04),
the surface of the dwelling (P03),
the age of the dwelling (P02) and
the climate region where it is located (P01).
One of the most relevant results to be considered in future developments is that an exhaustive data collection, in terms of the number of parameters, is not needed to take into account to determine the energy efficiency level of the building. It is necessary to be experienced and smart to choose the most significant dataset.
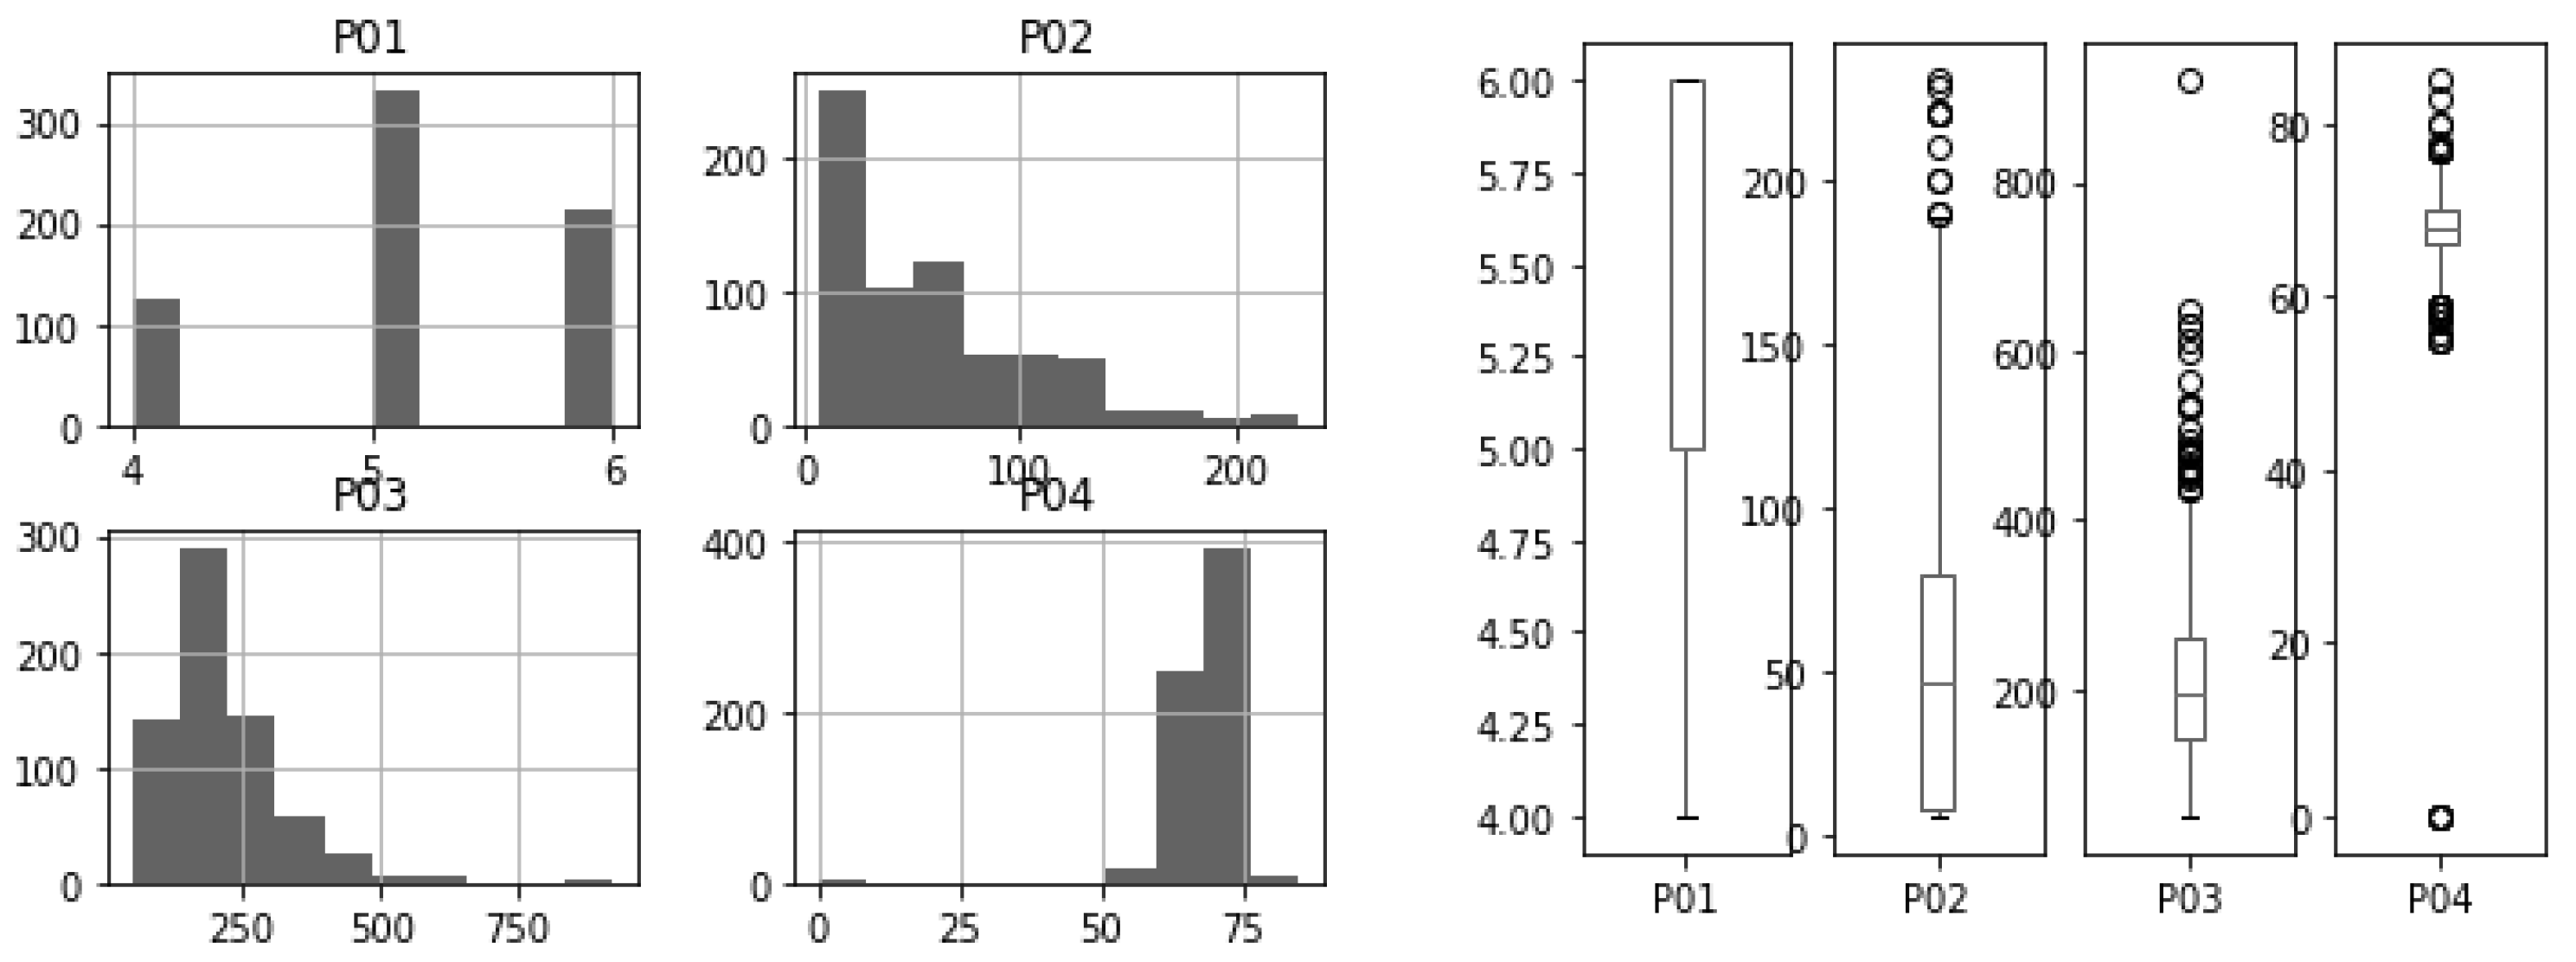
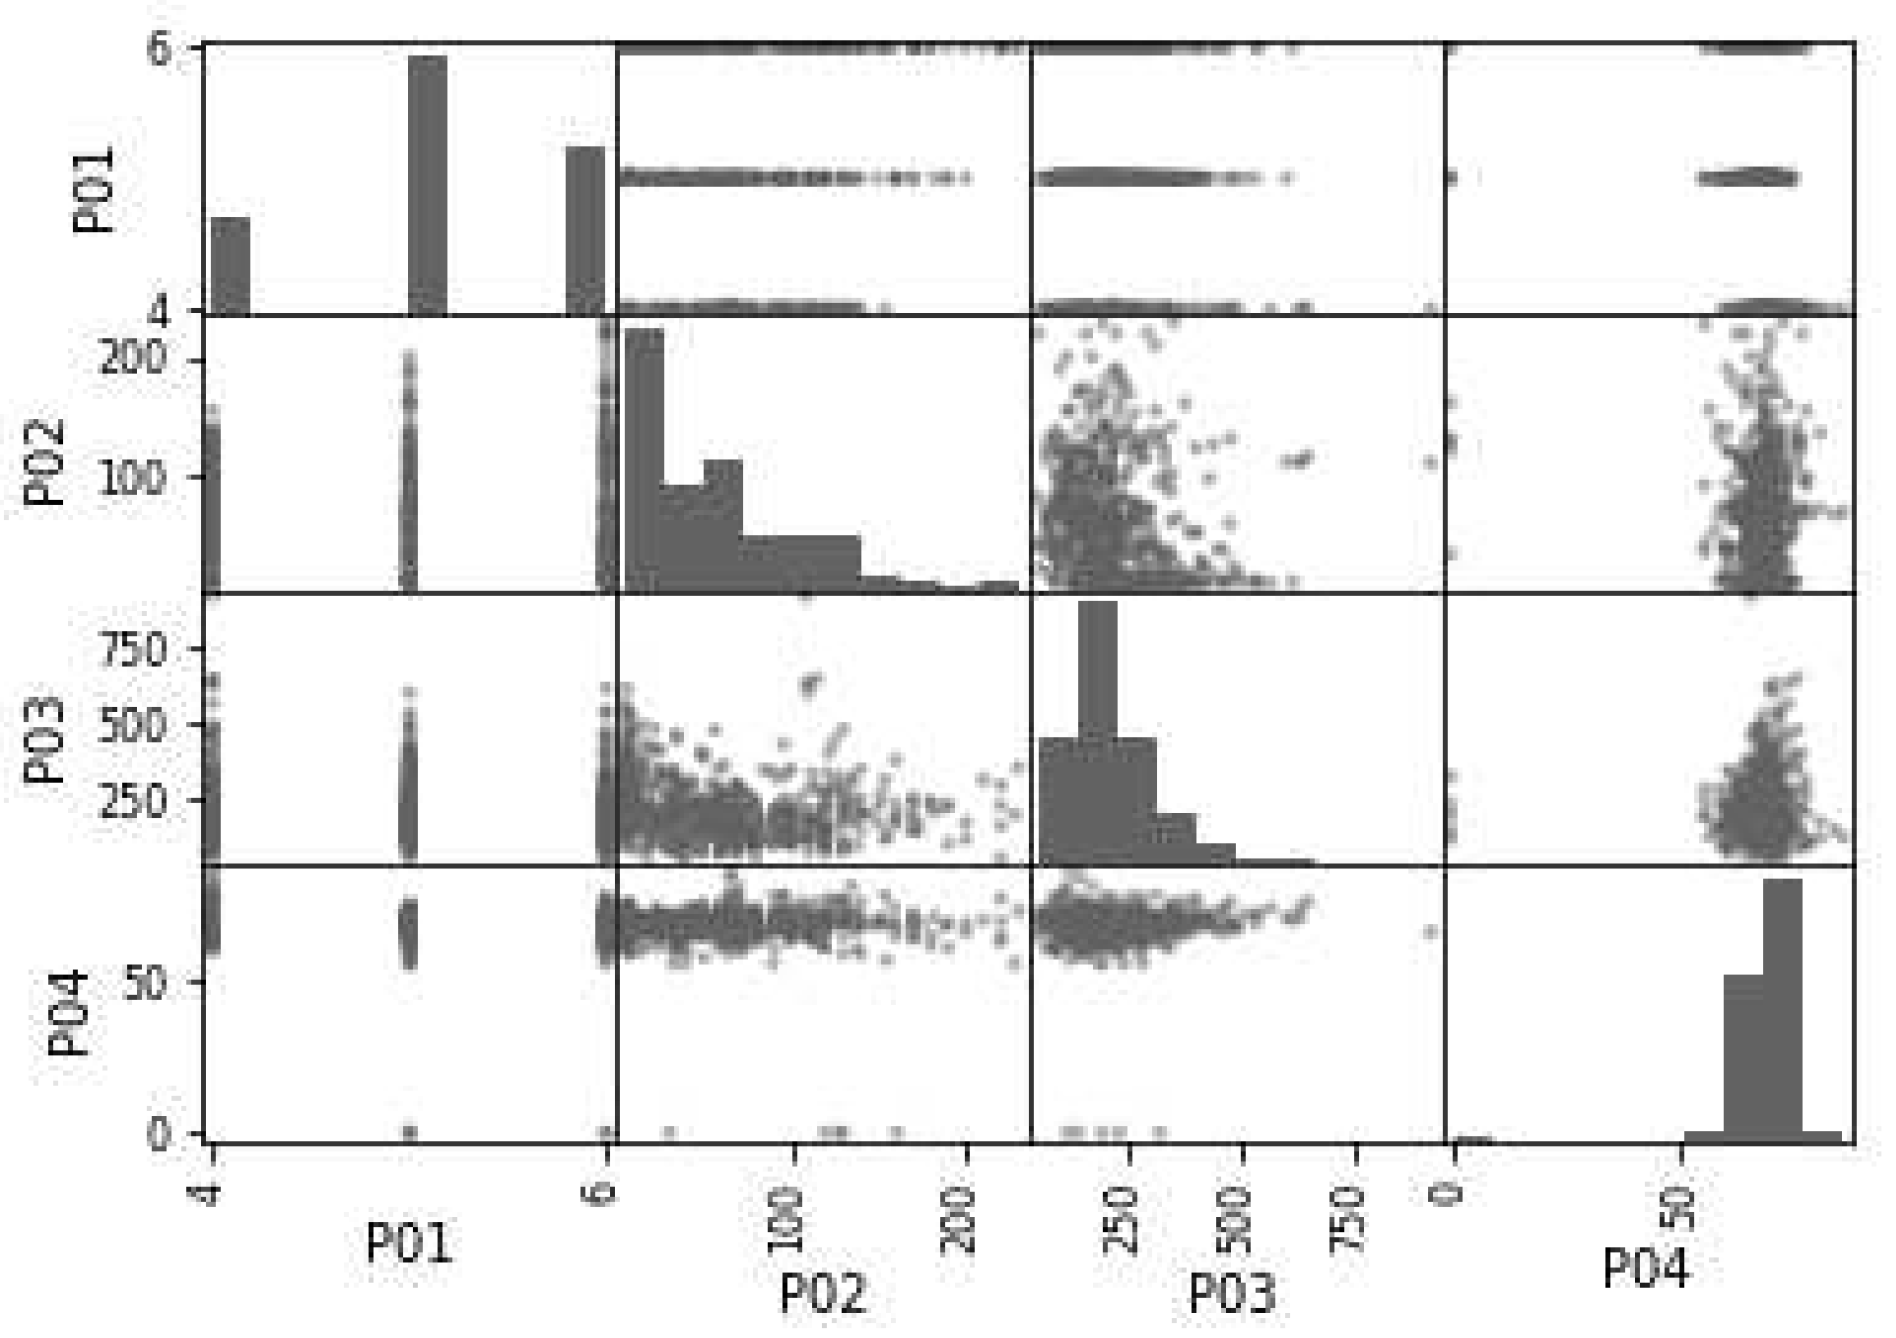
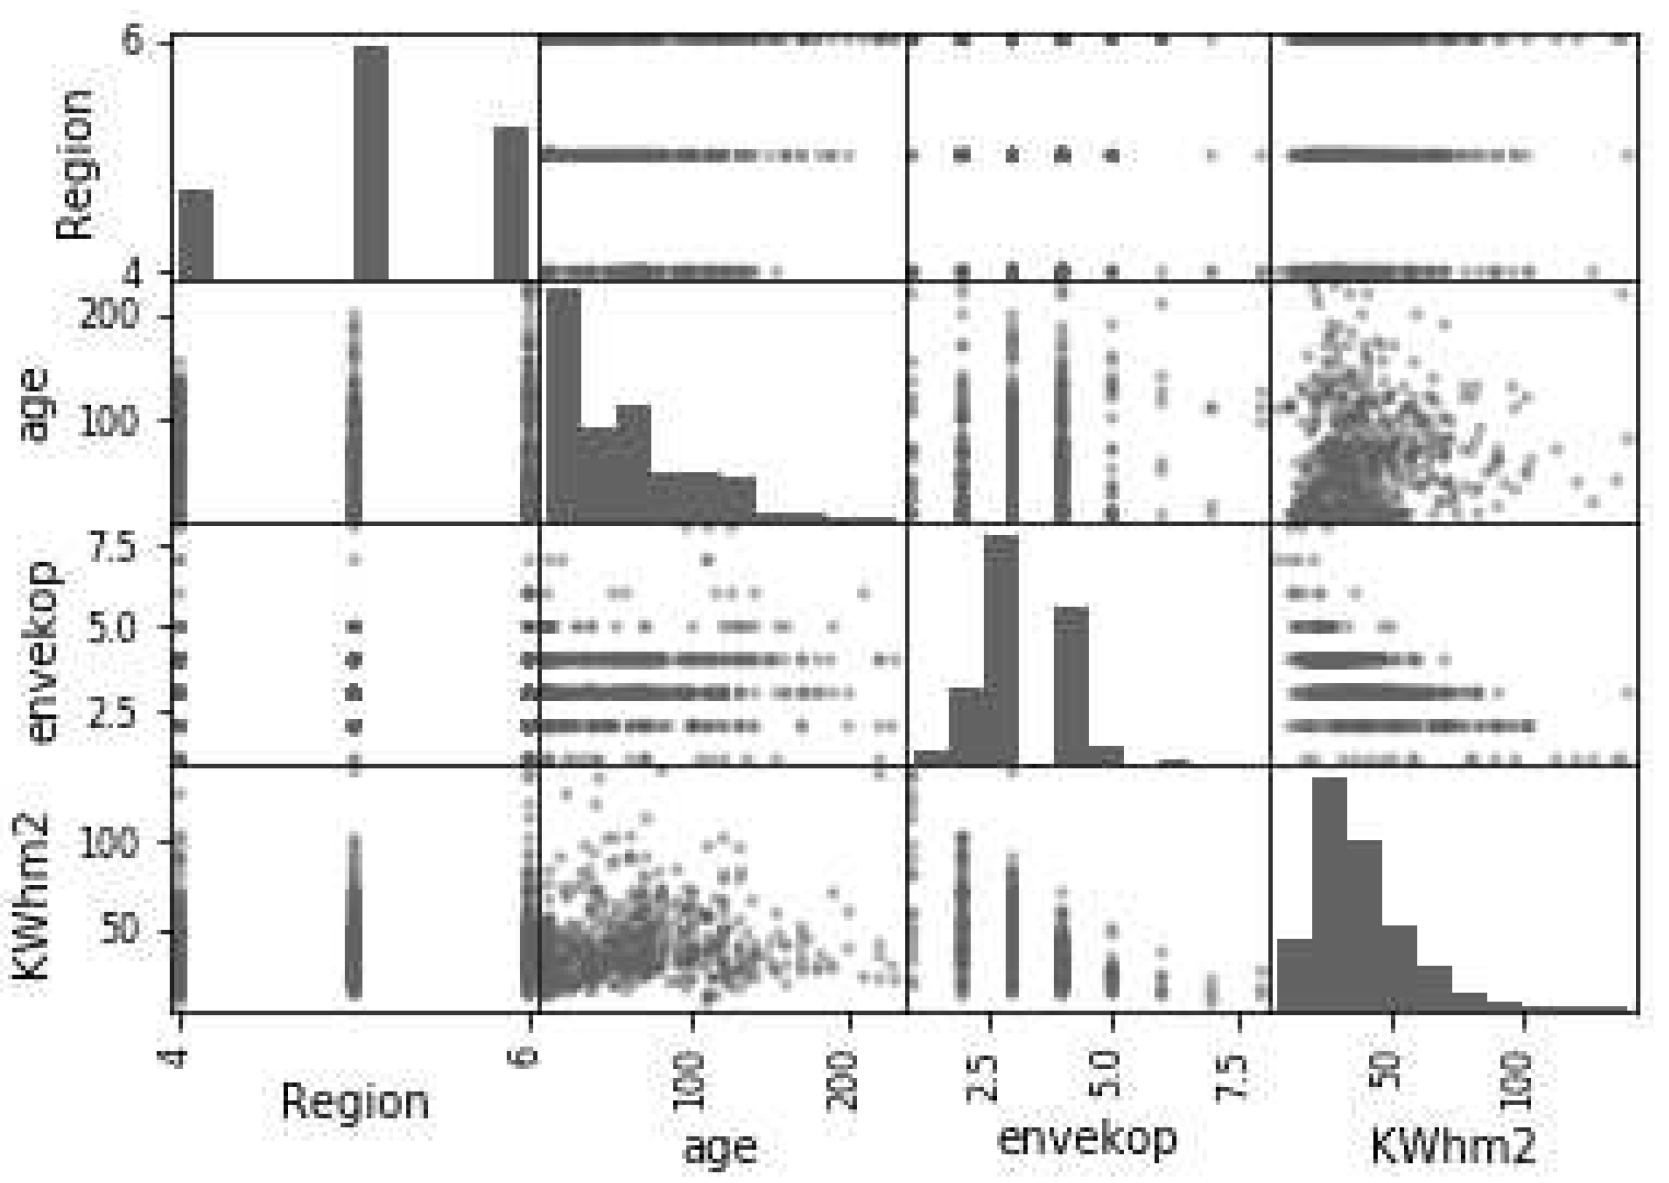
Figure 7 and
Figure 8 represent the histograms and scatterplot of the parameters considered in the second approach. One of the parameters shows very little dispersion which will be detrimental to have a reliable classification (P01).
Figure 8 shows the interrelation between the parameters that have been used in this second approach using two scatterplots. Parameters P03 and P04 are closely related and correspond to the building surface and energy consumption. These parameters are directly related to the energy efficiency of the building,
Figure 8 shows the interrelation between the parameters that have been used in this second approach using two scatterplots. It can be seen whether the parameters are strongly related. We identify those corresponding to energy consumption in
(KWh) and the surface area n squared meters (
) of benefit, so this relationship seems logical.
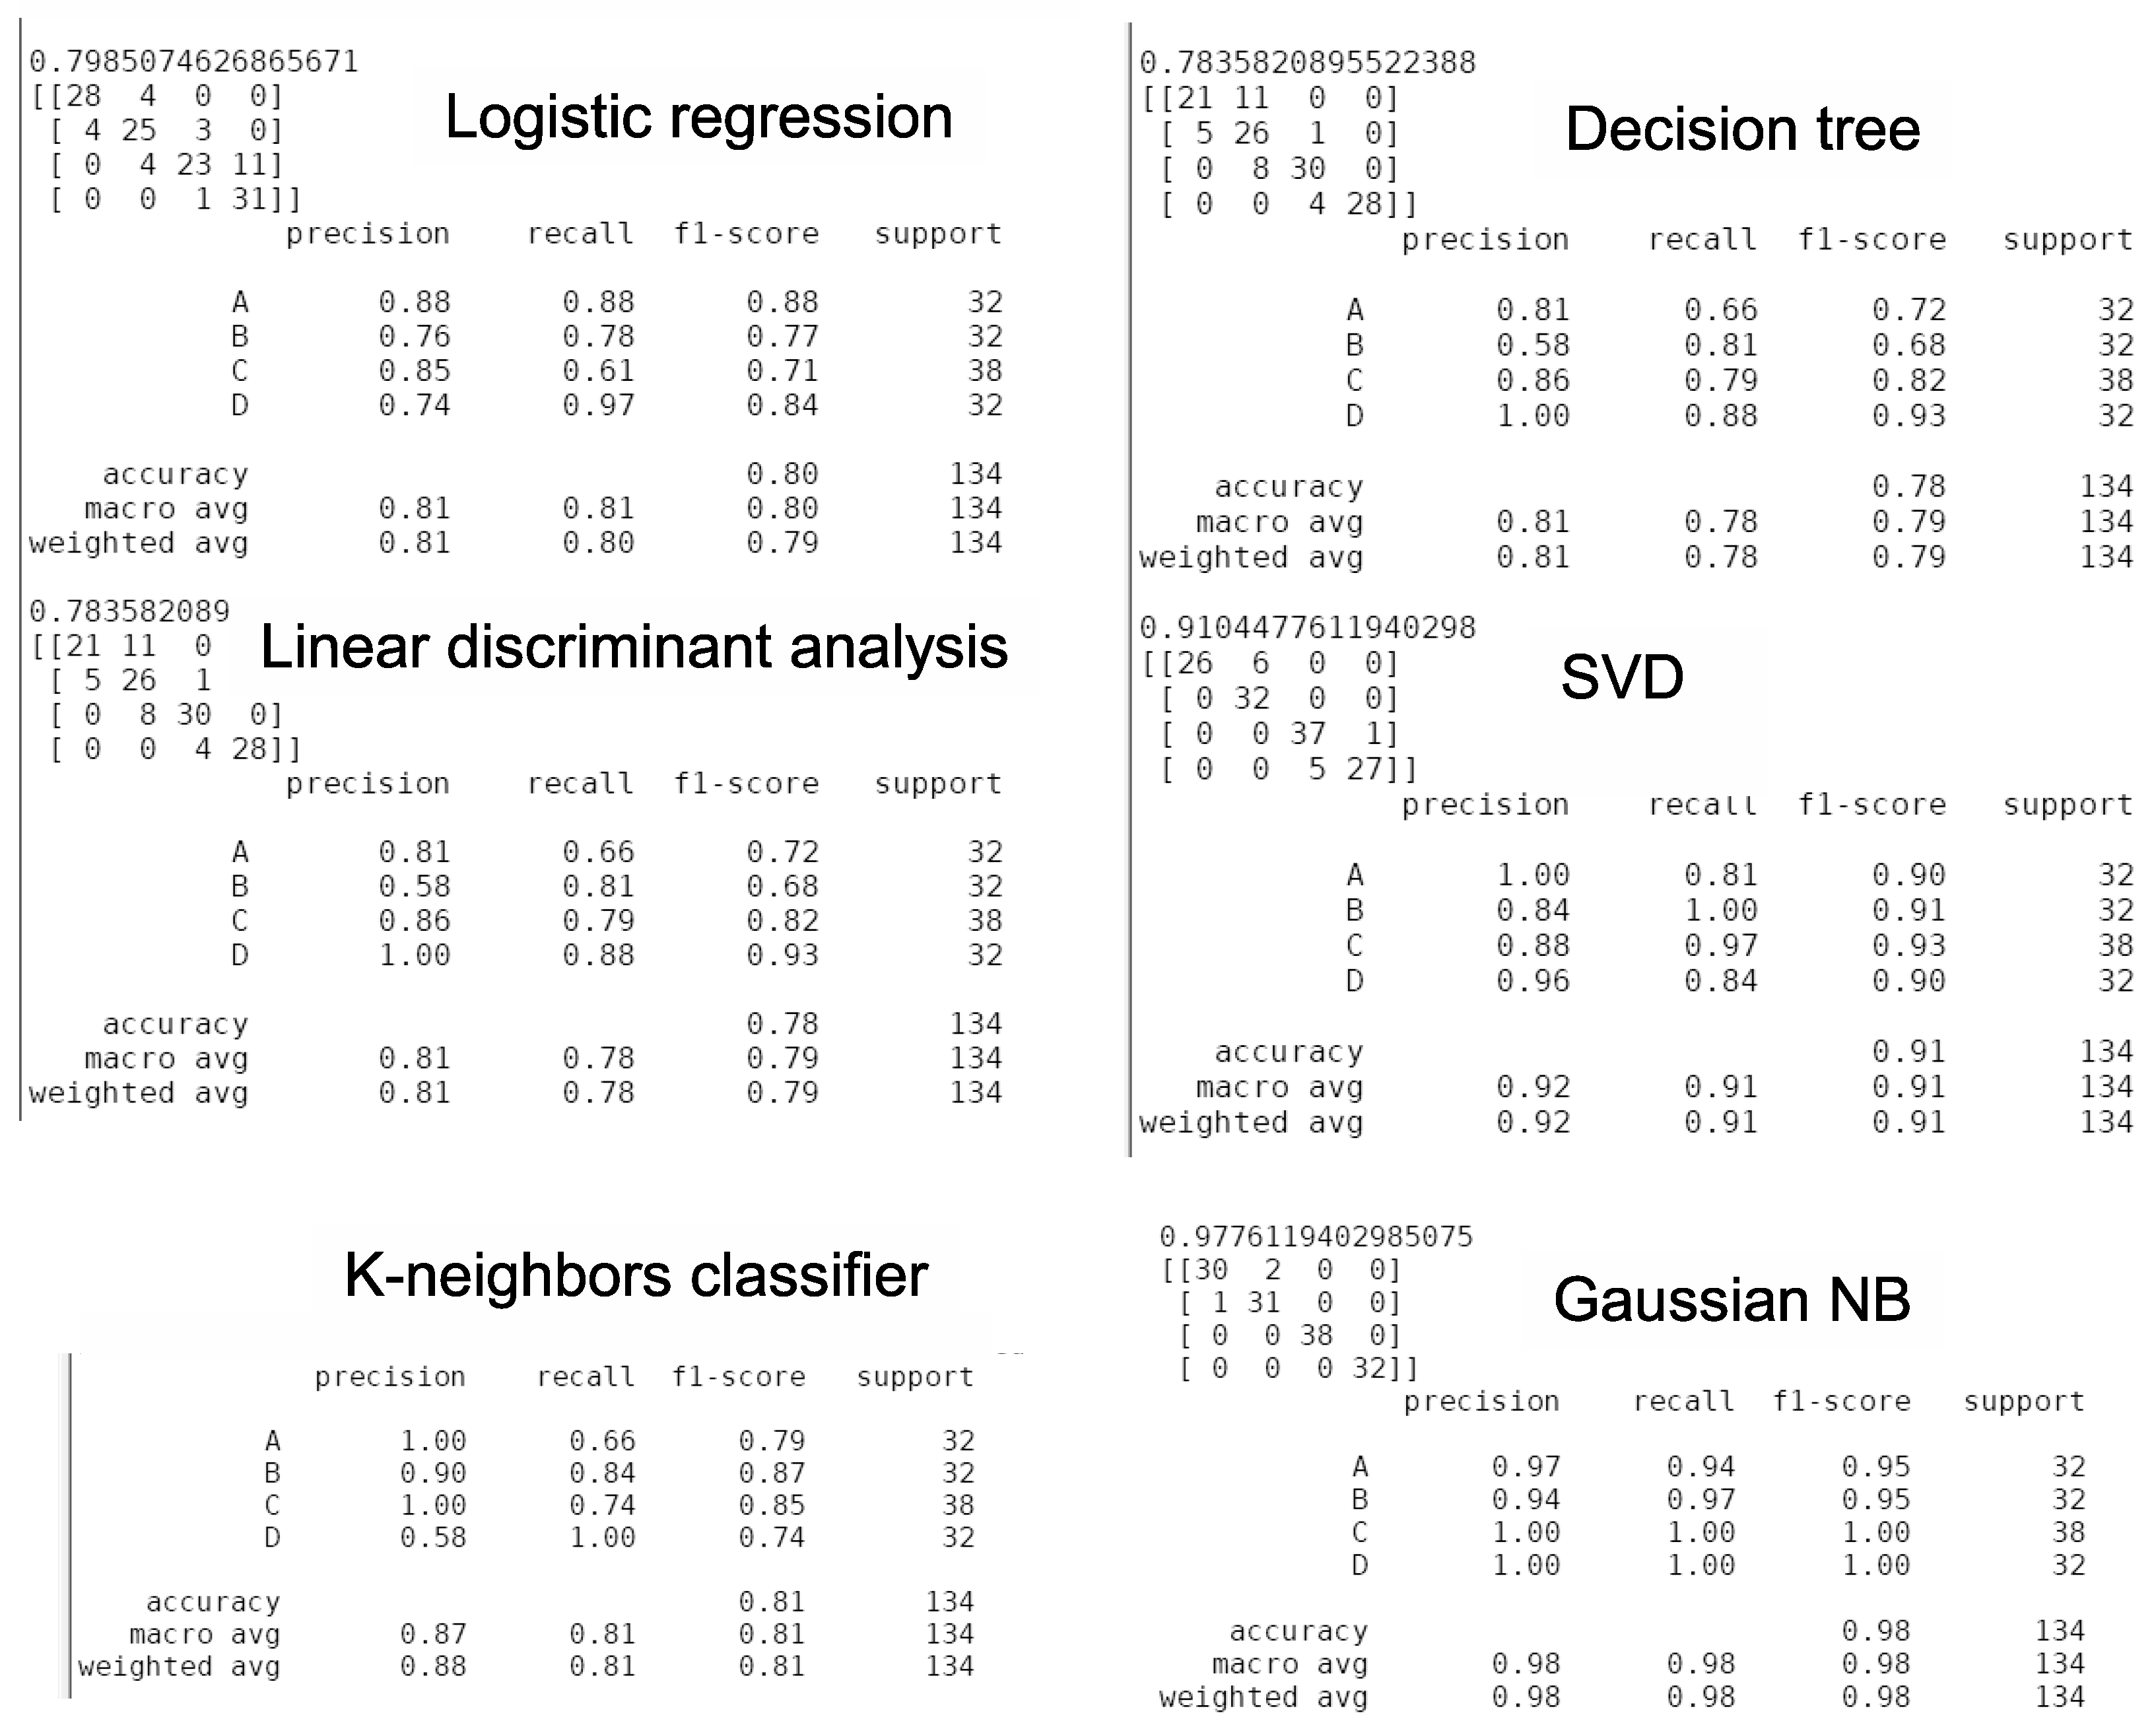
Figure 9 represents the results of the ML-based building energy efficiency classifier which uses only four parameters. These results indicate a notable improvement. However, we consider the degree of confidence low. Honestly, we cannot use the algorithm for the reliable assessment of the energy efficiency level of buildings. We conclude that the degree of confidence is not sufficient for its systematic application in the categorization of buildings in terms of their energy efficiency.
One of the most relevant conclusions of this research is that in order to achieve the best results, it is not necessary to have an exhaustive number of parameters in the dataset, but rather quality and reliability are more relevant. To use a reduced number of parameters to accurately determine the building thermal model, it is necessary to identify which of them have the largest impact on the energy efficiency rating.
Actually, the relationship between these two parameters is directly related to the energy efficiency of the building. Given one with a certain surface, the larger the energy consumption, the lower the efficiency. Since the ratio is directly related to the efficiency, instead of using these two parameters, we use the ratio as a single parameter which is relevant in the reliability of the classifiers. After the analysis, the parameters chosen for the third approach are:
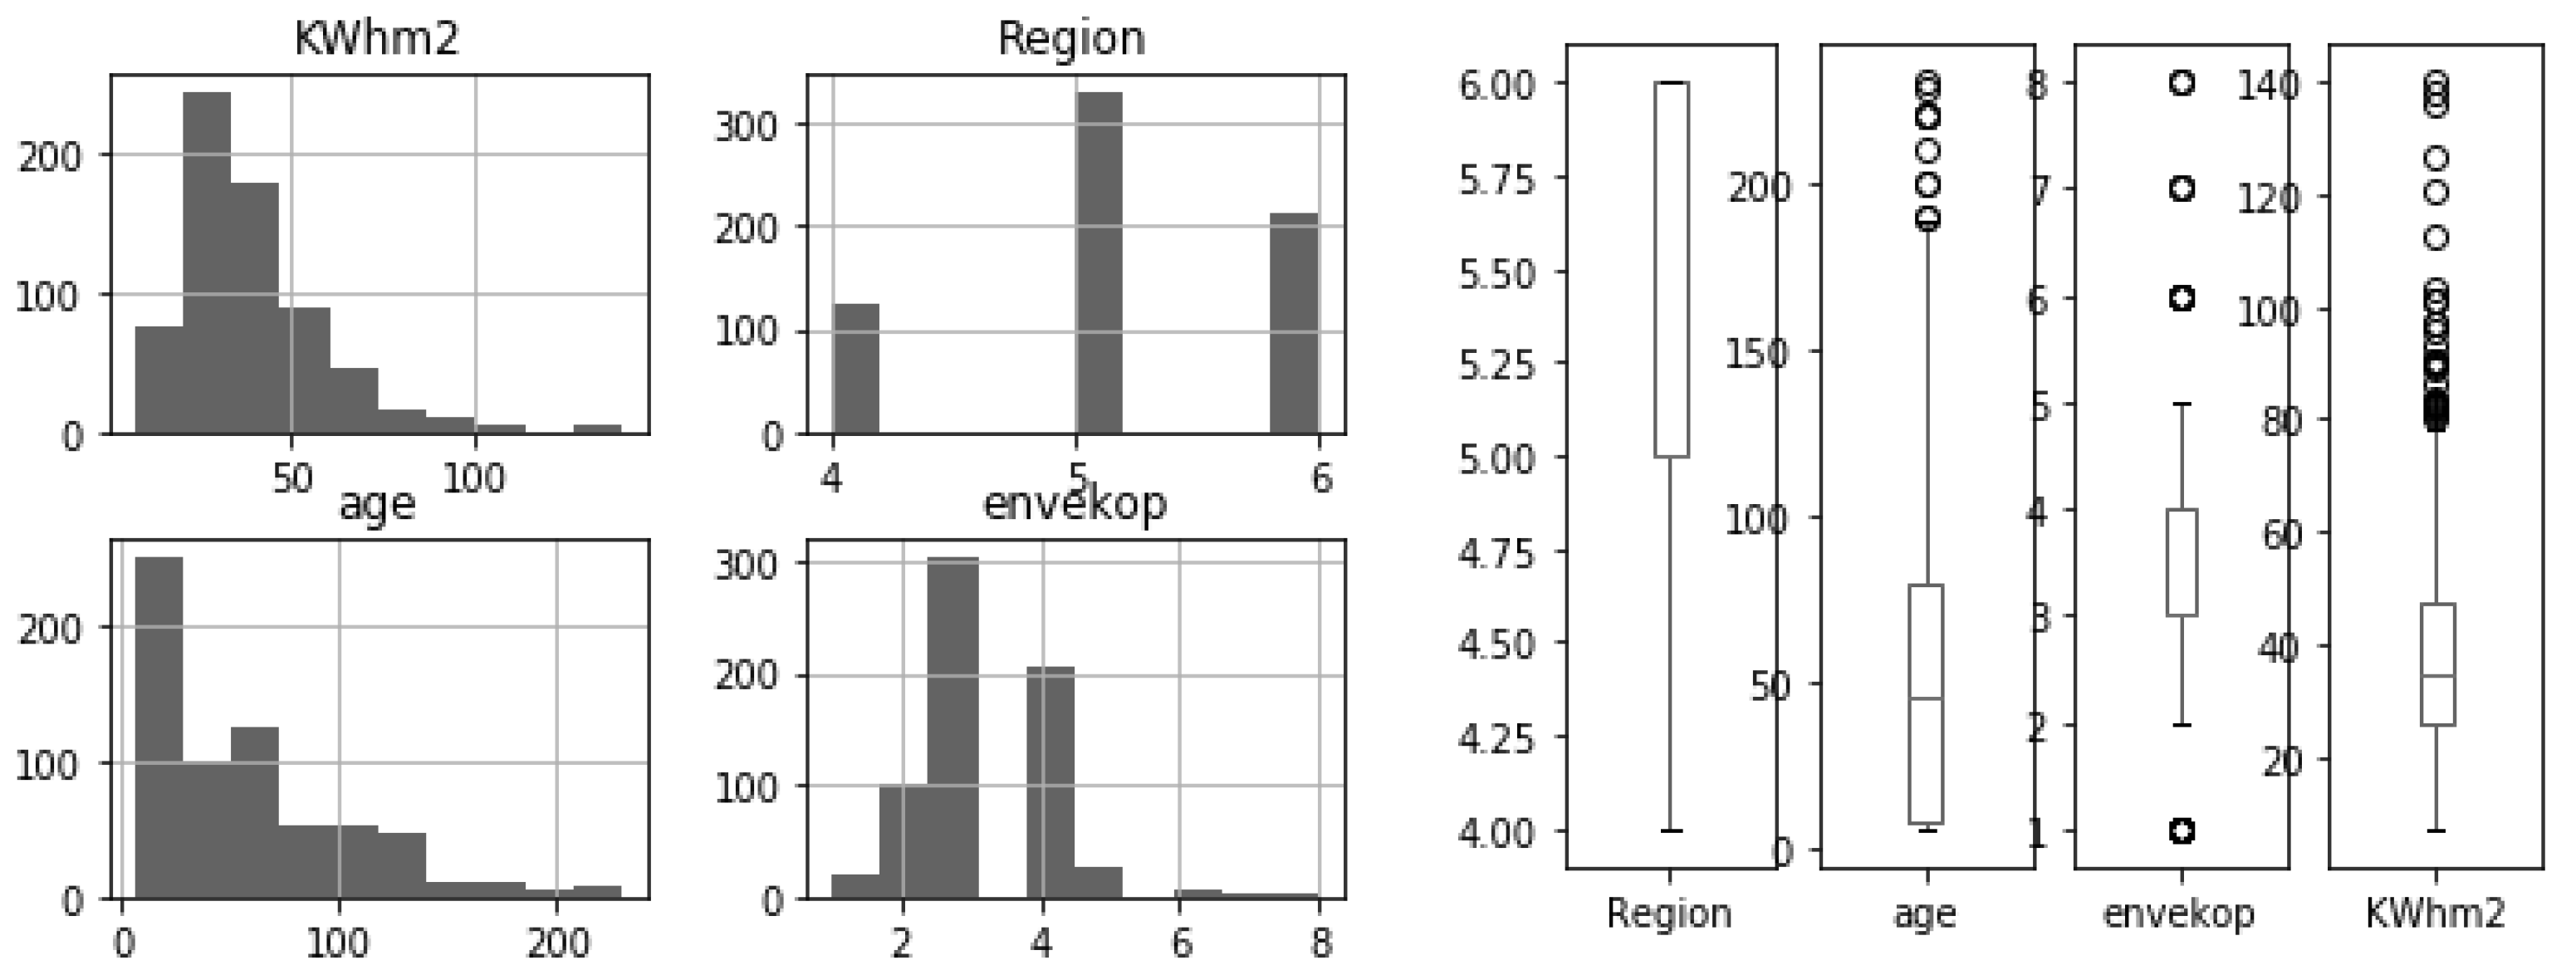
Figure 10 draws the histogram and distribution range for the values of the parameters chosen for the third approach. In this case, we observe a wider distribution range of the parameter values which benefits the classification algorithms. In
Figure 11 the interrelation between the different parameters is represented by means of the scatterplot. It is worthy to remark that these parameters are quite interrelated as shown in the scatterplots.
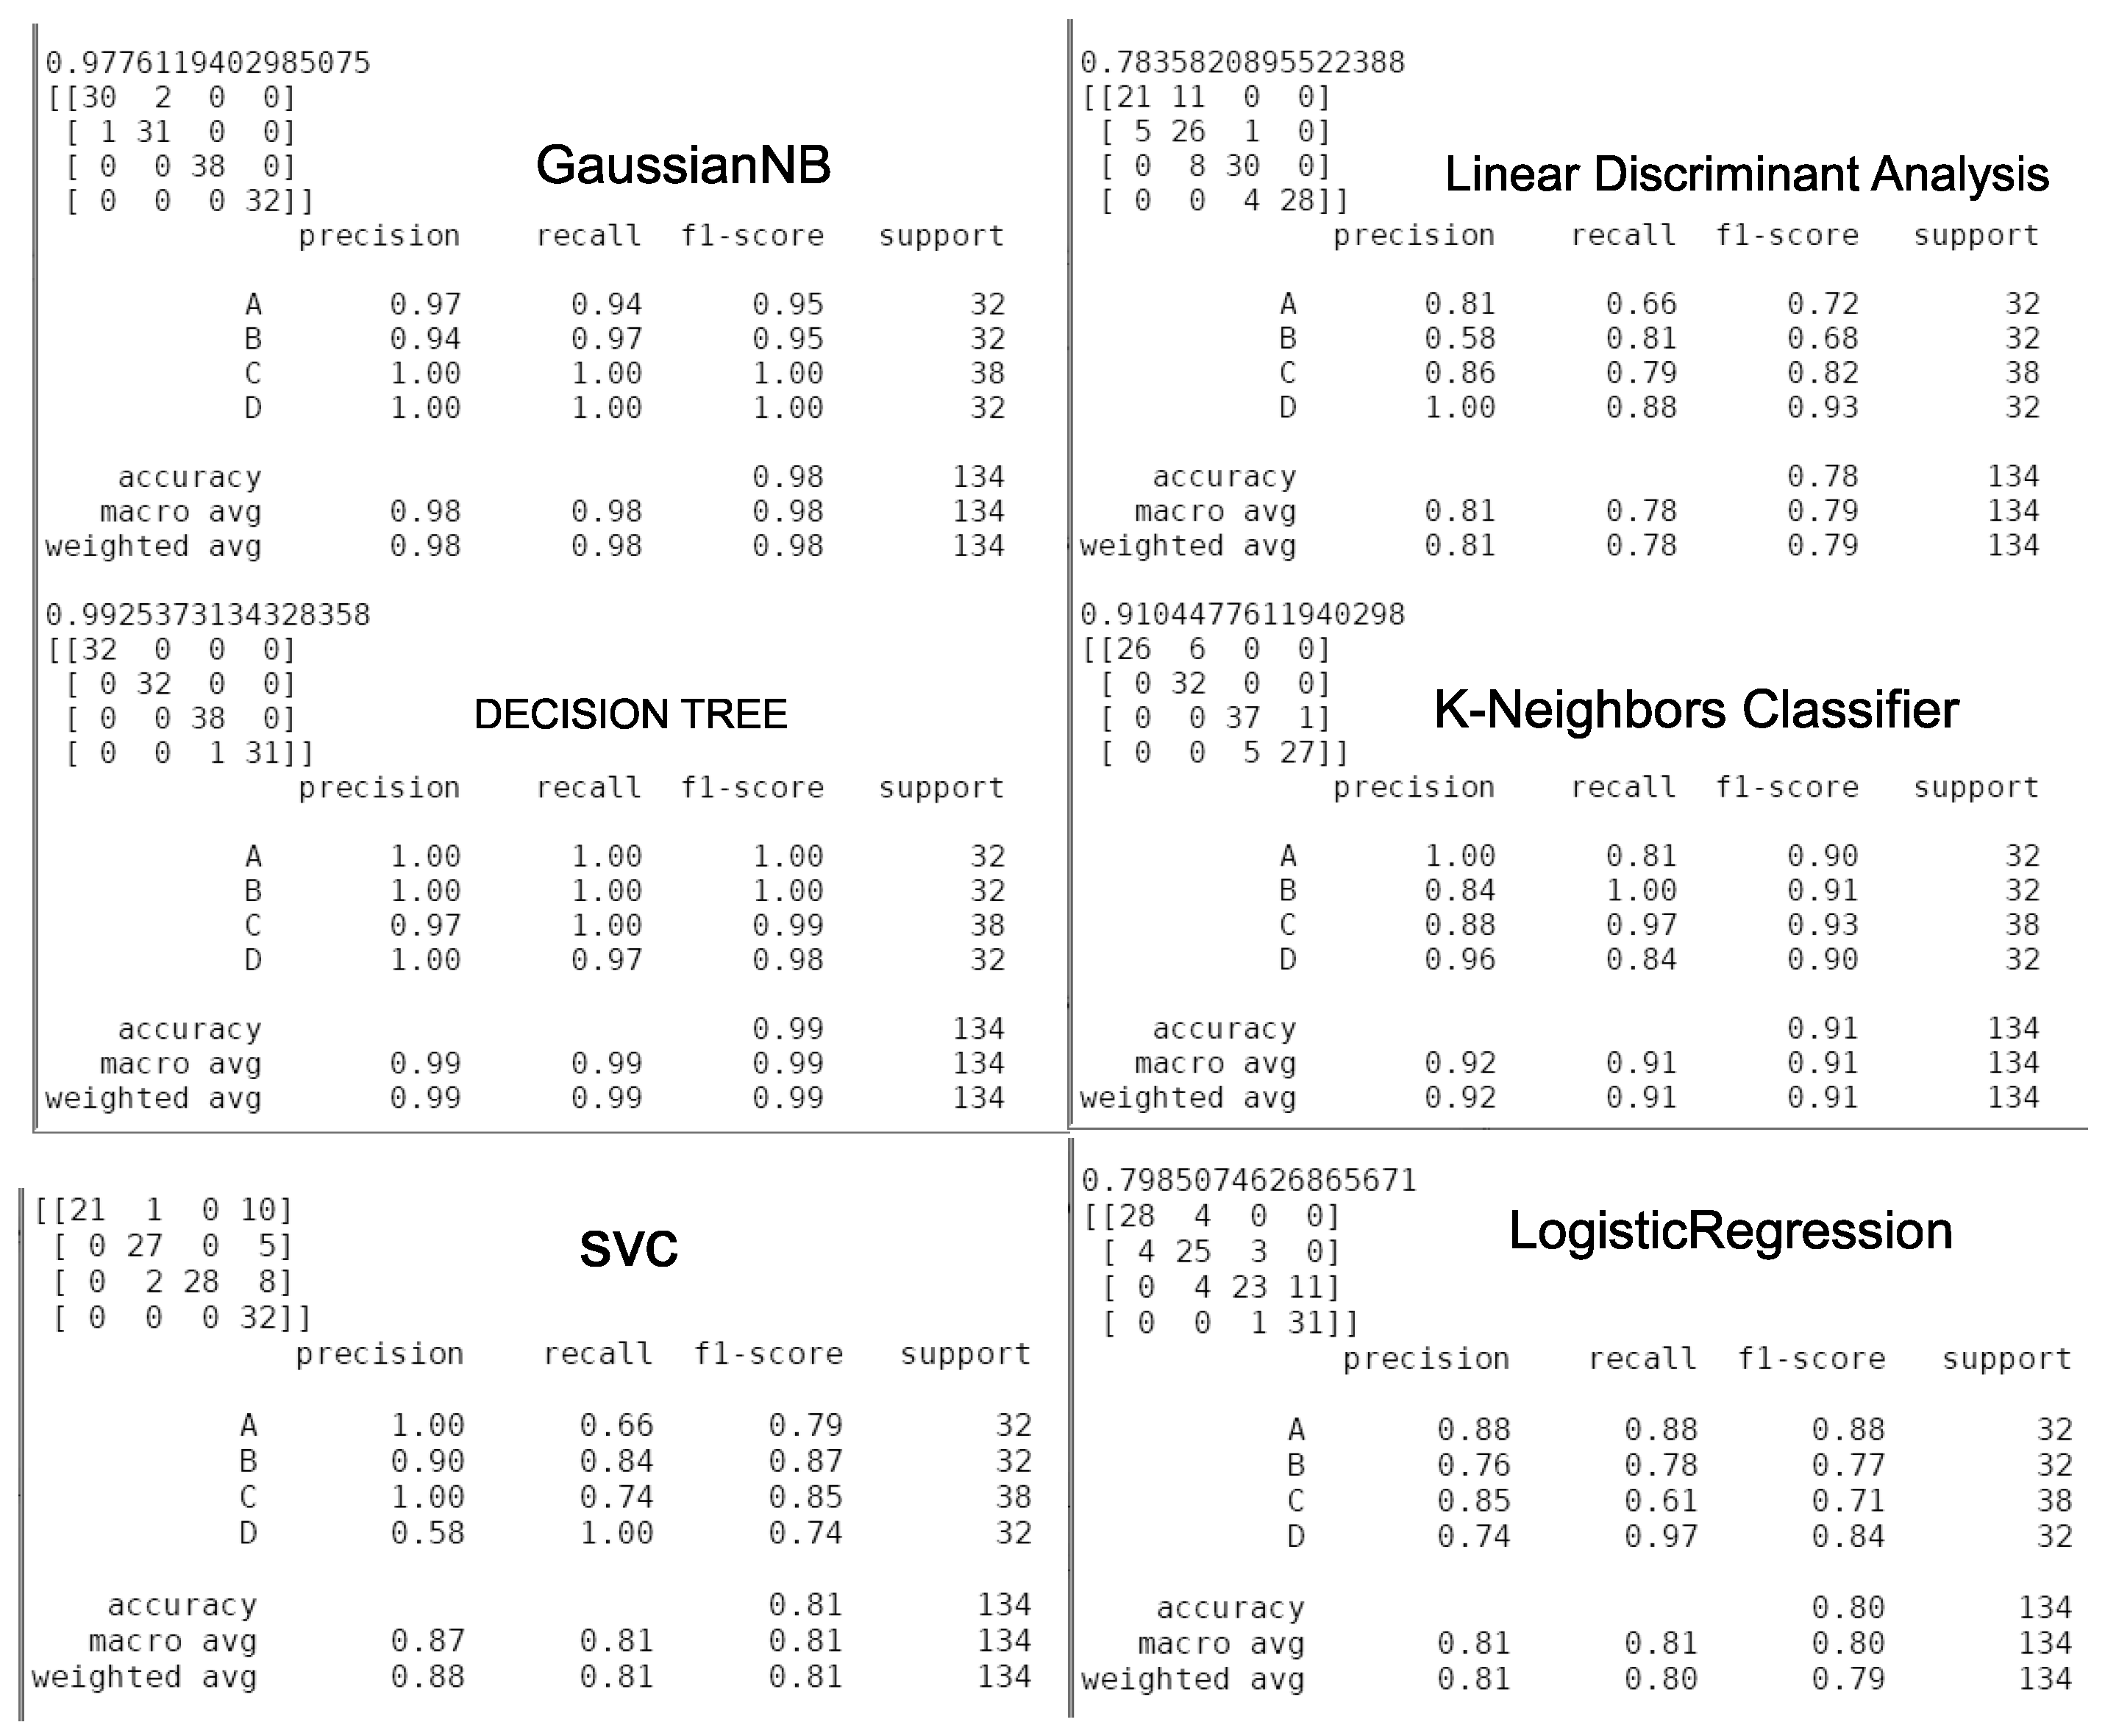
Figure 12 shows the ratings obtained by the six classifiers considered in the analysis of buildings’ energy efficiency categorization. We can see that the results obtained are notably better than in the previous cases. The algorithms that achieve the worst scores are the Logistic Regression, the SVC support vector computer and Linear Discriminant Analysis. Better results are shown by the k-Neighbors classifier. Then comes the Gaussian classifier, and the decision tree classifier is the one obtaining the highest scores. We can therefore conclude that the machine learning techniques applied to energy classification of buildings seems to be very useful given the degree of reliability showed by the algorithms that have been used. However, it is necessary to highlight the previous work required in the data collection task and, above all, in the processing of the data in order to identify which are the most relevant to face the classification problem. Using many parameters and a larger amount of data does not guarantee a higher reliability.
It has been shown that by using the correct choice of parameters, the classification can now be carried out with high reliability. These results encourage us to continue in this line of research in the immediate future, to see the potential of machine learning techniques and many areas, including the field of energy efficiency in buildings. We intuit, as a complement to the work carried out in this research, once we have carried out the energy classification of a building, we can infer which are the improvement points and the building’s structures. Building elements, energy systems for heating, cooling and ventilation, the use of monitoring systems using wireless sensor networks to detect, among others, the presence in rooms and offices, detection of open windows, air flows and other factors are what cause energy efficiency to be reduced.
Additional remarks can be drawn. Considering the histogram of the windows shading, most of the people do not use them. Maybe the reason is not clear a priory, but the climate region or nearby high vegetation mitigates the solar radiations.
The performance of the different classifiers is similar. We can focus on the F1-score to choose the more accurate ones. There are two obtaining the same F1-score: DTC, and LDA. The next in the ranking is the Gaussian approach, which is followed by the KNN and the last is the DCT.
Table 8 compares the results of the best classifiers for the different approaches and the classification in the different groups. This comparison is based on the F1-score. In average, the decision tree is the one achieving the best results, although the best scores are for the Gaussian classifier, but its performance is the worst in the first one. This classifier shows good scores when the parameters in the dataset spreads in their range, specially if they are uniformity distributed. The decision tree fails for noisy datasets.
Therefore, given the degree of reliability shown by the algorithms used, we can conclude that machine learning techniques used are very useful in energy classification of buildings. However, it is necessary to highlight the pre-processing necessary on the data collection and, above all, in the identification of the most relevant ones in the classification problem. Using many parameters and a large dataset does not necessarily lead to higher accuracy and reliability.
This research and its results show the potential applications of AI and ML techniques in this field. Our experience remarks on the potential future works. There is a great opportunity for the development of algorithms capable to diagnose and identify improvements in all the elements impacting the energy efficiency, including the building’s structures and the equipment (e.g., HVAC systems). The use of monitoring systems using wireless sensor networks allows detecting, among others, the presence in rooms and offices, the detection of open windows, air flows and other factors which causes the energy efficiency to drop.
8. Conclusions
In this section, the main achievements of the investigation are drawn, and the major conclusion is highlighted.
Machine learning techniques have become very popular in recent years. They are responsible for 40 % emissions into the atmosphere. Machine learning techniques have become a very popular tool in recent years due to their potential capabilities, as they can be used to solve for their flexibility and adaptability, as well as scalability for different practical applications, i.e., complexity of machine learning tools in use, can be modulated depending on the requirements of the problem to be solved. The research presented in this article aims to solve and validate the problem of thermal modeling of residential buildings in order to make an automatic and systematic classification based on their thermal characteristics.
In this study, we have introduced the results of the research carried out focusing on the use of artificial intelligence tools, and specifically machine learning, in the field of the energy performance of buildings. Among other possibilities, we highlight the potential use in autonomous and systematic energy efficiency auditory in buildings.
The research that is presented in this paper is aimed at solving a classification problem: the building energy efficiency, which is used to qualify buildings and improves their thermal properties. Specifically, the research focused on single-family houses in residential areas which, in general terms, they have a lower energy efficiency than multi-family ones because they consist of more open structures, with a lower level of thermal isolation.
To achieve its objective, the research work evaluated numerous databases related to energy consumption, mainly electricity and natural gas, to determine the energy efficiency of the building. For this, it is worthy to note the need for analyzing the regulations that apply in each country, which is an important work to succeed in the algorithms’ configuration and their accuracy. Special care must be paid in international frameworks.
As conclusions of our work we can remark the following:
It is necessary to have a precise definition of the problem to solve, and to have a good knowledge of the different aspects related to it, as well as establishing its scope.
The dataset used for both training and validation of the algorithms must be robust enough and, in any case, it requires a prior analysis of the data to determine the adequacy to the problem to be solved, since otherwise, the algorithm will fail.
There are different classification algorithms which can be implemented and the dynamics of the problem must be assessed to choose the most appropriate to guarantee the proper accuracy.
The results that have been obtained demonstrate the benefits of machine learning techniques. The results obtained show high reliability, so they can be used systematically.


