Article

Laboratory Model Studies on the Drying Efficiency of Transformer Cellulose Insulation Using Synthetic Ester

Institute of Electric Power Engineering, Poznan University of Technology, Piotrowo 3A, 61-138 Poznan, Poland
*
Author to whom correspondence should be addressed.
Energies 2020, 13(13), 3467; https://doi.org/10.3390/en13133467
Submission received: 25 May 2020 / Revised: 19 June 2020 / Accepted: 30 June 2020 / Published: 4 July 2020
(This article belongs to the Special Issue High Voltage Insulating Materials-Current State and Prospects)

Abstract

:
This paper presents the results of laboratory tests of cellulose insulation drying with the use of synthetic ester. The effectiveness of the drying process was investigated depending on the initial moisture of cellulose samples (2%, 3%, and 4%), ester temperature (55, 70, and 85 °C), initial moisture of the ester (70, 140, and 220 ppm), drying time (48, 96, and 168 h), and the weight ratio of cellulosic materials to ester (0.067 and 0.033). A large influence of temperature and time of drying on the efficiency of the drying process was found. This is important information due to the application of the results in the transformers drying procedure. The heating and drying ester unit should provide the highest possible temperature. For the assumed experiment conditions the initial moisture of the ester had little effect on the drying efficiency. An ester with a moisture content below 140 ppm can still be considered as meeting the requirements for drying cellulose with significant moisture. The weight ratio of cellulose products to ester has no major effect on drying efficiency during cellulose drying by circulating dry ester.

1. Introduction

The main insulation of the vast majority of power transformers is based on paper/pressboard-mineral oil system. During the operation of the transformer, its insulation system is constantly aging. High temperature and the presence of an electric field significantly accelerate the aging process.
One of the effects of aging is the increase of moisture content in cellulose insulation. The main cause of the moisture contamination process is the chemical decomposition of cellulose, which is accompanied by water formation. Looseness of the transformer tank plays a smaller role in the insulation moistening process than chemical cellulose degradation. It was found that, with the passage of transformer years of use, the annual increase in cellulose moisture increases [1,2].
Moisture in the transformer’s cellulose insulation depends on the transformer’s power and operating conditions. Figure 1 shows the water content in cellulose insulation depending on the transformer years of operation. The figure shows data obtained from grid transformers (160, 250, 330, and 500 MVA) and generator transformers, investigated in three countries [3]. The colors on the graph correspond to the moisture classification according to [4]. The figure shows that insulation with water content above 2% should be treated as wet, and above 4% as excessively wet.
One of the dangerous effects of high moisture content in cellulose insulation is the occurrence of the bubble effect phenomenon. It involves the rapid release of water adsorbed on cellulose fibers after exceeding the critical temperature. This leads to an increase in the pressure in the transformer’s tank even above its tearing strength, which can result in an explosion and fire [5,6].

2. Drying Methods for Cellulose Insulation

Drying of transformer insulation is carried out during the production and operation. During the production process, stationary devices in the factory are used. On the other hand, drying of insulation during operation is carried out at the place of the unit installation with the use of a mobile device or in a repair plant—if the general condition of the transformer requires major renovation [7].
The drying methods used so far require heating the insulation and creating a vacuum in the tank. The insulation is heated with hot oil, hot air, or electric current flow. The LFH (low frequency heating) method has the best opinion. In this method, three-phase high voltage winding is supplied and the low voltage winding is shorted. The frequency of the supply voltage is reduced to the lowest possible value at which the transformation effect still occurs. It is usually between 0.4 and 2 Hz [8]. The tank design must allow for the creation of an appropriate vacuum. The method is very effective, but unfortunately very expensive. For a network transformer, the service costs are about € 150,000.

3. Drying Cellulose Insulation Using Synthetic Ester

The use of an ester as a drying medium is possible due to the huge solubility of water in the ester. Figure 2 shows a comparison of the water saturation limit of three selected liquids used for filling transformers. Such great possibilities of dissolving water in the ester result from the fact that one molecule of the ester is able to attach, on the basis of hydrogen bonds, as many as four molecules of water.
If wet cellulose is surrounded by dry ester, then there is an intensive migration of water from cellulose to the ester until the moisture equilibrium between cellulose and ester is achieved. The closer to equilibrium, the smaller the dynamics of water migration. The dynamics of water migration depend, to varying degrees, on many factors. The main ones are: initial moisture content in cellulose insulation, moisture of the ester, the mass ratio of cellulosic materials to liquid, insulation temperature, and thickness of cellulosic materials [10].

4. Research Results and Discussion

4.1. Introduction

In the earlier research, described in publication [11], the effect of cellulose sample thickness on the efficiency and dynamics of their drying with the use of synthetic ester was investigated. During the experiment 0.05, 0.5, 3.0, and 5.0 mm thickness samples were tested.
In this experiment, the drying process of 3 mm thick pressboard samples with three different moisture levels, about 2%, 3%, and 4%, was studied. The effects of drying temperature (55, 70, and 85 °C), initial moisture of the ester (70, 140, and 220 ppm) and the mass ratio of cellulose products to synthetic ester (0.067 and 0.033) were studied. These mass ratios are found in grid and distribution transformers.

4.2. Sample Preparation

Sample preparation was multi-stage. In the first stage the pressboard samples were dried at 85–95 °C for 26–29 h in a vacuum of 0.2–0.4 mbar to reduce the water content to less than 0.1%. Then the samples were conditioned in a climatic chamber to achieve the assumed water content. In the third stage, pressboard samples were degassed and impregnated with mineral oil. The air trapped in the samples was rapidly released from the cellulose materials, causing oil bubbling, which stopped after about 15 min from the moment of applying the vacuum. Next, the pressboard samples were placed in the climatic chamber for 144 h for their further impregnation and stabilization. In final stage, the water content (WCPi) in the samples was measured by Karl Fischer titration (KFT) method [12]. All parameters of sample preparations and sample moisture contents are presented in Table 1. The samples prepared in this way were subjected to a drying process using a synthetic ester.
Different water content in the synthetic ester was obtained by mixing in an appropriate proportion the dry ester (50 ppm) with the moistened ester (950 ppm). In this way, a synthetic ester with an initial moisture level (WCEi) of 70, 140, and 220 ppm was prepared.

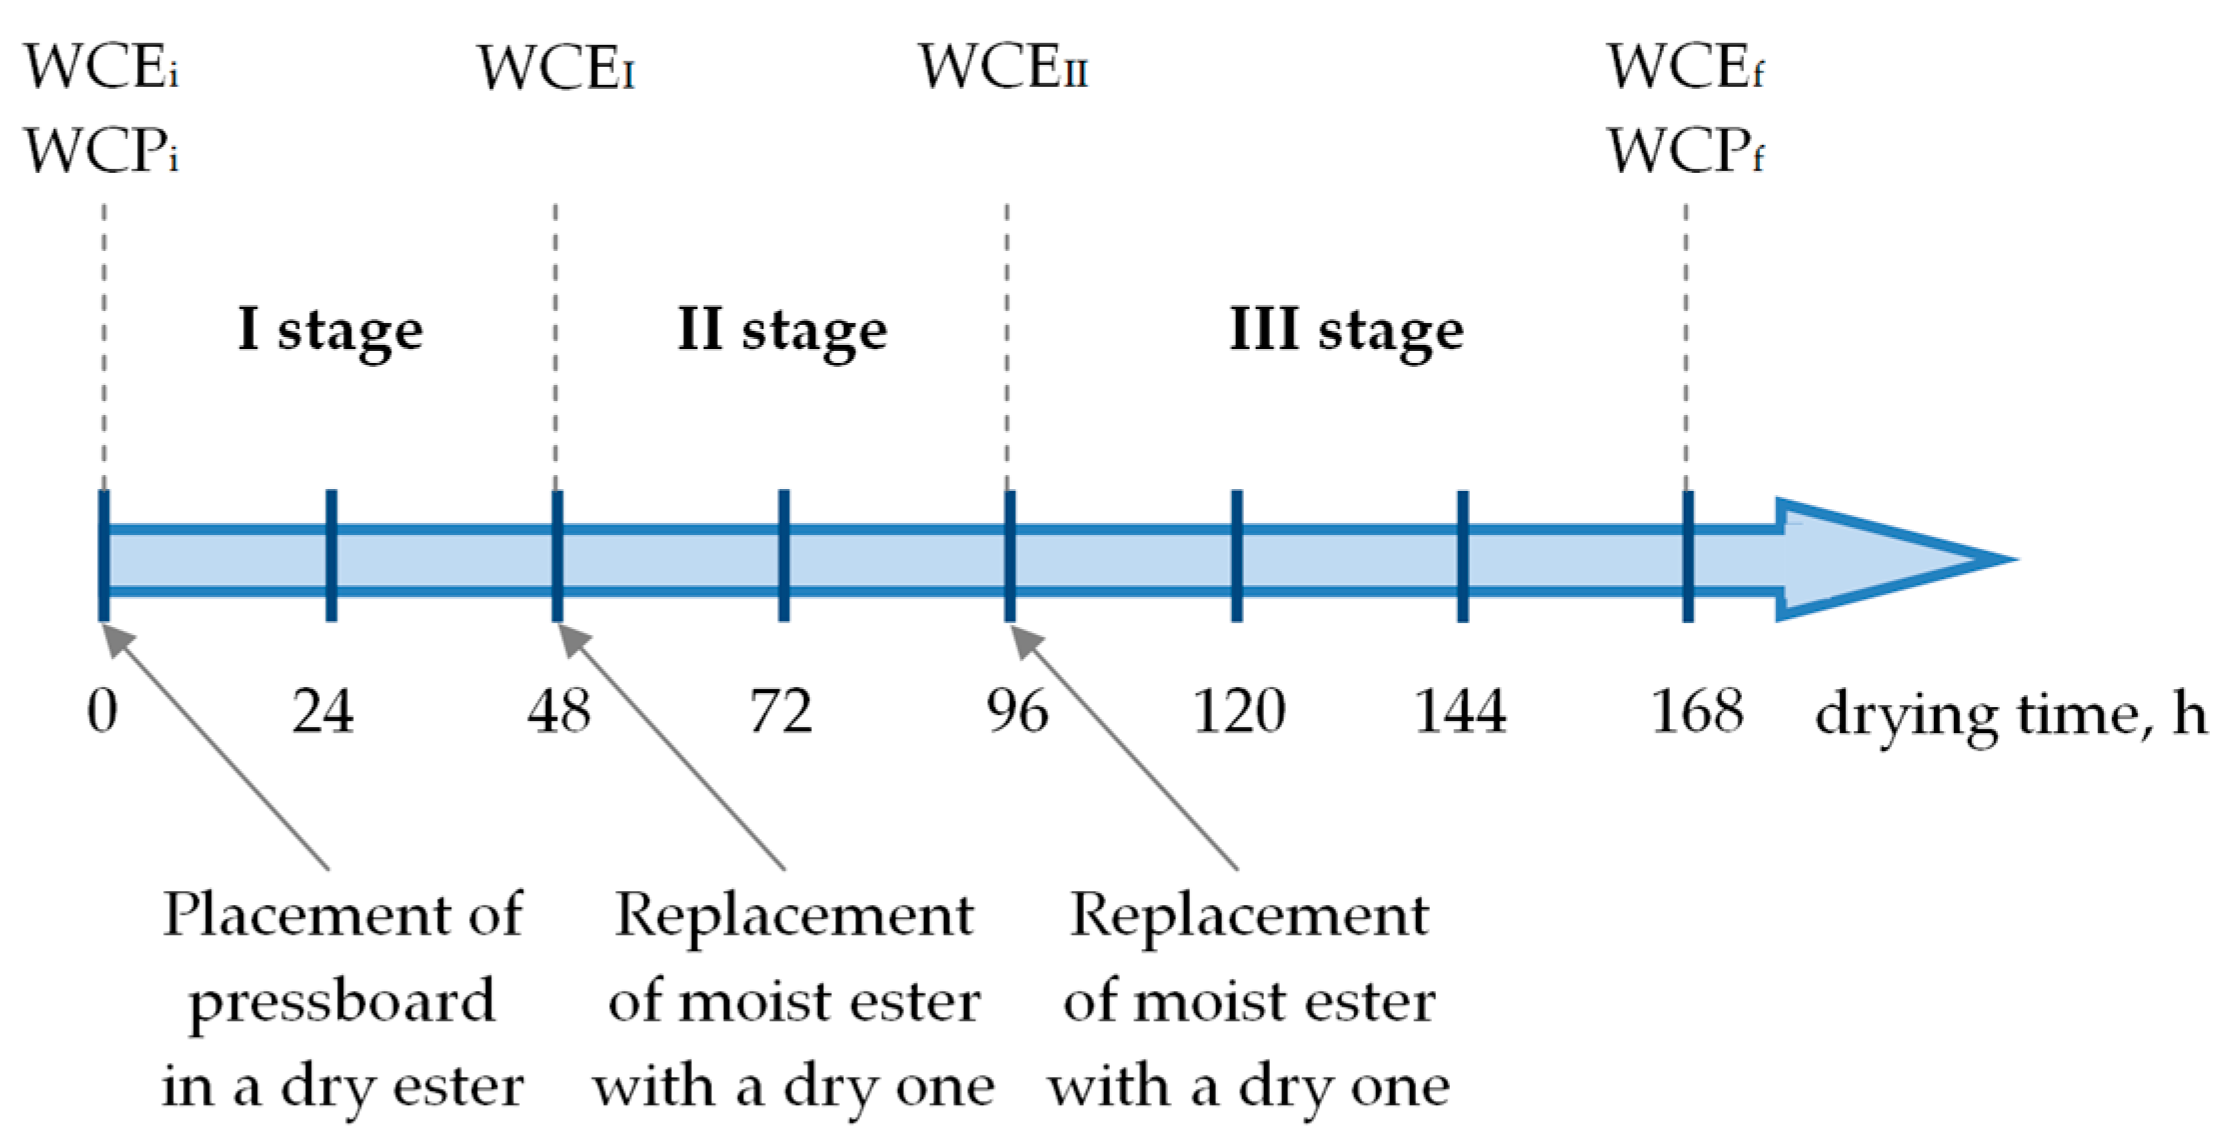
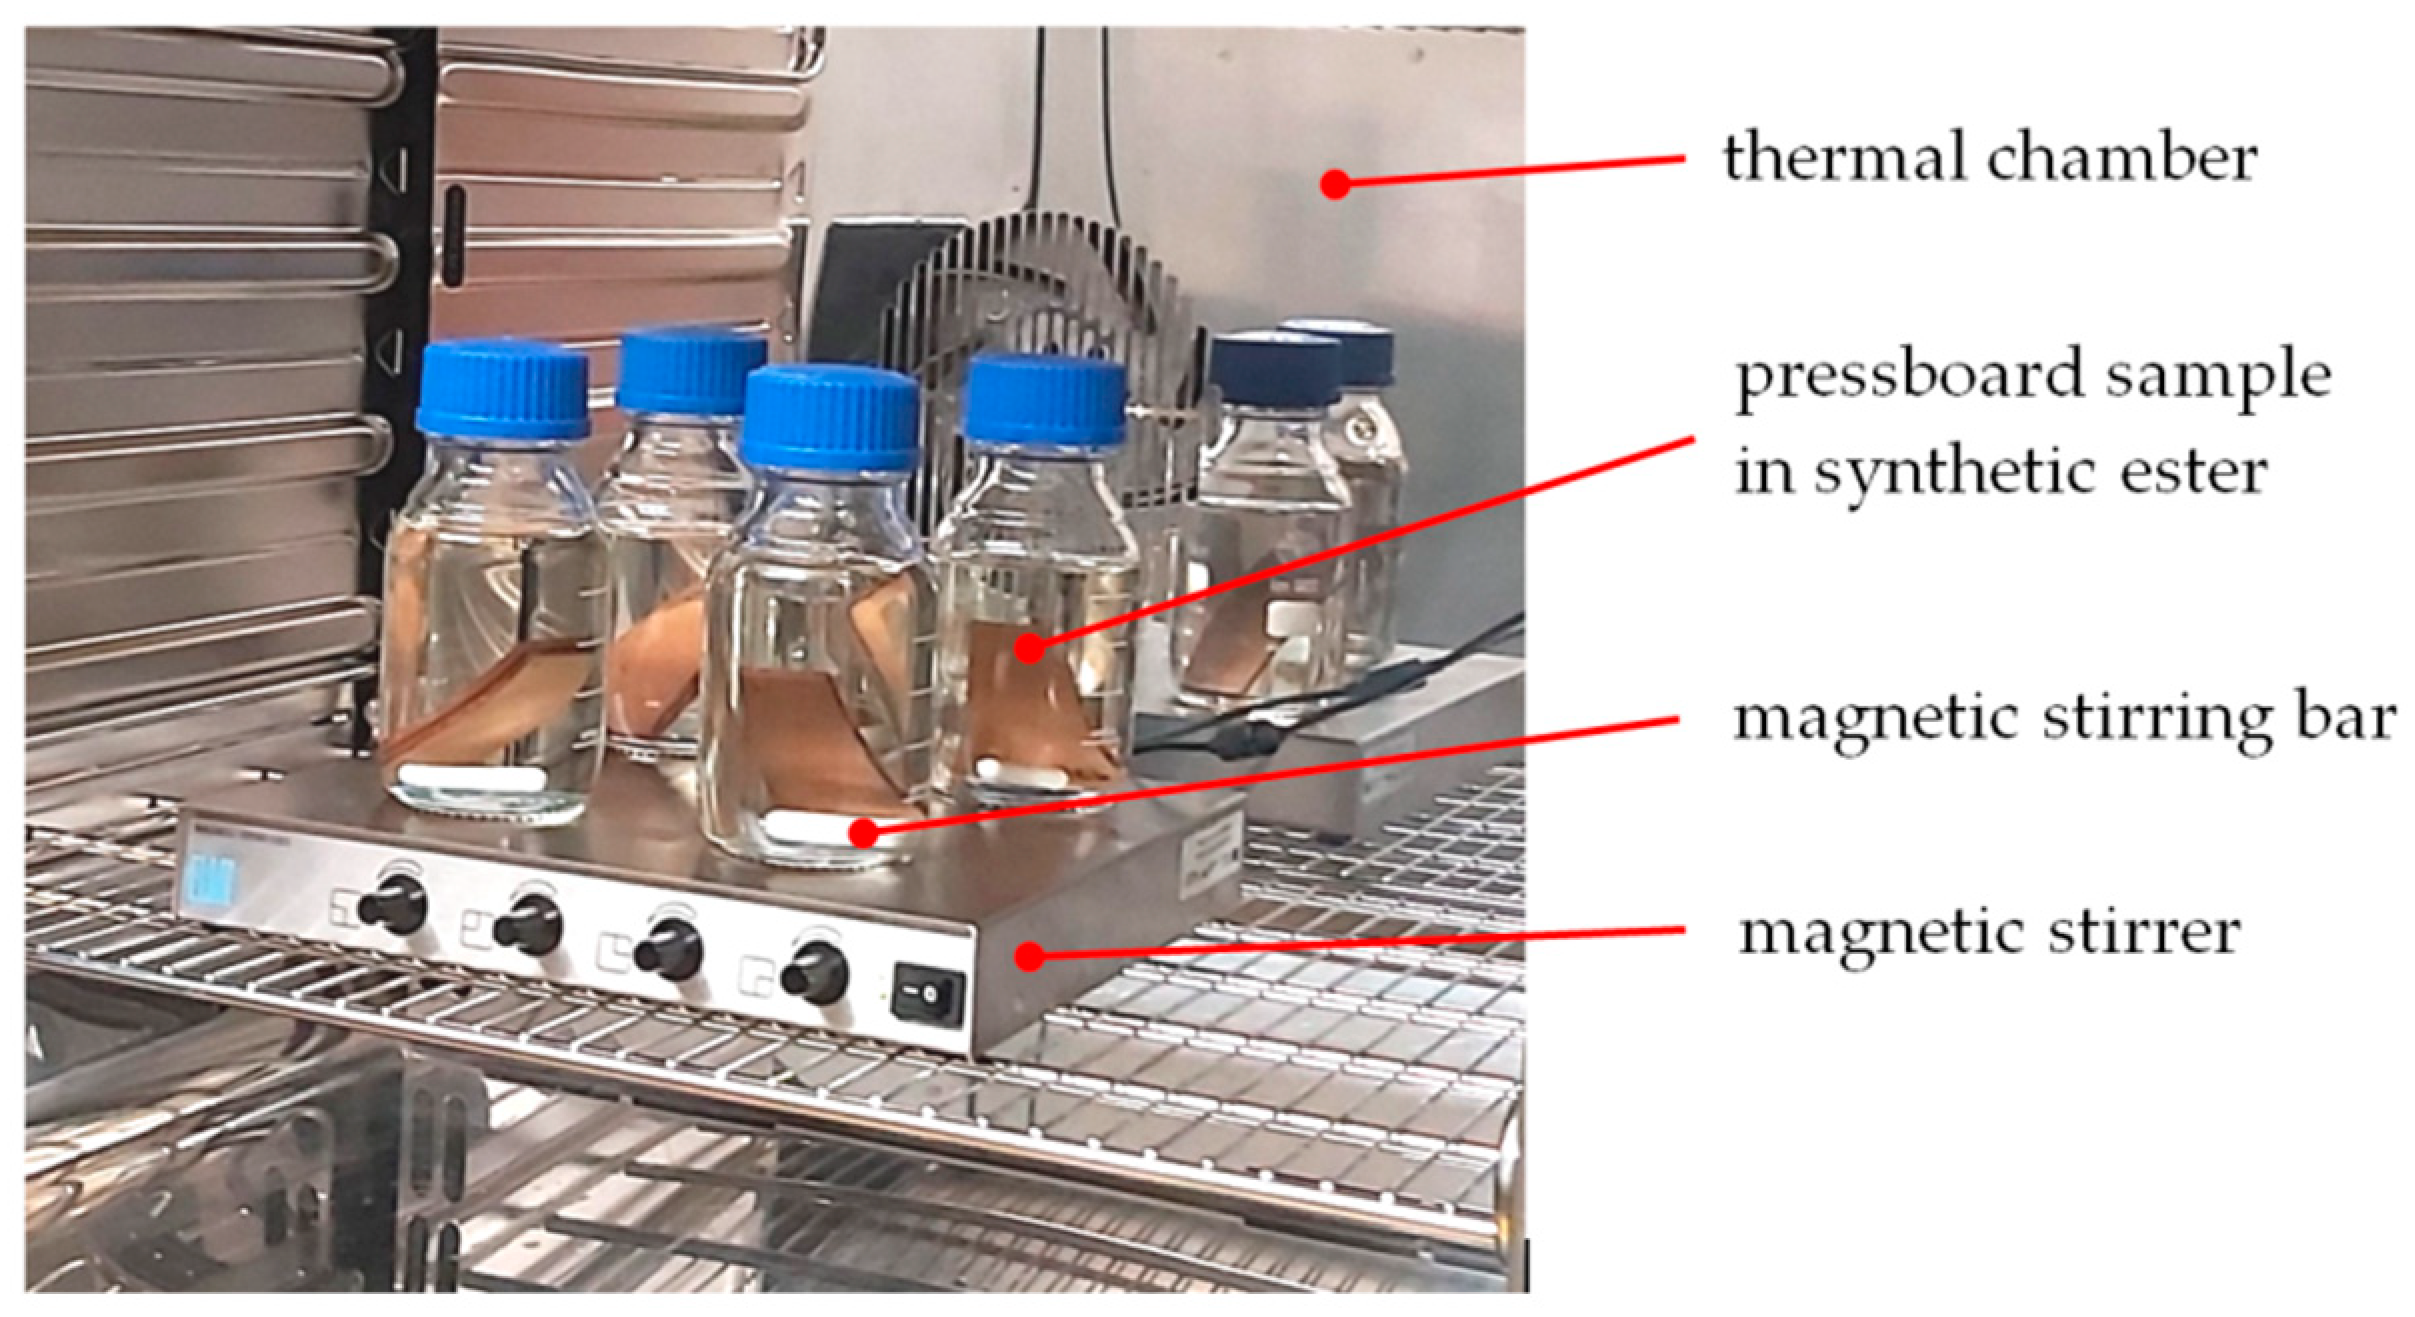
4.3. Expermental Procedure

The experimental procedure is presented in Figure 3. At the beginning the cellulose samples of initial water content WCPi impregnated with mineral oil were placed in a glass bottles filled with synthetic ester of water content WCEi. The bottles were placed in a thermal chamber, which kept the drying temperature T constant (Figure 4). The motion of the ester inside the bottles was forced by a magnetic stirrer.
The first drying stage lasted 48 h. After this time, the water content in synthetic ester WCEI was measured using the KFT method (Figure 5), and the moistened ester was replaced with a dry one. After a further 48 h of drying, the water content in ester WCEII was measured again and the ester was replaced with dry one. The third and final drying stage ended after 168 h. After this time, the water content in ester WCEIII was measured last time. The final water content in the pressboard (WCPf) was also measured using the KFT method.
Based on the measured water content in the synthetic ester (WCEI, WCEII) and the mass of cellulose and the mass of ester it was possible to calculate the water content in pressboard samples after drying time equal to 48 h and 96 h, respectively.

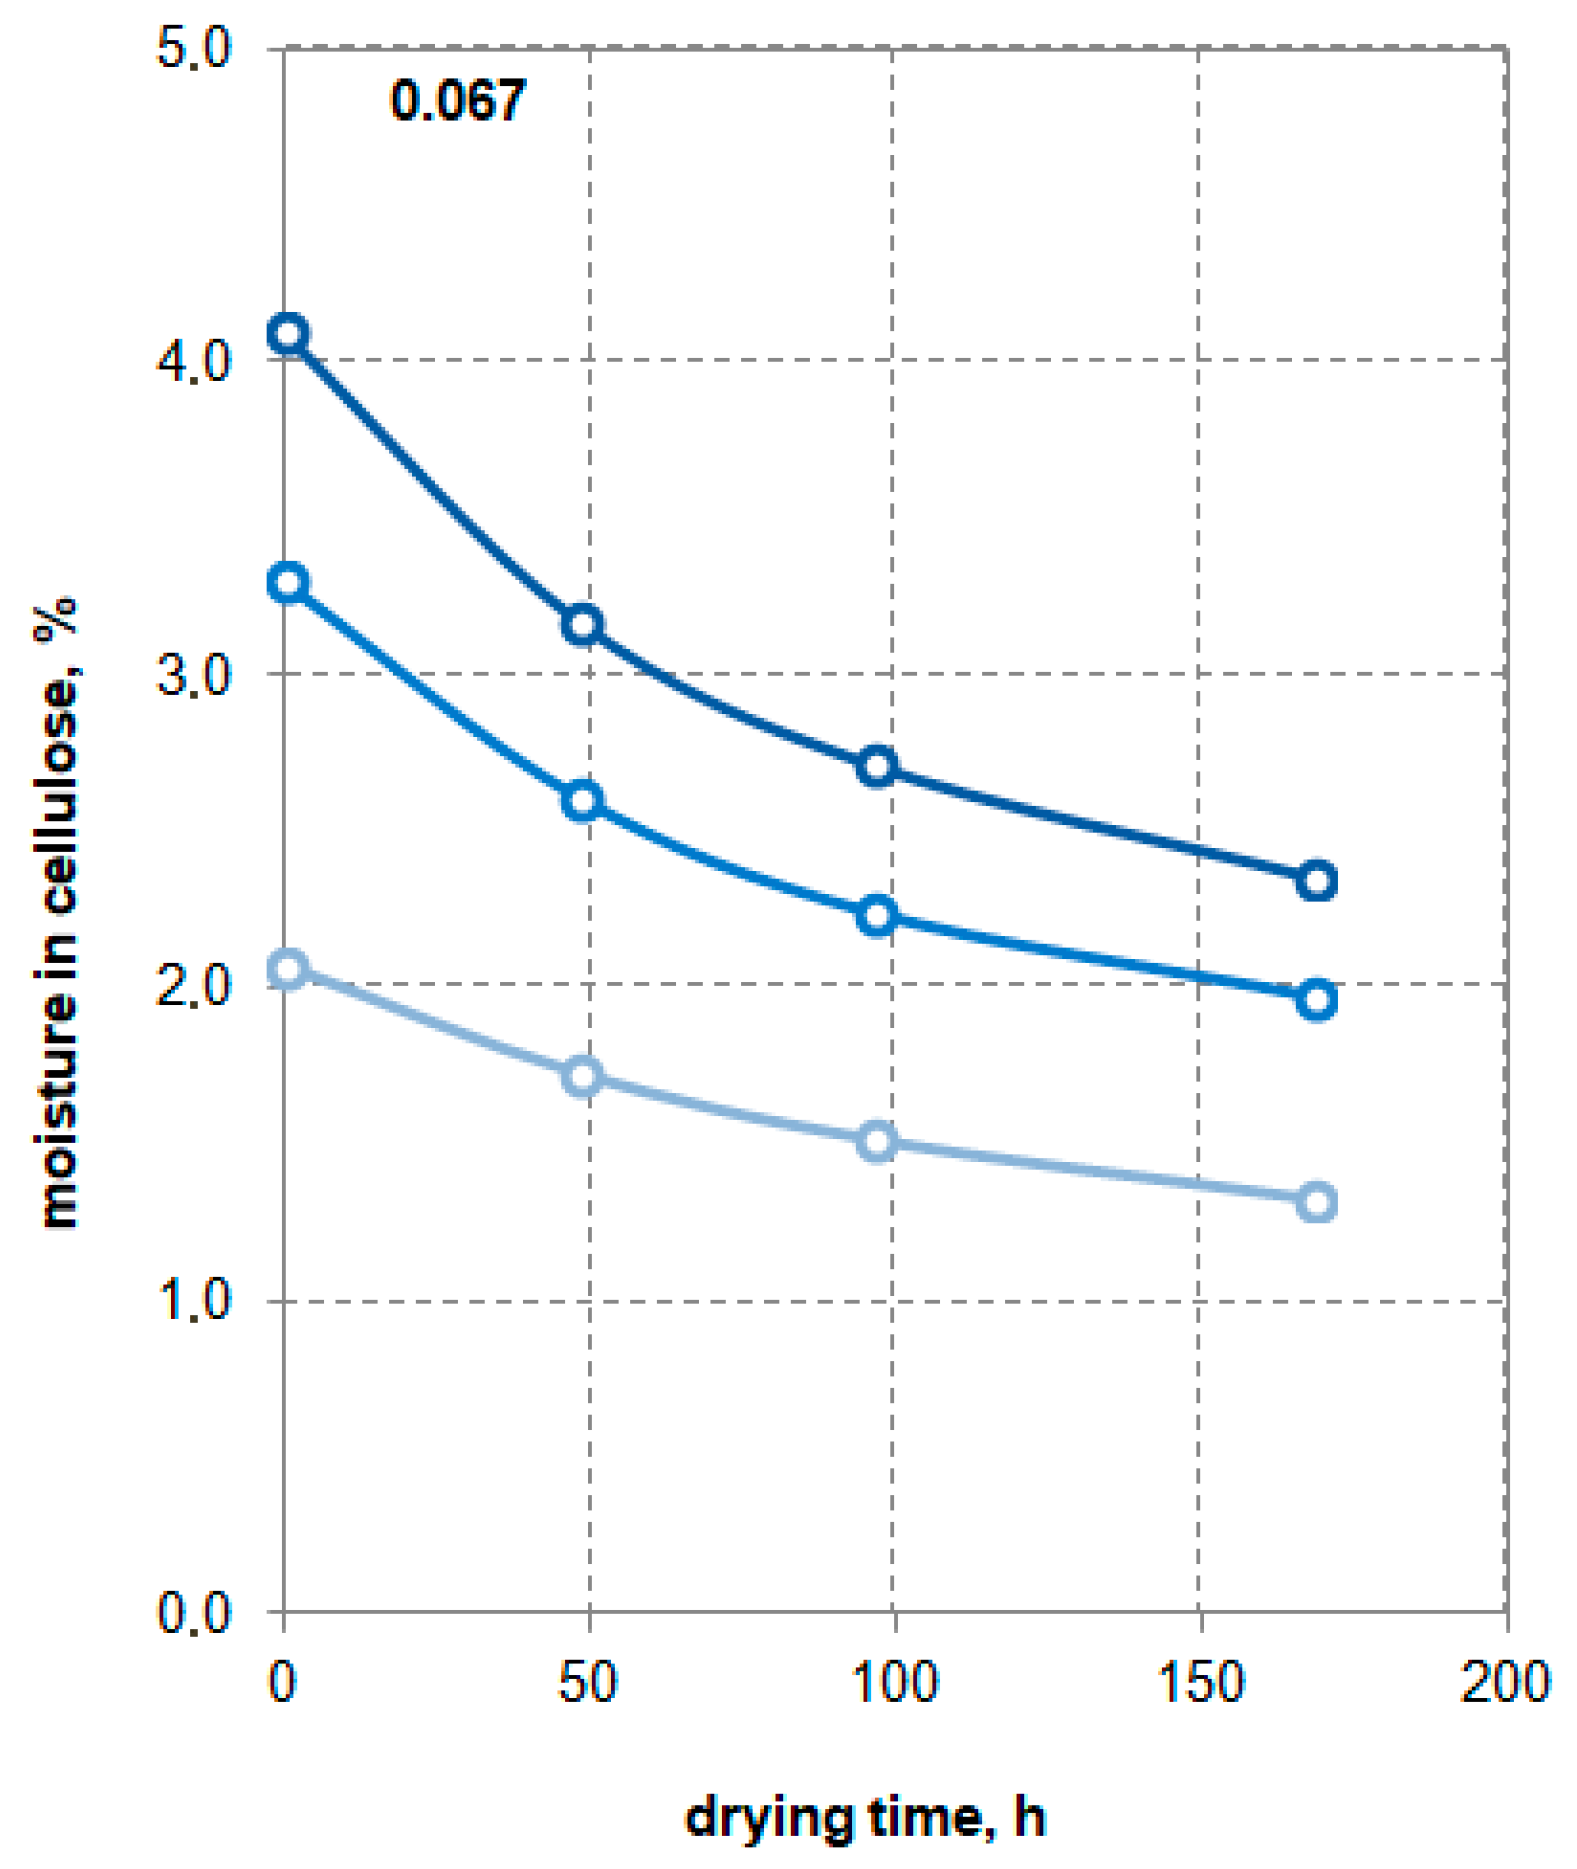
4.4. Investigation Results

Figure 6 shows the water loss in cellulose during its drying, depending on the initial moisture content of the cellulose. The curves are made for three values of drying temperature (55, 70, and 85 °C). The thickness of the samples was 3 mm. Dry synthetic ester (with a moisture content of 50 to 70 ppm) was introduced into the cellulose sample chambers three times. The first portion of the ester was kept in the chamber in the time range of 0–48 h, the second in the time range of 48–96 h, and the third in the range of 96–168 h. It should be noted that the introduction of the ester three times, according to our estimates, gives a similar effect to drying continuously. Under real conditions, continuous drying corresponds to the circulation of the ester between the transformer tank and the ester heating and drying unit. Figure 6a refers to the mass ratio of cellulose to ester 0.033, while Figure 6b to the mass ratio 0.067. A very large influence of temperature on the intensity of the drying process can be seen. The amount of water removed from cellulose in the described conditions is approximately proportional to its initial moisture. The effect of the mass ratio of cellulose to ester on the intensity of the drying process is small.
Figure 7 shows the water content of cellulose samples depending on the drying time, with three times the introduction of a dry synthetic ester with an initial moisture content of 70 ppm. The temperature was 85 °C. A decrease can be observed in the dynamics of the drying process with the time and reduction of moisture in cellulose.
When starting the research, it was assumed that the initial moisture content of the ester has a significant impact on the cellulose drying process efficiency. Figure 8 shows the water loss in cellulose samples, in percentage points, depending on the initial moisture content of the ester. The weight ratio of cellulose to ester was 0.067, the thickness of the samples was 3 mm, and the drying time was 168 h, while the temperature was 70 °C (Figure 8a) and 85 °C (Figure 8b).
It is easier to assess the drying efficiency by analyzing the percentage water loss, as shown in Figure 9. For example, a 3% moisture cellulose sample dried for 168 h with a 70 ppm moisture ester at 85 °C loses about 40% of water, and if a 220 ppm moisture ester is used, cellulose may lose about 34% of water. The influence of different ester moistures within the tested limits (70–220 ppm) is not significant. This can be explained by using Figure 10, prepared on the basis of CIGRE documents [2]. This figure shows the moisture of the ester in equilibrium state depending on the cellulose moisture. It can be seen that the moisture content of the ester used in the experiment is far from equilibrium state at which the cellulose drying process ends.
A good illustration of the large impact of temperature on the efficiency of the drying process is Figure 11. However, Figure 12 shows that the effectiveness of this process is slightly dependent on the moisture of the ester. Therefore, when planning the transformer drying procedure, the highest possible temperature should be provided. On the other hand, an ester with a moisture content of even 220 ppm will fulfill its task—under the condition that we ensure its high temperature (at least 85 °C).
The experiments are summarized in Figure 13. The moisture content of cellulose at various drying times (48, 96, and 168 h) is shown for the worst drying parameters (220 ppm, 55 °C) and the best (70 ppm, 85 °C). For initial moisture of cellulose, about 3% and 4%, after the whole drying process (168 h), differences in cellulose moisture are at the level of about 1 percent point. This fact should be taken into account when planning the transformer drying procedure, paying particular attention to ensure high temperature of the drying process.

5. Conclusions

There are two groups of methods that allow on-site transformer drying. The first group includes methods consisting of heating the insulation by means of oil, air, solvent vapors, or low-frequency current and applying a vacuum [8,13,14]. To sufficiently dry the transformer insulation a vacuum equal to 1 mbar have to be applied [8,15]. The necessity of vacuum application is the biggest disadvantage of these methods. In cases involving many distribution transformers an underpressure of just 500 mbar can be used, due to the low mechanical strength of their tanks. Moreover, the application of the vacuum may result in deimpregnation of cellulose materials, which leads to deterioration of dielectric parameters of insulation.
The second group of methods is based on the use of mineral oil as a drying medium. These methods are much safer for transformers than vacuum ones, while their biggest drawback is their low drying efficiency. The authors of [16] proved the higher drying efficiency when applying natural ester. It should be pointed out that the water solubility in synthetic ester is much higher than in mineral oil and natural ester; therefore, better drying efficiency should be expected for this liquid.
The method proposed by authors, based on the use of synthetic ester for drying cellulose insulation, is free from disadvantages of methods based on applying vacuum and is much more efficient than drying the insulation by means of mineral oil which was proved in our previous research [10].
The drying efficiency of cellulose insulation using a synthetic ester depends, to varying degrees, on cellulose moisture, insulation temperature, drying time, mass ratio of cellulosic materials to ester, and initial water content in ester which was the subject of the research described in this article. The main conclusions from this research are given below.
The initial moisture content in cellulose is very important. At the temperature used in the experiment, equal to 55, 70, and 85 °C, there was water loss (in percentage points) during the drying process, approximately proportional to the initial moisture of cellulose.
A very large influence of temperature on the efficiency of the drying process was found. For example, with a mass ratio cellulose to ester of 0.067, increasing the temperature from 55 to 85 °C results in at least a two-fold increase in cellulose water loss for all investigated initial moisture values of cellulose (2%, 3%, and 4%).
With the time of drying its dynamics decreases, which is understandable, as the cellulose-ester system approaches the moisture equilibrium state.
The conducted research shows that when drying a transformer using a synthetic ester, special attention should be paid to ensuring the highest possible process temperature, which may be difficult in winter conditions. In such a situation, thermal insulation of the transformer tank should be used.
It was found that the moisture content of the ester from 70–220 ppm—with significant moisture content of the transformer cellulose insulation, equal to 2%, 3%, and 4%—does not have a significant impact on the intensity of the drying process. However, with a relatively low moisture content of insulation, below 2% at low temperature (below 50 °C), the effect of moisture on the ester may be noticeable.
In case of low temperature and thick cellulose insulation, the drying time may exceed 168 h due to low water migration within this material. It is related with moisture diffusion coefficients which were described in [17,18].
On the basis of obtained results, the next study related to drying cellulose by means of ester circulating between the transformer tank and a drying unit is planned. The final result of these investigations will be finding a means to achieve optimal drying conditions on the basis of which a mobile system for on-site drying of transformer’s insulation will be developed.

Author Contributions

Conceptualization and methodology, P.P., H.M.-G., and H.M.; Validation, P.P. and H.M.; Formal analysis, P.P., H.M.-G., and H.M.; Investigation, P.P., H.M., and M.C.; Resources, P.P. and H.M.; Data curation, P.P.; Writing—original draft, H.M. and H.M.-G.; Writing—review and editing, P.P. and H.M.; Visualization, H.M.; Supervision, P.P. and H.M.; Project administration, H.M.; Funding acquisition, H.M. and P.P. All authors have read and agreed to the published version of the manuscript.

Funding

This research was funded by the Polish National Center for Research and Development from the funds of Subactivity 4.1.2 “Regional research and development agendas” under the project POIR.04.01.02-00-0045/17-00 entitled “Mobile insulation drying system for distribution transformers using a liquid medium”; the total value of the project is PLN 7,677,957, including co-financing from the National Center for Research and Development PLN 6,084,569.

Conflicts of Interest

The authors declare no conflict of interest.

References

  1. Moser, H.P.; Dahinden, V. Transformerboard; Scientia Electra: Vermont, VT, USA, 1979; pp. 1–120. [Google Scholar]
  2. Athanassatou, H.; Duart, J.C.; Perrier, C.; Sitar, I.; Walker, J.; Claiborne, C.; Boche, T.; Cherry, D.; Darwin, A.; Gockenbach, E.; et al. Experiences in Service with New Insulating Liquids; Cigré Technical Brochure 436; International Council on Large Electric Systems (CIGRE): Paris, France, 2010. [Google Scholar]
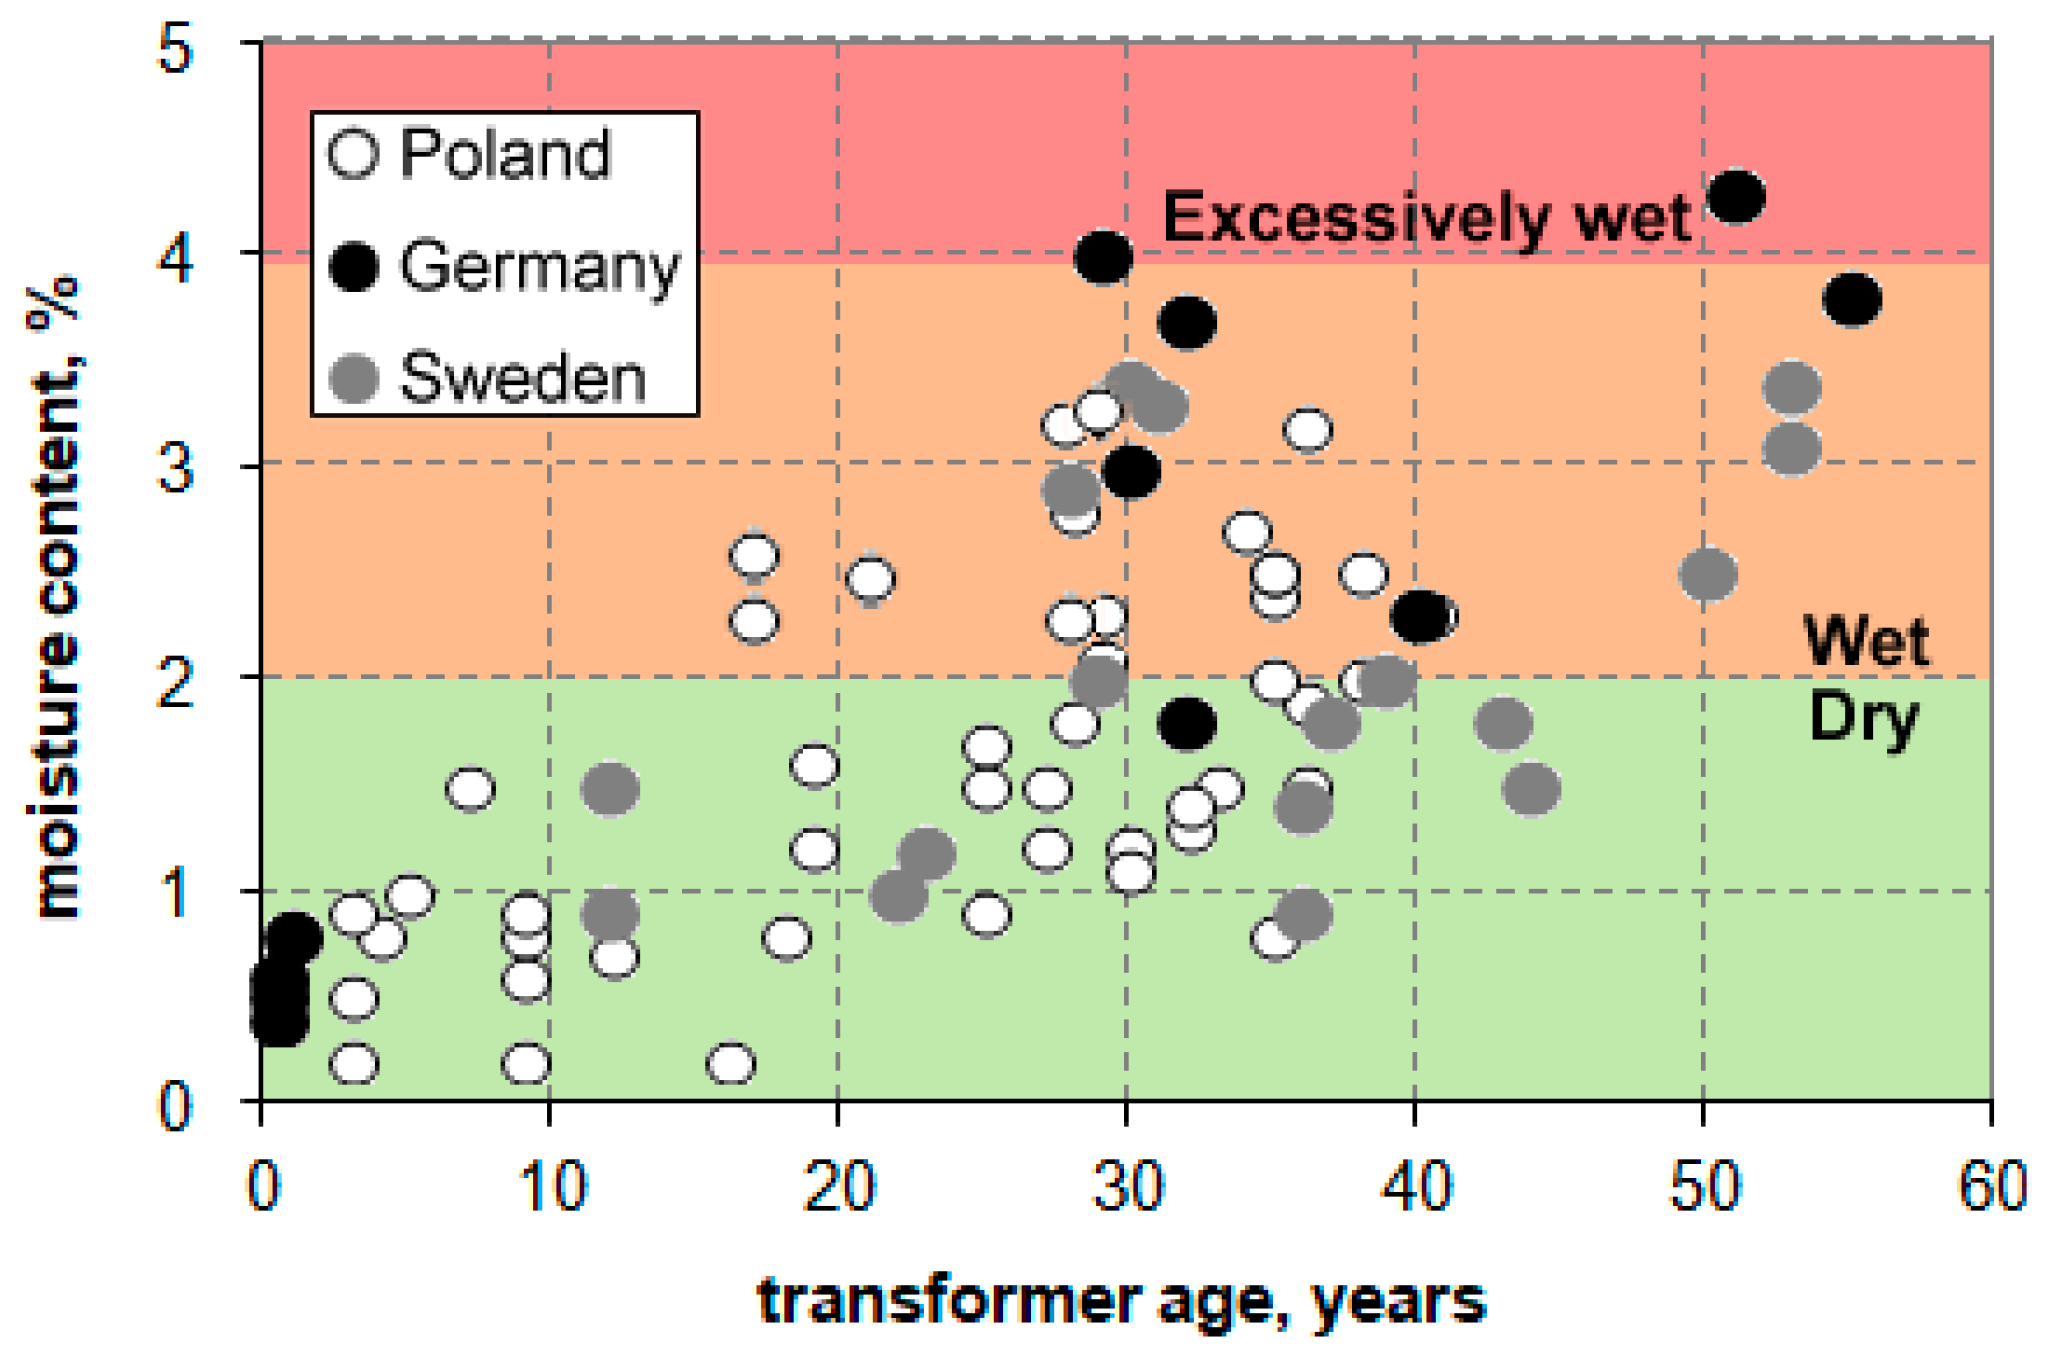
  3. Gielniak, J.; Graczkowski, A.; Moranda, H.; Przybylek, P.; Walczak, K.; Nadolny, Z.; Moscicka-Grzesiak, H.; Feser, K.; Gubanski, S.M. Moisture in cellulose insulation of power transformers—Statistics. IEEE Trans. Dielectr. Electr. Insul. 2013, 20, 982–987. [Google Scholar] [CrossRef]
  4. IEEE Std. 62-1995. IEEE Guide for Diagnostic Field Testing of Electric Power Apparatus—Part 1: Oil Filled Power Transformers, Regulators, and Reactors; IEEE: Piscataway, NJ, USA, 1995. [Google Scholar] [CrossRef]
  5. Oommen, T.V.; Lindgren, S.R. Bubble evolution from transformer overload. In Proceedings of the Transmission and Distribution Conference Exposition, Atlanta, GA, USA, 2 November 2001; pp. 137–142. [Google Scholar] [CrossRef]
  6. Przybylek, P. Investigations of the temperature of bubble effect initiation oil-paper insulation. Prz. Elektrotechniczny 2010, 86, 166–169. [Google Scholar]
  7. Walczak, K. Drying Methods of Power Transformer’s Solid Insulation in the Place of its Installation. In Proceedings of the International Transformer Conference Transformator’13, Gdansk, Poland, 6–8 June 2013; pp. 1–9. [Google Scholar]
  8. Koestinger, P.; Aronsen, E.; Boss, P.; Rindlisbacher, G. Practical Experience with the Drying of Power Transformers in the Field, Applying the LFH Technology; International Council on Large Electric Systems (CIGRE): Paris, France, 2004. [Google Scholar]
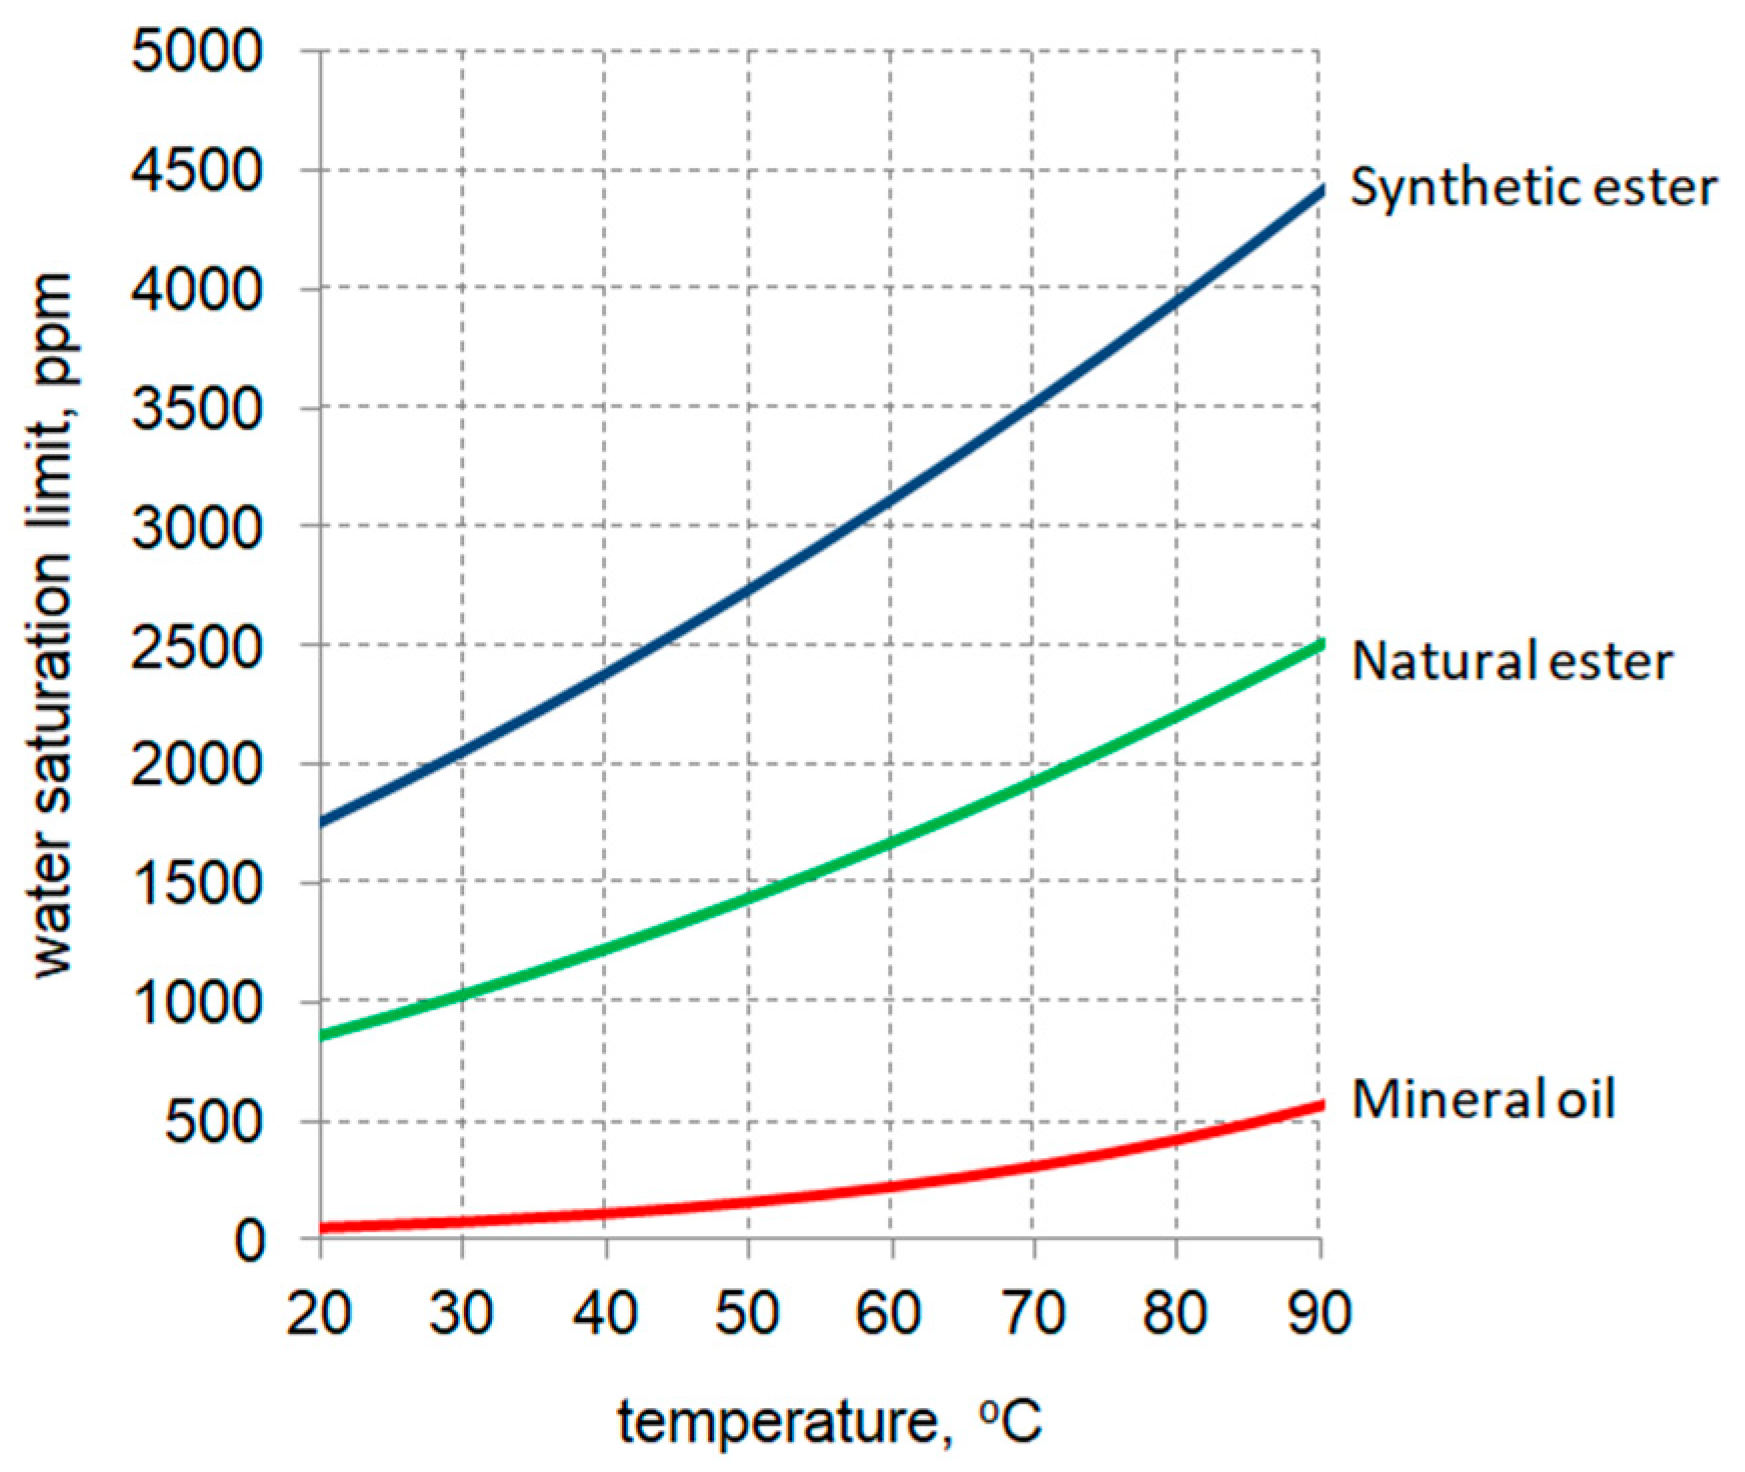
  9. Przybylek, P. Water saturation limit of insulating liquids and hygroscopicity of cellulose in aspect of moisture determination in oil-paper insulation. IEEE Trans. Dielectr. Electr. Insul. 2016, 23, 1886–1893. [Google Scholar] [CrossRef]
  10. Przybylek, P. Drying transformer cellulose insulation by means of synthetic ester. IEEE Trans. Dielectr. Electr. Insul. 2017, 24, 2643–2648. [Google Scholar] [CrossRef]
  11. Przybylek, P.; Moranda, H.; Moscicka-Grzesiak, H.; Szczesniak, D. Application of Synthetic Ester for Drying Distribution Transformer Insulation—The Influence of Cellulose Thickness on Drying Efficiency. Energies 2019, 12, 3874. [Google Scholar] [CrossRef] [Green Version]
  12. IEC 60814. Insulating Liquids—Oil-Impregnated Paper and Pressboard—Determination of Water by Automatic Coulometric Karl Fischer Titration; International Electrotechnical Commission (IEC): Geneva, Switzerland, 1997. [Google Scholar]
  13. Bosigner, J. The Use of Low Frequency Heating Techniques in the Insulation Drying Process for Liquid Filled Small Power Transformers. In Proceedings of the 2001 IEEE/PES Transmission and Distribution Conference and Exposition Developing New Perspectives, Atlanta, GA, USA, 2 November 2001; pp. 688–692. [Google Scholar] [CrossRef]
  14. Przybylek, P. A new concept of applying methanol to dry cellulose insulation at the stage of manufacturing a transformer. Energies 2018, 11, 1658. [Google Scholar] [CrossRef] [Green Version]
  15. Betie, A.; Meghnefi, F.; Fofana, I.; Yeo, Z. Modeling the insulation paper drying process from thermogravimetric analyses. Energies 2018, 11, 517. [Google Scholar] [CrossRef] [Green Version]
  16. Villarroel, R.; Garcia, B.; Garcia, D.F.; Burgos, J.C. Assessing the use of natural esters for transformer field drying. IEEE Trans. Power Deliv. 2004, 29, 1894–1900. [Google Scholar] [CrossRef]
  17. Garcia, D.F.; Villarroel, R.; Garcia, B.; Burgos, J.C. Effect of the thickness on the water mobility inside transformer cellulose insulation. IEEE Trans. Power Deliv. 2016, 31, 955–962. [Google Scholar] [CrossRef]
  18. Garcia, D.F.; Garcia, B.; Burgos, J.C. A review of moisture diffusion coefficients in transformer solid insulation-part 1: Coefficients for paper and pressboard. IEEE Electr. Insul. Mag. 2013, 29, 46–54. [Google Scholar] [CrossRef]
Figure 1. Dependence of water content in cellulose insulation on transformer age in the whole investigated population divided into three moisture ranges as per IEEE classification, on the basis of data from [3].
Energies 13 03467 g001
Figure 2. Comparison of the water saturation limit of four selected insulating liquids, on the basis of data from [9].
Energies 13 03467 g002
Figure 3. Drying procedure; WCE—water content in ester; WCP—water content in pressboard.
Energies 13 03467 g003
Figure 4. Measurement setup used for drying pressboard samples by means of synthetic ester.
Energies 13 03467 g004
Figure 5. Instrument for measuring water content by Karl Fischer coulometric titration method.
Energies 13 03467 g005
Figure 6. Water loss in samples depending on the initial moisture content of the cellulose at different temperatures; sample thickness 3 mm; initial moisture of the ester 70 ppm; total drying time 168 h—with the three times introduction of the ester; mass ratio of cellulose to ester of 0.033 (a) and 0.067 (b).
Energies 13 03467 g006
Figure 7. Water content in cellulose samples depending on drying time for three different values of initial moisture of cellulose; mass ratio of cellulose to ester 0.067, samples thickness 3 mm, temperature 85 °C; triple introduction of an ester with moisture content of 70 ppm.
Energies 13 03467 g007
Figure 8. Water loss in cellulose in percentage points depending on the initial moisture of the three times introduced ester; initial moisture of cellulose 2%, 3%, and 4%, insulation thickness 3 mm, mass ratio of cellulose to ester 0.067, drying time 168 h; temperature 70 °C (a) and 85 °C (b).
Energies 13 03467 g008
Figure 9. Percentage water loss in cellulose depending on the initial moisture of the three times introduced ester; initial moisture of cellulose 2%, 3%, and 4%, insulation thickness 3 mm, mass ratio of cellulose to ester 0.067, total drying time 168 h; temperature 70 °C (a) and 85 °C (b).
Energies 13 03467 g009
Figure 10. Moisture of the ester in the equilibrium state of the cellulose-ester system depending on the moisture content of cellulose for various temperatures; prepared on the basis of data from [2].
Energies 13 03467 g010
Figure 11. Cellulose moisture depending on the drying time for three temperatures (55, 70, and 85 °C); sample thickness 3 mm, ester with a moisture content of 70 ppm was introduced three times, the mass ratio of cellulose to ester 0.067.
Energies 13 03467 g011
Figure 12. Cellulose moisture depending on the drying time for three initial values of moisture of the ester introduced three times (70, 140, and 220 ppm); sample thickness 3 mm, temperature 85 °C, mass ratio of cellulose to ester 0.067.
Energies 13 03467 g012
Figure 13. Cellulose moisture in the drying process depending on the drying time—comparison for the worst (pink color: 220 ppm, 55 °C) and best (green color: 70 ppm, 85 °C) drying process conditions; initial moisture of cellulose ~3% and ~4%, thickness of samples 3 mm, mass ratio of cellulose to ester 0.067.
Energies 13 03467 g013
Table 1. Samples preparation parameters.
Assumed Water Content in Samples (%)Drying Conditions
(Vacuum Chamber)
Moisture Conditions
(Climatic Chamber *)
Mineral Oil Impregnation Conditions
(Vacuum Chamber)
Stabilization Conditions
(Climatic Chamber *)
Water Content in Samples Determined by KFT (%)
2T = 85–95 °C
p = 0.2–0.4 mbar
t = 26–29 h
T = 80 °CT = 80 °CT = 80 °C2.07
RH = 10%p = 60 mbarRH = 10%
t = 264 ht = 15 mint = 144 h
3T = 40 °CT = 40 °CT = 40 °C3.32
RH = 12%p = 8 mbarRH = 12%
t = 150 ht = 15 mint = 144 h
4T = 40 °CT = 40 °CT = 40 °C4.09
RH = 21%p = 10 mbarRH = 21%
t = 316 ht = 15 mint = 144 h
(*) temperature fluctuation ≤ 1.3 °C; relative humidity fluctuation ≤ 2.5% RH.

