Article

Electrostatic Charging Tendency Analysis Concerning Retrofilling Power Transformers with Envirotemp FR3 Natural Ester

Faculty of Electrical Engineering, Automatic Control and Informatics, Opole University of Technology, Prószkowska 76, 45-758 Opole, Poland
Energies 2020, 13(17), 4420; https://doi.org/10.3390/en13174420
Submission received: 30 July 2020 / Revised: 21 August 2020 / Accepted: 24 August 2020 / Published: 27 August 2020
(This article belongs to the Special Issue High Voltage Insulating Materials-Current State and Prospects)

Abstract

:
Natural and synthetic esters are liquids characterized by insulating properties, high flash point, and biodegradability. For this reason, they are more and more often used as an alternative to conventional mineral oils. Esters are used to fill new or operating transformers previously filled with mineral oil (retrofilling). It is technically unfeasible to completely remove mineral oil from a transformer. Its small residues create with esters a mixture with features significantly different from those of the base liquids. This article presents electrostatic charging tendency (ECT) tests for mixtures of fresh and aged Trafo EN mineral oil with Envirotemp FR3 natural ester from the retrofilling point of view. Under unfavorable conditions, the flow electrification phenomenon can damage the solid insulation in transformers with forced oil circulation. The ECT of the insulating liquids has been specified using the volume density of the qw charge. This parameter has been determined using the Abedian–Sonin model on the basis of the electrification current measured in the flow system, as well as selected physicochemical properties of the liquids. It was shown that ECT is strongly dependent on the type of insulating liquid and pipe material, as well as the composition of the mixtures. The most important finding from the research is that a small amount (up to 10%) of fresh and aged mineral oil is effective in reducing the ECT of Envirotemp FR3 natural ester.

1. Introduction

The basic request of liquid dielectrics applied in power transformers is to ensure good electrical insulation and to remove heat effectively. The insulation liquids also improve the strength of cellulose paper, make it easier to extinguish electrical arcs, and protect the solid insulation against moisture and air. Most transformers being manufactured in the world are filled with mineral oils for economic reasons. The key disadvantages of mineral oils are their limited resistance to oxidation, high toxicity and explosiveness, and poor biodegradability [1]. In recent years, due to fire protection regulations and environmental protection considerations, alternative insulating liquids are becoming more popular. Among those, the most important ones include natural and synthetic esters. The physicochemical, electrical, thermal properties, and the environmental impact of mineral oils and esters used in transformers are relatively well known and described in the relevant literature [2,3,4,5,6]. For many years, electrostatic charging tendency (ECT) tests have been performed for mixtures of pure hydrocarbons, mineral oils, and liquid esters [7,8,9,10,11,12,13,14]. The process of removing mineral oil from a transformer and then refilling it with another insulating liquid is called retrofilling [15,16,17,18]. It is technically impossible, however, to completely remove mineral oil from a transformer. Its small amount (4–7%) usually remains within the paper insulation, and, to a small extent, in hardly accessible places of the transformer tank [19]. As a consequence, in the transformer, a mixture of two insulating liquids with unknown properties is formed; they may also vary during the transformer’s operation. In many scientific facilities around the world, intensive tests are being performed regarding the features of insulating liquid mixtures in terms of retrofilling. Beroual et al. [20] presented a comparative study of AC and DC breakdown voltage of naphthenic mineral oil, Midel 7131 synthetic ester, Envirotemp FR3 natural ester, and different mixtures based on these liquids. It showed that the ester oils always have a significantly higher breakdown voltage than mineral oil. The addition of natural or synthetic ester considerably increases the breakdown voltage of mineral oil. These authors demonstrated that transformer refilling can be considered with mixtures composed of mineral oil (20%) and ester oil (80%). Yu et al. [21] presented the research results of the physicochemical and dielectric properties of insulating mixtures based on Karamay No. 25 mineral oil and Envirotemp FR3 natural ester. The research showed that with an increase of the natural ester content in the mixture, the dynamic viscosity, acidy, pour point, and AC breakdown voltage increased. The authors observed that the fire point of the mixtures was similar to mineral oil, while the flash point increased by 11.4%. Hamadi et al. [22] presented a comparative study of the electrical and thermal stability behavior of Borak 22 and Midel 7131 synthetic ester mixtures. The authors showed that mixing synthetic ester with mineral oil efficiently reduced the aging rate. Dombek and Gielniak [23] presented the research results of the flash point, fire point, net calorific value, breakdown voltage, relative permittivity, dissipation factor, and conductivity of mixtures of the Nynas Draco mineral oil and Midel 7131 synthetic ester with Envirotemp FR3 natural ester. It was shown that the content of the mixture significantly determined the change of the tested parameters. Zdanowski and Maleska [24] observed a high correlation between the electrification current and the composition of mixtures of Trafo EN mineral oil and Midel 1204 natural ester and Midel 7131 synthetic ester. The authors found big differences in the form of the current characteristics depending on whether the oil used was fresh or aged. Rajab et al. [25] presented research on ECT results of PFAE (palm fatty acid ester) and mineral oil mixtures at various percentage ratios of PFAE. The authors showed that electrostatic charging tendency increases with the percentage ratio of PFAE to 80% but then decreases for the liquid containing only PFAE. The purpose of this paper was to specify the ECT of mixtures which may be formed in a transformer as a result of replacing mineral oil with Envirotemp FR3 natural ester. The most important goal of the work was the most favorable range of admixing Envirotemp FR3 natural ester to Trafo EN mineral oil specified for retrofilling power transformers. In the first stage of the study, the impact of the hydrodynamic conditions and the physicochemical properties of the liquids on selected parameters of the Abedian–Sonin electrification model were analyzed. In the next stage, the electrification current of the liquids in a flow system was measured with pipes made of different materials. Then, the volume density of the qw charge, designating the ECT of the insulating liquids, was determined.

2. Materials and Methods
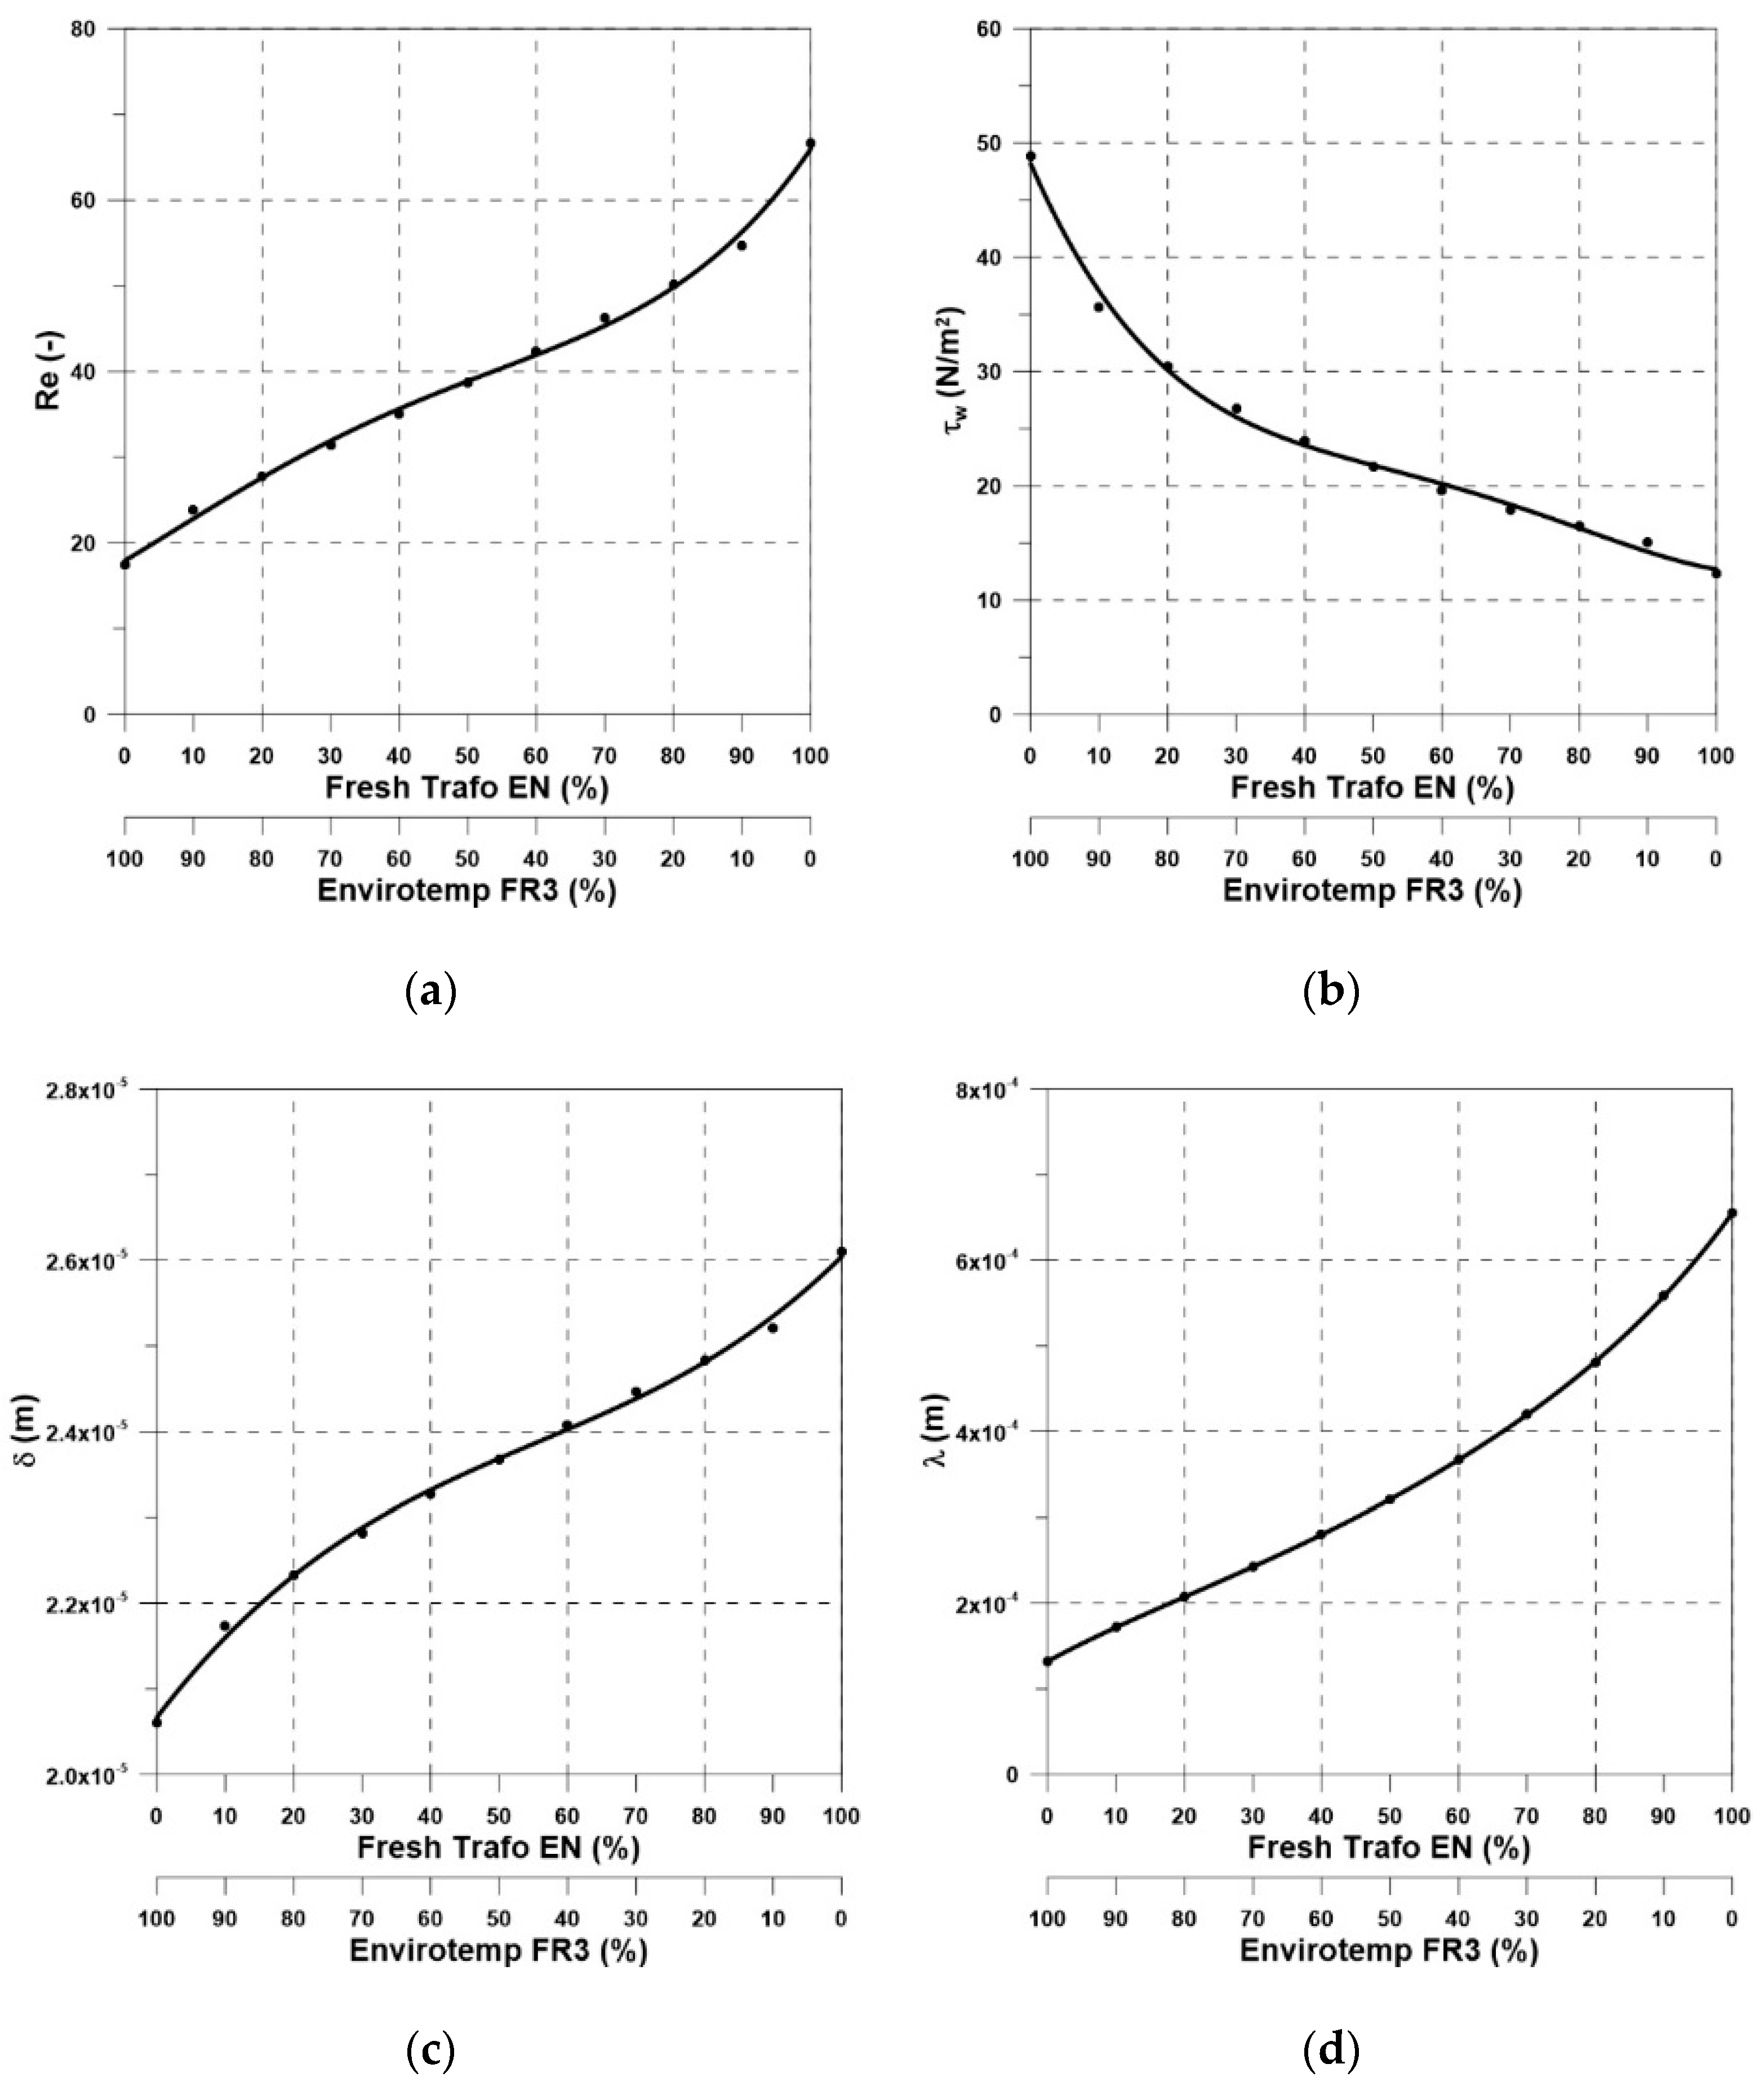
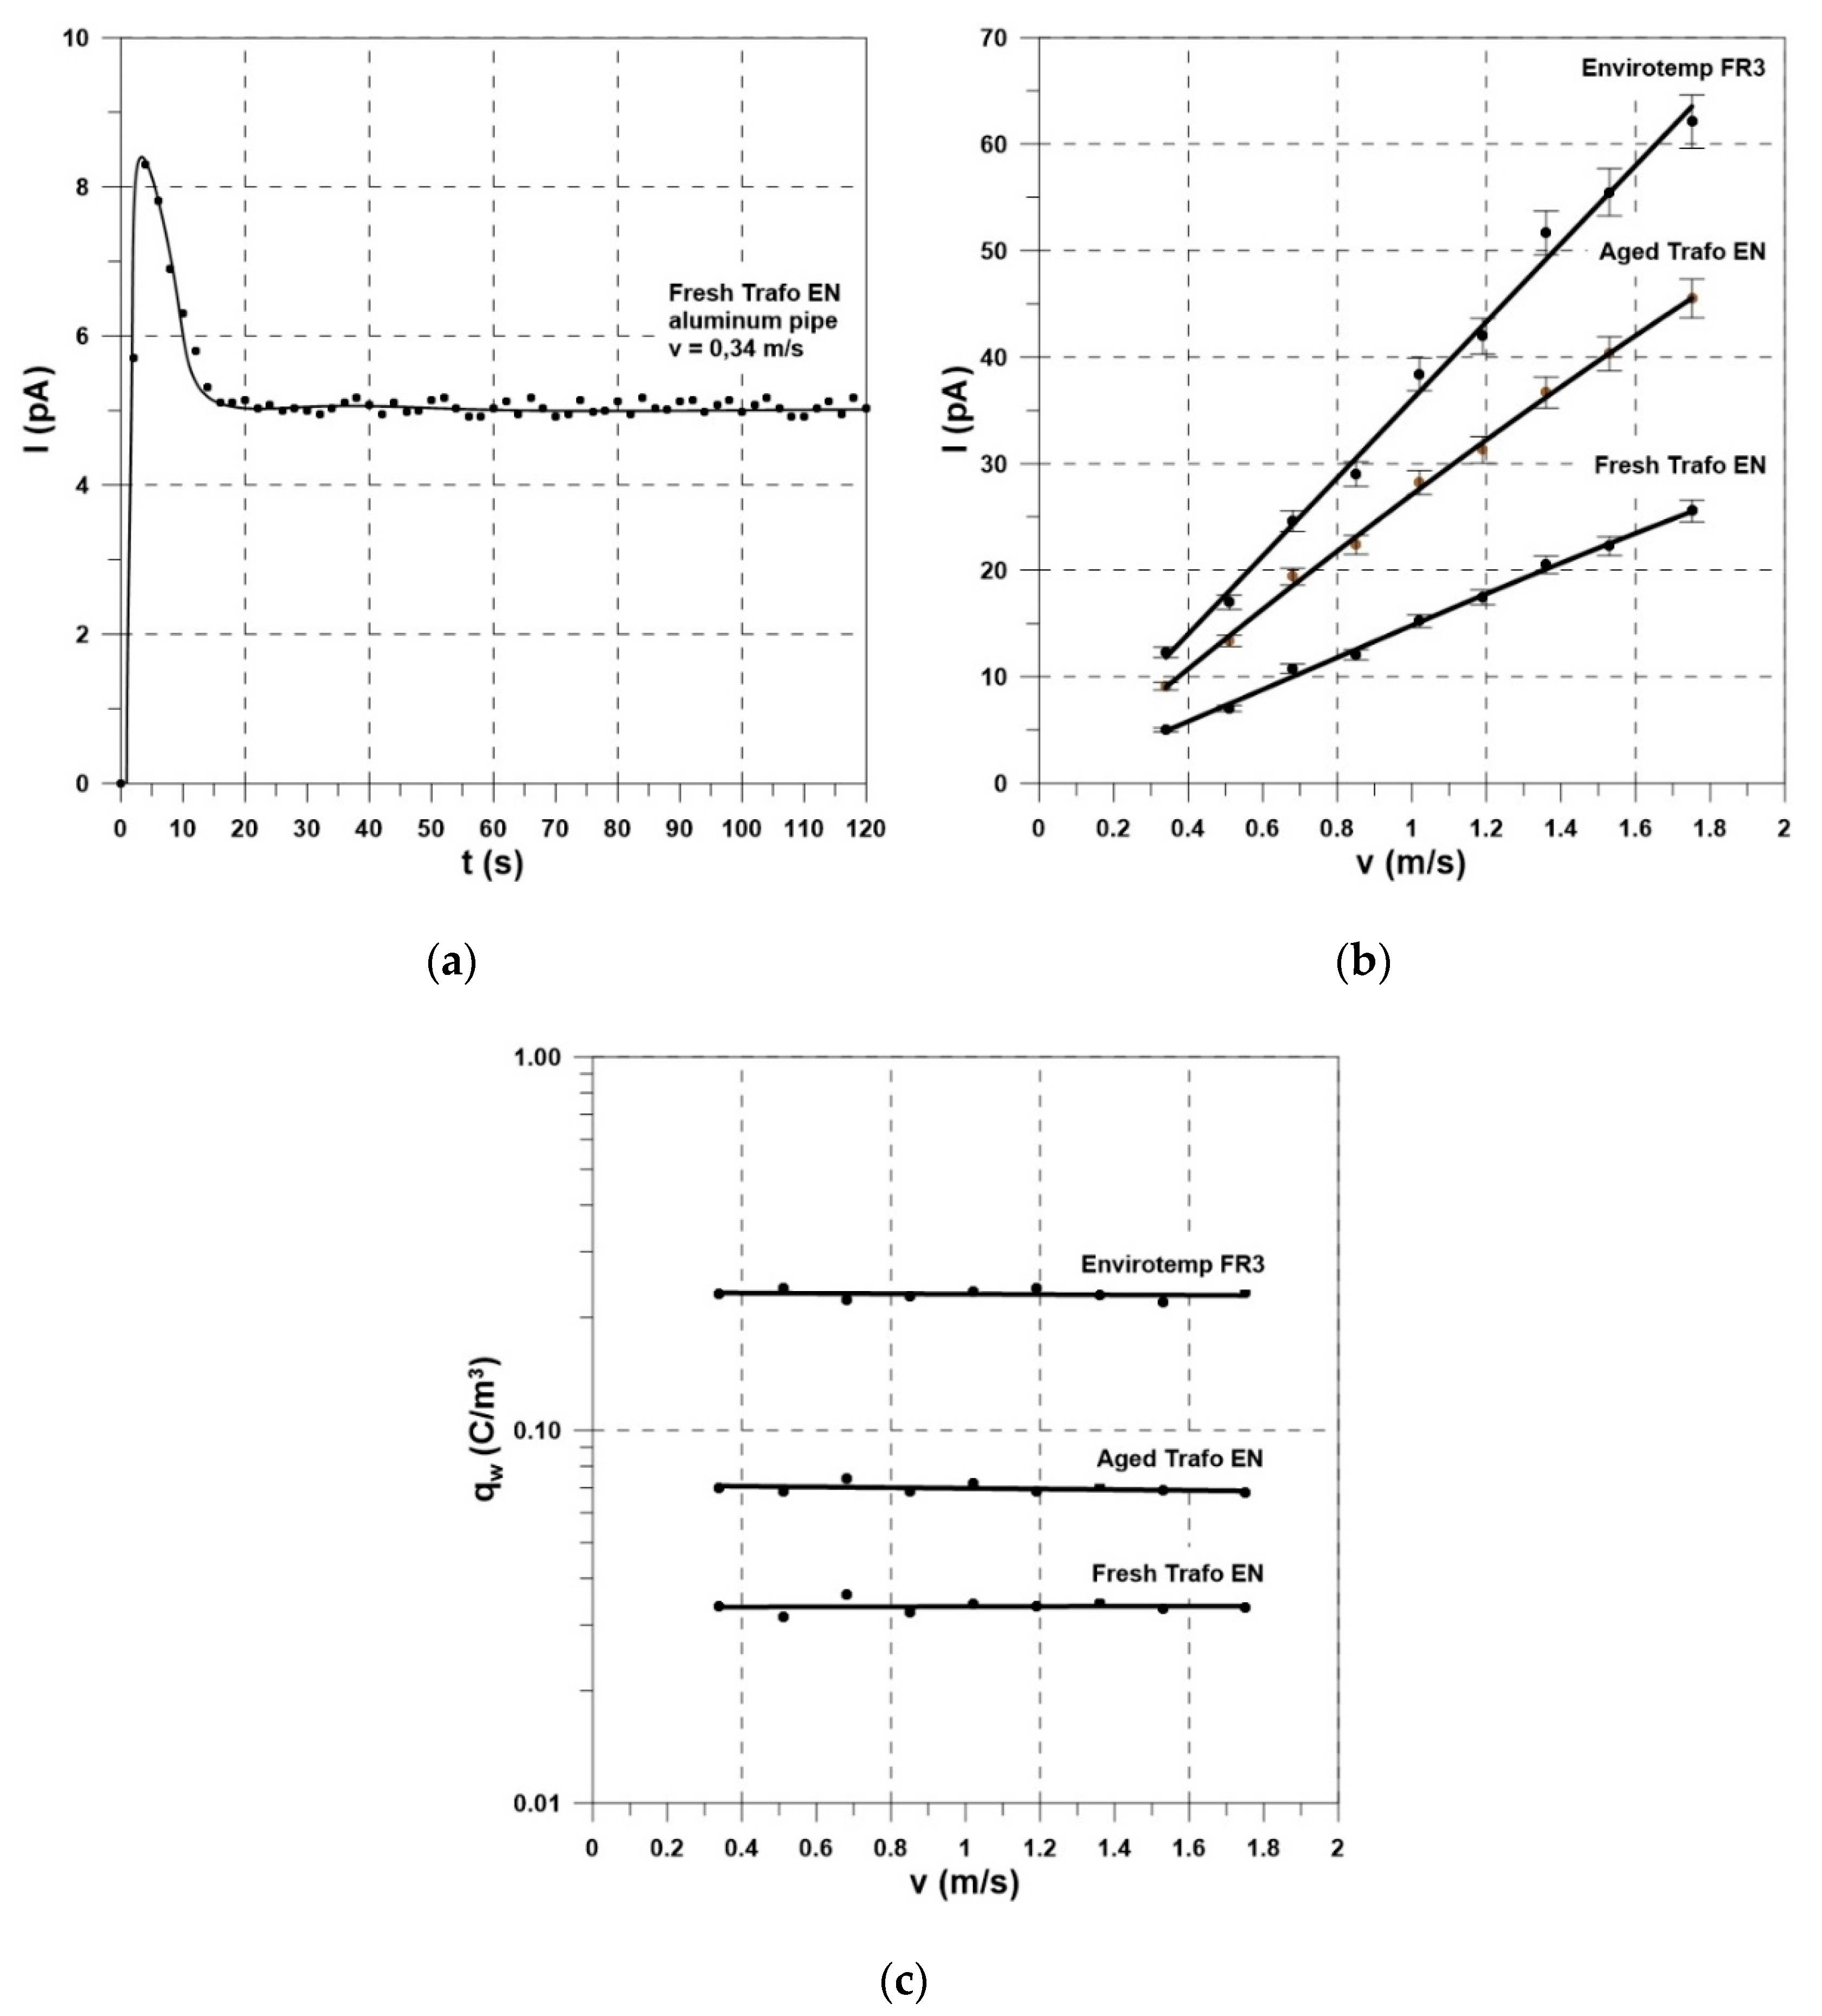
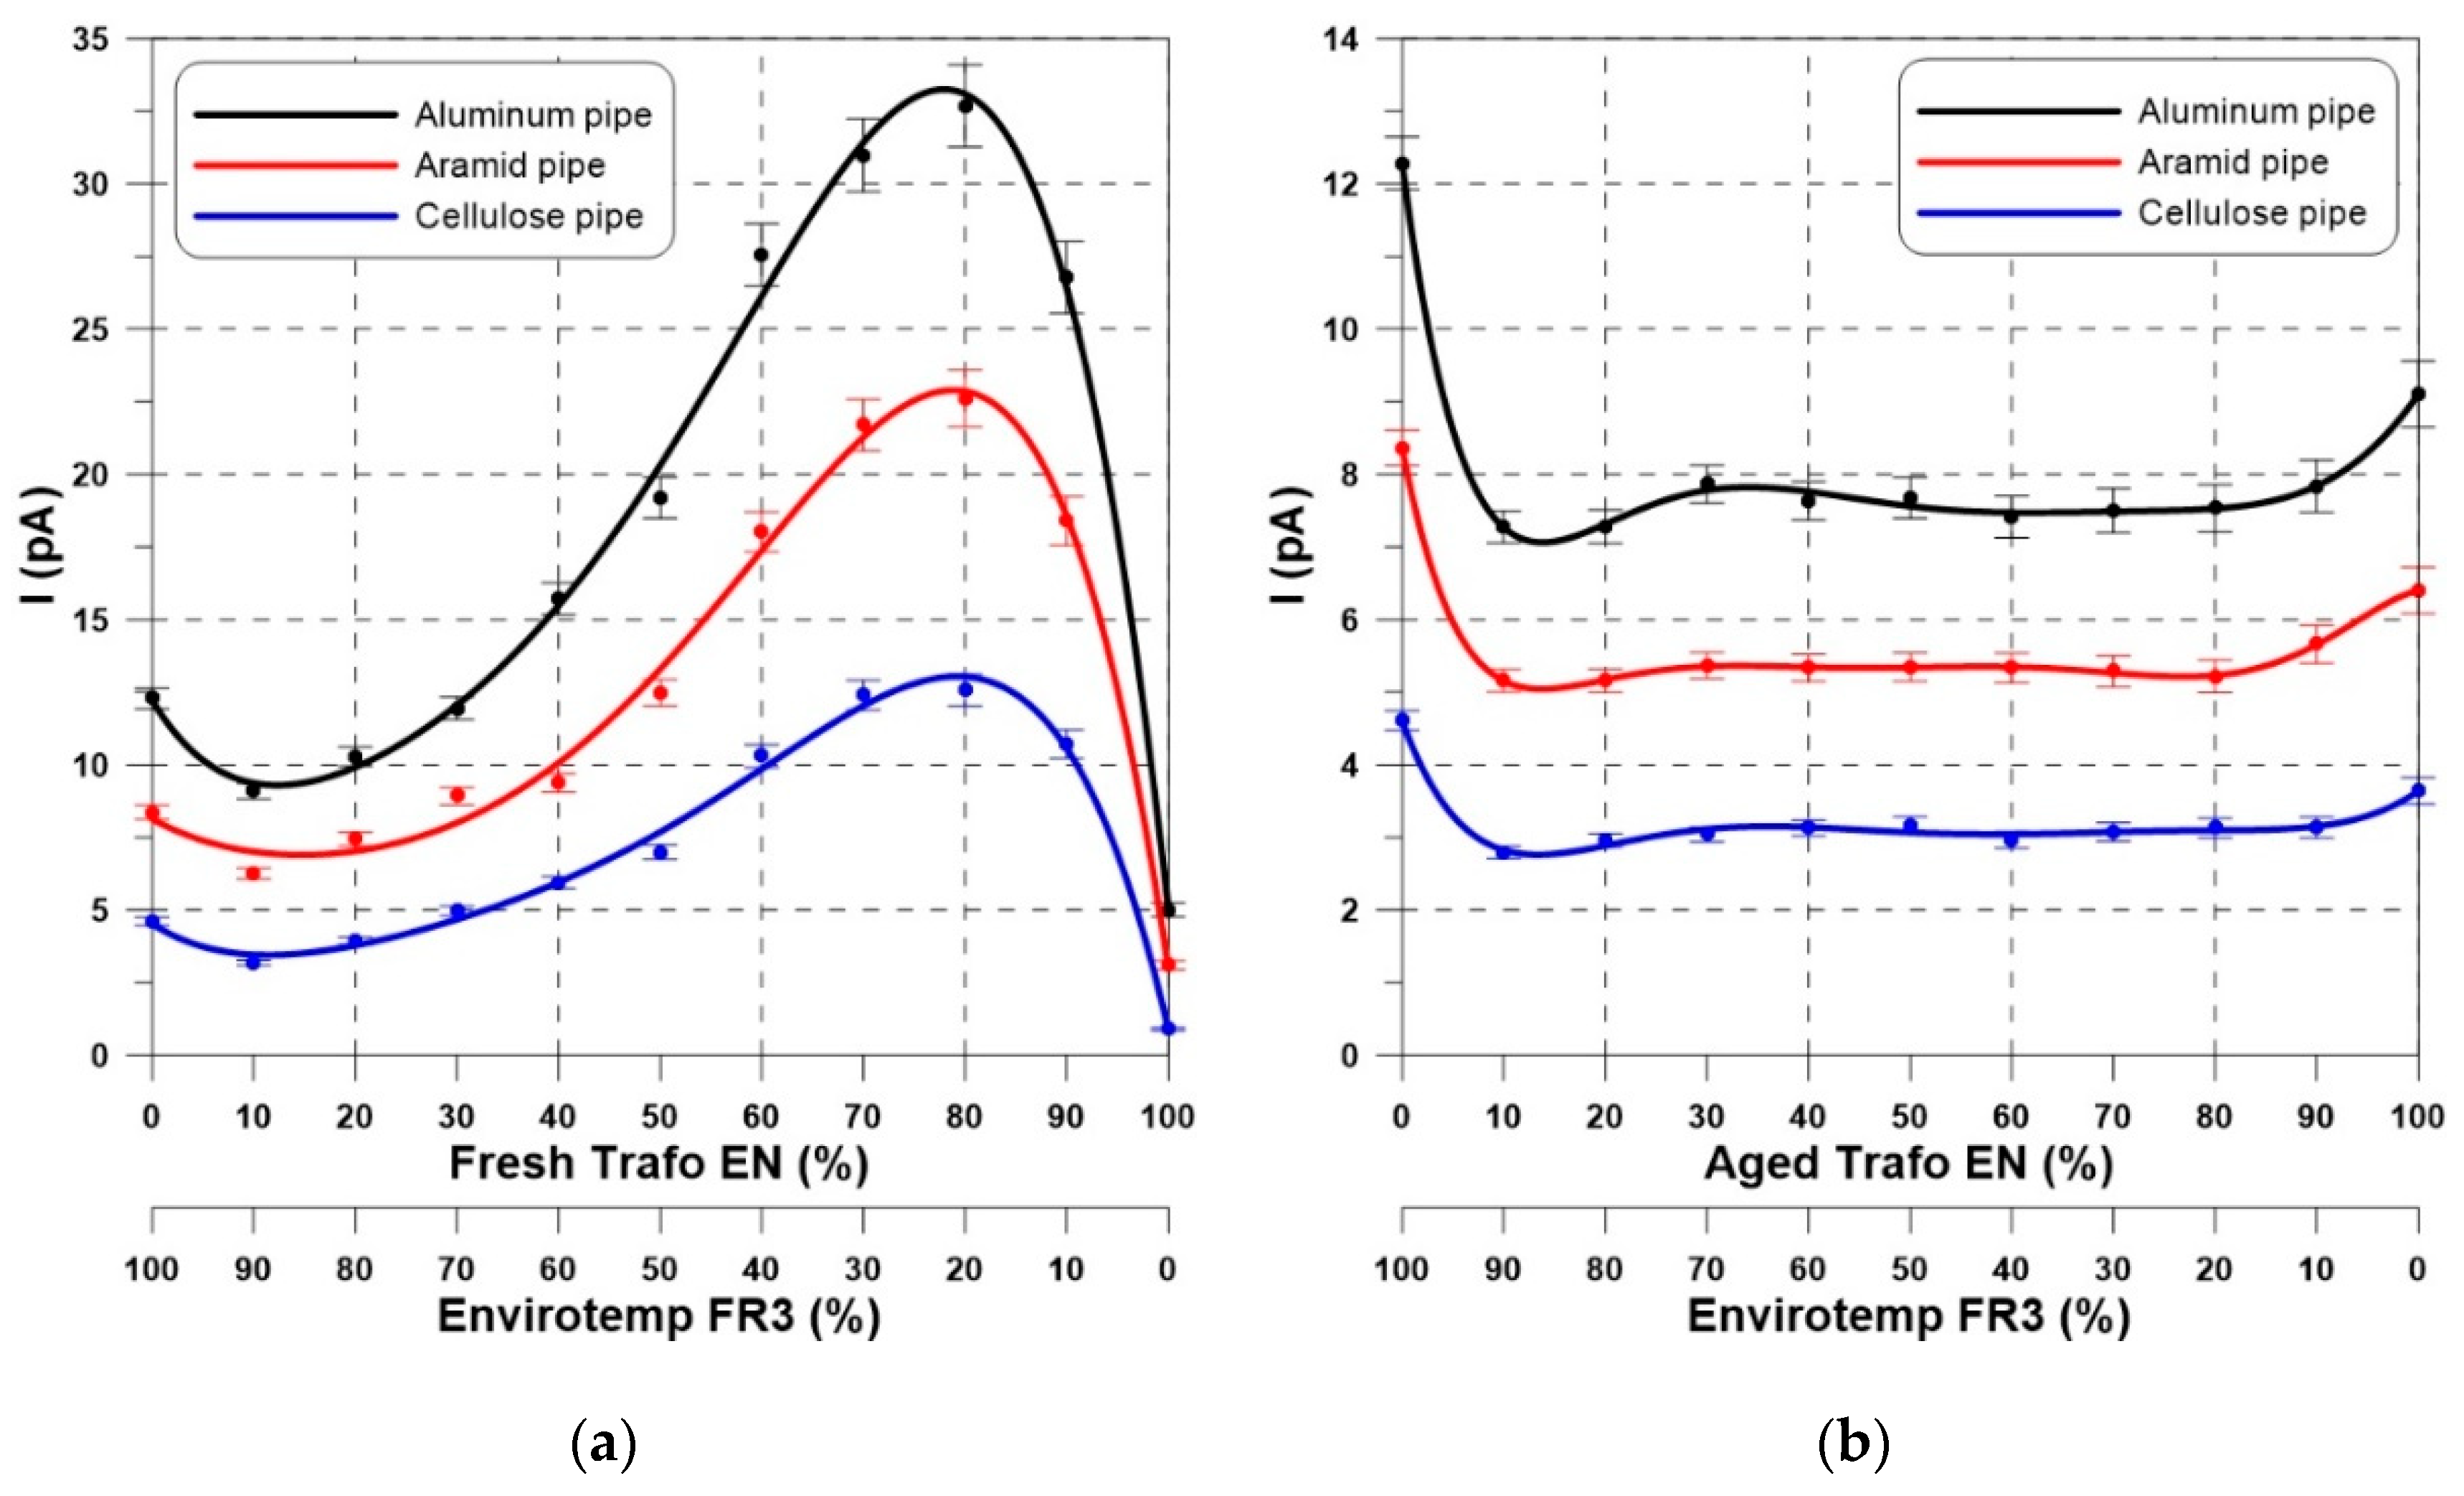
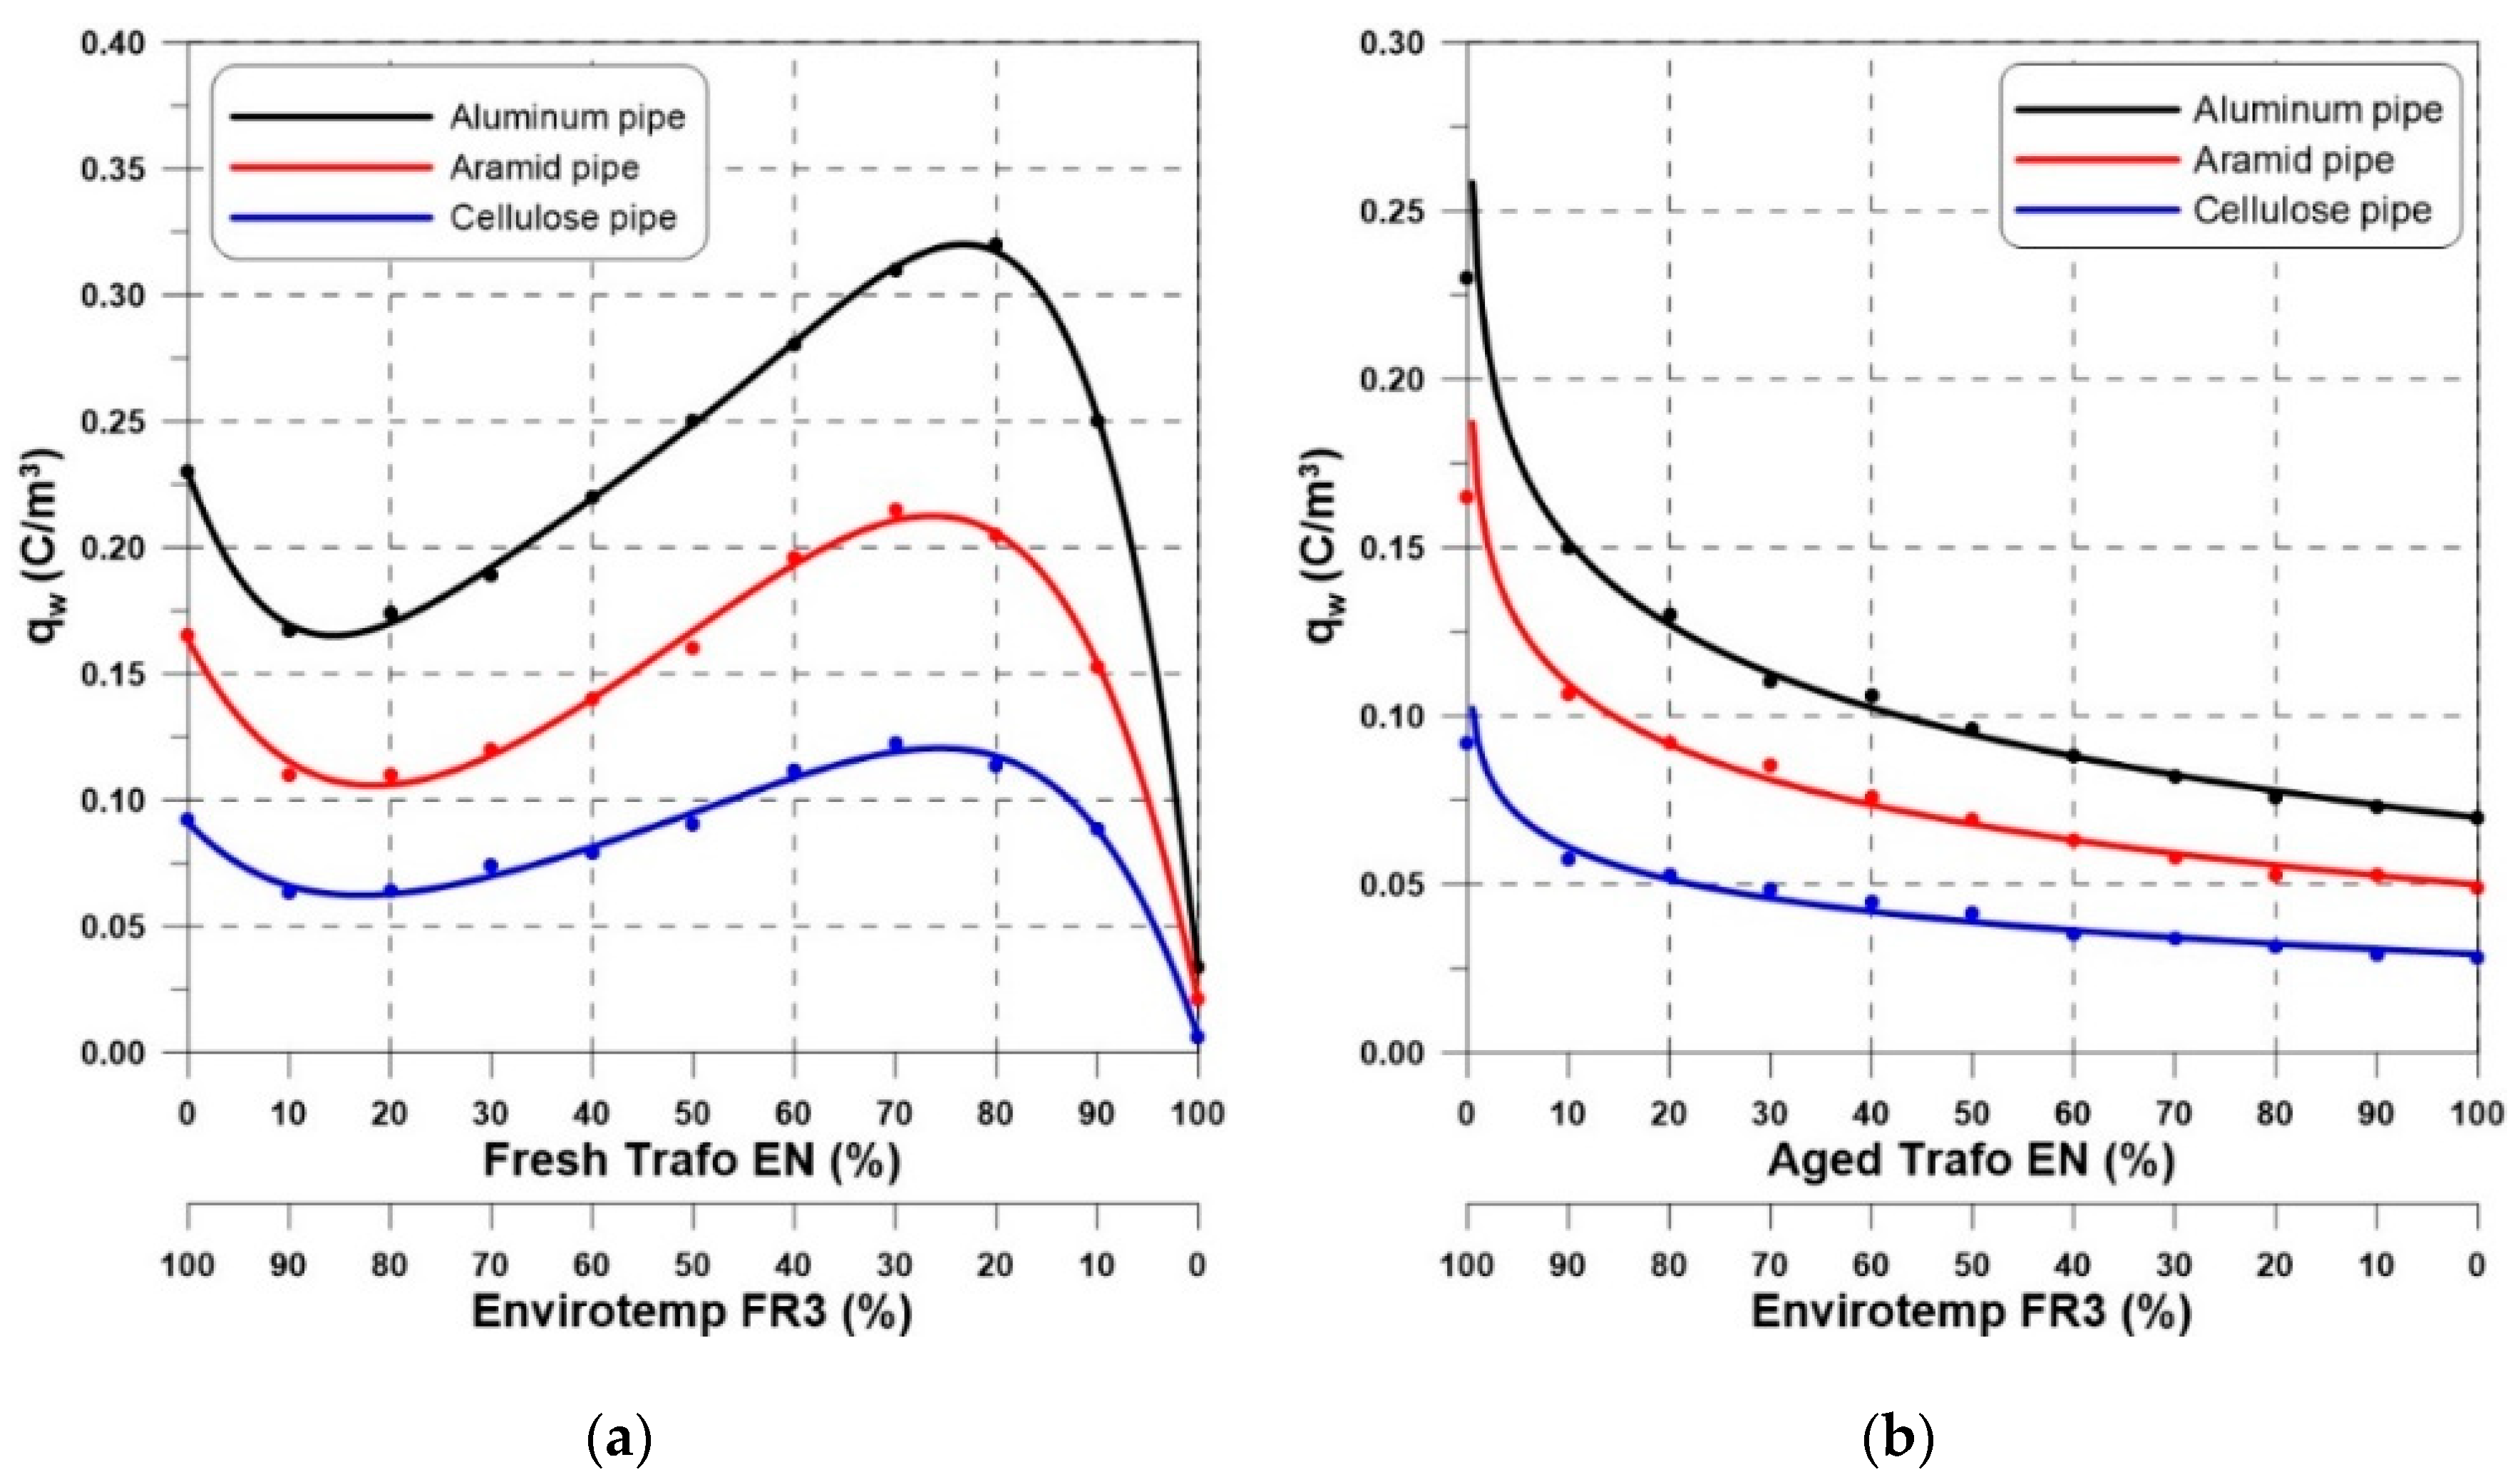
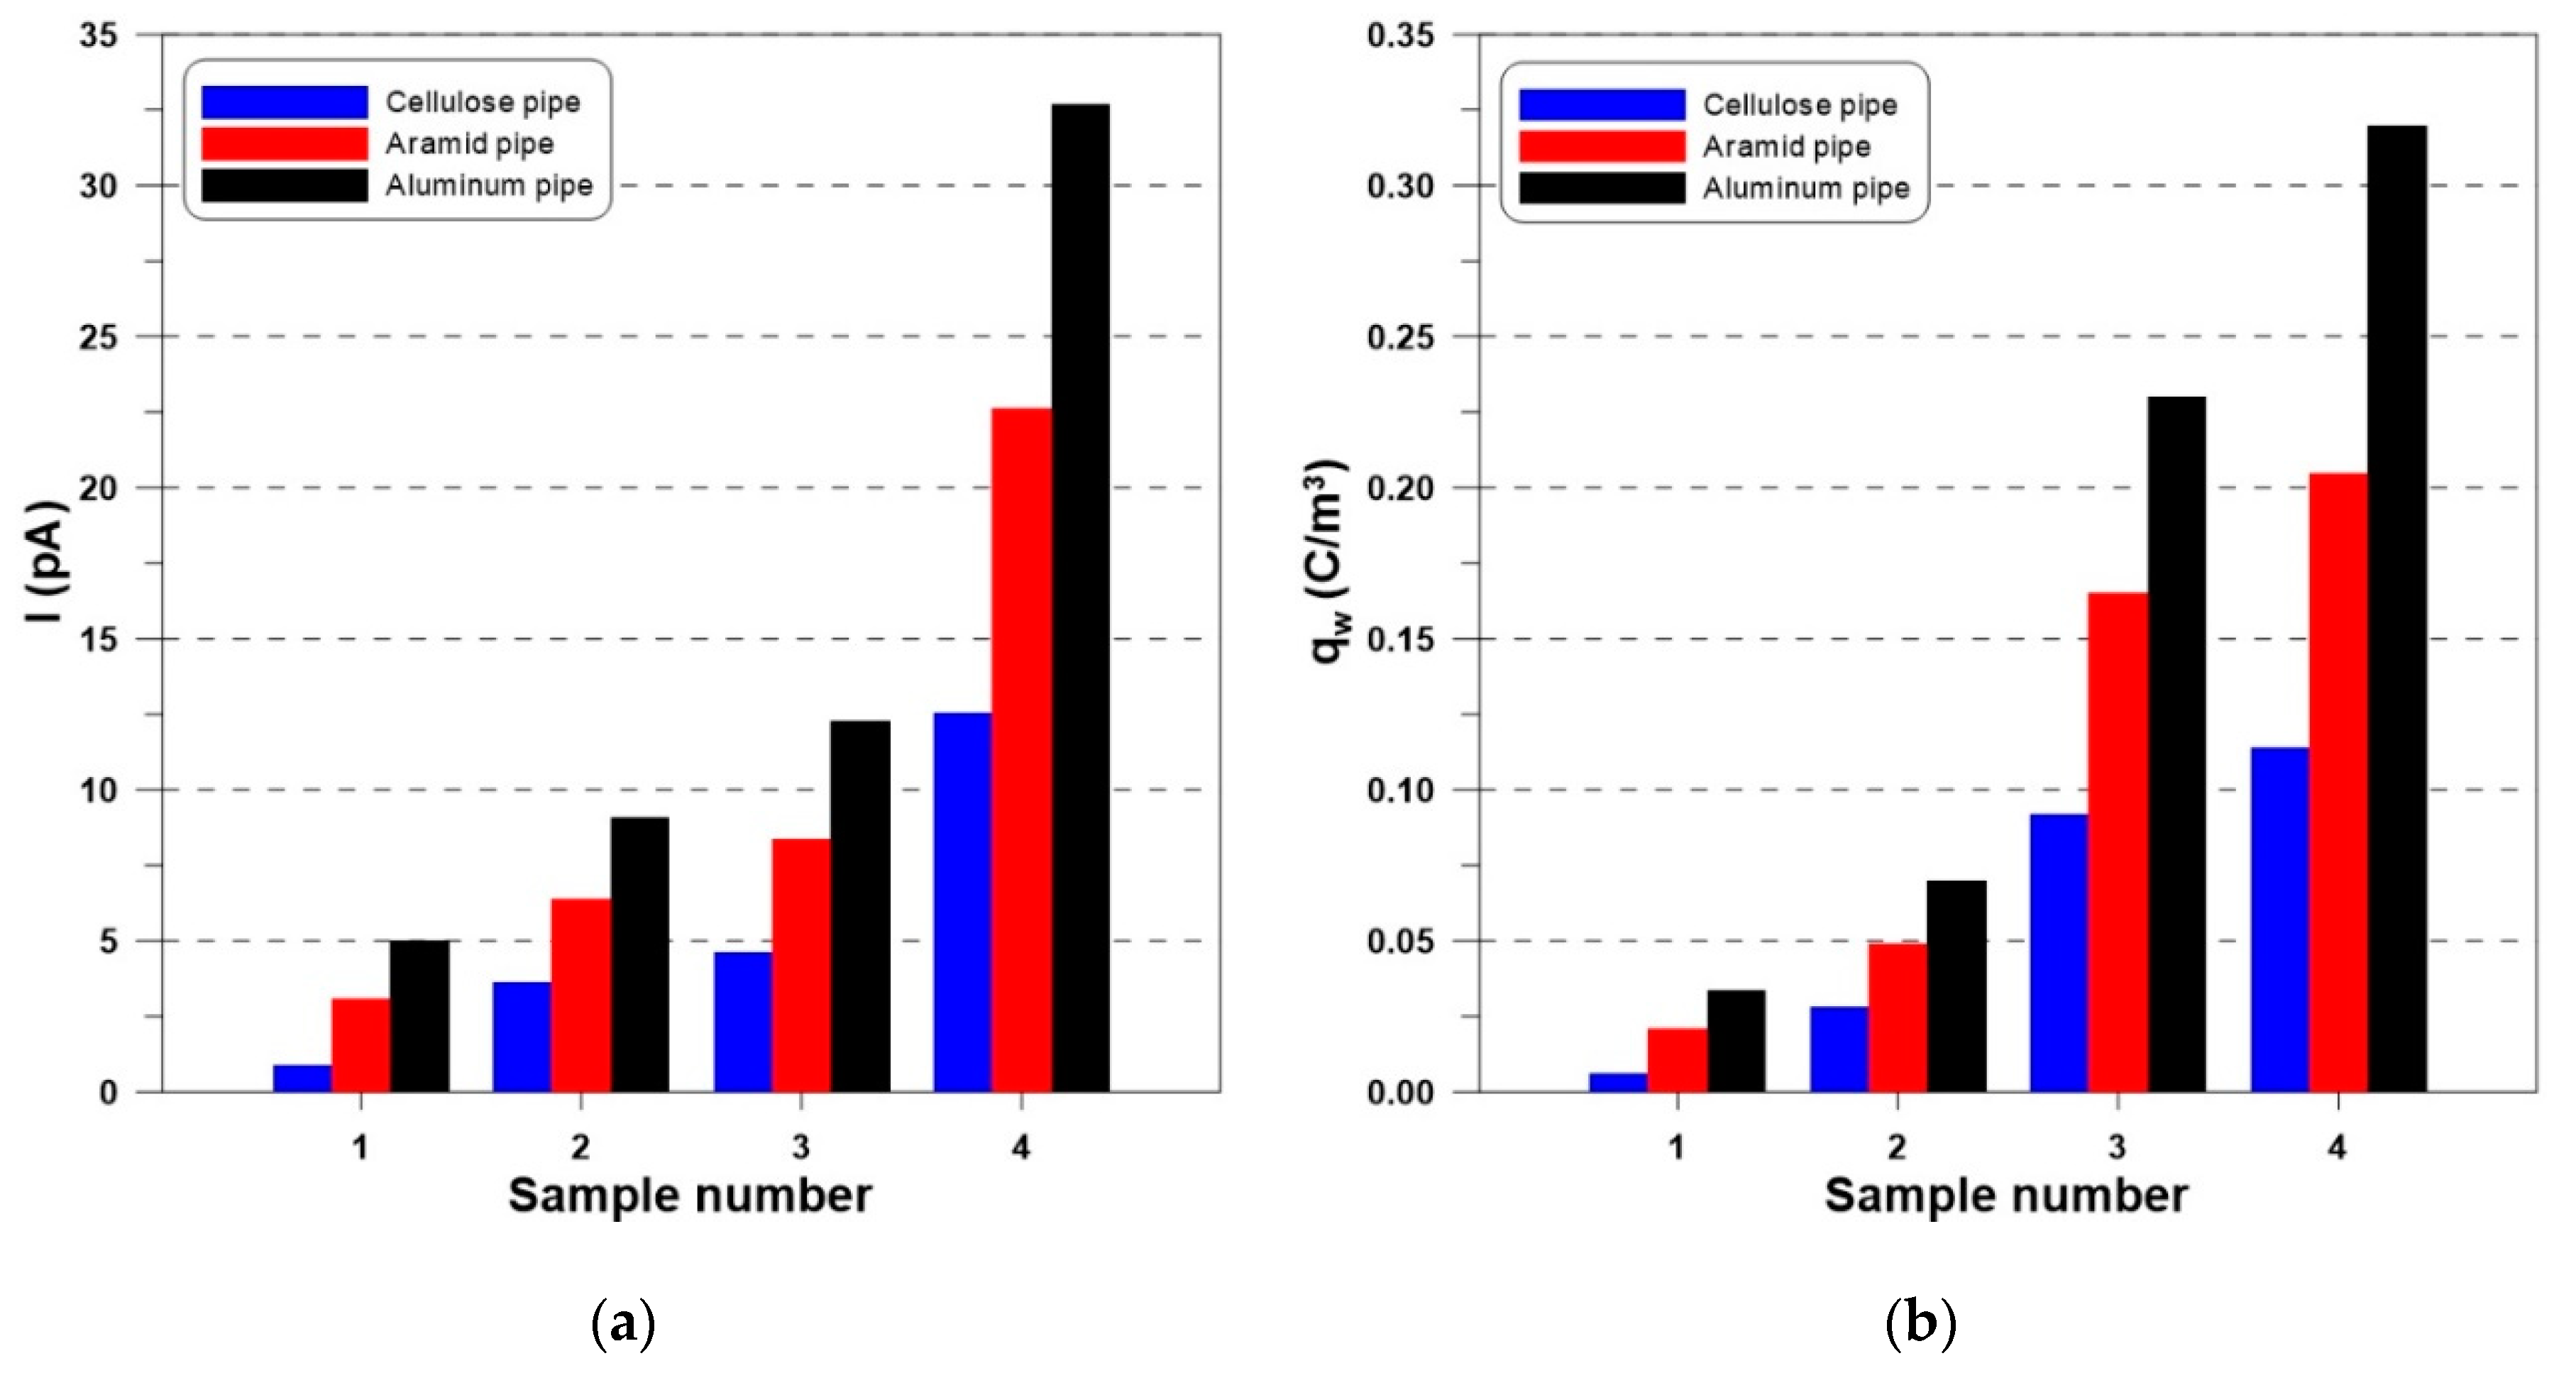
The base liquids used for the research were Trafo EN mineral oil (MO) produced by Orlen Oil (Kraków, Poland) and Envirotemp FR3 natural ester (NE) produced by Cargil (Minneapolis, MN, USA). The mineral oil was subject to accelerated thermal aging in accordance with IEC 1125 standard (Method C: 164 h, 120 °C, cooper—1144 cm2/kg of oil, air—0.15 l/h). The mixtures of oil and ester were prepared at ambient temperature and then seasoned for a month in tightly sealed bottles with a capacity of 1000 mL. The volumetric composition of the mixtures varied every 10%. Density (ρ) was marked with a universal glass areometer (ISO 3675). Kinematic viscosity (νk) was measured with a Brookfield DV-II+Pro viscometer (ISO 2555). Conductivity (σ) was determined based on the resistivity measurement with a three-terminal capacitor and MR0-4c meter (IEC 60247). Relative dielectric constant (εr) was determined based on the electric capacity measurement with three-terminal capacitor and Hioki 3522-50 LCR HiTester (IEC 60247). Molecular diffusion coefficient (Dm) was determined according to Equation (1) given by Adamczewski [26]. The main characteristics of the insulating liquids used are given in Table 1 and Table 2.
D m = 3.93 · 10 14 · T υ k ρ
where T—liquid temperature, νk—liquid kinematic viscosity and ρ—liquid density.
Figure 1 is the diagram of the flow system for measuring the electrification current of insulating liquids. The liquid was electrified as a result of flowing from the top container through the pipe down to the insulated bottom container placed in a Faraday cage. The electrification current was measured with a Keithley 6517A electrometer. The flow speed (0.34–1.75 m/s) was adjustable by changing the gas (nitrogen) pressure in the top tank. The time of flow (120 s) was determined with a solenoid valve. The temperature (20 °C) was stabilized using a heater with a thermostat. After the measurement had been completed, the liquid was transported from the bottom container to the top container by means of a pump. The lower container (max. 5 l) was made of acid-resistant steel. The point on the current characteristic is the average of 300 values obtained from five measurement series, carried out during 120 s. Error bars were determined using the electrification current average, standard deviation, and α = 0.05 significance level. The measuring pipes with a length of 400 mm and a diameter of 4 mm were made of aluminum, Tertrans N cellulose paper produced by Tervakoski Oy (Tervakoski, Finland), and Nomex paper produced by Dupont (Wilmington, DE, USA). The measurement process was controlled by means of a dedicated software [27] installed on a portable computer.
Insulating liquid electrification in a flow system is a very complex process. The phenomena that take place at the time are described using the electrification model prepared by Abedian and Sonin [28]. The measure of the ECT of liquid dielectrics is the volume density of the qw charge. The qw parameter is determined using the dependencies (2) and (3):
I q w π R 2 v = R e τ w λ 2 ρ v 2 R 2 [ 1 δ λ sin h ( δ λ ) ] + δ λ sin h ( δ λ ) [ 2 λ 2 1 + R δ 2 λ 2 ]
I = I [ 1 e l L ]
The following are the equations that describe the Reynolds number (4), the shearing stress (5), the laminar sublayer thickness (6), and the Debye length (7):
R e = 2 R v υ k
τ w = 8 ρ v R e
δ = A υ k S 1 C ( τ w ρ ) 0.5
λ = D m ε 0 ε r σ
where I—electrification current for infinite pipe length, qw—volume charge density on the phase border, R—pipe radius, v—average liquid velocity, Re—Reynolds number, τw—shearing stress, λ—Debye length, νk—liquid kinematic viscosity, ρ—liquid density, δ—laminar sublayer thickness, I—electrification current for any pipe length, L—characteristic length of the pipe, l—length of the pipe, Dm—molecular diffusion coefficient, ε0—vacuum electric permittivity, εr—relative dielectric constant of liquid, A, C—constant (A = 11.7; C = 3), and S—Schmidt number (S = νk/Dm).

3. Results

Based on the data from Table 1 and Table 2, it was found that the aging processes did not cause significant changes in the density and relative dielectric constant of the Trafo EN mineral oil (below 1%). It was observed that the kinematic viscosity increased by about 9% and the conductivity by nearly two orders of magnitude (from 7.97 10−13 to 1.33 10−11). The molecular diffusion coefficient decreased by about 10%. The change in the composition of the mineral oil and natural ester mixture caused a linear decrease in density, relative dielectric constant, and a non-linear decrease in kinematic viscosity and molecular diffusion coefficient. The conductivity when using fresh mineral oil in the mixture decreased non-linearly. When using aged oil, the conductivity increased non-linearly. From the analysis of physicochemical properties, it can be concluded that the viscosity and conductivity may have the greatest influence on the ECT of the insulating liquids.
The Reynolds number (Re), the shearing stress (τw), and the laminar sublayer thickness (δ) are parameters that describe synthetically the impact of the hydrodynamic conditions and the physicochemical properties of the liquids on the occurring electrification processes. A change in the flow rate of fresh Trafo EN oil and Envirotem FR3 natural ester between 0.34–1.75 m/s causes a linear growth in the Reynolds number (Figure 2a), in the shearing stress (Figure 2b), and a non-linear drop in the thickness of the laminar sublayer (Figure 2c). The Debye length (λ) characterizes the distribution of charges in the laminar sublayer. The λ parameter does not depend on the hydrodynamic conditions and only on the relative electrical permittivity, conductivity, and the molecular diffusion coefficient of the liquid (Figure 2d). On the basis of the Reynolds number, the type of flow (laminar or turbulent) is determined. The parameter Re for both liquids does not exceed the value of 2300, which indicates laminar flow. The shearing stress determines the thickness of the laminar sublayer, through which the qw charge is diffused from the electrical double layer area into the volume of the liquid. An increase in the value of parameter τw reduces the thickness of the laminar sublayer and, thus, intensifies the process of the electrification current generation. The differing values of the parameters Re, τw, and δ result from the difference in the viscosity and density of the mineral oil and the natural ester.
A percentage change in the content of oil and ester in the mixtures results in a non-linear increase in the Reynolds number (Figure 3a), the laminar sublayer thickness (Figure 3c), the Debye length (Figure 3d), and a non-linear drop in the shearing stress (Figure 3b). It results from the model analyses that the hydrodynamic conditions and the physicochemical properties of the liquids substantially affect the parameters of the Abedian–Sonin model in the flow system and, as a consequence, contribute to the generation of the qw charge, which is the source of the flowing electrification current. Figure 4a shows the electrification current vs. flow time of fresh Trafo EN mineral oil through the aluminum pipe. The tests showed that the electrification current stabilized after about 20 s from the start of the measurement procedure. Figure 4b presents sample dependencies between the electrification current in fresh and aged Trafo EN mineral oil and Envirotemp FR3 natural ester and the speed of flowing (0.34–1.75 m/s) through an aluminum pipe. The registered characteristics are linear. The study demonstrated that natural ester electrified more than mineral oil. Figure 4c presents the impact of the flow rate of the liquids being studied on the change in the volume density of the qw charge. The experimental tests confirm the assumptions of the Abedian–Sonin model that the qw parameter does not depend on the hydrodynamic conditions. For this reason, it can be used as a material indicator for determining and comparing the ECT of insulating liquids.
Figure 5a,b presents the impact of the percentage content of different components in the mixtures on the generation of electrification current. In the measurements, a cellulose, an aramid, and an aluminum pipe were used. The flow rate was 0.34 m/s, and the temperature was 20 °C. The conducted research has shown that the type of pipe has a large impact on the electrification current. This is due to the type and surface roughness of the material used [9]. In both types of mixtures, a high correlation between the electrification current and the composition of the mixture and the type of the measuring pipe material was observed. In addition, a high correlation between the shape of the current characteristics and the type of mineral oil applied is present (fresh or aged oil). In the former case (Figure 5a), an increase in the concentration of fresh mineral oil in the mixtures decreases the electrification current, and its significant increase takes place. The current characteristics reach the maximum in the case of a mixture that is composed of 80% fresh mineral oil and 20% natural ester. Any further increase in the share of oil in the mixture results in a rapid drop in the electrification current. In the second case (Figure 5b), it was concluded that a small amount of aged mineral oil (up to 10%) significantly reduced the electrification of natural ester. Any further increase in the content of aged oil in the mixtures does not lead to significant changes in the generation of electrification current.
Similarly, Figure 6a,b presents the impact of the mixtures’ composition on the volume density of the qw charge. The differences in the waveform of the characteristics of the electrification current and the qw charge for both types of mixtures are a result of including the physicochemical properties of the liquids in the electrification model. The study proved that, in order to determine and compare the ECT of insulating liquids, it is necessary to know both their electrification current and their physicochemical properties. In order to visualize better the differences between the electrification current values measured and the qw charge values calculated from the model, bar charts have been prepared (Figure 7a,b).

4. Conclusions

The purpose of this paper was to determine the ECT of mixtures of traditional mineral oil with natural esters in terms of retrofilling power transformers. For the experiment, it was proposed to use fresh and aged Trafo EN mineral oil and Envirotemp FR3 natural ester. Initially, selected parameters of the Abedian–Sonin electrification model were analyzed depending on the flow rate of the fluid and on the mixtures’ composition. Then, the electrification current of the liquids was measured in a flow system. The ECT of the liquids was determined on the basis of the volume density of qw charge results. This study demonstrated that natural ester electrified more intensely than both fresh and aged mineral oil. In addition, it was concluded that the ECT of the liquids was the highest when flowing through an aluminum pipe and the lowest in a cellulose pipe. The ECT of the mixtures depends substantially on the percentage content of different components and the type of mineral oil applied (fresh or aged). When using fresh oil in the mixtures, the characteristic minimum (at 10% of oil) and maximum (at 80% of oil) value of the qw charge is observed. When aged oil is applied, a non-linear drop in the qw charge value takes place regardless of the percentage share of both liquids in the mixtures. Comparing the change in physicochemical parameters (Table 1 and Table 2) and the electrification current, no significant correlation can be seen. The change in the composition of the mixture causes minima and maxima in the characteristics of the electrification current, which cannot be seen in the case of, e.g., viscosity and conductivity. Therefore, it cannot be clearly stated which property of the insulating liquid has the greatest influence on the ECT. The most important conclusion from the study conducted is the observation that a small amount of fresh or aged mineral oil (up to 10%) significantly reduces the ECT of Envirotemp FR3 natural ester, which is to the advantage of retrofilling, making it possible to increase the efficiency and operational safety of power transformers.

Funding

This research received no external funding.

Conflicts of Interest

The author declares no conflict of interest.

References

  1. Wang, X.; Tang, C.; Huang, B.; Hao, J.; Chen, G. Review of research progress on the electrical properties and modification of mineral insulating oils used in power transformers. Energies 2018, 11, 487. [Google Scholar] [CrossRef] [Green Version]
  2. Fernández, I.; Ortiz, A.; Delgado, F.; Renedo, C.; Pérez, S. Comparative evaluation of alternative fluids for power transformers. Electr. Power Syst. Res. 2013, 98, 58–69. [Google Scholar] [CrossRef]
  3. Mohan Rao, U.; Fofana, I.; Jaya, T.; Rodriguez-Celis, E.M.; Jalbert, J.; Picher, P. Alternative dielectric fluids for transformer insulation system: Progress, challenges, and future prospects. IEEE Access 2019, 7, 184552–184571. [Google Scholar] [CrossRef]
  4. N’cho, J.S.; Fofana, I.; Hadjadj, Y.; Beroual, A. Review of physicochemical-based diagnostic techniques for assessing insulation condition in aged transformers. Energies 2016, 9, 367. [Google Scholar] [CrossRef]
  5. Mehta, D.M.; Kundu, P.; Chowdhury, A.; Lakhiani, V.K.; Jhala, A.S. A review on critical evaluation of natural ester vis-a-vis mineral oil insulating liquid for use in transformers: Part 1. IEEE Trans. Dielectr. Electr. Insul. 2016, 23, 873–880. [Google Scholar] [CrossRef]
  6. Mehta, D.M.; Kundu, P.; Chowdhury, A.; Lakhiani, V.K.; Jhala, A.S. A review on critical evaluation of natural ester vis-a-vis mineral oil insulating liquid for use in transformers: Part II. IEEE Trans. Dielectr. Electr. Insul. 2016, 23, 1705–1712. [Google Scholar] [CrossRef]
  7. Zdanowski, M.; Wolny, S.; Zmarzły, D.; Boczar, T. ECT of ethanol and hexane mixtures in the spinning disc system. J. Electrost. 2007, 65, 239–243. [Google Scholar] [CrossRef]
  8. Zdanowski, M.; Kędzia, J. Research on the electrostatic properties of liquid dielectric mixtures. J. Electrost. 2007, 65, 506–510. [Google Scholar] [CrossRef]
  9. Zdanowski, M.; Wolny, S.; Zmarzły, D.; Kędzia, J. The Analysis and Selection of the Spinning Disk System Parameters for The Measurement of Static Electrification of Insulation Oils. IEEE Trans. Dielectr. Electr. Insul. 2007, 14, 480–486. [Google Scholar] [CrossRef]
  10. Zdanowski, M. Influence of composition of dielectric liquid mixtures on electrostatic charge tendency and physicochemical parameters. IEEE Trans. Dielectr. Electr. Insul. 2008, 15, 527–532. [Google Scholar]
  11. Zdanowski, M. Streaming electrification of mineral insulating oil and synthetic Ester MIDEL 7131®. IEEE Trans. Dielectr. Electr. Insul. 2014, 21, 1127–1132. [Google Scholar] [CrossRef]
  12. Zdanowski, M. Streaming electrification phenomenon of electrical insulating oils for power transformers. Energies 2020, 13, 3225. [Google Scholar] [CrossRef]
  13. Talhi, M.; Fofana, I.; Flazi, S. Comparative study of the electrostatic charging tendency between synthetic ester and mineral oil. IEEE Trans. Dielectr. Electr. Insul. 2013, 20, 1598–1606. [Google Scholar] [CrossRef]
  14. Leblanc, P.; Paillat, T.; Cabaleiro, J.M.; Touchard, G. Flow electrification investigation under the effect of the flow parameters. Int. J. Plasma Environ. Sci. Technol. 2018, 11, 156–160. [Google Scholar]
  15. Shinde, R. Condition monitoring of a retro-filled power transformer by natural ester Envirotemp FR3 fluid. In Proceedings of the 3rd International Conference on Condition Assessment Techniques in Electrical Systems (CATCON), Rupnagar, India, 16–18 November 2017; pp. 265–269. [Google Scholar]
  16. Rajaram, S.; Naveen, J. Maintenance of natural ester (Envirotemp FR3 dielectric fluid) filled transformer. J. Int. Assoc. Electr. Gener. Trans. Distr. 2018, 31, 22–25. [Google Scholar]
  17. Zhao, Y.; Qian, Y.; Wei, B.; Wang, R.; Rapp, K.J.; Xu, Y. In-service ageing comparison study of natural ester and mineral oil filled distribution transformers. In Proceedings of the IEEE International Conference on Dielectric Liquids (ICDL), Roma, Italy, 23–27 June 2019. [Google Scholar]
  18. Breazeal, R.C.; Sbravati, A.; Robalino, D.M. Evaluation of natural ester retrofilled transformers after one year of continuous overload. In Proceedings of the Electrical Insulation Conference (EIC), Calgary, AB, Canada, 16–19 June 2019; pp. 115–119. [Google Scholar]
  19. McShane, C.P.; Luksich, J.; Rapp, K.J. Retrofilling aging transformers with natural ester based dielectric coolant for safety and life extension. In Proceedings of the Cement Industry Technical Conference, Conference Record IEEE-IAS/PCA, Dallas, TX, USA, 4–9 May 2003; pp. 141–147. [Google Scholar]
  20. Beroual, A.; Khaled, U.; Noah, P.S.M.; Sitorus, H. Comparative study of breakdown voltage of mineral, synthetic and natural oils and based mineral oil mixtures under AC and DC voltages. Energies 2017, 10, 511. [Google Scholar] [CrossRef]
  21. Yu, H.; Chen, R.; Hu, X.; Xu, X.; Xu, Y. Dielectric and physicochemical properties of mineral and vegetable oils mixtures. In Proceedings of the 19th IEEE International Conference on Dielectric Liquids (ICDL), Manchester, UK, 25–29 June 2017. [Google Scholar]
  22. Hamadi, A.; Fofana, I.; Djillali, M. Stability of mineral oil and oil-ester mixtures under thermal aging and lectrical discharges. IET Gener. Transm. Distrib. 2017, 11, 2384–2392. [Google Scholar] [CrossRef]
  23. Dombek, G.; Gielniak, J. Fire safety and electrical properties of mixtures of synthetic ester/mineral oil and synthetic ester/natural ester. IEEE Trans. Dielectr. Electr. Insul. 2018, 25, 1846–1852. [Google Scholar] [CrossRef]
  24. Zdanowski, M.; Maleska, M. Streaming electrification of insulating liquid mixtures. Arch. Electr. Eng. 2019, 68, 387–397. [Google Scholar]
  25. Rajab, A.; Gumilang, H.; Tsuchie, M.; Kozako, M.; Hikita, M.; Suzuki, T. Study on static electrification of the PFAE-mineral oil mixture. IOP Conf. Ser. Mater. Sci. Eng. 2019, 602. [Google Scholar] [CrossRef]
  26. Adamczewski, J. Ionization and Conductivity of Liquid Dielectric; PWN: Warszawa, Poland, 1965. (In Polish) [Google Scholar]
  27. Zdanowski, M.; Ozon, T. Measuring system for a streaming electrification tests of insulating liquids. Poznan University of Technology Academic Journals. Electr. Eng. 2016, 86, 393–403. (In Polish) [Google Scholar]
  28. Abedian, B.; Sonin, A.A. Theory for Electric Charging in Turbulent Pipe Flow. J. Fluid Mech. 1981, 120, 199–217. [Google Scholar] [CrossRef]
Figure 1. Flow system for the investigation of electrification current of insulation liquids: 1—upper container with liquid, 2—solenoid valve, 3—measuring pipe, 4—Faraday cage with lower container, 5—Keithley 6517A electrometer, 6—portable computer, N—nitrogen, H—heater with thermostat, and P—pump.
Energies 13 04420 g001
Figure 2. Selected parameters of the Abedian–Sonin model vs. flow velocity of insulating liquids: (a) Reynolds number; (b) shearing stress; (c) laminar sublayer thickness; (d) Debye length.
Energies 13 04420 g002
Figure 3. Selected parameters of the Abedian–Sonin model vs. mixture content: (a) Reynolds number; (b) shearing stress; (c) laminar sublayer thickness; (d) Debye length.
Energies 13 04420 g003
Figure 4. (a) Electrification current vs. flow time of Trafo EN mineral oil; (b) Electrification current and (c) volume charge density qw vs. flow velocity of insulating liquids through an aluminum pipe.
Energies 13 04420 g004
Figure 5. Electrification current vs. mixing of Envirotem FR3 natural ester with (a) fresh and (b) aged Trafo EN mineral oil.
Energies 13 04420 g005
Figure 6. Volume charge density qw vs. mixing of Envirotem FR3 natural ester with (a) fresh and (b) aged Trafo EN mineral oil.
Energies 13 04420 g006
Figure 7. (a) Electrification current and (b) volume charge density qw vs. pipe material: 1—fresh Trafo EN, 2—aged Trafo EN, 3—Envirotemp FR3, 4—20% (NE)—80% (fresh MO) mixture.
Energies 13 04420 g007
Table 1. Properties of Envirotemp FR3 natural ester and fresh Trafo EN mineral oil mixtures (20 °C).
Mixture Contentρ (kg/m3)νk (m2/s)σ (S/m)εr (–)Dm (m2/s)
NE 100%9207.80 × 10−55.11 × 10−123.211.10 × 10−11
90% NE + 10% MO9156.87 × 10−54.21 × 10−123.111.25 × 10−11
80% NE + 20% MO9106.05 × 10−53.50 × 10−123.011.43 × 10−11
70% NE + 30% MO9055.33 × 10−52.91 × 10−122.911.63 × 10−11
60% NE + 40% MO9004.70 × 10−52.42 × 10−122.811.86 × 10−11
50% NE + 50% MO8964.14 × 10−52.01 × 10−122.722.12 × 10−11
40% NE + 60% MO8913.64 × 10−51.67 × 10−122.622.42 × 10−11
30% NE + 70% MO8863.21 × 10−51.39 × 10−122.522.76 × 10−11
20% NE + 80% MO8812.83 × 10−51.15 × 10−122.433.15 × 10−11
10% NE + 90% MO8762.49 × 10−59.59 × 10−132.333.60 × 10−11
MO 100%8712.19 × 10−57.97 × 10−132.234.12 × 10−11
Table 2. Properties of Envirotemp FR3 natural ester and aged Trafo EN mineral oil mixtures (20 °C).
Mixture Contentρ (kg/m3)νk (m2/s)σ (S/m)εr (–)Dm (m2/s)
NE 100%9207.80 × 10−55.11 × 10−123.211.10 × 10−11
90% NE + 10% MO9156.93 × 10−55.61 × 10−123.121.24 × 10−11
80% NE + 20% MO9106.16 × 10−56.17 × 10−123.021.40 × 10−11
70% NE + 30% MO9055.48 × 10−56.79 × 10−122.901.58 × 10−11
60% NE + 40% MO9004.87 × 10−57.48 × 10−122.831.79 × 10−11
50% NE + 50% MO8954.33 × 10−58.23 × 10−122.712.03 × 10−11
40% NE + 60% MO8903.84 × 10−59.06 × 10−122.642.30 × 10−11
30% NE + 70% MO8853.42 × 10−59.97 × 10−122.492.60 × 10−11
20% NE + 80% MO8803.04 × 10−51.10 × 10−112.422.94 × 10−11
10% NE + 90% MO8752.70 × 10−51.21 × 10−112.313.33 × 10−11
MO 100%8702.40 × 10−51.33 × 10−112.273.76 × 10−11

