Abstract
This article presents the results of the analysis of energy distribution of optical radiation emitted by electrical discharges in insulating liquids, such as synthetic ester, natural ester, and mineral oil. The measurements of optical radiation were carried out on a system of needle–needle type electrodes and on a system for surface discharges, which were immersed in brand new insulating liquids. Optical radiation was recorded using optical spectrophotometry method. On the basis of the obtained results, potential possibilities of using the analysis of the energy distribution of optical radiation as an additional descriptor for the recognition of individual sources of electric discharges were indicated. The results can also be used in the design of various types of detectors, as well as high-voltage diagnostic systems and arc protection systems.
1. Introduction
One of the characteristic features of electrical discharges is the emission to the space in which they occur, an electromagnetic wave with a very wide range. Such typical ranges of emitted radiation include ionizing radiation, such as X-rays, optical radiation, acoustic emission, and radio wave emission. Based on most of these emitted ranges, diagnostic methods were developed, which enables the detection and location of the source of electrical discharges, which is a great achievement in the diagnostics of high-voltage electrical insulating devices [1,2,3,4]. These methods are constantly being improved and modified in terms of increasing their effectiveness and speed of operation. Parallel to these activities, research was also carried out in the field of basic studies aimed at learning new possibilities of using the physicochemical properties of electrical discharge forms [5,6,7,8,9,10]. Examples of not fully understood areas are X-ray radiation and optical radiation emitted by electrical discharges [11,12,13,14].
The research topic discussed in this article is focused in particular on the analysis of optical radiation emitted by electrical discharges, which is usually interpreted using a designated spectrum. For this study, the optical radiation range from 200 nm to 1100 nm was assumed. The radiation spectrum represents the visual form of electromagnetic radiation distributed over the individual components of the wavelengths. Using the radiation spectrum, information about the range of waves that are involved in the analyzed radiation is presented, but their quantitative values were not determined. The dependence of the quantitative size on the occurring wavelength component was represented by the spectral distribution. Spectral distribution, in addition to the range of wavelengths of occurring radiation, most often shows the intensity value of individual components of wavelengths.
Registration of optical radiation is a particularly difficult task in the case of emissions in insulating liquids where there is a large attenuation of the optical signal [15,16,17]. In addition, there was also an environment with high electric field strength. Therefore, to record radiation in such conditions, it required the use of advanced measuring devices that enabled transmission and processing of optical signals without interference. An additional problem was the correct positioning of the measuring probe (optical fiber) in the expected location of the electrical discharge, so that the emitted optical radiation can be introduced and transmitted by means of an optical fiber. Currently, effective measuring probes have not yet been developed, and all measurements carried out in this area are of an experimental nature.
Conducted and published studies were mainly focused on the possibility of recording discharges and determining spectral distributions on their basis [18,19,20,21]. However, there is much less work devoted to the development of useful descriptors which, determined on the basis of the obtained spectral distributions, could be used to identify the forms of electrical discharges in various insulation systems (both gas and liquid). Such an approach was presented in the work [22], where a group of descriptors for identifying forms of electrical discharges in insulating oil were developed.
With regard to the already conducted research related to the registration and analysis of optical radiation emitted by electric discharges, in terms of the possibility of using their results in high-voltage diagnostics, the author proposed a new approach to the interpretation of recorded spectral distributions. This solution is based on the analysis of the optical spectrum in terms of the share of individual ranges of optical radiation and their use as a descriptor to recognize single-source forms of electrical discharges.
2. Method of Measuring Optical Spectra
The tests were carried out on two electrode systems, on which single-source forms of electrical discharges were generated. The first system consisted of needle–needle electrodes, where a high voltage was applied to one of the electrodes and the other was earthed. The second system consisted of a needle electrode, and a solid dielectric was used to generate surface discharges. Both systems can be used as models of potential damage in the high power insulating liquid filled transformers, where the needle–needle electrode system was a model of damage to neighboring transformer windings, while the surface discharge system was a model of damage at the contact between the solid and liquid dielectric. The electrode systems were subsequently immersed in insulating liquids, and the measurements were carried out in identical metrological conditions for each variant. Figure 1 shows the general scheme of the measuring system.
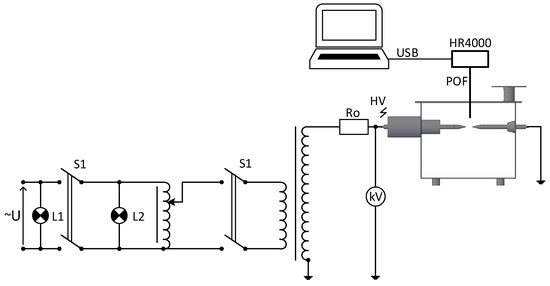
Figure 1.
Diagram of the measuring system: Ro—protective water resistor (1.1 MΩ); POF—Polymer Optical Fiber; HR4000—optical spectrophotometer; L1 and L2—control signalling; S1—voltage switch; kV—voltmeter; and U—mains voltage 230 V.
The schematic diagram and general view of the spark gap for generating electric discharges in a needle–needle system is shown in Figure 2. Two identical electrodes with the following dimensions were used: total length, 35 mm; base diameter, 20 mm; apex angle, 32°; and needle head diameter, 0.8 mm. Distance between the electrodes in the needle–needle system was constant for all cases and was 2 cm. The electrodes were made of copper, and their surfaces were electroplated with nickel. The galvanic coating of the copper electrode with nickel improves its mechanical resistance and thermal strength, which also allows multiple uses of the same electrode.
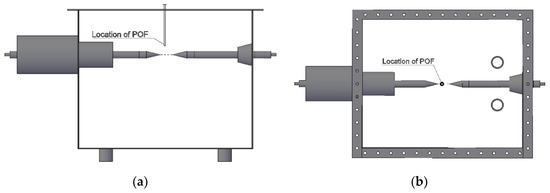
Figure 2.
Needle–needle electrode system: schematic diagram side view (a) and view from above (b).
A system of two metal electrodes with a solid dielectric between them was used to generate electrical discharges in the surface system. A schematic diagram and general view of the spark gap in the surface system is shown in Figure 3. The supplying electrode was a needle electrode, and the grounded electrode was a flat cylindrical plate with a base diameter of 69 mm and thickness of 9 mm, which was made of metal. The spark gap electrodes were separated by a solid dielectric, which was a plate made of sodium glass, with external dimensions of 90 mm × 90 mm and a thickness of 10 mm.
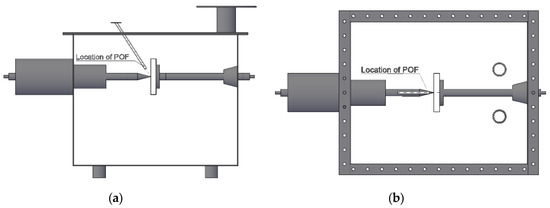
Figure 3.
Surface discharge system: schematic diagram side view (a) and view from above (b).
The three most frequently used electroinsulating liquids in power engineering were used for testing natural ester Midel 1204, synthetic ester Midel 7131, and mineral oil Orlen Trafo EN. All liquids were brand new and free of any contamination. The temperature of the insulating liquids were the same in all examined cases and was 20 °C. Due to the experimental nature of basic research, the influence of liquid temperature on the obtained measurement results was not analyzed.
The optical spectrophotometer, HR4000 from Ocean Optics (Dunedin, FL, USA) was used to record the optical radiation emitted by electrical discharges. The applied spectrophotometer recorded optical radiation in the ultraviolet, visible, and near-infrared range (UV–VIS–NIR spectral range from 200 nm to 1100 nm). The device is equipped with a 3648-element linear silicon CCD array and an optical resolution of 0.47 nm FWHM (Full Width at Half Maximum). This enabled the detection of 3648 components of the recorded optical spectrum in the range of 200 nm to 1100 nm.
Polymer optical fiber 600SR (POF) manufactured by Ocean Optics was used as the measuring head, and one of its endpoints was placed near the electrode system. The basic parameters of the optical fiber were presented in Table 1. During the emission of optical radiation by electrical discharge, the light beam was introduced into the optical fiber and sent to spectrophotometer. The spectrophotometer converts the light beam into a parallel stream with a spectral range of 200 nm to 1100 nm and counts the number of emitted photons for each wavelength. The integration time of the spectrophotometer (matrix exposure time) was the same in all cases and was set to 1 s. Obtained data were presented in the form of spectral characteristics, where the intensity corresponded to the number of counts for wavelengths in the analyzed range.

Table 1.
Basic parameters of the optical fiber.
Figure 1 shows how the fiber was placed in the electrode system area. The optical fiber head was placed at a distance of 2.5 cm from the expected source of optical radiation emission. This distance was determined on the basis of the fiber acceptance cone parameter and due to the metal elements of the fiber head.
All measurements were made in a darkened laboratory room, separated from external sources of optical radiation. Before each measurement series, the spectrophotometer was calibrated to determine the minimum background level. This operation aimed to eliminate interference resulting from the process of converting the optical signal to digital form. The background calibration function is available in the device software. Spectral calibration of the spectrophotometer with a dedicated POF was performed by the manufacturer. The supply voltage of electrode systems was from 25 to 50 kV (RMS voltage) of 50 Hz alternating current (AC), with gradation every 5 kV. In order to limit the discharge current, a water resistor (Ro) of 1.1 MΩ was used, which limited the current to mA range (about 100 mA for this system). For each supply voltage, 10 measurement tests were performed.
3. Measurement Results
Figure 4 presents examples of registered optical spectra emitted by electrical discharges generated on the system of needle–needle electrodes for each of the tested insulating liquids.
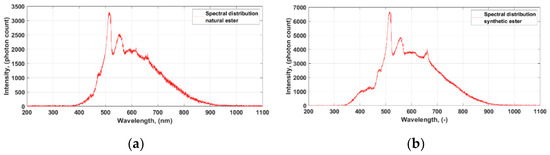
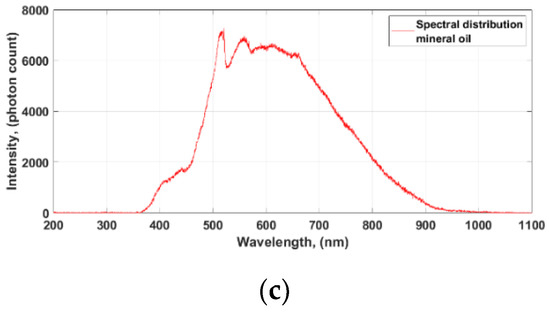
Figure 4.
Example results of measurements generated on a needle–needle spark gap at 35 kV supply voltage for the following insulating liquids: Midel 1204 (a); Midel 7131 (b); and Mineral oil (c).
Obtained optical spectra in the needle–electrode system shows some similarity in the shape of the spectral characteristics in all three analyzed liquids. The spectral range of the characteristics mainly includes visible light and, to a small extent, near infrared and ultraviolet. Figure 5 presents examples of registered optical spectra emitted by electrical discharges generated on the surface discharge system for each of the tested insulating liquids.
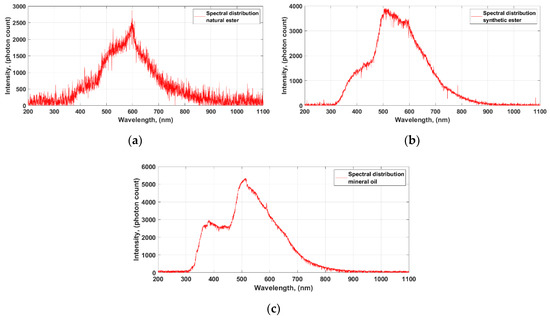
Figure 5.
Example results of measurements generated on a surface discharge system at 35 kV supply voltage for the following insulating liquids: Midel 1204 (a); Midel 7131 (b); and Mineral oil (c).
By comparing the obtained spectral characteristics in both analyzed electrode systems and for the same supply voltage level, significant differences in their shapes and spectral ranges can be observed. For the needle–needle electrode system, the spectral range is mainly in visible light, and a small extent in the near-infrared and ultraviolet range. In turn, the spectra obtained for the surface discharge system contained a higher proportion of ultraviolet radiation. This showed the potential possibility of using optical spectra analysis for the recognition of single-source forms of electrical discharges.
4. Optical Radiation Energy
Based on the obtained characteristics of spectral distributions and using the quantum description where optical radiation is described as a photon stream, the share of emitted energy can be estimated. Each wavelength of emitted radiation corresponds to a specific photon energy which can be determined from the relation:
where: E—total energy of the photon stream (J), n—number of photons counted (-), h—Planck constant 6.626 × 10⁻³⁴ (J·s), and υ—wave frequency (1/s).
The frequency of the waveform is expressed by the formula:
where: υ—wave frequency (1/s); c—phase speed of the wave, speed of light in vacuum 2.998 × 10⁸ (m/s); and λ—wavelength (nm).
Table 2 presents examples of the calculated energy values of optical radiation emitted by electric discharges generated in the tested electrode systems. In order to better present the determined total energy values, the physical unit of energy description in the form of electronvolts (eV) was used. They were calculated from a simple relationship resulting from the definition of eV, where 1 J ≈ 6.241509126(38) × 1018 eV. The calculated energy was not the total energy radiated by electrical discharges. The presented values were estimated based on the registered optical radiation by the spectrophotometer. This stage of research does not include an attempt to prepare energy balance, but only presents the possibility of applying energy distribution analysis to recognize the form of electrical discharges.
Table 2.
Examples of optical radiation energy values.
Analysis of the Variability of Optical Energy Shares in the UV–VIS–NIR Range
The analysis of optical radiation variability in the UV–VIS–NIR range was carried out using traditional statistical methods. The main aim of the variability analysis was to determine the share of the energy of optical radiation, in particular spectral ranges for recorded optical spectra emitted by electric discharges generated in the analyzed electrode configurations. The results of the variability analysis are presented in Table 3. The results presented in Table 3 were determined on the basis of 10 registered characteristics for each variant of the measuring system.
Table 3.
Comparison of the share of optical radiation emitted by electric discharges.
Figure 6, Figure 7 and Figure 8 present the percentage share of energy in optical radiation ranges emitted by electrical discharges generated on the system of needle–needle electrodes and surface discharge systems in the insulating liquids adopted for testing. The UV radiation was less than 1% of the total energy radiation and poorly detectable in all tested insulating liquids. However, it was different in the case of electrical discharges generated in a surface discharge system, where the proportion of ultraviolet radiation was much higher.
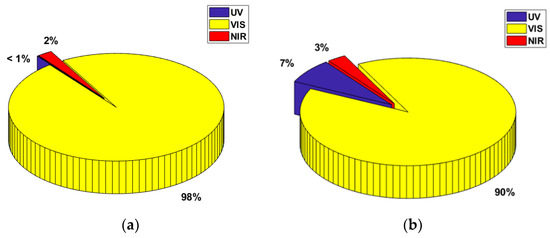
Figure 6.
Percentage of optical radiation energy for electrical discharges generated in natural ester, Midel 1204, on electrode systems: needle–needle (a) and for surface discharges (b).
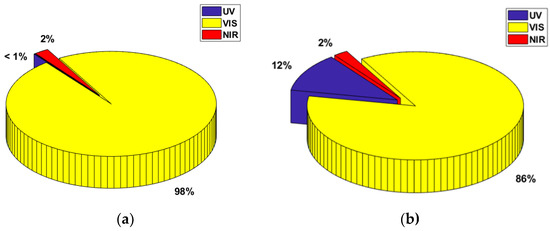
Figure 7.
Percentage of optical radiation energy for electrical discharges generated in natural ester, Midel 7131, on electrode systems: needle–needle (a) and for surface discharges (b).
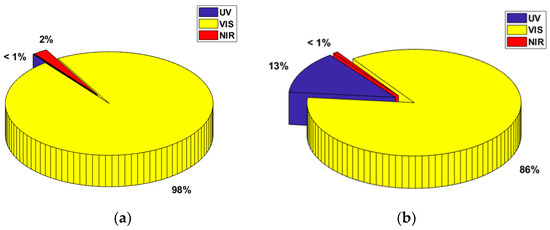
Figure 8.
Percentage of optical radiation energy for electrical discharges generated in mineral oil, Orlen Trafo EN, on electrode systems: needle–needle (a) and for surface discharges (b).
This is probably due to various energy transformations accompanying the phenomenon of electrical discharges, which occurs in the used electrode systems. In the electrode system of the needle–needle type, electric discharges mostly occur in the form of a spark, while in the system for surface discharges, the phenomena occur continuously. Radiation in the ultraviolet range, in the case of discharges in the needle–needle system, is short-lived and effectively suppressed.
5. Conclusions
The spectral distribution of the optical radiation emitted by electrical discharges in insulating liquids differed according to the electrode geometry. Needle–needle electrodes had < 1% UV radiation in all analyzed cases. In contrast, surface discharges had 7% or more UV radiation, depending on the type of electrical insulating liquid. This result might allow identification of the discharge type from the radiation spectrum and might be incorporated in expert diagnostic systems used in various technical areas. The results also justify further research, in terms of the applicability of the proposed indicator, for recognizing forms of electrical discharges in high-voltage insulation systems.
Funding
This research was co-funded by the National Science Centre, Poland (NCN) as a part of the Preludium Research Project No. 2017/25/N/ST8/00590.
Conflicts of Interest
The author declares no conflict of interest. The funders had no role in the design of the study; in the collection, analyses, or interpretation of data; in the writing of the manuscript; or in the decision to publish the results.
References
- Kunicki, M. Variability of the UHF signals generated by partial discharges in mineral oil. Sensors 2019, 19, 1392. [Google Scholar] [CrossRef] [PubMed]
- Wotzka, D.; Koziol, M.; Nagi, L.; Urbaniec, I. Experimental analysis of acoustic emission signals emitted by surface partial discharges in various dielectric liquids. In Proceedings of the IEEE 2nd International Conference on Dielectrics (ICD 2018), Budapest, Hungary, 1–5 July 2018. [Google Scholar]
- Mukhtaruddin, A.; Isa, M.; Noor, M.M.; Adzman, M.R.; Ain, M.F. Review of UHF detection of partial discharge experimentation in oil-filled power transformer: Objectives, methodologies and results. In AIP Conference Proceedings; AIP Publishing LLC: Melville, NY, USA, 2018; Volume 2013. [Google Scholar]
- Meitei, S.N.; Borah, K.; Chatterjee, S. Modelling of Acoustic Wave Propagation Due to Partial Discharge and Its Detection and Localization in an Oil-Filled Distribution Transformer. Frequenz 2019, 74, 73–81. [Google Scholar] [CrossRef]
- Dincer, S.; Duzkaya, H.; Tezcan, S.S.; Dincer, M.S. Analysis of Insulation and Environmental Properties of Decomposition Products in SF6-N2 Mixtures in the Presence of H2O. In Proceedings of the IEEE International Conference on Environment and Electrical Engineering and IEEE Industrial and Commercial Power Systems Europe, EEEIC/I and CPS Europe, Genova, Italy, 11–14 June 2019. [Google Scholar]
- Graczkowski, A.; Gielniak, J.; Przybyłek, P.; Walczak, K.; Morańda, H. Study of the Dielectric Response of Ester Impregnated Cellulose for Moisture Content Evaluation. In Proceedings of the 23rd Nordic Insulation Symposium, Trondheim, Norway, 9–12 June 2013. [Google Scholar]
- Mukhtaruddin, A.; Isa, M.; Adzman, M.R.; Hasan, S.I.S.; Rohani, M.N.K.H.; Yii, C.C. Techniques on partial discharge detection and location determination in power transformer. In Proceedings of the 3rd International Conference on Electronic Design (ICED), Phuket, Thailand, 11–12 August 2016; pp. 537–542. [Google Scholar]
- Jiang, J.; Wang, K.; Wu, X.; Ma, G.; Zhang, C. Characteristics of the propagation of partial discharge ultrasonic signals on a transformer wall based on Sagnac interference. Plasma Sci. Technol. 2019, 22, 24002. [Google Scholar] [CrossRef]
- Locke, B.R.; Thagard, S.M. Analysis and review of chemical reactions and transport processes in pulsed electrical discharge plasma formed directly in liquid water. Plasma Chem. Plasma Process. 2012, 32, 875–917. [Google Scholar] [CrossRef]
- Piotrowski, T.; Rozga, P.; Kozak, R. Comparative analysis of the results of diagnostic measurements with an internal inspection of oil-filled power transformers. Energies 2019, 12, 2155. [Google Scholar] [CrossRef]
- Nagi, Ł.; Kozioł, M.; Kunicki, M.; Wotzka, D. Using a scintillation detector to detect partial discharges. Sensors 2019, 19, 4936. [Google Scholar] [CrossRef] [PubMed]
- Fracz, P.; Urbaniec, I.; Turba, T.; Krzewiński, S. Diagnosis of High Voltage Insulators Made of Ceramic Using Spectrophotometry. J. Spectrosc. 2016, 2016. [Google Scholar] [CrossRef]
- Schultz, T.; Pfeiffer, M.; Franck, C.M. Optical investigation methods for determining the impact of rain drops on HVDC corona. J. Electrostat. 2015, 77, 13–20. [Google Scholar] [CrossRef]
- Nagi, Ł. Detection of ionizing radiation generated by electrical discharges in the air using sphere-sphere system. E3S Web Conf. 2017, 19, 01045. [Google Scholar] [CrossRef]
- Biswas, S.; Koley, C.; Chatterjee, B.; Chakravorti, S. A methodology for identification and localization of Partial Discharge sources using optical sensors. IEEE Trans. Dielectr. Electr. Insul. 2012, 19, 18–28. [Google Scholar] [CrossRef]
- Kebbabi, L.; Beroual, A. Optical and electrical characterization of creeping discharges over solid/liquid interfaces under lightning impulse voltage. IEEE Trans. Dielectr. Electr. Insul. 2006, 13, 565–571. [Google Scholar] [CrossRef]
- Shih, K.Y.; Locke, B.R. Optical and electrical diagnostics of the effects of conductivity on liquid phase electrical discharge. IEEE Trans. Plasma Sci. 2011, 39, 883–892. [Google Scholar] [CrossRef]
- Shcherbanev, S.A.; Nadinov, I.U.; Auvray, P.; Starikovskaia, S.M.; Pancheshnyi, S.; Herrmann, L.G. Emission Spectroscopy of Partial Discharges in Air-Filled Voids in Unfilled Epoxy. IEEE Trans. Plasma Sci. 2016, 44, 1219–1227. [Google Scholar] [CrossRef]
- Rosolem, J.B.; Tomiyama, E.K.; Dini, D.C.; Bassan, F.R.; Penze, R.S.; Ariovaldo, A.; Floridia, C.; Fracarolli, J.P. A Fiber Optic Powered Sensor Designed for Partial Discharges Monitoring on High Voltage Bushings. In Proceedings of the 2015 SBMO/IEEE MTT-S International Microwave and Optoelectronics Conference (IMOC), Porto de Galinhas, Brazil, 3–6 November 2015; pp. 1–5. [Google Scholar]
- Dilecce, G. Optical spectroscopy diagnostics of discharges at atmospheric pressure. Plasma Sour. Sci. Technol. 2014, 23, 015011. [Google Scholar] [CrossRef]
- Rózga, P.; Tabaka, P. Spectroscopic Measurements of Electrical Breakdown in Various Dielectric Liquids. In Proceedings of the IEEE 11th International Conference on the Properties and Applications of Dielectric Materials (ICPADM), Sydney, NSW, Australia, 19–22 July 2015; pp. 524–527. [Google Scholar]
- Kozioł, M.; Boczar, T.; Nagi, Ł. Identification of electrical discharge forms, generated in insulating oil, using the optical spectrophotometry method. IET Sci. Meas. Technol. 2019, 13, 416–425. [Google Scholar] [CrossRef]


© 2020 by the author. Licensee MDPI, Basel, Switzerland. This article is an open access article distributed under the terms and conditions of the Creative Commons Attribution (CC BY) license (http://creativecommons.org/licenses/by/4.0/).