Review

Biomass Availability in Europe as an Alternative Fuel for Full Conversion of Lignite Power Plants: A Critical Review

by
Vasiliki Tzelepi
1,
Myrto Zeneli
1,
Dimitrios-Sotirios Kourkoumpas
1,*,
Emmanouil Karampinis
1,
Antonios Gypakis
2,
Nikos Nikolopoulos
1 and
Panagiotis Grammelis
1
1
Chemical Process and Energy Resources Institute, Centre for Research and Technology Hellas, 52 Egialias str., 15125 Athens, Greece
2
General Secretariat for Research and Technology, 14–18 Messogion Ave., 11527 Athens, Greece
*
Author to whom correspondence should be addressed.
Energies 2020, 13(13), 3390; https://doi.org/10.3390/en13133390
Submission received: 30 April 2020 / Revised: 2 June 2020 / Accepted: 12 June 2020 / Published: 1 July 2020

Abstract

:
Biomass has been demonstrated as a capable source of energy to fulfill the increasing demand for clean energy sources which could last a long time. Replacing fossil fuels with biomass-based ones can potentially lead to a reduction of carbon emissions, which is the main target of the EU climate strategy. Based on RED II (revised Renewable Energy Directive 2018/2001/EU) and the European Green Deal, biomass is a promising energy source for achieving carbon neutrality in the future. However, the sustainable potential of biomass resources in the forthcoming decades is still a matter of question. This review aims at estimating the availability of biomass for energy reasons in the EU, and to evaluate its potential to meet the coal power plant capacity of the main lignite-producer countries, including Germany, Poland and Greece. Plants in line with the sustainability criteria of RED II have been selected for the preliminary estimations concerning their full conversion to the biomass power concept. Furthermore, the various barriers to biomass utilization are highlighted, such as the stranded asset risk of a future coal phase-out scenario, biomass supply chain challenges, biomass availability in main lignite-producer EU countries, the existing full conversion technologies, and biomass cost. A variety of challenges in the scenario of lignite substitution with biomass in a plant are investigated in a SWOT (strengths, weaknesses, opportunities, and threats) analysis. Technological risks and issues should be tackled in order to achieve the coal phase-out EU goal, mainly with regard to the supply chain of biomass. In this direction, the development of logistics centers for the centralized handling of biomass is strongly recommended.

1. Introduction

1.1. Policy Issues of Climate Change

The EU has updated its energy policy framework, in order to achieve the transition away from fossil fuels towards cleaner energy, in line with the EU’s Paris Agreement commitments about the reduction of greenhouse gas (GHG) emissions. The climate and energy framework for the EU sets targets for the 2021–2030 period, in which the GHG emissions reduction will be at least 40%, as well as the target that the shares of renewable energy and the improvement in energy efficiency will be at least 32% and 32.5%, respectively.
These changes will cause a significant impact from a consumer, environmental and economic perspective in the future. Consequently, they contribute to the long-term strategy of net-carbon emissions in the EU by 2050. This objective is a pillar of the new growth strategy, the European Green Deal, which corresponds to the Paris Agreement. It is a set of policy initiatives that reaffirm the Commission’s intension to commit Europe to being the first continent to achieve climate-neutrality by 2050, increasing the EU 2030 climate target regarding GHG emissions reduction to at least 50%, and towards 55%, in a responsible way. All key economic sectors will be examined, including energy, transport, industry and agriculture. The action plan will be released in the summer of 2020.

Reducing Carbon Emissions: EU Targets

The RED II, included in the Clean Energy for all Europeans package, came into force intending to keep the EU as the global leader in renewables. Towards this direction, electricity produced from biomass fuels could be taken into account by all installations with a total rated thermal input lower than 50 MW, and in these with a total rated thermal input over 50 MW, which apply high-efficiency cogeneration technology or for only-electricity-producing, meeting specific technical demands. Installations with a capacity above 100 MW could be taken into account only if the net-electrical efficiency is at least 36%. About power-only-installations, the directive states that they will be considered on condition that they do not use mainly fossil fuels, and there is no cost-effective potential for the adjustment of high-efficiency cogeneration technology as stated in Article 14 of Directive 2012/27/EU. The GHG emission savings from the use of biomass fuels are expected to be at least 70% for installations starting within the period 2021–2025, and 80% for installations starting up in the beginning of 2026. The Annex V (part C) contains the methodology for the calculation of the total GHG emissions and emission saving of biomass fuels (RED II Methodology).
Whilst coal remains a main fuel in the European energy mix, coal power is on the decline as affected by several utility plans, which aim to be coal-free in 10 to 15 years. The transition to lower-carbon energy forms and innovative technologies, for instance, carbon capture and storage, is mandatory in order to meet the EU’s binding target to reduce carbon emissions by 2030. In 2018, the total emissions of Europe’s coal plants were 625 million tons of CO2 [1], which accounts for almost 15% [2] of the EU’s total GHG emissions. Although the shift to a low-carbon economy expounds opportunities, economic and social impacts in many coal regions should not be neglected, such as the utilization of capital assets (coal power plants), otherwise, they have to be abandoned. In this case, biomass could play a significant role, in order to be used as a non-conventional fuel for these plants, keeping the infrastructure in operation even while most of the countries have announced the coal phase-out.

1.2. The Transition to the Post-Lignite Era

The commitments to greatly limit carbon emissions by 2030 may demand a costly shift for the global economy. This entails the possibility of assets with high carbon-intensive operations becoming “stranded”. That means that these technologies would change into unprofitable assets, because of the regulation (e.g., taxes on carbon) and technological development. Carbon restrictions would possibly affect carbon-intensive industries in general, and especially industries depending on energy or other carbon-intensive inputs [3]. McGlade and Elkins’ (2015) [4] estimation in the context of accomplishing the Paris Agreement’s goal, of keeping the average global temperatures increasing below 2 °C, was that around 35%, 50% and 90% of current oil, gas and coal reserves, respectively, are useless. Following this, the Economist Intelligence Unit appraises that the expected financial loss of assets will be approximately USD 4.2 trillion [5].
The implementation of regulation to mitigate the emissions, so far, has shown significant variability and volatility in setting a cost for CO2 emissions, and thus a depreciation of investment in green energy sources. This signifies that global investors are currently confronted with a stark choice. Either they will experience a failure unless their holdings in fossil fuel industries act on climate change, and be held, or they will face losses to their whole portfolio of manageable assets, if little lessening is forthcoming. Charting a path away from these two alternatives should be a strong incentive for long-term investors to engage with companies in their portfolios, and to alter investments in the direction of a lucrative, low-carbon future [5]. This strategy of diversifying away from vulnerable products, and diverting the marketplace and jobs toward income sources that are more environmentally friendly, is named “Economic diversification” [6].

2. Lignite Sector in the EU

2.1. Lignite Production

Coal remains a major contributor to global energy supply, making up 38% of electricity generation in the year 2018 [7]. Lignite, usually referred to as brown coal, is the lowest rank of coal (LRC), because of its relatively low energy content (<16,500 kJ/kg) and its low calorific value, less than 4.165 kcal/kg; its water content is relatively high, equal to 40–60%, and its carbon content is 60–70%. Owing to its high moisture content, it is unsuitable for trade, unless the distances involved are not too high. Apart from this, lignite may ignite spontaneously when stockpiled. Therefore, producers and consumers avoid accumulating large lignite stockpiles. Due to its difficulty in handling, the transportation cost is rather high, and trade through the sea is considered unsuitable for both safety and economic reasons. Therefore, lignite is usually burned in power plants placed very close to the mines. Overall, 95% of lignite is consumed for power production in combined heat and electricity, and only-electricity, power plants [8].
In 2018, global lignite production was approximately 0.8 billion tons. Amongst the major producers, such as Europe, China and Russia, Europe accounts for almost 40% of global lignite reserves. Table 1 presents the lignite production in Europe, the lignite-based electricity generation and the share of it in the total electricity generation in each country. Specifically, the availability of lignite is considerable in four EU countries—Germany, Greece, Poland, and the Czech Republic—and the share of lignite in electricity production is substantial in Czech Republic, Bulgaria, Greece and Poland.

2.1.1. National Coal Phase-Out Announcements in Europe

Several governments in Europe have declared their intent to phase out coal production, lessening dependence on fossil energy sources. A sum of 72.8 GW of electricity capacity produced by coal is placed in specific countries that have declared their intention to phase out coal by 2030 or earlier, setting the coal-fired power plants in these countries on a path to shutting down —for several of those coal-fired power plants a closure date has been made public, but for most of them, this decision has still to be made. This number contains the capacity of Germany, that is set to shut down by 2030; for the rest, which constitute 17 GW, the government means to shut down by 2038. Approximately, the aforementioned power coal plants correspond to 40% of Europe’s currently-operational coal capacity.
In Table 2, a summary of the status of the largest lignite-producer countries is provided.

2.1.2. Studies on Biomass Availability and Co-Firing in Lignite Boilers

During the last years, researchers have investigated the potential of biomass utilization in co-firing concepts. A seminal contribution has been made by Roni et al. [14], which provides a thorough review of current biomass co-firing conditions, policies, challenges and opportunities all over the globe. Based on their work, biomass co-firing has already received wide acceptance in many European countries, mostly in the northern and central parts of Europe. These include the United Kingdom, Germany and the Nordics. However, it is emphasized that a subsequent increase in biomass demand may affect negatively the economy of some of these countries, who lack a sufficient amount of biomass resources. Furthermore, it is stated that even though the use of biomass in co-firing is currently showing positive trends in Europe, many coal co-firing plants are old and on the verge of a permanent shutdown. Nevertheless, some EU countries that have not managed yet to commission new-build plants or renovate their existing old ones are not able to widely develop, establish and implement biomass co-firing strategies. The same trend is observed, as well, outside Europe, with a notable example being that of Brazil, a country with abundant biomass resources, mostly agricultural residues. Brazil is a major biofuel producer, but lacks a sufficient biomass co-firing strategy [14]. The Brazil biomass potential model has been evaluated by Welfle [15], in which the levels of resources that it may be possible to export have been analyzed. This research determines that Brazil has huge biomass sources that are potentially adequate to both balance Brazilian total primary energy consumption by 2030, and for Brazil to increasingly become a major exporter of energy sources.
In a previous study of Ozcan et al. [16], the primary electrical energy potential of Turkey is defined based on the respective biomass potential, according to different biomass source types: energy crops, municipal solid wastes, urban wastewater treatment sludge and animal manure. For each biomass source, the biogas and biomass energy potential were calculated. The calculations indicate that the power capacity corresponding to the biomass potential could have a major share in the overall power capacity in Turkey. It is also emphasized that policymakers have to determine specific aims for biomass application to electrical systems, and incentive chances have to be provided to investors so as to limit the energy dependency of Turkey.
In addition to studies on biomass potential, numerical studies regarding the emissions of biomass co-firing have been conducted, focusing on NOx emissions. Drosatos et al. [17] study an indirect firing scheme burning biomass, specifically cardoon, as supporting fuel for a pulverized-lignite boiler throughout its operation at a thermal load of 35%. The numerical results of this analysis are compared with an alternative indirect firing scheme, which uses pre-dried lignite as supporting fuel. This comparison shows that cardoon results in a higher combustion efficiency than pre-dried lignite, whilst the reduction of NOx emissions depends on the firing strategy. This has also been explored by Nikolopoulos et al. [18], whose study investigated the biomass (cardoon) co-firing concept at a 10% biomass thermal share for a pulverized fuel boiler in North Greece, developing a computational fluid dynamics (CFD) model for plant simulation. The results proved that the boiler operational parameters are not affected by the co-firing operation. CFD analysis recommends that a potential benefit of co-firing conditions is the reduction of NOx emissions by up to 10%.

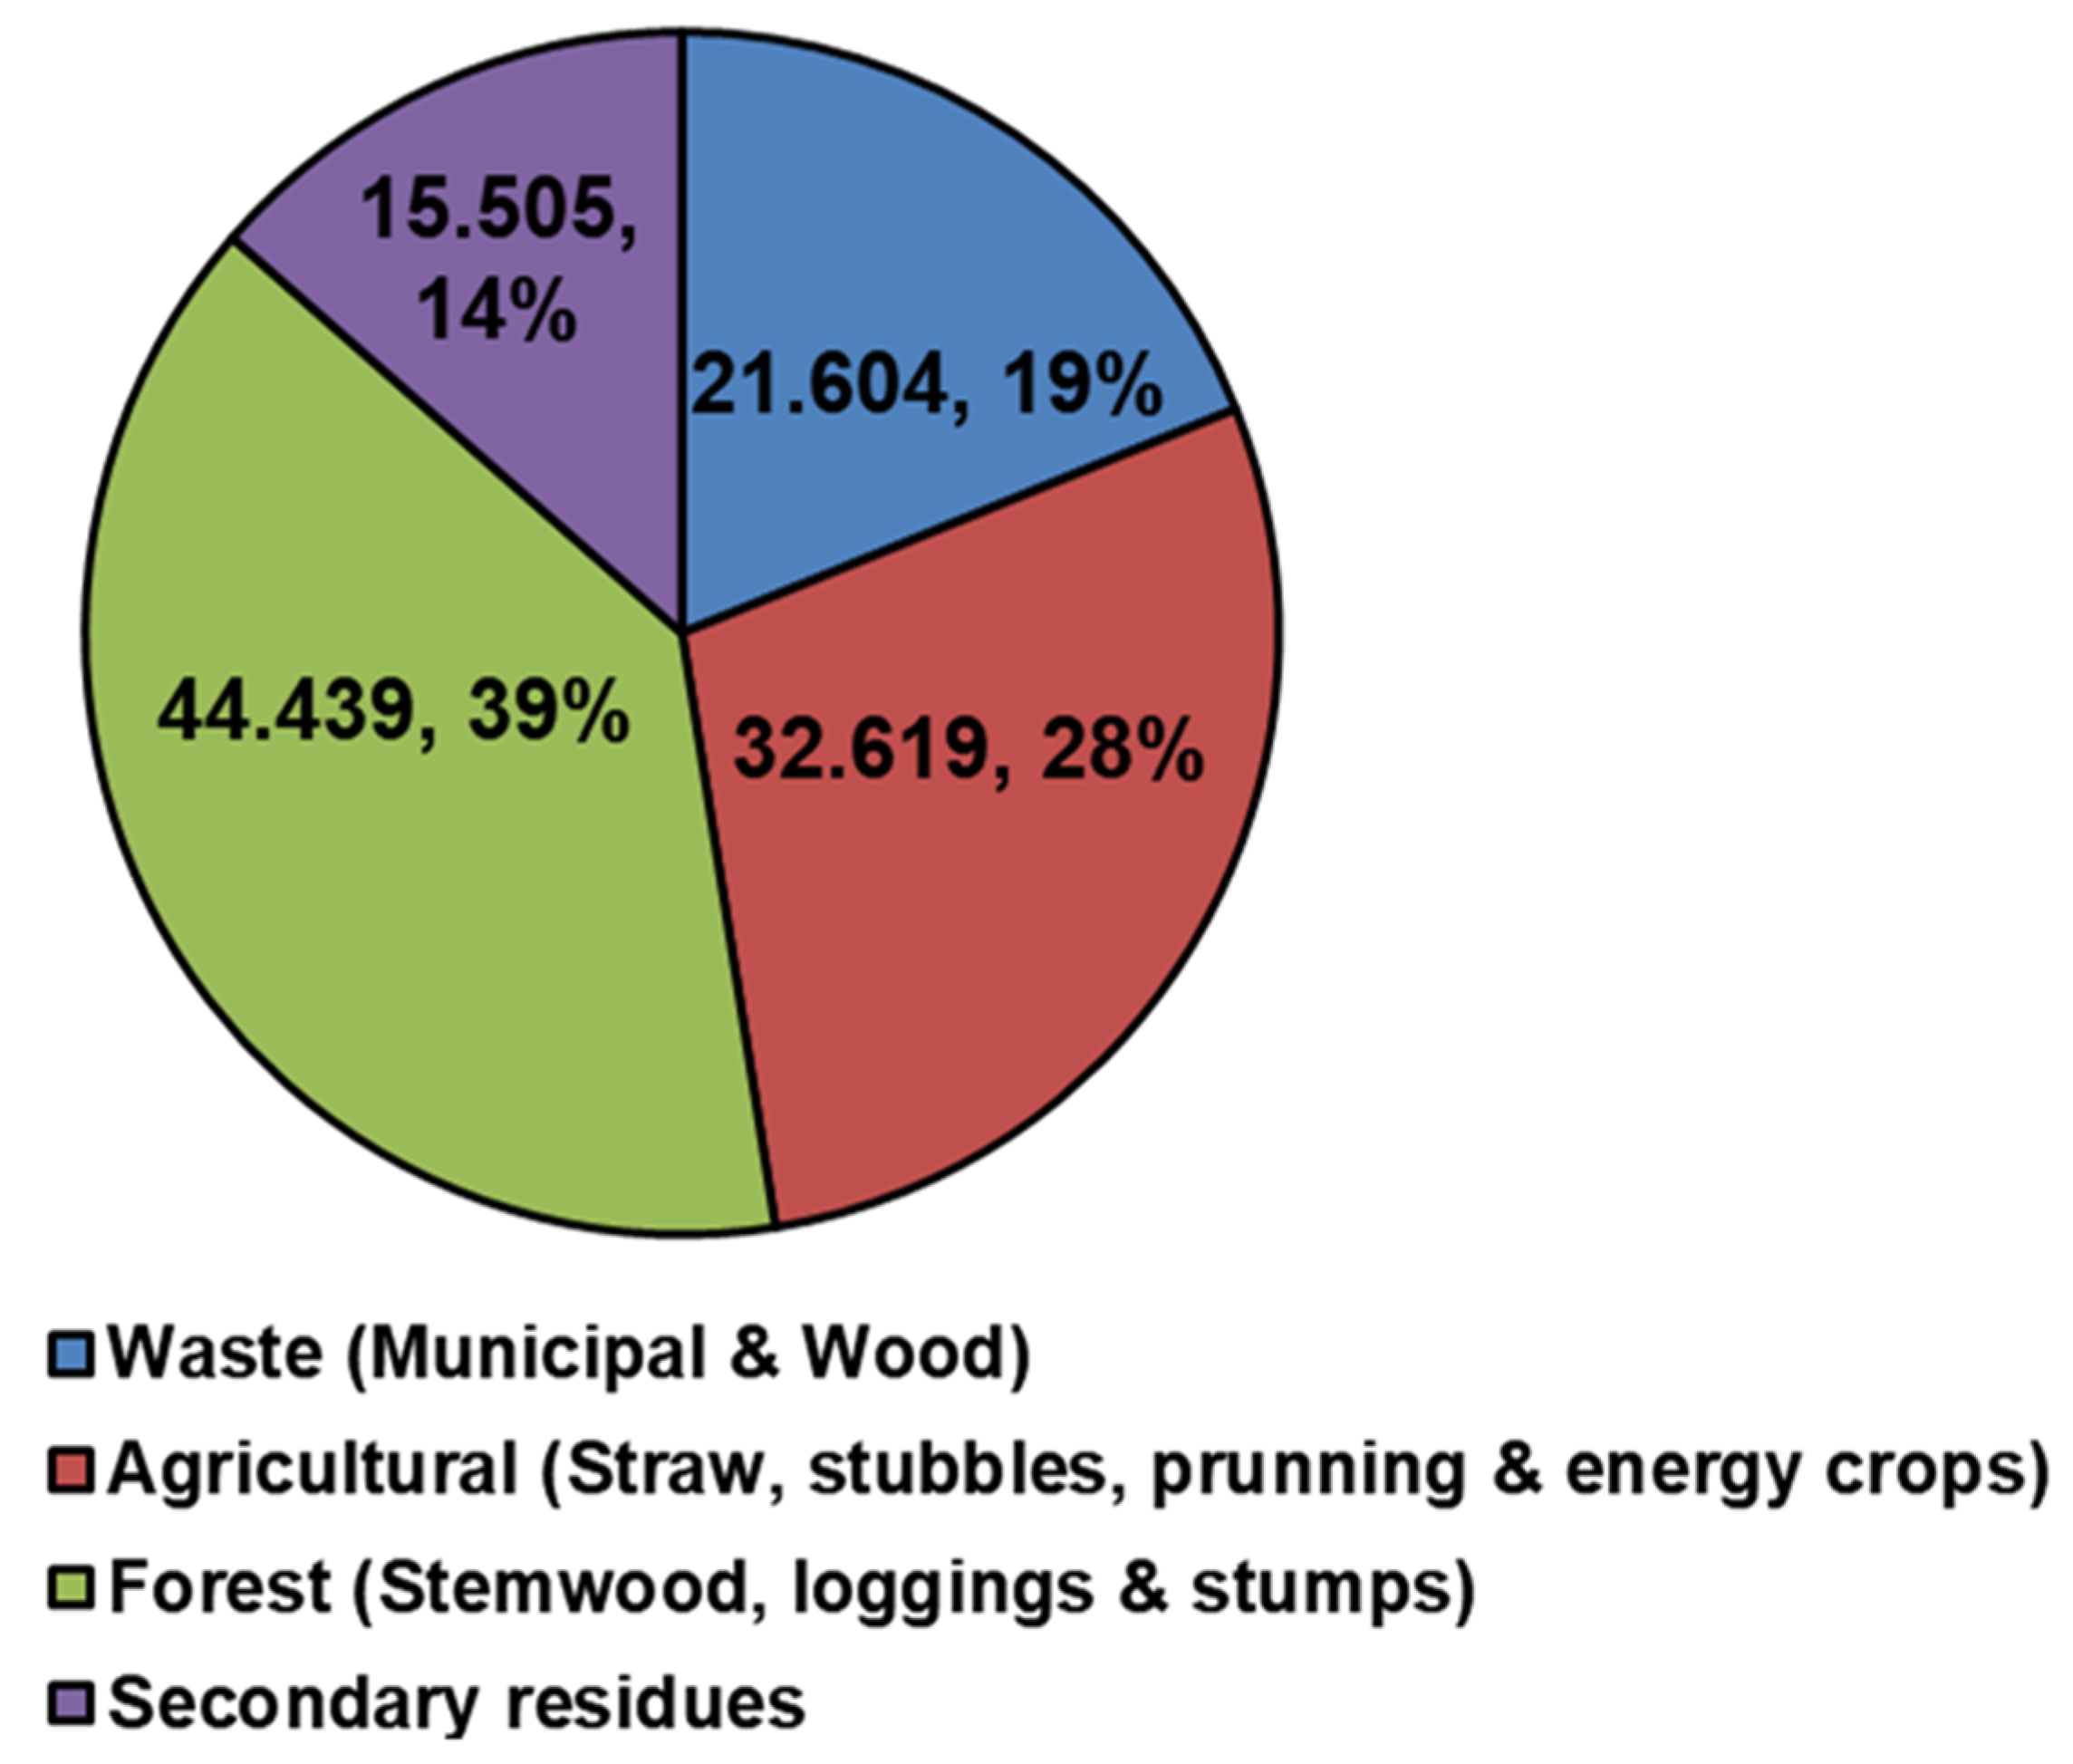
2.2. Worldwide Biomass Availability

The total Primary Energy Supply of biomass resources was 56.5 EJ in 2016, composing a 70% share of the total renewable energy sources (RES). Biomass was the greatest renewable energy source, with a 13% share in the global energy mix, compared to other RES. In Africa, more than 90% of the total primary energy supply of RES came from biomass. In each other continent, biomass was the largest renewable energy source in terms of supply, and accounting for between 40% (Oceania) and almost 96% in Africa. In the total primary energy supply of biomass, 87% was in a solid form—e.g., wood chips, wood pellets and fuel wood—and 5% was from municipal and industrial waste. Biofuels and biogas shares were at 6% and 2% [19]. In 2018, the global capacity of biomass plants was about 130 GW, in which China had the largest capacity in the world, at 17.8 GW, and the USA the second largest capacity, at 16.2 GW. Large biomass power plant capacities were also installed in India (10.2 GW), Germany (8.4 GW) and the UK (7.7 GW) [20].
Due to the wide availability of biomass all over the world, on the grounds that it can be produced mainly as a by-product of many industrial and agricultural procedures, biomass represents a growing renewable energy source with great growth potential [21]. Brazil is the major exporter of bioethanol, mostly to Europe, the United States and Japan. The United States, Argentina, Indonesia and Malaysia are the greatest exporters of biodiesel, principally to Europe [9]. The considerable exporters of wood pellets are Canada, the United States, Russia and the Balkan States, with Europe being the largest importing area [22,23,24].
North America is the most comprehensive exporter of pellets, the preponderance of these being transferred to Europe. Canada is the prevailing exporter, which also supplies pellets to the United States. In Scandinavian countries, there is an important domestic pellet production, which is however outpaced by the growing demand. This leads them to increase continuously their import of huge volumes of pellets from the Baltic Regions and Russia [25]. Supplementary wood pellet trades that flows to Europe come from Australia, Argentina and South Africa [9].
Based on 2013 data, the greatest wood chip-producing countries are Canada (25%), China (13%), South Africa (5%), Sweden (5%) and the USA (5%) [26]. Every one of these countries incidentally and relevantly owns sizable pulp and paper production plans. The EU is a net importer of wood chips, as well as exhibiting many dynamics of EU State intra-trading. Sweden, Finland, Austria and Italy are major importers and Germany, Latvia and Estonia are major exporters. Outside Europe, an increasing trend in wood chips production has been observed in Russia, Uruguay, Brazil and Canada [15].

2.3. Biomass Availability in Main Lignite-producer countries

In the EU-28, the energy produced from biomass has increased 466 PJ (13%) this decade, principally driven by a rapid extension in the power and heating industries sector. In 2019, biomass constitutes a total of almost 3% of all electricity generation and 19% of derived heat production across the EU, remaining a comparatively moderate percentage of all renewable electricity but a very vital contributor to renewably sourced derived heat. A common coal power station generates much more electricity than a purpose-built biomass power station, and so demands significantly more input fuel because of the lower biomass calorific value than the calorific value of coal. Constantly sourcing the quantity of biomass needed to fuel a coal power station presents difficulties in supply chain issues. In phase-out countries, coal power plant operators must shut down their assets or retrofit them to burn alternative fuel. Biomass is one of these fuels coming into consideration [27].
In the following sections, the biomass potential is presented at the main lignite-producer countries, in order of mass lignite production: (i) Germany, (ii) Poland, (iii) Czech. Republic, (iv) Greece, (v) Bulgaria and (vi) Romania. Data are retrieved from S2biom platform, developed in the framework of S2biom project [28].

2.3.1. Germany

In Germany, almost 90% of lignite production is burned for electricity generation (159.3 Mton in 2015), representing 23.9% of total electricity generation in Germany. Generally, it has been the world’s most significant lignite producer and consumer, since the beginning of the industrial lignite production [29]. Lignite is mined in Germany in four fields: the Rhenish, the Lausitz, the central German and the Helmstedt lignite field. In the Rhenish lignite field, RWE Power AG operates four large opencast mines in the area—Bergheim, Hambach, Inden and Garzweiler, with a total production of almost 95.2 Mt [30].
In parallel, Germany is one of the European countries with the greatest biomass potential, from the forest, agricultural and waste sector. In 2020, the total sustainable biomass potential in Germany, including primary and secondary residues from the abovementioned sectors, is estimated to be equal to 113 Mton dm. As can be seen from Figure 1, the highest share is from forest biomass, equal to 39%—corresponding to ~44.44 Mton; whilst the agro-biomass share—including straw, stubbles, pruning and energy crops—is equal to 28%—corresponding to ~32.62 Mton. The rest of the biomass sources, i.e., waste and secondary residues, have a lower share—19% and 14%, respectively. However, these sectors, regardless of their relatively low share, present a high potential, equal to 21.6 and 15.5 Mton, respectively.
Agricultural sector
The agricultural land in Germany is almost 17 million hectares. Most of this area, nearly 71% of it, is utilized as arable land [31]. Overall, in 2020, the agro-biomass in Germany is based on straw and stubbles (share equal to 86%) and energy crops (share 14%), as displayed in Figure 2. This corresponds to 28.04 Mton and 4.43 Mton, respectively. Biomass originating from prunings and orchard residues will be available in small quantities in Germany in the upcoming years (only 0.15 Mton). Therefore, the most important agricultural crops/residues in Germany are cereal straw, maize stover, oil seed rape straw, miscanthus and switchgrass.
Amongst them, cereal straw with a sustainable potential over 20 Mton for 2020 could potentially play a significant role in the energy mix for Germany in the future. So far, even though this crop presented a high availability—in 2010, cereals reported the highest share amongst agricultural crops, as they covered 6.6 million hectares of agricultural land, a value accounting for 39.5% of the German Utilized Agricultural Land (UAA)—it remained mostly unexploited as a waste material [32].
Near the central German and Helmstedt lignite mining areas is located one of the highest sustainable areas of cereal straw, with a potential of almost 2.5 Mt/year. This implies that cereal straw can be easily utilized for co-combustion with lignite in power plants manufactured near this area. In addition, it should be noted that in the areas near the Rhenish lignite mines, the sustainable cereal straw potential is rather moderate (equal to 0.3 Mt dm for 2020). The rest of the agricultural crops in these areas have a rather small availability.
Forest sector
Germany is one of the most densely wooded countries in Europe. One-third of the total area of land is covered with forests—approximately 11 million hectares. Currently, German forests consist of 60% coniferous trees and around 40% deciduous (only non-conifer trees designated in this research) trees. Additional information obtained from the literature suggests that 73% of the forests in the country consist of mixed stands. Spruce correspond to the highest share among tree species (28%), followed by pine (23%), beech trees (15%) and oak trees (10%). During recent years, fuelwood has become more important in Germany’s energy mix, owing to the increasing energy prices and restrictions posed by the EU that promote the use of renewable sources [33]. As concerns the sustainable potential, in 2020 the forest sector in Germany is primarily based on stemwood from final fellings and thinnings from conifer and nonconifer trees (94%), and a smaller share on logging residues (6%), as presented in Figure 3.
Around areas located near lignite mines, in central Germany, the total sustainable forest biomass potential is estimated to be equal to 2.3 Mton for 2020, which is the area with the highest forest sustainable potential. In addition, near the Rhenish lignite mines, there is a rather moderate availability in 2020 (~0.59 Mton).

2.3.2. Poland

In Poland, lignite reserves amount to 1.4 billion tons. Poland is the fourth worldwide producer, characterized by the existence of more than 150 small to large lignite deposits. However, only a limited number of them are currently exploited, and only at surface mines [34]. Its major contributors of lignite are settled in central Poland (Bełchatów and Szczerców fields), and a third one is settled to the south-west (hex. Turoszów lignite basin) of the country. Amongst them, the Bełchatów mine is the largest contributor to Poland’s lignite production (42.1 Mton of lignite, or 66.7% of total lignite production in 2015).
Poland has considerable renewable energy resources—crops from 1.0 to 4.3 million ha can be used for energy production. It is evaluated that the technical potential of renewables is higher than that of Denmark and Sweden, and this may be utilized to cover almost 50% of the country’s energy demand [35].
The total sustainable biomass potential in 2020 is the agricultural sector—with a rate equal to 48%, which corresponds to ~33.6 Mton (Figure 4).
Agricultural sector
In 2015, the arable land as a share of the Polish land area was 35.6%. This share fell gradually from 50.4% in 1966 to 35.6% in 2015 [36]. The largest amount of agricultural residues in Poland comes from cereal straw, maize stover and oil seed rape straw. Overall, straw production in Poland is assessed at 25–28 million tons yearly, of which almost 4.9 million tons of rape straw and cereal may be used for energy reasons. A moderate production also comes from sugarbeet leaves and fruit tree plantations.
It should be noted that in central Poland, where there are the lignite mining areas of Bełchatów and Szczerców, the total agro-biomass potential is equal to 1.7 Mton in 2020. In addition, these areas have a high cereal straw and fruit tree plantation availability.
Forest sector
Forests in Poland cover approximately 30% (corresponding to 9197.9 thousand hectares) of the total country land (in the reference year 2012). A portion of 51% of the total forest area is covered by coniferous forest habitats, and the rest of it, with a share of 49%, is covered by broadleaved habitats. In central Poland, where the largest lignite mining areas are located, the lowest level of forest cover is found (21.3%) [37].
Secondary residues/municipal waste
A high share from secondary residues, amounting to almost 24% (corresponding to ~3 Mton), comes from cereal bran, which is followed by biowaste unseparately collected (22%, corresponding to almost 2.6 Mton) and residues from further wood processing (22%), sawdust from conifer trees (6%), and black liquor (7%) (see Figure 5).
Central Poland has a high sustainable municipal waste potential (~0.175 Mton/year) in 2020. In addition, sawmill residues from conifer trees (including sawdust) have a rather limited availability, almost equal to 0.08 Mton/year.

2.3.3. Czech Republic

As in the entire EU, in the Czech Republic, biomass offers a high potential for development as an energy source. The national lignocellulosic biomass potential is around 15 m dry ton/year (excluding primary forest harvest), based on forest and agriculture resources, waste and dedicated crops. Focusing on the agro-biomass and forest potential, the main available crops are cereal straw, maize stover and oil seed rape straw.

2.3.4. Greece

In Greece, lignite is the most important indigenous energy resource, accounting in 2018 for 20.16% of the country’s primary energy supply of 23 Mtoe [38]. It is mined by the Public Power Corporation (PPC), the largest Greek lignite producer, exclusively in opencast mines. The most important deposits are settled in northern Greece, at Ptolemais-Amynteon and Florina (1.5 billion tons). These two deposits account for 80% of Greek lignite production. Other deposits can be found in Drama (900 Mton) and Elassona (170 Mton), as well as in southern Greece at Megalopolis (225 Mton). In addition, there is a large peat deposit at Philippi in East Macedonia [39]. Greek lignite is characterized by very high ash and moisture contents, thus being one of the lowest quality solid fuels used on a global basis [40].
The outlook of lignite consumption in Greece will be significantly limited by the environmentally compatible generation of electricity [41]. Over the past 10 years, the portion of lignite meeting demand has clearly decreased, combined with a similar increase in the shares of renewable energy resources (RES), hydropower and imports. However, owing to its large deposits in Greece—only 30% of the total lignite reserves have been extracted until now, and other reserves are adequate for over 40 years at present production rates—lignite is expected to remain an important contributor to the country’s energy production.
Greece is a country with a high biomass potential, in which the shares of each biomass source are shown in Figure 6. The national biomass potential—from agriculture, forests and waste, excluding primary forest harvest—is around 6.24 dry ton/year.
Agricultural sector
In Greece, almost 36.8% of the total land area is Utilized Agricultural Land (UAA), corresponding to 4,856.8 thousand ha. A total 37.4% of this area is arable land, primarily utilized for cereal production, and 19.1% for permanent crops. The comparatively unexploited agricultural sector in Greece has a rather limited potential for co-firing in lathe units. Three main types of biomass can be used for such a purpose: (i) straw and stubbles, (ii) prunings from permanent plantations, and (iii) energy crops.
Straw and stubbles and prunings from permanent plantations
In East and Central Macedonia, where lignite deposits are located, cereal straw and maize stover present the highest availability. In total, the biomass potential in Greece from straw, stubbles and prunings from permanent plantations is in the range of 2.5 Mton dm (the year 2020). More specifically, the cereal straw and maize stover potential are almost equal to 0.8 and 0.6 Mton dm, respectively. However, even so, the biomass co-firing scenario in Greece seems to be not technically feasible for large-scale units. Certain amounts can be used for co-firing with lignite in Greece, or delivered to neighboring countries, but only for pilot-scale units.
Energy crops
Overall, the energy crop potential is in the range of 1.3 Mton dm. Amongst the herbaceous energy crops, the ones that are appropriate for the Greek conditions, and thus have the highest potential, are miscanthus, switchgrass and giant reed.

2.3.5. Bulgaria

In 2016, Bulgaria was the fifth major producer of lignite in the EU-28. Its total production amounted to almost 31.2 Mt [42]. The Bulgarian lignite is characterized by a high sulphur content (2.2–2.8 wt % as received) [43]. Lignite co-firing with biomass is considered as a feasible scenario in Bulgaria for the upcoming years. Most of the sustainable biomass in the country is from the agricultural sector—with a total share equal to 65%, which corresponds to ~10.6 Mton—and then from the forest sector—with a share equal to 25%, which correspond to ~4 Mton. Some small availability is theoretically calculated from secondary residues (~1 Mton) and waste (~0.6 Mton) (see Figure 7). This section will mainly focus on biomass originating in the agricultural sector, and some brief data will be given as well for the forest sector.
Agricultural sector
The agro-biomass potential in South Central Bulgaria, where the AES Galabovo and other lignite power plants are settled is of particular interest in the specific country. This area has a high potential for cereal straw (almost 0.47 Mton) and sunflower straw (0.2 Mton). Theoretically, the cereal straw potential of the district alone is adequate to support a co-firing scenario at 5% thermal shares. As concerns lignocellulosic biomass crops, South Central Bulgaria has a sustainable potential of 0.81 Mton in 2020. Owing to the fact that the lignocellulosic energy crops availability is expected to decrease considerably in the upcoming years, these crops are not recommended as suitable for co-firing with lignite at power plants.
Forest sector
Based on data from U.N. FAO (Food and Agriculture Organization of the United Nations), almost 3,927,000 ha (or 36.1%) of the total area of Bulgaria is forested [44]. This country is the third richest in biodiversity amongst the European countries; its forests have an increasingly important environmental and recreational role. The growing stock in Bulgarian forests is equal to 656 million m3, out of which 287 million m3 are coniferous trees and 369 million m3 broadleaved (non-conifer trees, designated in this research). The Bulgarian forestland has grown almost 8% within the period 2000–2015 [7]. In South Central Bulgaria, which is the area of the highest interest, the biomass potential originating from the forest sector approaches 1.25 Mton.

2.3.6. Romania

Romania is the sixth largest producer of lignite in the EU-28 (total lignite mined equal to 23 Mt in 2016). Lignite resources and reserves are approximately 9920 Mt to 280 Mt, respectively; most of them can be found in the Oltenia basin, geographically located in Sud-Vest Oltenia [7].
The total area of Romania is approximately equal to 24 Mha. Almost 43.4% of it, which corresponds to 10.3 Mha, is utilized as an agricultural area, whilst the arable land is 6.6 Mha [45]. In terms of existing potential, biomass is full of promise for the RES of Romania. More specifically, the major contributor of biomass in Romania, as shown in Figure 8, is the agricultural sector (with a share of almost 52%, and a total amount of approximately 26.52 Mton) followed by the forest sector (with a share of 32% and total amount ~16 Mton), secondary residues (share 10%, and total amount ~5 Mton) and waste (a small share of 6%, and limited availability of ~3 Mton).
Agricultural sector
Overall, in 2020, the agro-biomass in Romania is primarily based on energy crops (share ~55%) and on straw and stubbles (share ~44%). This corresponds to 14.68 Mton and 11.7 Mton, respectively. Biomass originating from prunings and orchard residues will not be available in high quantities in Romania within the coming years (only 0.11 Mton). The most important agricultural crops/residues in Romania are cereal straw, maize stover, oil seed rape straw, sunflower straw, miscanthus and switchgrass. During the last few years, cereal had the highest share of agricultural production, at a production level of around 7.7 Mton in 2012 (technical potential). In the year 2020, the sustainable cereal potential is equal to almost 4.6 Mton. This is a little bit lower than the expected potential for maize stover (4.5 Mton for 2020). Romania is also an important producer of sunflowers, with production at 1.3 Mton in 2020. Finally, oil seed rape straw production is almost 0.8 Mton in 2020.
Generally, biomass potential is regionally distributed over Romania. In southwestern areas, where Oltenia is located, only cereal straw and maize stover can be found. As regards this area, a high sustainable potential originates from cereal straw (~1.1 Mton/year), maize stover (~0.77–0.82 Mton/year), and limited ones from sunflower straw (~0.1 Mton/year) and oil seed rape straw (~0.07–0.1 Mton/year).
Forest sector
The total forestry area in Romania covers 6.55 million hectares (according to 2015 data). This corresponds to approximately 27.5% of the country’s total area land. This rate is lower than the European average of 32%. In terms of species, out of this total area, coniferous trees (spruce, fir, pine) represent about 26%, beech trees about 31%, oak about 16%, other hardwoods 20%, and other softwoods 7% [46].
The total forest biomass potential in Romania is estimated to be equal to 16 Mton in 2020. From this high amount, the highest share, of almost 88%, comes from stemwood (primary forest production) which corresponds to 14 Mton, and a small share from logging residues (around 2 Mton). In Sud-Vest Oltenia, which is an area of high interest, since it is where the lignite basin is located, there is high sustainability potential.
Secondary residues/municipal waste
Overall, the biomass potential in Poland, originating from secondary residues and municipal waste, is high (~12 Mton/year), as can be noticed in Figure 9. A high share from this amount, almost 28% (corresponding to ~2 Mton), comes from biowaste not separated at the source of collection, and this is followed by residues from further wood-processing (share 17%, corresponding to ~1.2 Mton), cereal bran (share 11%, corresponding to 0.766 Mton) and sawmill residues, excluding sawdust, from conifer and non-conifer trees (total share of 24%, corresponding to ~1.7 Mton).
Sud-Vest Oltenia has a total potential of almost 9.3 Mton (the reference year 2020). Biomass originating from biowaste is estimated equal to 0.2 Mton/year for this region.

3. Biomass Conversion Technologies for Electricity Production: Focus on Full Conversion of Power Plants

Biomass processing intends to endow biomass with characteristics that could ensure a simple and environmentally friendly technological conversion into useful energy. The conversion pathways are categorized by the type of biomass input, the technologies, and the end products. The harvested biomass can be used by either direct conversion to energy (primary biomass), or being treated before the energy conversion (secondary biomass). Primary biomass, such as woodchips and logwood, is burned usually to produce energy for electricity supply, cooking, steam, space heating and process heat. Secondary biomass is in different forms, such as solids (e.g., pellets, wood thermochemically treated fuel), liquids (e.g., vegetable oil, biodiesel, HVO/HEFA, bioethanol, Fischer-Tropsch fuels) or gases (e.g., syngas, biomethane, biogas, bio-H2,), and can be used for a large number of applications, for instance, high-temperature industrial processes and transport [47]. These valuable energetic biomass forms could be interdependent in many cases. Specifically, syngas as a gas mixture of hydrogen, CO2 and methane, could be upgraded to increase H2 fraction in syngas [48]. Different parameters affecting the production of syngas from biomass, e.g. reactor model and conditions, and feedstock (carbon structure of biomass, the content of sulfur compound, etc.), have to be adjusted accordingly [49]. Moreover, the use of catalysts could be an effective method for increasing the H2 yield from syngas [50].
The pathways of biomass-to-energy conversion can be defined by the processes: (i) The thermo-chemical processes, such as combustion, gasification, pyrolysis, torrefaction and carbonization, which are based on thermal energy of biomass. (ii) The physical-chemical conversion processes based on physical (e.g., milling, pressing, etc.) and chemical processes (e.g., hydrothermal treatment, esterification). (iii) The bio-chemical conversion, which is based on biological processes including the use of microorganisms, such as anaerobic digestion producing biogas, and fermentation producing ethanol [25]. The main distinction of a preferable technology is the moisture contented in biomass. In the case of "dry" biomass, thermochemical technologies are mainly preferred, and in the case of “wet” biomass, bio-chemical conversion technologies could be more suitable [51].
The total phase-out coal target, while maintaining the current assets in operation, can be a reason to use high shares of solid biomass in the fuel blend of biomass for powering technology, often up to 100%. This demands the change of fuel input, pre-treatment and burning system to something that could also use biomass properly. An example of a 100% retrofit to biomass is the power plant “Rodenhuize 4” (Table 3). The conversion began with the installation of infrastructures in transport and pre-treatment for the proper handling of wood pellets, and the conversion of a one-burner row in 2005. Firstly, the switch of burner rows to wood pellet firing was completed, and finally, the complete switching was succeeded by replacing the burner, and installing a Selective Catalytic Reduction (SCR) unit in order to monitor the NOx emissions [52].
A summary of plants that have been shifted from coal to biomass is provided in Table 3. Most retrofit conversions have been applied in pulverized fuel boilers. In these boilers, the retrofits were implemented to the pre-treatment and feeding system, along with the logistics infrastructure for biomass sourcing. An extensive retrofit example is the Polaniec Green Unit in Poland, in which the older boiler was replaced with an advanced circulating fluidized bed boiler, and the steam turbine was modified too.
Currently, the largest biomass consumer in the world, with four biomass-converted units, is the power plant company Drax. In 2018, more than 7 million tons of wood pellets were used as feedstock in this plant, originating mostly from the USA (62.2%) and Canada (17.3%), with the rest of the feedstock volumes originating from Brazil and other European countries [53].

4. Biomass Cost

The major challenge in biomass supply chain management is the collection of biomass at the agricultural field. Many problems arise due to the biomass composition and its low bulk density, along with the inappropriate preparation of the field for the sowing of the next crop by famers. Thus, economic techniques for proper collection of biomass need to be practiced, in order to avoid a lessening of the profits and subsequent hindering of the development of technology. Automation–mechanized techniques for collection, transportation and pre-treatment can contribute to the reduction of the biomass feedstock significantly. For instance, limiting the distance of the energy conversion unit from the field, choosing proper transportation modes (truck, railway, vessel, etc.) or using on-site technology [9]. Moreover, the Geographic Information Systems (GIS) have been studied in order to identify the best location of the biomass feedstock, while relevant cost models of transportation have been identified with the intention of optimizing the supply chain regarding the location of the biofuel facilities (pretreatment, treatment, storage) [54].
The storage of biomass after the stage of the collection is a stage which secures the uniformity of the demanded feedstock, in order to sustain the proper operation of a biomass energy conversion unit, or plant in general. After the stage of harvesting, the biomass feedstock is discerned to be unprotected from biological decomposition due to high moisture in the environment [55]. Therefore, the conservation of biomass from rain and insects is needed, and can be achieved by storing it in a building, or by covering it with polythene, before the transportation to an electricity generation plant. On the other hand, the ventilation and timely protection or use of biomass in the storage are also essential, since several aerobic microbes may bring about biological damage under aerobic conditions. This biological decomposition affects biomass content [45]. The recommended moisture level is lower than 10% on a dry basis, for long term storage of biomass, while regarding pelletization, the respective level of moisture is 30%. In addition, specific precautions and measures should also be taken during storage to protect the biomass from the fire [56].
Biomass transportation from the agricultural field to the electricity production plant is another challenge in the utilization of technologies. Each biomass type has different chemical and physical characteristics, and therefore, their transportation cost may differ depending on location, end-use, availability and harvesting season. Solid biomass densified to a high extent, such as wood chip and tree residue, can be transported easily in chopped, baled and pelleted forms. However, loose biomass, such as rice straw, rice husk and wheat straw, needs special collection methods, which are labor-intensive, and thus add additional costs [2]. Furthermore, loose biomass can be densified before it is transported, relying on the prerequisite of the conversion process [57,58]. The cost of biomass transportation has been determined to be affected by other factors, such as the distance between the plant and the field, available infrastructure, on-site technology and ways of transportation (trucks, railway, vessel, etc.) [9,59].
The costs as detailed below include only the costs required to produce biomass for the non-feed or food market in many European countries. This cost varies amongst the different crops studied:
-
In the case of straw and stubbles—like cereal straw and maize stover—only the harvesting, fertilization (due to nutrient removal with the straw), baling and collecting to the roadside farm/gate are taken into account [60].
-
In the case of prunings from permanent crops, the cost of collecting branches left on the soil, as shredded material at the roadside, is included.
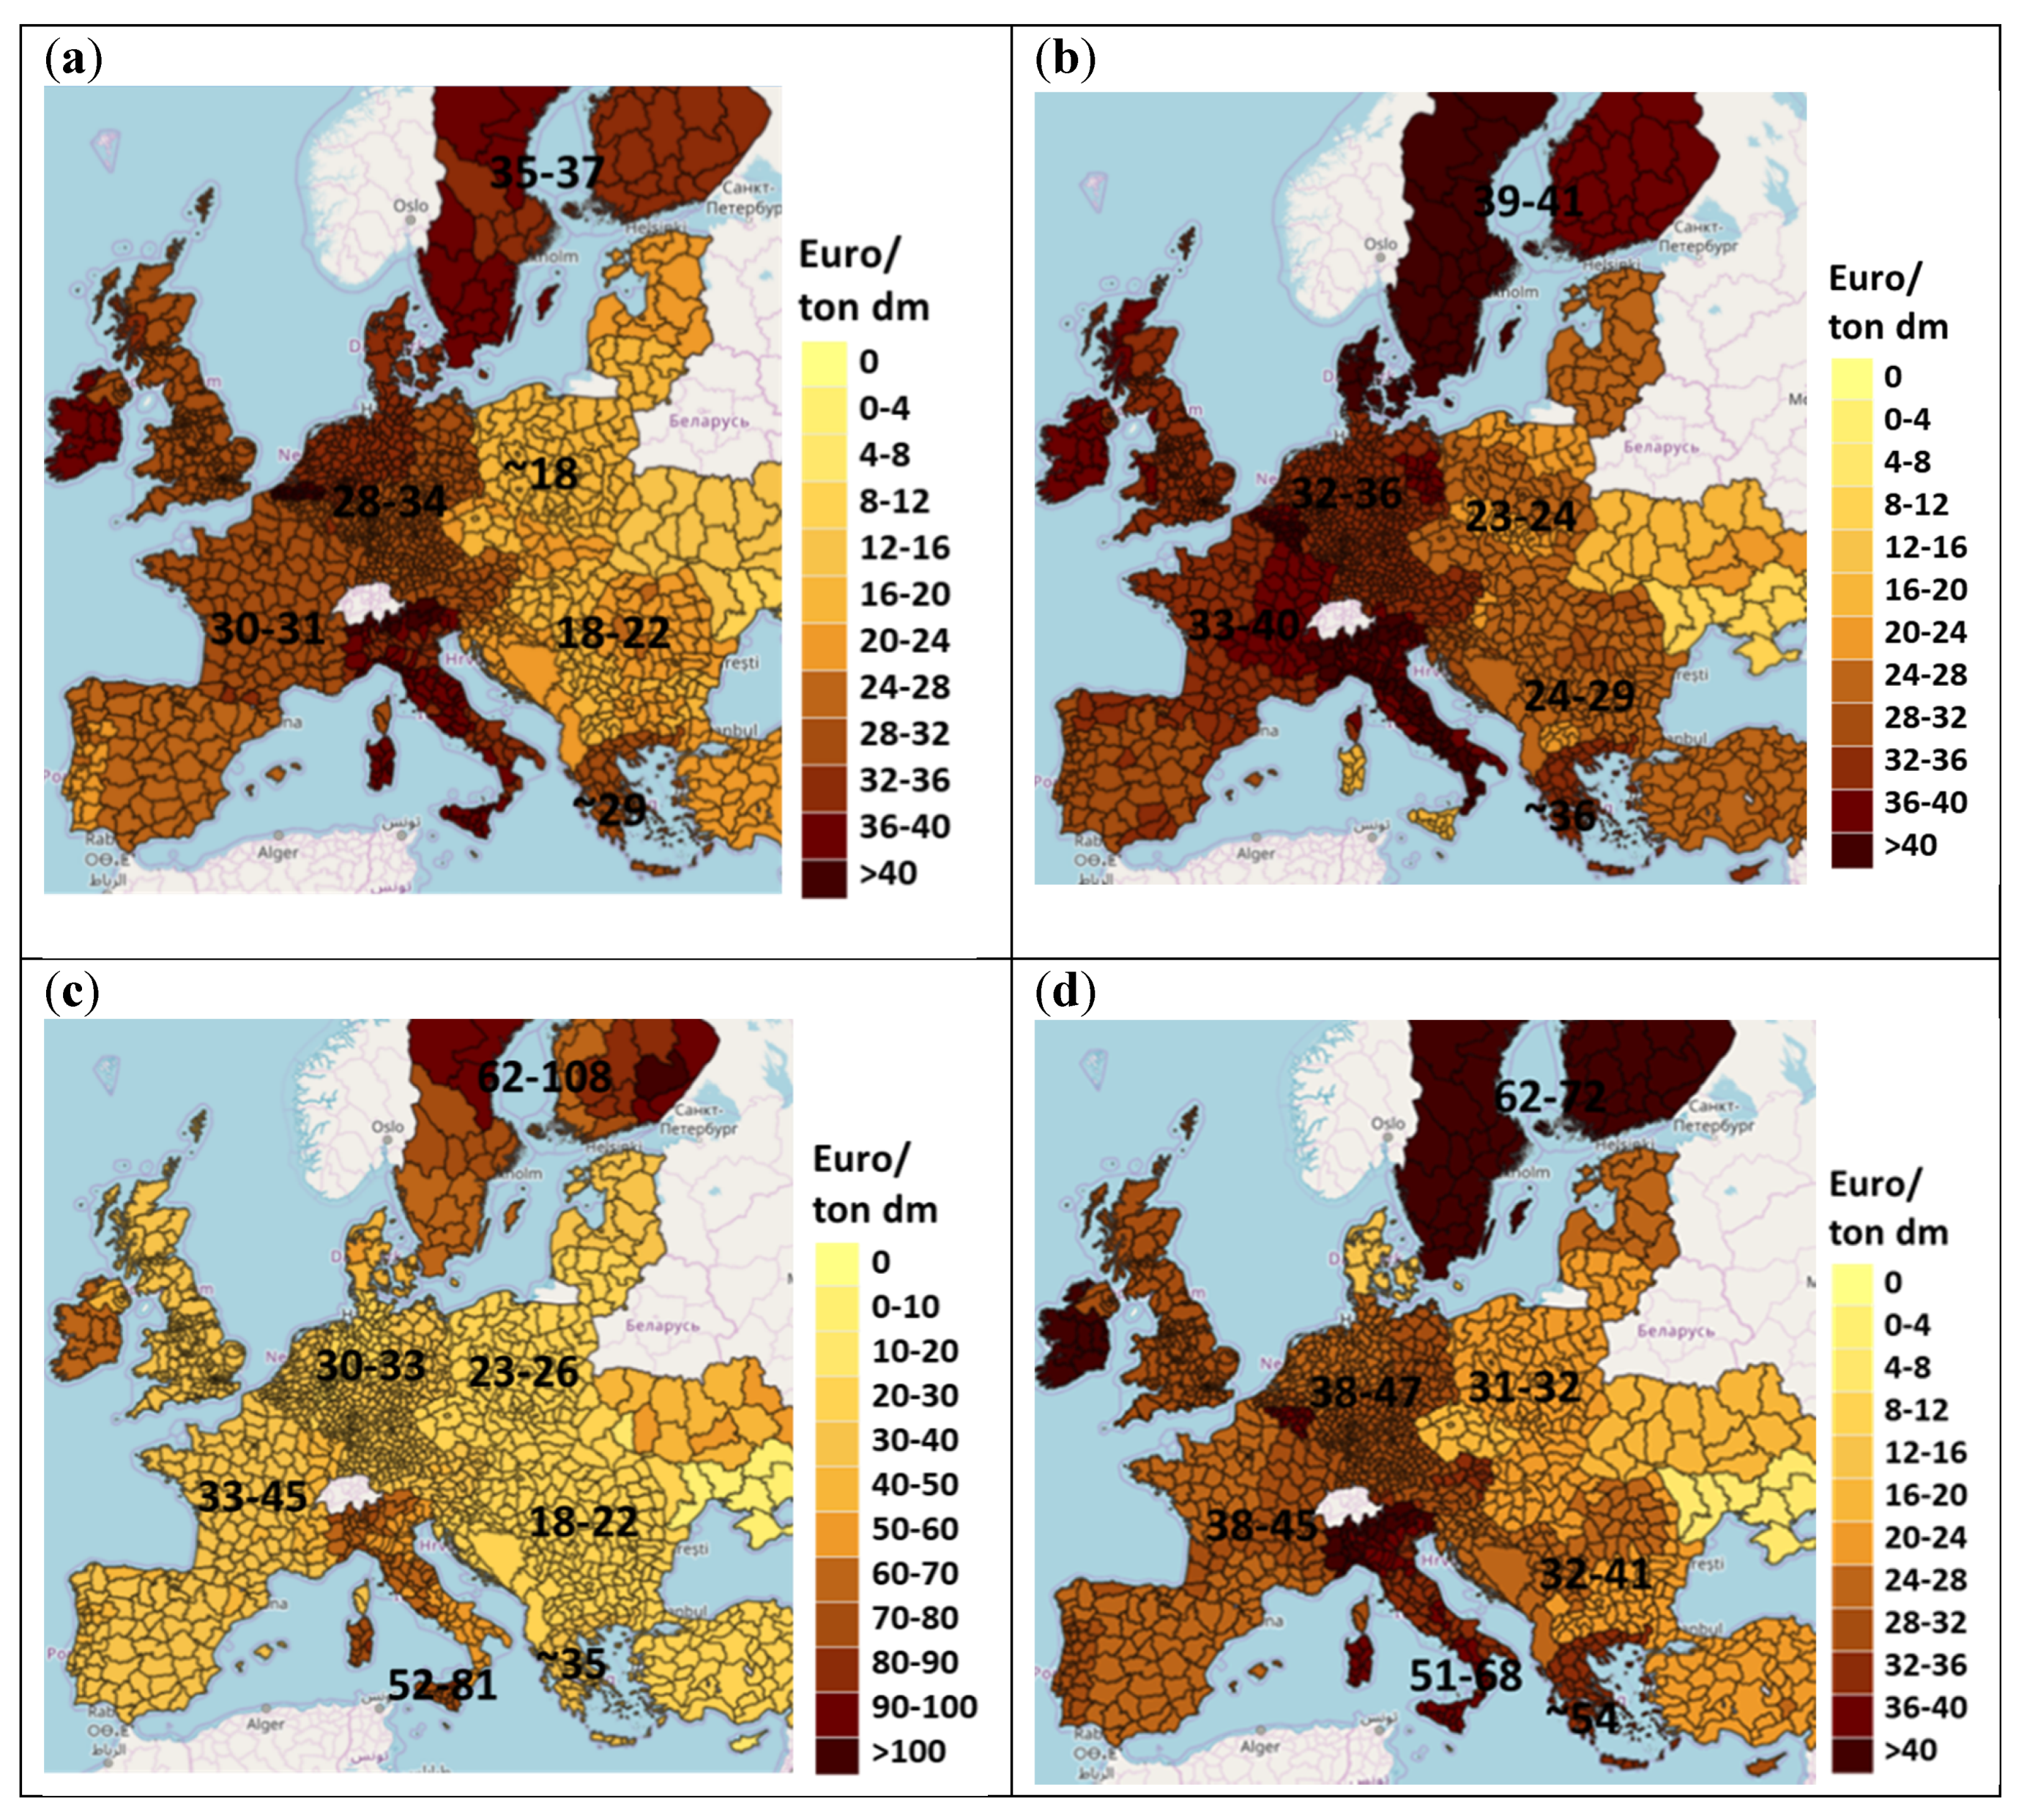
4.1. Roadside Cost

The roadside cost refers to the cost of all the stages of biomass production collection and pre-treatment, up to the road where the biomass is located, that is, the cost between the roadside and the conversion plant gate. As regards the roadside cost (EUR/ton dry matter) of selected agricultural and forest residues, the highest values can be observed in Scandinavian and Southwest European countries (Figure 10) and in Scandinavian and Northwest European countries (Figure 11), respectively. More specifically:
-
Cereal straw is estimated to have high values in Greece (~45 EUR/kton dry), in Italy (36–42 EUR/kton dry), Germany (28–29 EUR/kton dry), France (30–31 EUR/kton dry) and Sweden/Finland (37–42 EUR/kton dry). The lowest prices are traced in Poland (17–21 EUR/kton dry) and southeastern countries like Bulgaria, Hungary and Romania.
-
For the rest of the crops (maize stover, sunflower straw and oil seed rape straw), the situation is more or less the same, with the highest prices observed in Central (except for Poland), Southwest and North Europe, and the lowest prices traced in Southeast Europe.
Concerning stemwood from final fellings and thinnings from coniferous and non-conifer trees, the following conclusions can be drawn:
-
In general, stemwood originating from coniferous trees has a higher roadside cost, compared to that originating from non-conifer trees. The same applies to the logging residues.
-
Stemwood from non-conifer trees is estimated to have (as in the case of agricultural crops) the lowest prices in Poland (18–26 EUR/kton dry) and southeastern countries, such as Bulgaria, Hungary and Romania. In the same areas, the price of stemwood from coniferous trees will be approximately 23–32 EUR/kton dry.

4.2. Plant Gate Cost and Market Price

Knowledge of the plant gate cost as well as of the market price of the several types of crops investigated in this work has been scarce. For most of the studied regions, there are not any available official statistics for cereal straw prices, because straw is not generally considered as a marketable commodity. Concerning wheat straw, in 2011 the market price ranged from 40 EUR/ton to 50 EUR/ton in the UK, and reached 60 EUR/ton dm in France, which is almost double the roadside cost estimated for this country. The plant gate cost ranged from 80 EUR/ton to 85 EUR/ton in the UK for the same year. The price for small baled straw (approximately 15 kg to 20 kg) was approximately 59 EUR/ton to 79 EUR/ton in Hungary in 2012.
Notably, the price of grade dry pellets ranged from 200 EUR/ton to 250 EUR/ton in Germany, and the industrial-grade dry pellets were priced approximately 130 EUR/ton in the Netherlands in 2011, including cost, insurance and freight [61]. In 2015, industrial and commercial wood pellets were traded at the price of 132.5 EUR/ton on the Scandinavian stock market, and 204.5 EUR/ton in Central Europe [62]. Wood pellets (A1 quality) had a market price equal to 290–320 EUR/ton, and A2 quality a price equal to 230 EUR/ton in Greece. Nevertheless, the abovementioned values could be reduced significantly, if scale-up scenarios were applied, like those referring to the full conversion of power plants with a capacity higher than 100 MW.
Another conclusion drawn within this analysis is that the cost of secondary residues from sawmills is rather moderate. Indicatively, in Germany during the period 2006–2010, the average price for bark-free dry wood chips from sawmills (originating from softwood and hardwood) was approximately 58 EUR/ton, whilst their maximum price reached 68 EUR/ton. In addition, for the same period of time, the market price of dry sawdust was approximately 20 EUR/ton to 40 EUR/ton, and the plant gate cost was 80 EUR/ton to 100 EUR/ton. Finally, firewood was being sold at a price of around 60–80 EUR/m3 (bulk), in Greece.
Regarding other biomass types, miscanthus can be up to 100 EUR/ton of dry matter in the Muensterland of Germany, because of specific regional demand, while for the exhausted olive cake, the market price was in the range of 70–80 EUR/ton (VAT included), and for olive stone it was equal to 150 EUR/ton in Greece in 2016 [63,64].

5. SWOT Analysis

Nowadays, as power plants are put under rising pressure to mitigate carbon emissions, the retrofitting of coal power plants by using biomass feedstock is being investigated. Based on EU regulations, biomass is considered a carbon-neutral renewable alternative, since the growth of new trees can absorb as much carbon as biomass released during the combustion in electricity generation applications. What, though, are the difficulties associated with converting a coal-fired installation to use more “green” fuels, and is the environmental profit worth the effort?
The achievement of biomass retrofitting can permit power plants to maintain operation despite the binding limits on CO2 emissions, hence saving jobs and local income generation, and meeting energy requirements locally. It also permits companies to keep power units operational for longer, meaning they can continue to generate income from these high-value assets. Nevertheless, changing the use of coal-fired plants can be costly, and ambiguous from a government and regulatory purpose point of view. In the next sub-sections, a SWOT analysis is provided concerning the repurposing of coal power plants.

5.1. Strengths

A major advantage of using biomass is the wide availability of it worldwide. Focusing on the availability of biomass in main lignite-producer countries, in western Europe (i.e., Czech Republic and Germany), mainly forest and agricultural biomasses are available. In eastern Europe (i.e., Bulgaria, Romania and Poland), mainly agricultural biomass is available, as it is in southern Europe (i.e., Greece) too. Moreover, Poland, which has a high availability of agricultural and forest biomass, borders on Germany, which has a high availability of agricultural and forest biomass, too, and the neighboring countries of Greece, Bulgaria and Romania have high agricultural biomass availability. Taking into consideration the biomass potential found in a distance of approximately 150–200 km from the indicative power plants (Table 4), it could be considered that in a theoretical scenario (scenario 1) in which the biomass’s potential is utilized, the majority of these plants can cover their energy demands by utilizing biomass as an alternative fuel. However, in a more realistic scenario (scenario 2), in which only 30% of biomass potential is collected and used for energy production, it seems that the Zoilling power plant in Germany is the only one that can cover the required energy demands by using biomass.
Nevertheless, the development of a global biomass logistics infrastructure can ensure the supply of the required feedstock for electricity generation. Current policies are boosting biomass as feedstock for power plants, since biomass could play a major role in a net-zero GHG economy in 2050, a target set by the European Green Deal. Therefore, biomass is promoted for retrofitting industries as a measure of risk-reduction in policy changes. In addition, in aiming to adapt biomass power plants to be compliant with the environmental policy, the produced ash, as the main solid waste, could be recycled in agricultural or forests lands, it could be utilized for the production of new materials.

5.2. Weaknesses

A major disadvantage of biomass is the low calorific value compared to other fossil fuels, requiring a significantly higher mass of biomass for generating an equal quantity of energy in a typical coal power plant. Hence, shorter distances for transporting biomass are preferable, in order to reduce the relevant transportation costs. Furthermore, most of the existing power plants are not located close to the port, so a mobilization of the logistics in the whole supply chain for the transportation of biomass from abroad is required.
In addition, many specific types of biomass are harvested at a specific season of the year, increasing the dependency of the local area on other areas or fuels (in cases where this type of biomass is the only one available). Therefore, the storage of biomass includes many challenges owing to the potential of biological degradation, the large size of plants, and additional technological pretreatment. Due to its composition, biomass can easily be affected by several microbes, which may cause biological damage with adverse effects on its content. For this reason, certain additional measures must be taken to protect the biomass from biological decomposition. Biomass has high oxygen content, and in some cases, high moisture content too. Specific biomass types are characterized by a high content of chlorine and alkali, which could affect specific parameters in thermochemical conversion paths.
Although biomass is considered a neutral field, a proper estimation of direct GHG emissions from fuel or fertilizer use in the fuel value chain (e.g., inputs during the stages from cultivation to pre-treatment steps, and the type of feedstock used for fuel production), as well as the indirect emissions due to land-use changes, avoiding the replacement of traditional crops for food and feed purposes, is necessary. For the other types of air emissions emitted during biomass burning in power plants, the level of the environmental emissions depends on the feedstock, energy conversion technologies and the type of gas-cleaning system. The emissions emitted during biomass combustion can be defined as unburnt pollutants (dioxins, PAHs, char particles and carbon monoxide (CO)) and pollutants released by the combustion (oxides of nitrogen, PM (particulate matter) and acid gases, sulfur and heavy metals). These pollutants could be monitored by fuel pre-treatment, for example leaching of chlorine, careful modifications of stoichiometry, or post-combustion flue gas-cleaning systems.

5.3. Opportunities

The use of lignite from biomass could result in many opportunities in the future. Firstly, biomass co-firing in large lignite-based power plants gives a significant opportunity to raise the share of RES in the primary energy consumption, and the share of electricity from RES in gross electricity consumption, in any country. Based on the EU’s target for reducing carbon emissions, this infrastructure could become usable and adjustable to upcoming technological developments. Additionally, biomass co-firing does not require significant capital investments, and the low biomass cost could result in a low OPEX (operating expense) for a coal plant. Since biomass is considered a carbon-neutral alternative fuel, the CO2 emissions from biomass combustion are characterized as biogenic. Hence, this has a direct impact on the Emissions Trading System (ETS), since the power plant will benefit from the reduction of fossil CO2 emissions. The full conversion of coal to power plants reflects technology progress in accordance with investment challenges. Power plants can mobilize low-carbon funding mechanisms for the implementation of this project.

5.4. Threats

A major aspect that could negatively affect the use of biomass in the future is the supply chain of it, owing to complications that could arise, affecting in turn the biomass cost; possible complications are discussed in Section 4. A possible threat could arise in the sustainability issues of biomass trading due to policy standards, which each country defines for its energy sector. Further, RED II sets technical limitations on electricity produced in installations from biomass fuels with a total rated thermal input above 50 MW, so that the produced electricity will be capable of contributing towards the renewable energy share. In addition, concerning the full conversion of coal power plants to biomass power plants, RED II sets as a minimum level 36% net electrical efficiency, for installations producing only electricity with a rated thermal input above 100 MW. Taking into consideration that most of the plants (especially in southeastern Europe) are old conventional fossil power plants, and they do not comply with the aforementioned conditions, the scenario of full biomass conversion of power plants seems to be not technically feasible for these cases. Moreover, the use of biomass in plants maybe requires modifications, or the replacement of equipment that could not be a financially sustainable asset in the future. Depending on the modified technology and on the new biomass technology’s construction, safety risks could increase or decrease. Furthermore, if more biomass is used, the competition for the biomass would increase. This could raise biomass gate costs going forward. In addition, if more biomass is used, the logistical infrastructure would be better, which could set a lower level cost in the supply chain of biomass.

5.5. Overview

To sum up, a synthesis table, with the main points of Strengths, Weaknesses, Opportunities and Threats of a retrofitting biomass-to-power scenario in a coal plant, is provided in Table 5.

6. Conclusions

In the coming decades, the shift to biomass-based electricity production will be inevitable due to the negative impact of fossil-based fuels. In many cases, the erection of newly built biomass-to-power plants is costlier as compared to fossil fuel alternatives, because of higher investment and operational costs (e.g., fuel costs and lower electric efficiencies). In this sense, biomass repowering provides a low-cost solution to the transition to biomass-to-power technology, and it has been implemented in many installations globally. Although difficulties are met in some cases, this option is considered at a high technological readiness level.
In cases of coal-to-biomass conversion, the major issue that needs to be taken into account is the biomass availability. In particular, the conversion of a large-scale coal-fired plant to biomass requires a logistics plan for ensuring the biomass’s availability. However, difficulties may be raised for those plants located far away from the port or other trade junctions. In addition, such cases of biomass repowering have been demonstrated at a commercial scale, with mostly wood pellets as fuel. Agro-biomass could give opportunities for reducing the fuel cost compared to wood pellets. Nevertheless, the combustion of agro-biomass has its own technical challenges, such as transportation and logistics chain problems, and also needs to be implemented in large-scale plants.
Logistic centers may illustrate potential innovative approaches to improving the biomass handling issue. A logistic center could mobilize the collective and sustainable treatment of a high volume of biomass. This innovation could also enhance trading in biomass-based power production, or coal-to-biomass retrofitting.
Overall, the coal-to-biomass conversion project is a mature solution for large-scale and renewable electricity production. It should be also remarked that the EU has defined a series of demands in RED II regarding the achievement of sustainable power production with the use of biomass. In specific, RED II sets sustainability criteria for the biomass source, and a minimum level of GHG emission savings accomplished during of the overall value chain. Technical limitations, such as a minimum level of 36% net electrical efficiency for power installations with a rated thermal input over 100 MW, are provided as well. It is mentioned that these installations offer the opportunities of integrating carbon capture and storage technologies, in combination with biomass utilization, leading the way to negative emissions technologies. An industry map with all plants that are in line with the RED II sustainable requirements could be a guide for the proper logistic centers’ locations.

Author Contributions

Conceptualization, V.T. and D.-S.K.; methodology, V.T, M.Z. and D.-S.K.; validation, E.K., N.N. and P.G.; formal analysis, D.-S.K.; investigation, V.T.; resources, V.T and M.Z.; data curation, A.G.; writing—original draft preparation, V.T.; writing—review and editing, M.Z. and D.-S.K.; visualization, D.-S.K.; supervision, D.-S.K.; project administration, P.G. and N.N. All authors have read and agreed to the published version of the manuscript.

Funding

This research no external funding

Acknowledgments

This work has been carried out in the framework of the European Union’s Research Fund for Coal & Steel under grant agreement No 754032 (FLEXible operation of FB plants co-Firing LOw rank coal with renewable fuels compensating vRES-FLEX FLORES) and the European Union’s Horizon 2020 research and innovation program, under grant agreement No 817999 (Bioenergy Retrofits for Europe’s Industry—BIOFIT).

Conflicts of Interest

The authors declare no conflict of interest.

Disclaimer

Any dissemination of results must indicate that it reflects only the author’s view and that the Agency is not responsible for any use that may be made of the information it contains.

References

  1. EUTL Database. Available online: https://sandbag.org.uk/project/ets-emissions-2018/ (accessed on 31 January 2020).
  2. Balan, V. Current Challenges in Commercially Producing Biofuels from Lignocellu-Losic Biomass; International Scholarly Research Notices; Hindawi Publishing Corporation: London, UK, 2014; pp. 1–31. [Google Scholar] [CrossRef]
  3. Schoenmaker, D.; Van Tilburg, R.; Wijffels, H. What Role for Financial Supervisors in Addressing Systemic Environmental Risks? UNEP Inquiry, Utrecht Sustainable Finance Lab: Utrecht, The Netherlands, 2015. [Google Scholar]
  4. McGlade, C.; Ekins, P. The Geographical Distribution of Fossil Fuels Unused when Limiting Global Warming to 2 Degrees. Nature 2015, 517, 187–190. [Google Scholar] [CrossRef] [PubMed]
  5. Economist Intelligence Unit. The Cost of Inaction: Recognising the Value at Risk from Climate Change; Economist Intelligence Unit: London, UK, 2015; p. 63. [Google Scholar]
  6. United Nations Climate Change. Economic Diversification. Available online: https://unfccc.int/topics/resilience/resources/economic-diversification (accessed on 17 December 2019).
  7. International Energy Agency (IEA). Coal 2018. Analysis and Forecasts to 2023. Available online: https://www.iea.org/coal2018 (accessed on 14 January 2020).
  8. Erb, K.H.; Krausmann, F.; Lucht, W.; Haberl, H. Embodied HANPP: Mapping the Spatial Disconnect between Global Biomass Production and Consumption. Ecol. Econ. 2009, 69, 328–334. [Google Scholar] [CrossRef]
  9. European Biomass Associtation. Forest Sustainability and Carbon Balance of EU Importation of North American Forest Biomass for Bioenergy Production; Aebiom: Brussels, Belgium, 2013. [Google Scholar]
  10. Europe beyond Coal. Overview: National Coal Phase-Out Announcements in Europe. 2019. Available online: https://beyond-coal.eu/ (accessed on 14 January 2020).
  11. Amelang, S.; Appunn, K.; Egenter, S.; Sherman, L.; Wehrmann, B.; Wettengel, J. Commission Watch-Managing Germany’s Coal Phase-Out. 2019. Available online: https://www.cleanenergywire.org/news/commission-watch-managing-germanys-coal-phase-out (accessed on 11 February 2020).
  12. Parra, P.; Ganti, G.; Brecha, R.; Hare, B.; Schaeffer, M.; Fuentes, U. Global and Regional Coal Phase-Out Requirements of the Paris Agreement: Insights from the IPCC Special Report on 1.5 °C. Climate Analytics. 2019. Available online: https://climateanalytics.org/publications/2019/coal-phase-out-insights-from-the-ipcc-special-report-on-15c-and-global-trends-since-2015/ (accessed on 20 December 2019).
  13. Flisowska, J.; Moore, C. Just Transition or Just Talk? Draft National Energy and Climate Plans Reveal Some EU Countries are Planning to Stick with Coal Power beyond 2030; Climate Action Network (CAN) Europe and Sandbag: Brussels, Belgium; London, UK, 2019. [Google Scholar]
  14. Roni, M.S.; Chowdhury, S.; Mamun, S.; Marufuzzaman, M.; Lein, W.; Johnson, S. Biomass co-firing technology with policies, challenges, and opportunities: A global review. Renew. Sustain. Energy Rev. 2017, 78, 1089–1101. [Google Scholar] [CrossRef]
  15. Welfle, A. Balancing growing global bioenergy resource demands—Brazil’s biomass potential and the availability of resource for trade. Biomass Bioenergy 2017, 105, 83–95. [Google Scholar] [CrossRef]
  16. Ozcan, M.; Oztürk, S.; Oguz, Y. Potential evaluation of biomass-based energy sources for Turkey. Eng. Sci. Technol. 2015, 18, 178–184. [Google Scholar] [CrossRef] [Green Version]
  17. Drosatos, P.; Nikolopoulos, N.; Karampinis, E.; Grammelis, P.; Kakaras, E. Comparative investigation of a co-firing scheme in a lignite-fired boiler at very low thermal-load operation using either pre-dried lignite or biomass as supporting fuel. Fuel Process. Technol. 2018, 180, 140–154. [Google Scholar] [CrossRef]
  18. Nikolopoulos, N.; Agraniotis, M.; Violidakis, I.; Karampinis, E.; Nikolopoulos, A.; Grammelis, P.; Papapavlou, C.; Tzivenis, S.; Kakaras, E. Parametric investigation of a renewable alternative for utilities adopting the co-firing lignite/biomass concept. Fuel 2013, 113, 873–897. [Google Scholar] [CrossRef]
  19. WBA GLOBAL BIOENERGY STATISTICS 2018; World Bioenergy Association: Stockholm, Sweden, 2018.
  20. N. Statista. Capacity of Biomass Power Plants in Selected Countries and Worldwide in 2018. 2019. Available online: https://www.statista.com/statistics/264637/world-biomass-energy-capacity/ (accessed on 30 March 2020).
  21. Li, Y.; Rezgui, Y.; Zhu, H. District heating and cooling optimization and enhancement—Towards integration of renewables, storage and smart grid. Renew. Sustain. Energy Rev. 2017, 72, 281–294. [Google Scholar] [CrossRef]
  22. Bottcher, H.; Frank, S.; Havlik, P. Biomass Availability & Supply Analysis, Deliverable 3.4 of Biomass Futures Project; International Institute for Applied Systems Analysis, Biomass Futures: Laxenburg, Austria, 2012. [Google Scholar]
  23. Sikkema, R.; Steiner, M.; Junginger, M.; Heigl, W.; Hansenm, M.; Faaij, A. The european wood pellet markets: Current status & prospects for 2020. Biofuels. Bioprod. Biorefining 2011, 5, 250–278. [Google Scholar] [CrossRef]
  24. Spelter, H.; Toth, D. North America’s Wood Pellet Sector; United States Department of Agriculture: Madison, WI, USA, 2009.
  25. Thrän, D.; Dotzauer, M.; Lenz, V.; Liebetrau, J.; Ortwein, A. Flexible bioenergy supply for balancing fluctuating renewables in the heat and power sector—A review of technologies and concepts. Energy Sustain. Soc. 2015. [CrossRef] [Green Version]
  26. FAO. FAO Statistics Forestry Datasets. Rome. 2013. Available online: http://faostat.fao.org/site/626/DesktopDefault.aspx?PageID=626#ancor (accessed on 3 February 2020).
  27. Thiry, M.C. Playing with Fire. AATCC Review. 2002, 2, 16–20. [Google Scholar]
  28. S2Biom project. Available online: https://www.s2biom.eu/en/ (accessed on 18 March 2020).
  29. Ernst & Young Company. European Lignite Mines Benchmarking Sanitized Report; Ernst & Young: London, UK, 2014. [Google Scholar]
  30. Andruleit, H.; Bahr, A.; Babies, H.G.; Franke, D.; Meßner, J.; Pierau, R.; Schauer, M.; Schmidt, S.; Weihmann, S. Reserves, Resources and Availability of Energy Resources; Energy study; Federal Institute for Geosciences and Natural Resources: Hannover, Germany, 2016. [Google Scholar]
  31. Weiser, C.; Zeller, V.; Reinicke, F.; Wagner, B.; Majer, S.; Vetter, A.; Thraen, D. Integrated assessment of sustainable cereal straw potential and different straw-based energy applications in Germany. Appl. Energy 2014, 114, 749–762. [Google Scholar] [CrossRef]
  32. Agricultural census in GermanyEuropean Union. Available online: http://ec.europa.eu/eurostat/statistics-explained/index.php/Agricultural_census_in_Germany (accessed on 11 February 2020).
  33. Federal Ministry of Food Agriculture and Consumer Protection. German Forests—Nature and Economic Factor; Federal Ministry of Food Agriculture and Consumer Protection: Berlin, Germany, 2011.
  34. Widera, M. Genetic classification of Polish lignite deposits: A review. Int. J. Coal Geol. 2016, 158, 107–118. [Google Scholar] [CrossRef]
  35. Rafał, B.; Wajszczuk, K.; Pepliński, B.; Wawrzynowicz, J. Potential For Agricultural Biomass Production for Energy Purposes in Poland: A Review, Contemporary Economics; SSRN: New York, NY, USA, 2014; Volume 7, pp. 63–74. Available online: https://ssrn.com/abstract=2253173 (accessed on 17 June 2020).
  36. Statista, M. Production of Lignite Worldwide from 1990 to 2016 (in Million Metric Tons). Available online: https://www.statista.com/statistics/267894/global-lignite-production-since-1990/ (accessed on 20 December 2019).
  37. Milewski, W.; Beasley, A. Forests in Poland 2015; The State Forests Information Centre: Warsaw, Polonia, 2015; ISBN 978-83-63895-79-2. [Google Scholar]
  38. International Energy Agency, Greece. Available online: https://www.iea.org/countries/Greece (accessed on 27 March 2020).
  39. Eurocoal. Eurocoal the Voice of Coal in Europe—Greece. Bruxelles, Belgium. Available online: https://euracoal.eu/info/country-profiles/greece/ (accessed on 14 January 2020).
  40. Karampinis, E.; Grammelis, P. Biomass Co-Firing in Lignite-Fired Power Plants as a Means of Mobilizing Agro-Biomass Resources; Project Report. S2BIOM—a project funded under the European Union 7th Frame Programme; Centre for Research and Technology Hellas: Athens, Greece, 2017. [Google Scholar]
  41. Kavouridis, K. Lignite industry in Greece within a world context: Mining, energy supply and environment. Energy Policy 2008, 36, 1257–1272. [Google Scholar] [CrossRef]
  42. World Energy Council. World Energy Resources Coal; World Energy Council: London, UK, 2016. [Google Scholar]
  43. EURACOAL. Coal Industry Across Europe, 6th ed.; European Association for Coal and Lignite: Brussels, Belgium, 2017; ISBN 2034-5682. [Google Scholar]
  44. Bulgaria Forest Information and Data. Available online: https://rainforests.mongabay.com/deforestation/2000/Bulgaria.htm (accessed on 27 January 2020).
  45. Jones, D.; Sakhel, A.; Buck, M.; Graichen, P. The European Power Sector in 2017; Agora Energiewende: Berlin, Germany, 2018; p. 49. [Google Scholar]
  46. Boshnakova, M. Wood Products Sector Update-Bulgaria. USDA Foreign Agricultural Service; Global Agricultural Information Network: Warsaw, Bulgaria, 2017. Available online: https://www.fas.usda.gov/data/bulgaria-wood-products-sector-update (accessed on 15 June 2020).
  47. FAO. 2019. Available online: http://www.fao.org/3/j4504E/j4504e06.htm (accessed on 30 March 2020).
  48. Li, S.; Zheng, H.; Zheng, Y.; Tian, J.; Jing, T.; Chang, J.-S.; Ho, S.-H. Recent advances in hydrogen production by thermo-catalytic conversion of biomass. Int. J. Hydrogen Energy 2019, 44, 14266–14278. [Google Scholar] [CrossRef]
  49. Liu, P.; Wang, Y.; Zhou, Z.; Yuan, H.; Zheng, T.; Chen, Y. Effect of carbon structure on hydrogen release derived from different biomass pyrolysis. Fuel 2020, 271, 117638. [Google Scholar] [CrossRef]
  50. Chianese, S.; Fail, S.; Binder, M.; Rauch, R.; Hofbauer, H.; Molino, A.; Blasi, A.; Musmarra, D. Experimental investigations of hydrogen production from CO catalytic conversion of tar rich syngas by biomass gasification. Catal. Today 2016, 277, 182–191. [Google Scholar] [CrossRef]
  51. WIP Renewable Energies. Technical options for retrofitting industries with bioenergy—A Handbook, 2020Biofit. Available online: https://www.biofit-h2020.eu/news-and-events/handbook-published/ (accessed on 30 March 2020).
  52. Savat, P. Activities at Rodenhuize Power Plant: Advanced and Max Green Projects; Topic Orientated Technical Meeting 35—Co-firing secondary fuels in power generation: From fuel characterization to full scale testing; IFRF: Pisa, Italy, 2010. [Google Scholar]
  53. Drax Group plc. Annual report and accounts 2018. 2018. Available online: https://www.drax.com/wp-content/uploads/2019/03/Drax-Annual-report-accounts-2018.pdf (accessed on 30 March 2020).
  54. Zhang, F.; Johnson, D.M.; Sutherland, J.W. A GIS-based method for identifying the optimal location for a facility to convert forest biomass to biofuel. Biomass Bioenergy 2011, 35, 3951–3961. [Google Scholar] [CrossRef]
  55. Rentizelas, A.A.; Tolis, A.J.; Tatsiopoulos, I.P. Logistics issues of biomass: The storage problem and the multi-biomass supply chain. Renew. Sustain. Energy Rev. 2009, 13, 887–894. [Google Scholar] [CrossRef] [Green Version]
  56. Sansaniw, S.K.; Rosen, M.A.; Tyagi, S.K. Global challenges in the sustainable development of biomass gasification: An overview. Renew. Sustain. Energy Rev. 2017, 80, 23–43. [Google Scholar] [CrossRef]
  57. An, H.; Wilhelm, W.E.; Searcy, S.W. A mathematical model to design a lignocellulosic biofuel supply chain system with a case study based on a region in Central Texas. Bioresour. Technol. 2011, 102, 7860. [Google Scholar] [CrossRef]
  58. Zhu, X.; Li, X.; Yao, Q.; Chen, Y. Challenges and models in supporting logistics system design for dedicated-biomass-based bioenergy industry. Bioresour. Technol. 2011, 102, 1344–1351. [Google Scholar] [CrossRef]
  59. Badger, P.C. Biomass transport system. Encycl. Agric. Food Biol. Eng. 2003, 1, 94–98. [Google Scholar]
  60. Dees, M.; Forsell, N.; Fitzerald, J.; Vis, M.; Forsell, N.; Datta, P.; Gallaun, H.; Dawar, S.; Glavonjic, B.; Garcia, D.; et al. Best Practice Guidelines on the Maintenance and Regular Up-Date of the Biomass Cost Supply Data for EU, Western Balkan Countries, Moldavia, Turkey and Ukraine; Project Report. S2BIOM—A project funded under the European Union 7th FrameworkProgramme for Research. Grant Agreement n°608622; Institute of Forest Sciences, University of Freiburg: Baden-Württemberg, Germany, 2017. [Google Scholar]
  61. Piotrowski, S.; Carus, M.; NOVA. Deliverable D1.2: Assessment of procurement costs for the preferred feedstocks. 2012. Available online: http://www.biocore-europe.org/file/D1_2%20Assessment%20of%20procurement%20costs%20for%20the%20preferred%20feedstocks.pdf (accessed on 15 June 2020).
  62. German Biofuel Portal. Wood pellet prices in the European Union. 2015. Available online: http://biomassa.de/news-wood-pellet-prices-in-the-european-union-18.html (accessed on 3 April 2020).
  63. Biocore. Available online: http://www.biocore-europe.org/ (accessed on 20 February 2020).
  64. Biomasud Plus. Available online: http://biomasudplus.eu/en_GB/ (accessed on 20 February 2020).
  65. Carbon Brief. Global Coal Power. Available online: https://www.carbonbrief.org/mapped-worlds-coal-power-plants (accessed on 6 April 2020).
Figure 1. Biomass potential in Germany in 2020 (values are presented in Mton dm).
Energies 13 03390 g001
Figure 2. Agro-biomass potential in Germany in 2020 (values are presented in Mton dm).
Energies 13 03390 g002
Figure 3. Forest biomass potential in Germany in 2020 (values are presented in Mton dm).
Energies 13 03390 g003
Figure 4. Biomass potential in Poland in 2020 (values are presented in Mton dm).
Energies 13 03390 g004
Figure 5. Biomass potential from secondary residues in Poland in 2020 (values are presented in Mton dm).
Energies 13 03390 g005
Figure 6. Biomass potential in Czech. Republic in 2020 (values are presented in Mton dm).
Energies 13 03390 g006
Figure 7. Biomass potential in Bulgaria in 2020 (values are presented in Mton dm).
Energies 13 03390 g007
Figure 8. Biomass potential in Romania in 2020 (values are presented in Mton dm).
Energies 13 03390 g008
Figure 9. Biomass potential from secondary residues in Romania in 2020 (values are presented in Mton dm).
Energies 13 03390 g009
Figure 10. Cost of selected agricultural residues (a) cereal straw, (b) maize stover, (c) sunflower straw, and (d) oil seed rape straw for reference year 2020 [28].
Energies 13 03390 g010
Figure 11. Cost of selected forest residues: Stemwood from (a,b) final fellings from non-conifer and conifer trees and (c,d) thinnings from non-conifer and conifer trees for reference year 2020 [28].
Energies 13 03390 g011
Table 1. Electricity production from lignite in Europe in 2018 [9].
CountryMass (Mt)Electricity (TWh)Total Electricity (TWh)Lignite-Based Electricity Generation Share (%)
Germany166.314659524.54
Poland58.54917528
Czech. Rep.39.2377350.68
Greece36.5176127.87
Bulgaria30.3193850
Romania23.5166225.81
Hungary7.954610.87
Slovak. Rep.1.51303.33
Slovenia3.241526.67
Table 2. Status in main lignite-producer countries concerning coal phase-out [10].
Country Coal Phase-Out Status
GermanyPhase-out announced but not ambitious enoughCoal phase-out by 2038 with option of 2035.
Germany has not achieved its 2020 climate target, because the use of coal was not limited in time, yet the country needs to comply with the 2030 climate goal. According to a report released earlier in 2019 by Germany’s multi-stakeholder government commission [11], a phase-out of coal by 2038 is possible, with the alternative of bringing it forward to 2035, short-term closing of 12.5 GW coal capacity by 2022, and review points in 2023, 2026, 2029 and 2032.
The suggested 2038 end date is too late to comply [12] with the Paris Climate Agreement. For this reason, the civil society supports a coal phase-out by 2030.
PolandNo phase-out discussionIn Poland, aging coal power plants encounter difficulties of being in line with the air pollution restrictions. Five units are constructed currently. The mining sector poses considerable economic problems. The government supports coal, but market forces are unpredictable. Several Polish opposition parties support coal exit in the period 2035 to 2040. The EU 2030 climate targets and framework in the energy market may promote an accelerated shift.
Czech RepublicPhase-out under discussionIn the summer of 2019, a stakeholder “coal commission” was set to evaluate the capability of accelerated coal exit in the country. This Commission claimed to have monthly meetings, and ought to end in September 2020 with suggestions for the government.
GreecePhase-out announcedCoal phase-out by 2028.
In September 2019, at the United Nations Climate Action Summit in New York, the prime minister made public that Greece will close all its coal-fired power plants by 2028. Due to the high potentiality in renewable energy, Greece should ensure that the transition away from lignite is in the direction of a 100% share in renewable energy consumption. However, an additional coal power plant is already under construction in North-West Greece [13]. The regional authority of West Macedonia in Greece, where most of the lignite power plants are located, participates in Transition Platform for Coal Regions, in order to be involved in coal-free concepts.
BulgariaNo phase-out discussionThe country does not have a long-term policy about its energy policy yet, and a coal phase-out has not been discussed so far. Aging coal-fired power plants are still operating. The government counts on derogations from EU legislation to keep the power plants in operation and avoid a transition scenario.
RomaniaNo phase-out discussionAging coal power plants are struggling to be in line with policy requirements about air pollution. The National Energy Strategy of the country recommends a yearly production of electricity from coal of 15 TWh within the 2030–2050 period, which is only 1 TWh lower compared to the respective level in 2018. A new unit at Rovinari plant has been scheduled since 2013, to be made in synergy with a Chinese investor, and recently has been emphasized as the highest consideration in the National Energy Strategy. The mining sector deals with important economic obligations.
Table 3. Retrofitting coal-to-biomass power plants [51].
Power Plant/UnitCountryFinalization of RetrofitsInstalled Capacity (MW Electrical)Fuels UsedCombustion Technology
Les Awirs 4Belgium200580Wood pelletsPF
HelsingborgSweden2006126Wood pelletsPF
VästhamnsverketSweden200669Wood pelletsPF
HerningDenmark20097544% wood chips, 44% wood pellets, 12% top-gasGF (chips)/PF (pellets)
Rodenhuize 4Belgium2011180Wood pelletsPF
Tilbury *United Kingdom2011750Wood pelletsPF
Ironbridge *United Kingdom2012740Wood pelletsPF
Drax 1United Kingdom2013660Wood pelletsPF
Polaniec Green UnitPoland201319580% wood chips, 20% agrobiomassCFB
Drax 2United Kingdom2014645Wood pelletsPF
AtikokanCanada2014205Wood pelletsPF
Drax 3United Kingdom2015645Wood pelletsPF
Thunder Bay 3 *Canada2015160Arbacore wood pellets (steam explosion)PF
Avedore 1Denmark2016258Wood pelletsPF
Studstrup 3Denmark2016362Wood pelletsPF
Yeongdong 1South Korea2017125Wood pelletsPF
Drax 4United Kingdom2018645Wood pelletsPF
Amer 9Netherlands201963180% wood pellets, 20% coalPF
Asnæs 6Denmark201925Wood chipsBFB
SuzukawaJapan2020 (expected)112Wood pelletsPF
UskmouthUnited Kingdom2021 (expected)240Subcoal® pellets (RDF pellets)PF
* Unit no longer in operation. BFB: Bubbling Fluidized Bed. CFB: Circulating Fluidized Bed. GF: Grate Fired. PF: Pulverized Fuel.
Table 4. Indicative power plants in Europe and potential biomass production in areas next to them (< 150–200km) [28,65].
CountryPlantCapacity of Plant (MWe)Annual Thermal Input (TWh)Total Biomass Potential(kton)Biomass Energy Content (TWh)Remarks
Scenario 1Scenario 2
GermanyHamburg Moorburg17304080003911.7Feasible in 1st scenario
Luenen-Stummhafen8101810,0004714Feasible in 1st scenario
Schwarze Pumpe16003670003310Not feasible in both scenarios
Lippendorf1866425500278Not feasible in both scenarios
Zoilling4741085004212.6Feasible in both scenarios
PolandKozienice10752412,5006018Feasible in 1st scenario
GreeceFlorina3308150062Not feasible in both scenarios
Ptolemaida-Unit 5*66015150062Not feasible in both scenarios
*Under construction.
Table 5. Overview of SWOT analysis in biomass repowering on coal plants.
StrengthsWeaknesses
-
Limitation of CO2 emissions with the prospect of a plant to be in line with RED II regulations
-
High biomass availability worldwide
-
Mitigation of risk in environmental policy changes
-
Produced ash could be re-utilized under the framework of circular economy thinking
-
Low calorific value compared to other fossil fuels
-
Seasonal availability of a large number of biomass types
-
Storage facilities and pre-treatment units have to rely on biomass composition
-
Possible direct and indirect emissions from the field to power plant
-
Monitoring of non-combustible material and combustion pollutants
OpportunitiesThreats
-
Complications in the biomass supply chain may arise
-
Low biomass cost could possibly reduce the OPEX of a coal plant in a biomass co-firing retrofitting scenario
-
Saving costs due to CO2 biogenic emissions, not counted in ETS
-
Possible funding for low-carbon state-of-the-art full conversion technologies
-
Complications in the biomass supply chain may arise
-
Different policy standards in each country affecting the environmental performance of traded biomass
-
Compliance with technical restrictions of biomass-to-power installations set by RED II
-
Potential modifications or replacement of equipment in a retrofitted plant
-
Rising of biomass competition in a speculative scenario of highly increased biomass use

