Abstract
Nowadays, the high share of electricity production from renewables drives coal-fired power plants to adopt a more flexible operation scheme and, at the same time, maintain flue gas emissions within respective standards. A 500 kWth pulverized coal furnace was used to study pre-dried lignite combustion or co-combustion as an available option for these plants. Bituminous coal from Czech Republic and pre-dried lignite from Greece were blended for the experiments. Particle emissions measurements with a heated Electrical Low Pressure Impactor (ELPI+) and Scanning Electron Microscopy with Energy Dispersive Spectroscopy (SEM/EDS) analyses were performed. The effect of the pre-dried lignite proportions in the fuel feed and the combustion conditions regarding the combustion air staging were the two parameters selected for this study. Skeletal density values were measured from the cyclone prior to the impactor. Results are depicted with respect to the aerodynamic and Stokes diameter for impactor stages. The presence of pre-dried lignite in the fuel blend lowers the particle matter (PM) PM2.5, PM1 and PM0.1 emissions, thus having a positive impact on ESP’s fractional and overall efficiency. The staged combustion air feed reduces the particle emissions in all cases. Sulfur content follows a pattern of higher concentration values for finer particles.
Keywords:
pre-dried lignite; nanoparticle emissions; co-combustion; skeletal density; PM2.5; PM1; ash analysis 1. Introduction
The high renewable energy sources’ (RES) penetration in the grid and low carbon emission policies implemented by the European Union (EU) [1] drive the conventional thermal power units to implement a new more flexible operation mode. The fluctuating and intermittent power production of non-dispatchable RES led to a power- and energy-varying system. The dispatchable sources support the system by adopting new operation schemes and adapting to technical requirements. A fast ramping rate and new lower technical minimum load for solid fossil fuel power plants are the two main issues that draw attention and effort. As this new operation mode imposes higher cycling costs for existing power plants, both designers and operators are pursuing low cost solutions with minimum retrofit and operational cost.
Worldwide data for lignite and coal consumption have shown a stabilization of around 28% in the energy mix, namely 3384–3937 Mtoe of total primary energy supply [2] during the decade 2008–2017. Moreover, coal and lignite produced 38.25% of the worldwide electricity, with 9594 TWh in 2016 [3]. Coal’s share in electricity production is forecast to increase by 1.2% between 2016 and 2022; although its share in the power mix falls by 36% by 2022, a rapid decline is rebutted as we cross the stagnation decade of coal use [4]. Lignite has a considerable share in power production in several countries, with Greece holding a high position, where the installed capacity of lignite-fired power plants reaches 4302 MW, with a 22.7% share in energy mix and a production of 22,107 GWh and 42.62% of total electricity produced in 2015 [5]. The high moisture and volatile content are two contradictive factors, with the first as an undesired one. Lignite moisture content follows Schurmann’s rule, where water content decreases with burial depth [6]. Respectively, the volatile content of bituminous coals is related to burial depth according to Hilt’s law [7]. To date, pre-dried lignite is reported mainly for efficiency increases in power plants. Recently [8], pre-dried lignite firing systems have been installed to substitute oil burners for start-up and support for low load operation. Among the different solutions, the pre-dried lignite is proposed for reaching lower operation loads.
Solid fossil fuels, such as lignite and bituminous coal, are used for power production, produce bottom and fly ash. Ash content varies depending on the originating deposit of each fossil fuel. Combustion releases the fuel’s inherent ash into two forms: bottom and fly ash. The first consists of heavier fraction particles and is trapped in the bottom area of the furnace, and the second consists of lighter fraction particles and it is entrained in the flue gases. This fly ash is responsible for the particle emissions of a power plant, and thus flue gas cleaning devices such as cyclones and dry/wet electrostatic precipitators are installed. In EU, the emissions of dust, including particle matter (PM) PM10 and PM2.5, are monitored at the emitting source [9] and in the ambient air [10] and are subject to emission limits [9]. PM10 are considered pollutants with dire effects on respiratory health for short-term exposure, whereas PM2.5 present a stronger risk factor with mortal effects for long-term exposure [11]. Coal-fired power plants monitor their particulate matter emissions, ashes, and the performance of the equipment [12] and take measures to reduce the formation of fine particles [13].
The fly ash trapped in flue gas cleaning devices, such as electrostatic precipitators, scrubbers, cyclones and baghouse filters, has a variety of industrial uses [14,15,16] and remains a subject of research. The portion that constitutes the particulate matter is under intensive analysis over the formation of and emissions from the coal-fired power plants. Two mechanisms are identified to dominate the formation of particulate matter and they are related to mineral properties [17,18,19,20,21]. Concerning the first one, minerals in solid state direct forming fine particles [22,23]. The second one proposes that minerals are first volatilized and, during the cooling phase, they form agglomerates, forming fine particles less than 1μm in diameter [17]. A more comprehensive description of the fly ash particles’ formation mechanism from coal combustion can be found in [24], revealing that they have a more effective surface and are more reactive with oxy-anion elements than fly ash particles with supermicron particles. Several studies deal with the characterization of the particulates in terms of composition [25,26] and shape [27,28] from coal combustion and under various conditions [29,30]. Fly ash composition, e.g., alumina content, and shape, e.g., cenospheres content, are related to industrial uses, e.g., alumina recycle, an additive to cement and concrete [27,31], of this inevitable by-product from solid fuel combustion. There is a notable amount of super fine particles escaping from the post-combustion flue gas treatment devices and released to the atmosphere [32,33] with a significant dispersion around the emitting source [34,35]. The released particles have raised the interest of many research groups due to their high health effects with a more in depth survey of their chemical composition. Toxic elements, such as As, Hg, Cr, Pb, Sb, Zn and others, have been traced in fine ash particles [36,37]. The presence of toxic elements in superfine particles from combustion systems is a key knowledge factor for the further improvement in the particles’ control technologies and for the health risk assessment of the ash aerosols. Thus, the regulations of particle emissions are formed and implemented based on scientific results. The measurement technologies in recent years have provided classifications with particle diameters less than 1.0 μm and these particles have been to with health effects as they are highly inhalable [38,39].
Different factors affecting the formation of fine particulate matter from coal combustion are presented in a publicly available bibliography. Various rank coals were tested in [40,41,42,43,44], combustion temperature in [45,46] and combustion conditions in [47,48]. Pilot scale combustion tests [49,50] for the particle emissions were in use with a wide range of fuels, including coal, lignite and biomass.
As pre-dried lignite has a potential use as a co-firing fuel for bituminous coal-fired power plants, the authors identify that the bibliography lacks published results from the co-firing in a pilot scale test rig. The present work aims at investigating the emissions of fine particulate matter from the co-firing of bituminous coal with pre-dried lignite in a pilot scale combustor, measured by a heated Electrical Low Pressure Impactor (ELPI+), and subsequent impact on flue gas-cleaning devices. Two pulverized fuels were selected, Czech bituminous coal and Greek pre-dried lignite, already characterized in [51]. The effect of the pre-dried lignite proportions in the fuel feed and the combustion conditions regarding the combustion air staging were the two parameters selected for this study.
2. Materials and Methods
2.1. Fuel Samples
For the experimental campaign, two fossil fuels were used, creating blends with different ratios. The first was Bituminous Coal (BC) from the Czech Republic, Darkov mine, received from ECO thermal power plant in Opole, Poland. The second was pre-dried Greek lignite (GL), Ptolemais south field, received from Public Power Corporation and mechanically pre-dried to a moisture content of 15.1% at a large scale rotary drier. Proximate, ultimate, heating value and elemental ash analyses of the two fuels are taken from [51] and presented in Table 1.

Table 1.
Characterization of Czech bituminous coal and Greek pre-dried lignite.
2.2. Unit Overview-Experimental Matrix
The measurements were conducted in University of Stuttgart (USTUTT’s) technical scale 500 kWth pulverized coal furnace KohleStaubVerbrennungsAnlage (KSVA). The scheme of the rig is presented in Figure 1. The facility provides the capacity for combustion of different pulverized fuels, as well as to control combustion conditions regarding air introduction (staged and un-staged conditions). The sampling point is located after the electrostatic precipitators (ESPs) and before the fabric filter of the unit on a vertical flue gas tube through a 3 inch access port.
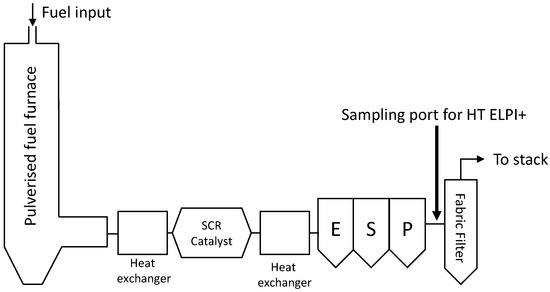
Figure 1.
Scheme of 500 kWth test facility KSVA.
A total of six experiments were carried out in partial load operation of the furnace of 300 kWth, for different fuel mixtures, as presented in the experimental matrix given in Table 2. Experiments are coded as A, B, C for different fuel ratios and 1, 2 for un-staged and staged conditions, respectively.
Table 2.
Experimental matrix.
2.3. Sample System and Analysis Method
Sampling and analysis for the particulate matter distribution is carried out with the DEKATI HT ELPI+ instrument, which is a 15 stage impactor. The sampling line, which was connected to the flue gas line after the ESP, is presented in Figure 2. A heated sampling probe with an isokinetic nozzle, pitot nozzles and type K thermocouple, is inserted in a 3 inch horizontal opening to the flue gas line, followed by an accompanying cyclone. Flue gas velocity, based on the geometry of the sampling port and the relevant fuel and oxidant mass flows, was calculated, facilitating the selection of the appropriate nozzle diameter to ensure isokinetic suction. The sampling probe was heated at a constant temperature of 180 °C. The cyclone served the purpose to hold particles at 180 °C with D50 cut-off point of 12.39 μm (collecting 50% of particles) at a volumetric flow of 12.37 lt per minute so that the ELPI + instrument does not end up with very large particles and false measurements are generated. Following the cyclone, a flexible heating line is placed, operating at 180 °C, which in turn is connected with the High Temperature module of the ELPI+ instrument (HT ELPI+). The high temperature module provides a greater accuracy in exhaust gas analyses and does not cause phenomena such as flue gas cooling, which leads to PM loss as it sticks to cool surfaces. After ELPI +, a flow meter and a suitable suction pump were installed to generate exhaust gas flow to the sampling line.
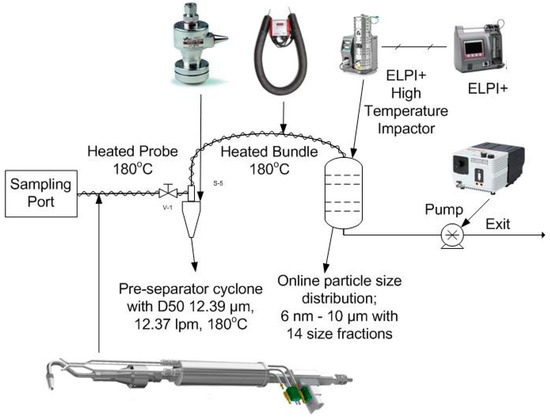
Figure 2.
Sampling system sketch.
Since the aerodynamic properties of the ELPI+ impactor are given at 20 °C, the values for 180 °C were calculated using internal routines of the instrument. In Table 3, the technical specifications for each of the 15 stages of ELPI+ are given, including the cut-off points for the experiments’ temperature of 180 °C.
Table 3.
Cut points and downstream stagnation pressures for DEKATI® Impactor.
Ash analyses of the gathered particles were carried out using Scanning Electron Microscope Energy Dispersive X-ray Spectroscopy (SEM-EDS) technique on instrument JEOL JSM-5600, combined with microanalyzer energy dispersive system OXFORD LINK ISIS 300, with software ZAF correction quantitative analysis. The system was calibrated with OXFORD ME-XRS multi-element X-RAY reference standards. The system operated at 20KV, 0.5nA and 60 sec time of analysis. An EDS microprobe analysis was used with 60–72 eV resolution. The elements chosen to be measured are classified in major and minor elements as suggested in [52], presenting an environmental interest.
3. Results and Discussion
3.1. Skeletal Density
The skeletal density of the fly ash collected by the pre-separator cyclone was measured using the helium pycnometer Accupyc 1330 of Micromeritics, and is presented in Table 4. Skeletal density measurements serve the scope of calculating the Stokes particle diameter, which gives more precise results and is used instead of the aerodynamic particle diameter. On top of that, the current bibliography lacks skeletal density measurements for calculating nanoparticles’ mass, while the most common magnitude in use is the aerodynamic particle diameter. It is noted that skeletal density values are higher with the increased pre-dried lignite share due to greater concentrations of heavier minerals in the lignite ash.
Table 4.
Skeletal density of cyclone fly ash for each experiment.
3.2. Fine PM Concentrations
The results for the number of particles produced in each of the aforementioned experiments are given in Figure 3 and Figure 4. Comparing the experiments, two trends are observed. First, by increasing the substitution percentage of bituminous coal from pre-dried lignite (Experiments A1 and A2 vs. B1 and B2 vs. C1 and C2), there is a notable shift in the number of particles produced in larger diameters while, at the same time, the number of smaller diameter particles decreases. For instance, experiments A1 and A2 present the highest production of particles in diameters ranging from 0.001 to 0.1 μm and the lowest for diameters 0.4 to 10 μm, while experiments C1 and C2 present the greatest production of particles with diameters ranging from 0.4 to 10 μm and the lowest for diameters 0.001 to 0.1 μm. Therefore, pre-dried lignite combustion leads to the production of larger particles compared to bituminous coal combustion. Second, by introducing the combustion air through different stages, a slight decrease is observed in most cases for the particle number produced within the same pre-dried lignite substitution percentage. This staged feeding of combustion air benefits the low thermal NOx production as well. Lignites rich in alkaline earth metal elements produce larger quantities of particles above PM2.5 compared to other types of lignites or bituminous coals, as presented by [44]. This was mainly attributed to high calcium concentrations in the fuels’ ash. Furthermore, a similar trend was shown by [43], where, in the co-combustion of high in calcium and high silica lignite blends, the more the high silica lignite, the lower the production in PM10.
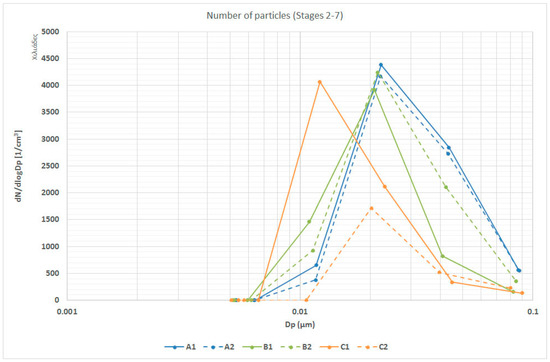
Figure 3.
Number of particles emitted (1/cm3) for sampling stages 2 to 7.
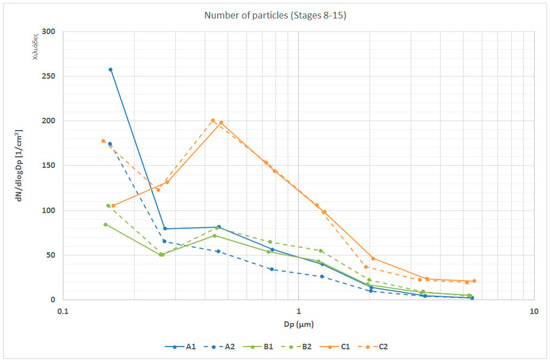
Figure 4.
Number of particles emitted (1/cm3) for sampling stages 8 to 15.
In Figure 5, the particle mass distribution between the aforementioned stages is given. The calculation took place based on internal conversion factors of instrument ELPI+, utilizing the skeletal density measured from the ash pre-separator cyclone for each experiment. Higher contents of pre-dried lignite produce a higher total mass (mg/m3). Comparing experiments A1, B1 and C1, it is observed that C1 has the higher mass concentration in total for all stages (6463 mg/m3) and also presents the highest peak in particles mass concentration for stage 15 and 4380 mg/m3. Experiment A1 has a total mass concentration of 1019 mg/m3 and a peak at stage 15 with 496 mg/m3, while B1 presents a total of 1767 mg/m3 and a peak of 1041 mg/m3 at stage 15, respectively. Comparing experiments A2, B2, C2, it is shown that C2 also presents a higher total mass concentration of 5554 mg/m3 and the highest peak in stage 15 of 3755 mg/m3. Experiment A2 has a total mass concentration of 861 mg/m3 and a peak at stage 15 with 449 mg/m3, while B2 presents a total of 1737 mg/m3 and a peak of 853 mg/m3 at stage 15, respectively.
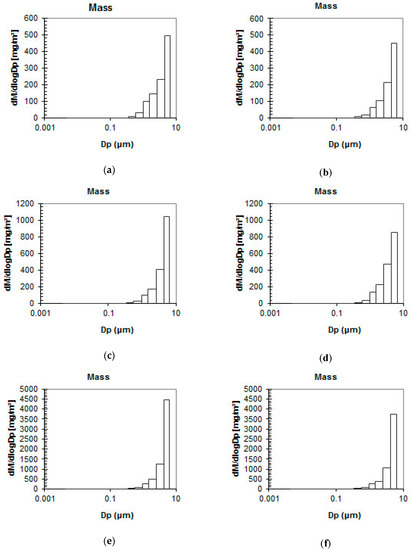
Figure 5.
Distribution of mass concentration [mg/m3] for experiments: (a) A1; (b) A2; (c) B1; (d) B2; (e) C1; (f) C2.
Moreover, observing experiments with the same percentage of pre-dried lignite substitution but with different points of air insertion (A1 vs. A2, B1 vs. B2, C1 vs. C2), the results suggest that the air-staged cases lead to lower particle emissions both in total mass concentration and in peak mass concentration.
In Table 5, PM0.1, PM1 and PM2.5 concentrations are provided as fractions of the total mass of particles analyzed per cm3. Since the aerodynamic diameters of each stage do not fall exactly on the particle diameter under investigation, the closest stage is used. For example, for PM1, concentrations up to stage 10 (0.944 μm) were used. It is observed that, in all of the experiments, PM0.1 makes up less than 0.06% of the produced particles. In addition, we can observe that the PM0.1 appears to be higher in the staged cases A2 and B2. This can be attributed to the effect of the reduction zone on combustion. A reducing atmosphere favors the persistence of soot in the fly ash [53], which typically has a particle size in the 0.1 μm range. This difference is not observed when comparing cases C1 and C2. However, the mass fractions are overall much lower in comparison to cases A and B. Furthermore, PM1 composed, at most, 5.5% of the produced particles, and this is observed in the cases where BC represents the highest percentage of fuel input. Finally, PM2.5 makes up, at maximum, 31% of the produced particles for each experiment and it is the particle diameter which presents the highest deviation between experiments with different fuel ratios. It is also observed that experiments with a higher pre-dried lignite ratio, produced a lower mass of small diameter particles (PM0.1, PM1 and PM2.5). This can mostly be attributed to the particle size of the pre-dried lignite, which is significantly higher than that of the hard coal [51].
Table 5.
Particle matter as mass and number fraction for each experiment.
This shift in particles’ diameter to higher values caused by the increasing share of pre-dried lignite in the fuel has a beneficial effect on the dry/wet ESP’s efficiency [54,55,56]. The particle size is reported as a key factor, among others, for measuring the efficiency of an ESP [57]. The latter contains two different definitions. The fractional efficiency refers to the mass captured by the device for each particle size class, with respect to particle diameter, and the total efficiency refers to all particle size classes detained from the ESP device [58].
3.3. Scanning Electron Microscopy with Energy Dispersive Spectroscopy (SEM/EDS) Analysis
Elemental analysis was performed for the fly ash trapped in the cyclone and for the impactor stages from 15 (D50 10.34 μm) to 6 (D50 0.006 μm), and results are presented in Table 6 and Table 7. Stages from 7 to 2 could not have been analyzed with SEM/EDS spectroscopy as the calculated sampling time was not enough for these stages, and thus insignificant mass was actually collected in each one. In Figure 6, SEM pictures from stage 15 of the impactor for all experiments are depicted.
Table 6.
Elemental concentration (wt% of fly ash particles) per stage and experiment for staged combustion conditions.
Table 7.
Elemental concentration (wt% of fly ash particles) per stage and experiment for un-staged combustion conditions.
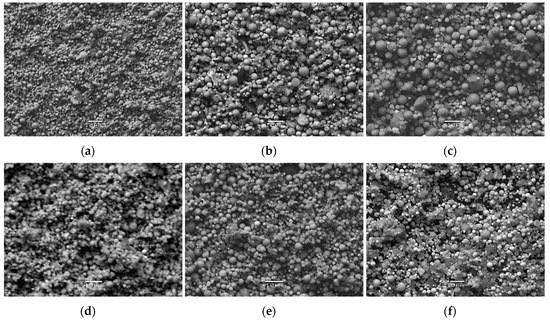
Figure 6.
SEM pictures from stage 15 for experiments: (a) C2; (b) B2; (c) A2; (d) C1; (e) B1; (f) A1.
In Figure 7, the elemental concentration for fly ash particles is given as a percentage (%) of fly ash composition. The sulfur content shows an initial low concentration at the first stage (15) and a slightly higher value for the next stage (14), with a clearly particle-size-dependent inclination towards lower particle diameters. This follows a trend also depicted by [44], where sulfur content in the analyzed ash decreased with the increased in particle diameter.
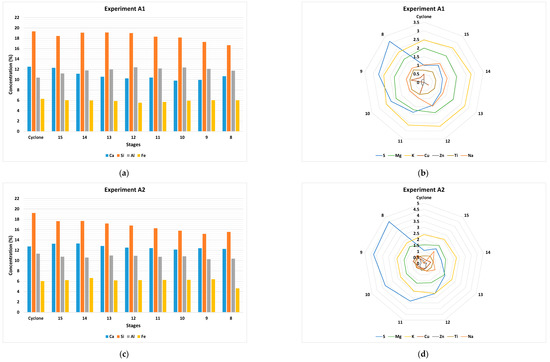
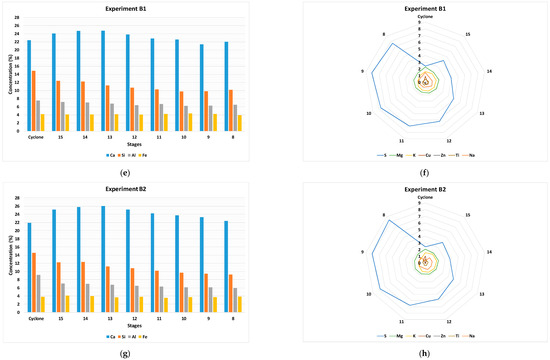
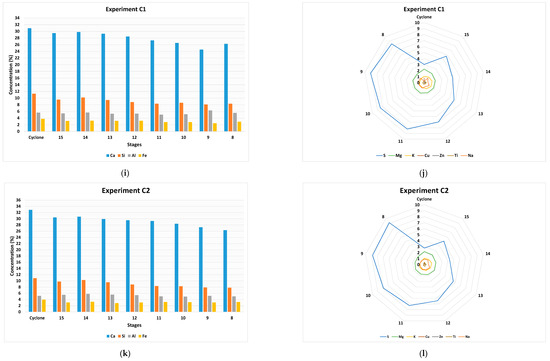
Figure 7.
Elemental concentration (wt%) for fly ash particles for stages Cyclone, 15, 14, 13, 12, 11, 10, 9, 8 in bar chart for elements Ca, Si, Al, Fe and spider chart for elements S, Mg, K, Cu, Zn, Ti, Na for experiment: (a) A1; (b) A1; (c) A2; (d) A2; (e) B1; (f) B1; (g) B2; (h) B2; (i) C1; (j) C1; (k) C2; (l) C2.
The calcium shows a minor concentration dependence from the particle diameter with a slight decline as the particles’ diameter drops. The same behavior for high-calcareous lignites was observed by [44], were the greater the diameter of the particle, the higher the calcium concentration. More specifically, for diameters above 1 μm they found concentrations of Ca around 30%. The initial concentration is related to bituminous coal and pre-dried lignite proportions, having higher value for higher pre-dried lignite share, and the level dependent one is reversible proportional to those of the sulfur, as described before. As for the burning conditions, the air un-staged burning conditions favor a lower concentration for finer particles.
The aluminum concentration depicts minor fluctuation across the particle size levels and is dependent only on fuel mixture composition with greater values as the bituminous coal share increases. For experiments A1 and A2, high in BC, it was observed that, as the particle diameter increases, so does the concentration of Al in the particle. Particularly, up to PM2.5, aluminum concentration increases, and afterwards it is observed to have a plateau of around an average value. Similar behavior was observed by [43,59,60] for silica- and aluminum-rich coals.
The silica concentration shows a consistent drop towards to finer particles. As the particle’s diameter declines, the air staged firing conditions show a more rapid drop in concentration than the un-staged ones. Again, the dependence of the fuel mixture is evident, where higher the bituminous coal proportion, the higher the silica concentration. The silica concentration presents the same pattern as aluminum in silica-rich experiments, a trend which is also observed by [43,60].
The ferrous concentration does not reveal a dependence on the particle size of form fuel mixture. Maybe this is masked by the attrition of equipment, as also reported in the bibliography [27].
The potassium shows a small decline in concentration values as the particles gets smaller. The concentration values per level are not affected by the burning conditions, whereas the increasing presence of bituminous coal in the fuel mixture drives them to higher values.
The titanium concentration values are affected by the combustion conditions depicting a minimum value in middle levels. The air un-staged burning conditions drive the minimum to larger particles with a significant raise of concentration to finer particles.
The magnesium concentration values present a slight decrease as the particles’ diameter lessens. The fuel composition and the air burning conditions do not have significant effect on these values.
Sodium appears in each sample without a construable correlation. Moreover, copper and zinc presence is observed in several cases with very low concentration but not in a regular manner across all particle diameters. Finally, traces of chromium, lead, arsenic, cadmium, vanadium and antimony were found in some samples.
The composition of particles affects the electrical resistivity, which is one of the characteristic properties of fly ash influencing the operation of an ESP device. The influence of the chemical composition of particles to electrical resistivity values is reported in [58]. An increase in silicon and aluminum may raise the resistivity and thus reduce the collection efficiency. The same effect is also observed for brown coal, related to the ratio of alkali oxides to iron trioxide. As concerns the presence of sulfur trioxide, a strong effect on electrical resistivity with respect to the temperature is reported as well.
4. Conclusions
The co-combustion of pre-dried lignite with bituminous coal is assessed regarding particle emissions under two parameters: fuel mixture and combustion air staging. Pre-dried lignite has a greater ash content and thus higher amounts of fly ash are produced, and PM10 follows the same high emission values. The sulfur content shows an inclination towards higher concentration values as the particle diameter drops.
The combustion air feed in stages leads to lower PM10 particle emissions. Un-staged combustion air conditions favor the formation of finer particles and the presence of heavy minerals such as Ca and Fe.
Skeletal density was measured and used for the calculation of Stokes diameter for the ash particles. Particles with lignite origin are denser due to higher concentrations of heavy minerals. Air-staged combustion conditions drive the particles to be slightly denser, in contrast with the un-staged ones.
With the increase in the substitution percentage of bituminous coal from pre-dried lignite, a larger number of particles was produced in greater diameters while, at the same time, the number of smaller diameter particles decreases. Therefore, pre-dried lignite combustion leads to the production of larger particles compared to bituminous coal combustion, with a positive effect on the fractional efficiency, and overall efficiency, of the ESP devices. Furthermore, by introducing the combustion air through different stages, a slight decrease is observed in most cases for the particle number produced within the same pre-dried lignite substitution percentage.
It was found that PM0.1 made up less than 0.06% w.t. of the produced particles, while PM1 composed, at most, 5.5% w.t. of the produced particles, and PM2.5 made up, at maximum, 31% w.t. of the produced particles for each experiment. It is observed that experiments with a higher pre-dried lignite ratio produce a lower mass of small diameter particles (PM0.1, PM1 and PM2.5).
Author Contributions
Conceptualization, I.A. and P.V.; methodology, I.A. and P.V.; formal analysis, I.A. and P.V.; investigation, I.A.; resources, J.M. and P.G.; data curation, I.A. and P.V.; writing—original draft preparation, I.A. and P.V.; writing—review and editing, I.P.; visualization, I.A. and P.V.; supervision, P.G. and E.K.; project administration, J.M. and P.G.; funding acquisition, J.M., P.G. and E.K. All authors have read and agreed to the published version of the manuscript.
Funding
This study has been carried out in the framework of the European Commission–Research Fund for Coal and Steel, Contract no. RFCR-CT-2014-00009 (DRYLIG).
Conflicts of Interest
The authors declare no conflicts of interest.
References
- European Parliament & Council. Decision No 406/2009/EC of the European Parliament and of the Council of 23 April 2009 on the Effort of Member States to Reduce Their Greenhouse Gas Emissions to Meet the Community’s Greenhouse Gas Emission Reduction Commitments up to 2020; European Parliament & Council: Brussels, Belgium, 2009; pp. 136–148. [Google Scholar]
- International Energy Agency. Statistics-Total Primary Energy Supply (PES) by Source. Available online: https://www.iea.org/statistics/?country=WORLD&year=2008&category=Key%20indicators&indicator=TPESbySource&mode=chart&categoryBrowse=false&dataTable=BALANCES&showDataTable=true (accessed on 26 April 2020).
- International Energy Agency. Statistics-Electricity Generation by Fuel. Available online: https://www.iea.org/statistics/?country=WORLD&year=2007&category=Key%20indicators&indicator=ElecGenByFuel&mode=chart&categoryBrowse=false&dataTable=ELECTRICITYANDHEAT&showDataTable=true (accessed on 10 October 2018).
- International Energy Agency. Coal 2017 Analysis and Forecasts to 2022—Executive Summary; International Energy Agency: Paris, France, 2017. [Google Scholar]
- European Commission. EU Energy in Figures—Statistical Pocketbook 2017; Publications Office of the European Union: Luxembourg, 2017. [Google Scholar]
- Sivek, M.; Jirásek, J.; Sedláčková, L.; Čáslavský, M. Variation of moisture content of the bituminous coals with depth: A case study from the Czech part of the Upper Silesian Coal Basin. Int. J. Coal Geol. 2010, 84, 16–24. [Google Scholar] [CrossRef]
- Sivek, M.; Čáslavský, M.; Jirásek, J. Applicability of Hilt’s law to the Czech part of the Upper Silesian Coal Basin (Czech Republic). Int. J. Coal Geol. 2008, 73, 185–195. [Google Scholar] [CrossRef]
- Michels, A. Dry lignite Increases Flexibility. Available online: http://www.bine.info/fileadmin/content/Publikationen/Projekt-Infos/2016/Projekt_072–016/ProjektInfo_0716_engl_internetx.pdf (accessed on 10 January 2018).
- European Parliament & Council. Directive 2010/75/EU of the European Parliament and of the Council of 24 November 2010 on Industrial Emissions (Integrated Pollution Prevention and Control); European Parliament & Council: Brussels, Belgium, 2010; pp. 17–119. [Google Scholar]
- European Parliament & Council. Directive 2008/50/EC of the European Parliament and of the Council of 21 May 2008 on Ambient Air Quality and Cleaner Air for Europe; European Parliament & Council: Brussels, Belgium, 2008; pp. 1–44. [Google Scholar]
- World Health Organization regional office for Europe. Health Effects of Particulate Matter; World Health Organization regional office for Europe: Copenhagen, Denmark, 2013. [Google Scholar]
- Sui, Z.; Zhang, Y.; Peng, Y.; Norris, P.; Cao, Y.; Pan, W.-P. Fine particulate matter emission and size distribution characteristics in an ultra-low emission power plant. Fuel 2016, 185, 863–871. [Google Scholar] [CrossRef]
- Zeng, G.; Sun, S.; Dong, H.; Zhao, Y.; Ye, Z.; Wei, L. Effects of combustion conditions on formation characteristics of particulate matter from pulverized coal bias ignition. Energy Fuels 2016, 30, 8691–8700. [Google Scholar] [CrossRef]
- Yao, Z.T.; Ji, X.S.; Sarker, P.K.; Tang, J.H.; Ge, L.Q.; Xia, M.S.; Xi, Y.Q. A comprehensive review on the applications of coal fly ash. Earth Sci. Rev. 2015, 141, 105–121. [Google Scholar] [CrossRef]
- Skodras, G.; Grammelis, P.; Kakaras, E.; Karangelos, D.; Anagnostakis, M.; Hinis, E. Quality characteristics of Greek fly ashes and potential uses. Fuel Process. Technol. 2007, 88, 77–85. [Google Scholar] [CrossRef]
- Sarkar, A.; Rano, R.; Udaybhanu, G.; Basu, A.K. A comprehensive characterisation of fly ash from a thermal power plant in Eastern India. Fuel Process. Technol. 2006, 87, 259–277. [Google Scholar] [CrossRef]
- Xu, M.; Yu, D.; Yao, H.; Liu, X.; Qiao, Y. Coal combustion-generated aerosols: Formation and properties. Proc. Combust. Inst. 2011, 33, 1681–1697. [Google Scholar] [CrossRef]
- Linak, W.P.; Miller, C.A.; Seames, W.S.; Wendt, J.O.L.; Ishinomori, T.; Endo, Y.; Miyamae, S. On trimodal particle size distributions in fly ash from pulverized-coal combustion. Proc. Combust. Inst. 2002, 29, 441–447. [Google Scholar] [CrossRef]
- Zhan, Z.; Fry, A.; Zhang, Y.; Wendt, J.O.L. Ash aerosol formation from oxy-coal combustion and its relation to ash deposit chemistry. Proc. Combust. Inst. 2015, 35, 2373–2380. [Google Scholar] [CrossRef]
- Helble, J.J.; Sarofim, A.F. Influence of char fragmentation on ash particle size distributions. Combust. Flame 1989, 76, 183–196. [Google Scholar] [CrossRef]
- Yoshiie, R.; Tsuzuki, T.; Ueki, Y.; Nunome, Y.; Naruse, I.; Sato, N.; Ito, T.; Matsuzawa, Y.; Suda, T. Effects of coal types on ash fragmentation and coalescence behaviors in pulverized coal combustion. Proc. Combust. Inst. 2013, 34, 2895–2902. [Google Scholar] [CrossRef]
- Zhang, L.; Ninomiya, Y. Emission of suspended PM 10 from laboratory-scale coal combustion and its correlation with coal mineral properties. Fuel 2006, 85, 194–203. [Google Scholar] [CrossRef]
- Gao, X.; Rahim, M.U.; Chen, X.; Wu, H. Significant contribution of organically-bound Mg, Ca, and Fe to inorganic PM 10 emission during the combustion of pulverized Victorian brown coal. Fuel 2014, 117, 825–832. [Google Scholar] [CrossRef]
- Seames, W.S. An initial study of the fine fragmentation fly ash particle mode generated during pulverized coal combustion. Fuel Process. Technol. 2003, 81, 109–125. [Google Scholar] [CrossRef]
- Furuya, K.; Miyajima, Y.; Chiba, T.; Kikuchi, T. Elemental characterization of particle size-density separated coal fly ash by spectrophotometry, ICP (inductively coupled plasma emission spectrometry), and scanning electron microscopy-energy dispersive X-ray analysis. Environ. Sci. Technol. 1987, 21, 898–903. [Google Scholar] [CrossRef]
- Zhao, G.; Zhao, Z.; Guo, X.; Du, Q.; Gao, J.; Dong, H.; Cao, Y.; Han, Q.; Su, L. Emission and morphological characteristics and elemental compositions of fine particulate matter from an industrial pulverized coal boiler equipped with a fabric filter in China. Energy Fuels 2016, 30, 4307–4317. [Google Scholar] [CrossRef]
- Lanzerstorfer, C. Fly ash from coal combustion: Dependence of the concentration of various elements on the particle size. Fuel 2018, 228, 263–271. [Google Scholar] [CrossRef]
- Zhang, X. Emission Standards and Control of PM2.5 from Coal-Fired Power Plants; CCC/267; IEA Clean Coal Centre: London, UK, 2016. [Google Scholar]
- Kazanc, F.; Levendis, Y.A. Physical properties of particulate matter emitted from combustion of coals of various ranks in O2/N2 and O2/CO2 environments. Energy Fuels 2012, 26, 7127–7139. [Google Scholar] [CrossRef]
- Krpec, K.; Horák, J.; Laciok, V.; Hopan, F.; Kubesa, P.; Lamberg, H.; Jokiniemi, J.; Tomšejová, Š. Impact of boiler type, heat output, and combusted fuel on emission factors for gaseous and particulate pollutants. Energy Fuels 2016, 30, 8448–8456. [Google Scholar] [CrossRef]
- Cao, D.-Z.; Selic, E.; Herbell, J.-D. Utilization of fly ash from coal-fired power plants in China. J. Zhejiang Univ. Sci. A 2008, 9, 681–687. [Google Scholar] [CrossRef]
- Wang, A.; Song, Q.; Tu, G.; Wang, H.; Yue, Y.; Yao, Q. Influence of flue gas cleaning system on characteristics of PM2.5 emission from coal-fired power plants. Int. J. Coal Sci. Technol. 2014, 1, 4–12. [Google Scholar] [CrossRef]
- Fay, J.A.; Golomb, D. Energy and the Environment; Oxford University Press: Oxford, UK, 2002. [Google Scholar]
- Argyropoulos, G.; Grigoratos, T.; Voutsinas, M.; Samara, C. Concentrations and source apportionment of PM10 and associated elemental and ionic species in a lignite-burning power generation area of southern Greece. Environ. Sci. Pollut. Res. 2013, 20, 7214–7230. [Google Scholar] [CrossRef] [PubMed]
- Vallero, D. Modeling applications. In Fundamentals of Air Pollution, 5th ed.; Vallero, D., Ed.; Academic Press: Boston, MA, USA, 2014; Chapter 27; pp. 6837–6853. [Google Scholar]
- Smith, R.D.; Campbell, J.A.; Nielson, K.K. Characterization and formation of submicron particles in coal-fired plants. Atmos. Environ. 1979, 13, 607–617. [Google Scholar] [CrossRef]
- Neville, M.; Sarofim, A.F. The stratified composition of inorganic submicron particles produced during coal combustion. Symp. Int. Combust. 1982, 19, 1441–1449. [Google Scholar] [CrossRef]
- Chen, R.; Hu, B.; Liu, Y.; Xu, J.; Yang, G.; Xu, D.; Chen, C. Beyond PM2.5: The role of ultrafine particles on adverse health effects of air pollution. Biochim. Biophys. Acta BBA Gen. Subj. 2016, 1860, 2844–2855. [Google Scholar] [CrossRef]
- Heinzerling, A.; Hsu, J.; Yip, F. Respiratory health effects of ultrafine particles in children: A literature review. Water Air Soil Pollut. 2016, 227, 32. [Google Scholar] [CrossRef]
- Carbone, F.; Beretta, F.; D’Anna, A. Factors influencing ultrafine particulate matter (PM0.1) formation under pulverized coal combustion and oxyfiring conditions. Energy Fuels 2010, 24, 6248–6256. [Google Scholar] [CrossRef]
- Wen, C.; Gao, X.; Yu, Y.; Wu, J.; Xu, M.; Wu, H. Emission of inorganic PM10 from included mineral matter during the combustion of pulverized coals of various ranks. Fuel 2015, 140, 526–530. [Google Scholar] [CrossRef]
- Zhuo, J.K.; Li, S.Q.; Yao, Q.; Song, Q. The progressive formation of submicron particulate matter in a quasi one-dimensional pulverized coal combustor. Proc. Combust. Inst. 2009, 32, 2059–2066. [Google Scholar] [CrossRef]
- Ruan, R.; Tan, H.; Wang, X.; Li, Y.; Li, S.; Hu, Z.; Wei, B.; Yang, T. Characteristics of fine particulate matter formation during combustion of lignite riched in AAEM (alkali and alkaline earth metals) and sulfur. Fuel 2018, 211, 206–213. [Google Scholar] [CrossRef]
- Li, G.; Li, S.; Huang, Q.; Yao, Q. Fine particulate formation and ash deposition during pulverized coal combustion of high-sodium lignite in a down-fired furnace. Fuel 2015, 143, 430–437. [Google Scholar] [CrossRef]
- Fix, G.; Seames, W.; Mann, M.; Benson, S.; Miller, D. The effect of combustion temperature on coal ash fine-fragmentation mode formation mechanisms. Fuel 2013, 113, 140–147. [Google Scholar] [CrossRef]
- Zhang, L.; Ninomiya, Y.; Yamashita, T. Formation of submicron particulate matter (PM1) during coal combustion and influence of reaction temperature. Fuel 2006, 85, 1446–1457. [Google Scholar] [CrossRef]
- Li, G.; Li, S.; Dong, M.; Yao, Q.; Guo, C.Y.; Axelbaum, R.L. Comparison of particulate formation and ash deposition under oxy-fuel and conventional pulverized coal combustions. Fuel 2013, 106, 544–551. [Google Scholar] [CrossRef]
- Fryda, L.; Sobrino, C.; Glazer, M.; Bertrand, C.; Cieplik, M. Study of ash deposition during coal combustion under oxyfuel conditions. Fuel 2012, 92, 308–317. [Google Scholar] [CrossRef]
- Lee, S.W. Source profiles of particulate matter emissions from a pilot-scale boiler burning North American coal blends. J. Air Waste Manag. Assoc. 2001, 51, 1568–1578. [Google Scholar] [CrossRef]
- Yelverton, T.L.B.; Brashear, A.T.; Nash, D.G.; Brown, J.E.; Singer, C.F.; Kariher, P.H.; Ryan, J.V. Comparison of gaseous and particulate emissions from a pilot-scale combustor using three varieties of coal. Fuel 2018, 215, 572–579. [Google Scholar] [CrossRef]
- Papandreou, I.; Babat, S.; Maier, J.; Georgiou, C.; Karampinis, E.; Avagianos, I.; Vounatsos, P.; Grammelis, P.; Kakaras, E. Large technical scale parametric investigation of co-firing of hard coal and pre dried lignite under under- and over stoichiometric conditions in the scope of enhancing the flexibility of hard coal fired power stations. In Proceedings of the 43rd Clearwater Clean Energy Conference, Clearwater, FL, USA, 3–8 June 2018. [Google Scholar]
- Zhu, Q. Coal Sampling and Analysis Standards; CCC/235; IEA Clean Coal Centre: London, UK, 2014. [Google Scholar]
- Badin, E.J. Coal Combustion Chemistry: Correlation Aspects; Elsevier: Amsterdam, The Netherlands, 1984. [Google Scholar]
- Helble, J.J. A model for the air emissions of trace metallic elements from coal combustors equipped with electrostatic precipitators. Fuel Process. Technol. 2000, 63, 125–147. [Google Scholar] [CrossRef]
- Chen, T.-M.; Tsai, C.-J.; Yan, S.-Y.; Li, S.-N. An efficient wet electrostatic precipitator for removing nanoparticles, submicron and micron-sized particles. Sep. Purif. Technol. 2014, 136, 27–35. [Google Scholar] [CrossRef]
- Halliburton, W.B.; Carras, J.N.; Nelson, P.F. Fine Particle Emissions from Power Stations; Cooperative Research Centre for Coal in Sustainable Development: Pullenvale, Australia, 2018. [Google Scholar]
- Wang, C.; Liu, X.; Li, D.; Si, J.; Zhao, B.; Xu, M. Measurement of particulate matter and trace elements from a coal-fired power plant with electrostatic precipitators equipped the low temperature economizer. Proc. Combust. Inst. 2015, 35, 2793–2800. [Google Scholar] [CrossRef]
- Parker, K.R. Applied Electrostatic Precipitation; Blackie Academic & Professional: London, UK, 1997. [Google Scholar]
- Yu, D.; Xu, M.; Yao, H.; Liu, X.; Zhou, K. A new method for identifying the modes of particulate matter from pulverized coal combustion. Powder Technol. 2008, 183, 105–114. [Google Scholar] [CrossRef]
- Sui, Z.; Zhang, Y.; Yao, J.; Norris, P.; Cao, Y.; Pan, W.-P. The influence of NaCl and Na2CO3 on fine particulate emission and size distribution during coal combustion. Fuel 2016, 184, 718–724. [Google Scholar] [CrossRef]


© 2020 by the authors. Licensee MDPI, Basel, Switzerland. This article is an open access article distributed under the terms and conditions of the Creative Commons Attribution (CC BY) license (http://creativecommons.org/licenses/by/4.0/).