Article

SMART Computational Solutions for the Optimization of Selected Technology Processes as an Innovation and Progress in Improving Energy Efficiency of Smart Cities—A Case Study

by
Krzysztof Gaska
1,* and
Agnieszka Generowicz
2
1
Department of Water and Wastewater Engineering, Silesian University of Technology, Konarskiego 18, 44–100 Gliwice, Poland
2
Department of Environmental Technologies, Cracow University of Technology, Warszawska 24, 31–155 Cracow, Poland
*
Author to whom correspondence should be addressed.
Energies 2020, 13(13), 3338; https://doi.org/10.3390/en13133338
Submission received: 9 May 2020 / Revised: 12 June 2020 / Accepted: 29 June 2020 / Published: 30 June 2020
(This article belongs to the Special Issue Energy Economics and Innovation of Smart Cities)

Abstract

:
The paper presents advanced computational solutions for selected sectors in the context of the optimization of technology processes as an innovation and progress in improving energy efficiency of smart cities. The main emphasis was placed on the sectors of critical urban infrastructure, including in particular the use of algorithmic models based on artificial intelligence implemented in supervisory control systems (SCADA-type, including Virtual SCADA) of technological processes involving the sewage treatment systems (including in particular wastewater treatment systems) and waste management systems. The novelty of the presented solution involves the use of predictive diagnostic tools, based on multi-threaded polymorphic models supporting decision making processes during the control of a complex technological process and objects of distributed network systems (smart water grid, smart sewage system, smart waste management system) and solving problems of optimal control for smart dynamic objects with logical representation of knowledge about the process, the control object and the control itself, for which the learning process consists of successive validation and updating of knowledge and the use of the results of this updating to make control decisions. The advantage of the proposed solution in relation to the existing ones lies in the use of advanced models of predictive diagnostics, validation and reconstruction of data, implemented in functional tools, allowing the stabilization of the work of technological objects through the use of FTC technology (fault tolerant control) and soft sensors, predictive measurement path diagnostics (sensors, transducers), validation and reconstruction of measurement data from sensors in the measuring paths in real time. The dedicated tools (Intelligent Real Time Diagnostic System − iRTDS) built into the system of a hierarchical, multi-threaded control optimizing system of SCADA system allow to obtain advanced diagnostics of technological processes in real time using HPC technology. In effect of the application of the proprietary iRTDS tool, we obtain a significant rise of energy efficiency of technological processes in key sectors of the economy, which in global terms, e.g., urban agglomeration, increases the economic efficiency.

1. Introduction

The transformation of global economies towards the effective use of energy sources and the reduction of pollution emissions, including greenhouse gases, is becoming one of key challenges faced by our civilization. The world economy is shaped by the interpenetrating sectors of energy production, wastes disposal, water and wastewater management, transport and municipal management. With respect to power generation sector, an important aspect of the performance of any energy system is to ensure balance between the demand and the production of energy carriers when we are confronted with conditions or factors destabilizing its proper functioning. Such factors involve, for example, power supply fluctuations of renewable energy sources, failures of networks or generators, changes in energy demand, etc. The need for an effective response to such disturbances in energy production and distribution systems is even more justified when frequent large power supply failures occur and the consequences are severe for all energy market participants.
The search for optimal technological solutions, both hard and soft ones, in the energy sector, water and wastewater management, or waste disposal requires specialist, domain knowledge, which supplemented by solutions can be a key element in intelligent IT systems. By the application of numerical modeling, we can develop systems based on the knowledge of complex solutions, processes and installations in a relatively short time. It is particularly important in the context of process optimization that requires complex calculations for one specific case (building real models for each solution variant is impossible for technical reasons). Models of this type are used in each of the fields of power generation and environmental engineering, ranging from simulation of individual devices, through designs of power systems, such as power plants, to technical and social models of entire systems for a region.
Models of processes are usually described by partial differential equations describing the behavior of systems. The computational complexity of such algorithmic models is usually so large that the IT systems required to solve them make software engineers resort to parallel computing architecture. Sometimes the exact nature of the problem is unknown, and we have to rely on knowledge derived from observation, or the applied software imposes a specific modeling method that does not allow accurate reproduction of all the nuances of the system under consideration.
An alternative solution that can be used in such a situation is the application of advanced solutions based on artificial intelligence (artificial neural networks, fuzzy sets, genetic algorithms, etc.). In the field of industrial automation, many solutions based on artificial intelligence are available, including inferential, predictive and adaptive systems, which are a key element in the optimal control of technological processes.
For the comprehensive optimization of the control of industrial process parameters, we are currently using advanced control algorithms in combination with predictive and adaptive models. The main objective of the control process of modern installations for industry, including energy sector, is to stabilize the parameters of the technological process and maintain balance in the process management system, which helps reduce the occurrence of sudden and significant changes in operating parameters.
The current industrial research and development works in the areas of energy management, water and wastewater management or waste disposal are a vital part of the contemporary strategic activities determining the development of smart cities. The global economy is shaped by the development of advanced ICT technologies, in particular in the field of HPC, big data, cloud computing, soft sensors metering, as well as industrial automation. The development of these technologies guarantees the sustainable development of cities while ensuring the security of fuel and energy supplies, drinking water for end users and optimal management of resources, including non-renewable energy.
The international smart cities strategies of conservation and sustainability policies as well as the complexity of critical infrastructure make water management a challenging in a respect of monitoring and technology processes control problem. Optimization and optimal control techniques provide an important input to a smart management strategy of computation for water networks (DWN) [1,2,3]. The problems related to modelling of water distribution systems have been the subject of research efforts over the last few years [4,5,6,7]. In [6,8] the authors presented an MPC- based control technique to improve the performance of DWNs. The developed control strategies have been tested on the water distribution network of Barcelona [9,10,11].
In the area of the optimization of energy consumption in the wastewater sector, a lot of research studies have been focused on solutions to increase energy efficiency. Measures to reach self-sufficient WWTPs include the following:
  • Process optimization.
  • Enhanced biogas yield.
  • Efficient on-site combined heat and power (CHP) generation.
  • Co-digestion of sludge with food waste as a option to increase the biogas output.
An important area of research involves the waste management sector due to its high energy potential. The report from The World Bank estimates that by 2025 waste amount will increase to 2.2 billion tons all over the world [5]. Around the world, waste-to-energy technologies are an important part of integrated waste management systems to address global warming and climate change. Globally, waste-to-energy technologies play a vital role in sustainable waste management and in the mitigation of environmental issues. These technologies are classified as biological and thermal treatment technologies.
Despite many advanced solutions dedicated to the sectors of water and sewage management and waste management, the problem of generating incorrect control trajectories for executive devices (motors driving pumps, fans) in supervisory control systems has not been solved yet. The main reason is the lack of predictive diagnostics of the technological process (predictive diagnostics of device operating states) and predictive diagnostics of measuring data (in measuring tracks), as well as the lack of precise calibration of process models (including hydraulic) in real time, affecting the low energy efficiency of these processes (too low efficiency of pumps, fans and too low control quality indicator).
The problem of optimizing the electricity consumption by technological processes in strategic sectors for urban agglomerations of water and wastewater management and waste management has been solved. It was a scientific and technological challenge to be able to develop a novelty solution involves the use of predictive diagnostic tools, based on multi-threaded polymorphic models supporting decision making in the control of complex technological process and objects of dispersed network systems (smart water grid, smart sewage system, smart waste management system) and solving the problems of optimal control for intelligent dynamic objects with logical representation of knowledge about the process, about the control object and the control process itself for which the learning process consists in successive validation and updating of knowledge and the use of the results of this updating to determine control decisions.
The advantage of the proposed solution in relation to the existing ones lies in the use of advanced models of predictive diagnostics, validation and reconstruction of data, implemented in functional tools, allowing the stabilization of the work of technological objects through the use of fault tolerant control technology and soft sensors, predictive measurement path diagnostics, validation and reconstruction of measurement data from sensors in measuring paths in real time. The solution comprises two modules implementing validation methods based on the so-called quality levels to detect anomalies and missing data, and the data reconstruction method based on the method of space time series analysis used to estimate the missing/incorrect data.
It was a scientific and technological challenge to be able to develop optimization algorithmic models that control the operation of the technological processes, allowing for the following in particular:
  • SMART Computational Solutions for the optimization of solid waste fuel production from separate combustible fractions—a polymorphic model of multi-threaded optimization of the production process of fuel components from combustible municipal waste fractions,
    • Thread A—optimization of the light fraction production process with preset physicochemical, combustion and emission properties.
    • Thread B—optimization of the production process of hybrid fuel components, by mixing the light fraction with fossil fuels, while fulfilling the objective function (Wd-calorific value) and constraints imposed on decision-making optimization tasks.
  • SMART Wastewater Treatment Plant Computational Solutions-a model for optimizing the biological process of wastewater treatment using a multi-threaded hierarchical adaptive control algorithm, including:
    • Thread A—a model for automatic control of the nitrification and denitrification process, while monitoring the value of total nitrogen in the treated wastewater,
    • Thread B—a model for the optimization of internal and external recirculation processes of the bioreactor.
The paper presents advanced computational solutions for selected sectors in terms of the optimization of selected technology processes as an innovation and progress in improving energy efficiency of Smart Cities.
The solutions presented in the article are affected by utilitarian scientific and technological challenges undertaken by the authors and relate to key strategic areas of smart cities, including in particular the development of technologically advanced models of hierarchical, multi-threaded control optimizing the parameters of technological processes.
The structure of the paper is the following: Section 2 presents the advanced soft computing applications and industrial automation in selected SMART sectors. Section 3 presents the advanced algorithmic models in selected areas of critical infrastructure of smart cities, including:
  • SMART Waste Management Computational Solution,
  • SMART Wastewater Treatment Plant Computational Solution.
Additionally, Section 3 presents the implementation details of the predictive optimal strategy and shows the application of the optimal operational control of the real objects of the SMART town of Nowy Sącz (Poland). The results and discussion are presented in Section 4, and the conclusions are outlined in Section 5.

2. Advanced Soft Computing Applications and Industrial Automation in Selected SMART Sectors

A dynamic development of ICT and industrial automation systems determines the economic development in all strategic sectors of the world economy as well as the development of cities and intelligent technologies.
The most important element of advanced ICT systems involves supplementing the existing solutions (integrating GIS, SCADA and dedicated models) with the optimizing control layer (including MPC predictive control models). In the existing systems, the supervisory layer is the highest level in the hierarchical control structure. The superiority of the said systems in relation to the existing ones lies in the application, among other things, of the MPC predictive control models, which are integrating the knowledge base on control objects and technological processes, models of state and event space. By using evolutionary strategies, the MPC control algorithm is less sensitive to signal errors, and by using soft sensors and Performance Analysis Diagnostics & Optimization (PADO) and Complex Event Processing (CEP) technologies, it allows to generate optimal control trajectories for the supervisory control layer. What is more, parallel computing architecture (e.g., NVidia CUDA) is more and more frequently used, allowing for the acceleration of numerical calculations and for the reduction of time complexity of algorithms. The knowledge base on control objects is updated in real time from SCADA. The system of multi-threaded hierarchical control of industrial processes works in the background-parallel to the real system, conducting a huge number of simulations in the state and event space-learning (from the real-time knowledge base updated from SCADA systems, GIS, models of control objects, models of state and events in real time, constantly improving the quality of control. The models of state and event space are part of the knowledge base on control objects. The solutions presented in the article are affected by the completed research and development projects financed by the National Center for Research and Development from structural funds under the Operational Program Intelligent Development and the Operational Program Infrastructure and Environment in 2017–2020. The presented results, i.e., algorithm models, have been realized and implemented in supervisory control systems in network-type companies in several cities (Warsaw, Żywiec, Nowy Sącz).
The innovative solutions presented in this article are based on the so-called virtualized research and development space, based on advanced algorithm models, including mainly those controlling technological processes in SMART areas. The innovations lie in the stabilization rate of a technological process (and then in its optimization). The dedicated specialist domain knowledge, and the structure of the knowledge base of the expert system is of key importance, logically and physically divided into three independent modules with various functionalities [12] (Figure 1):
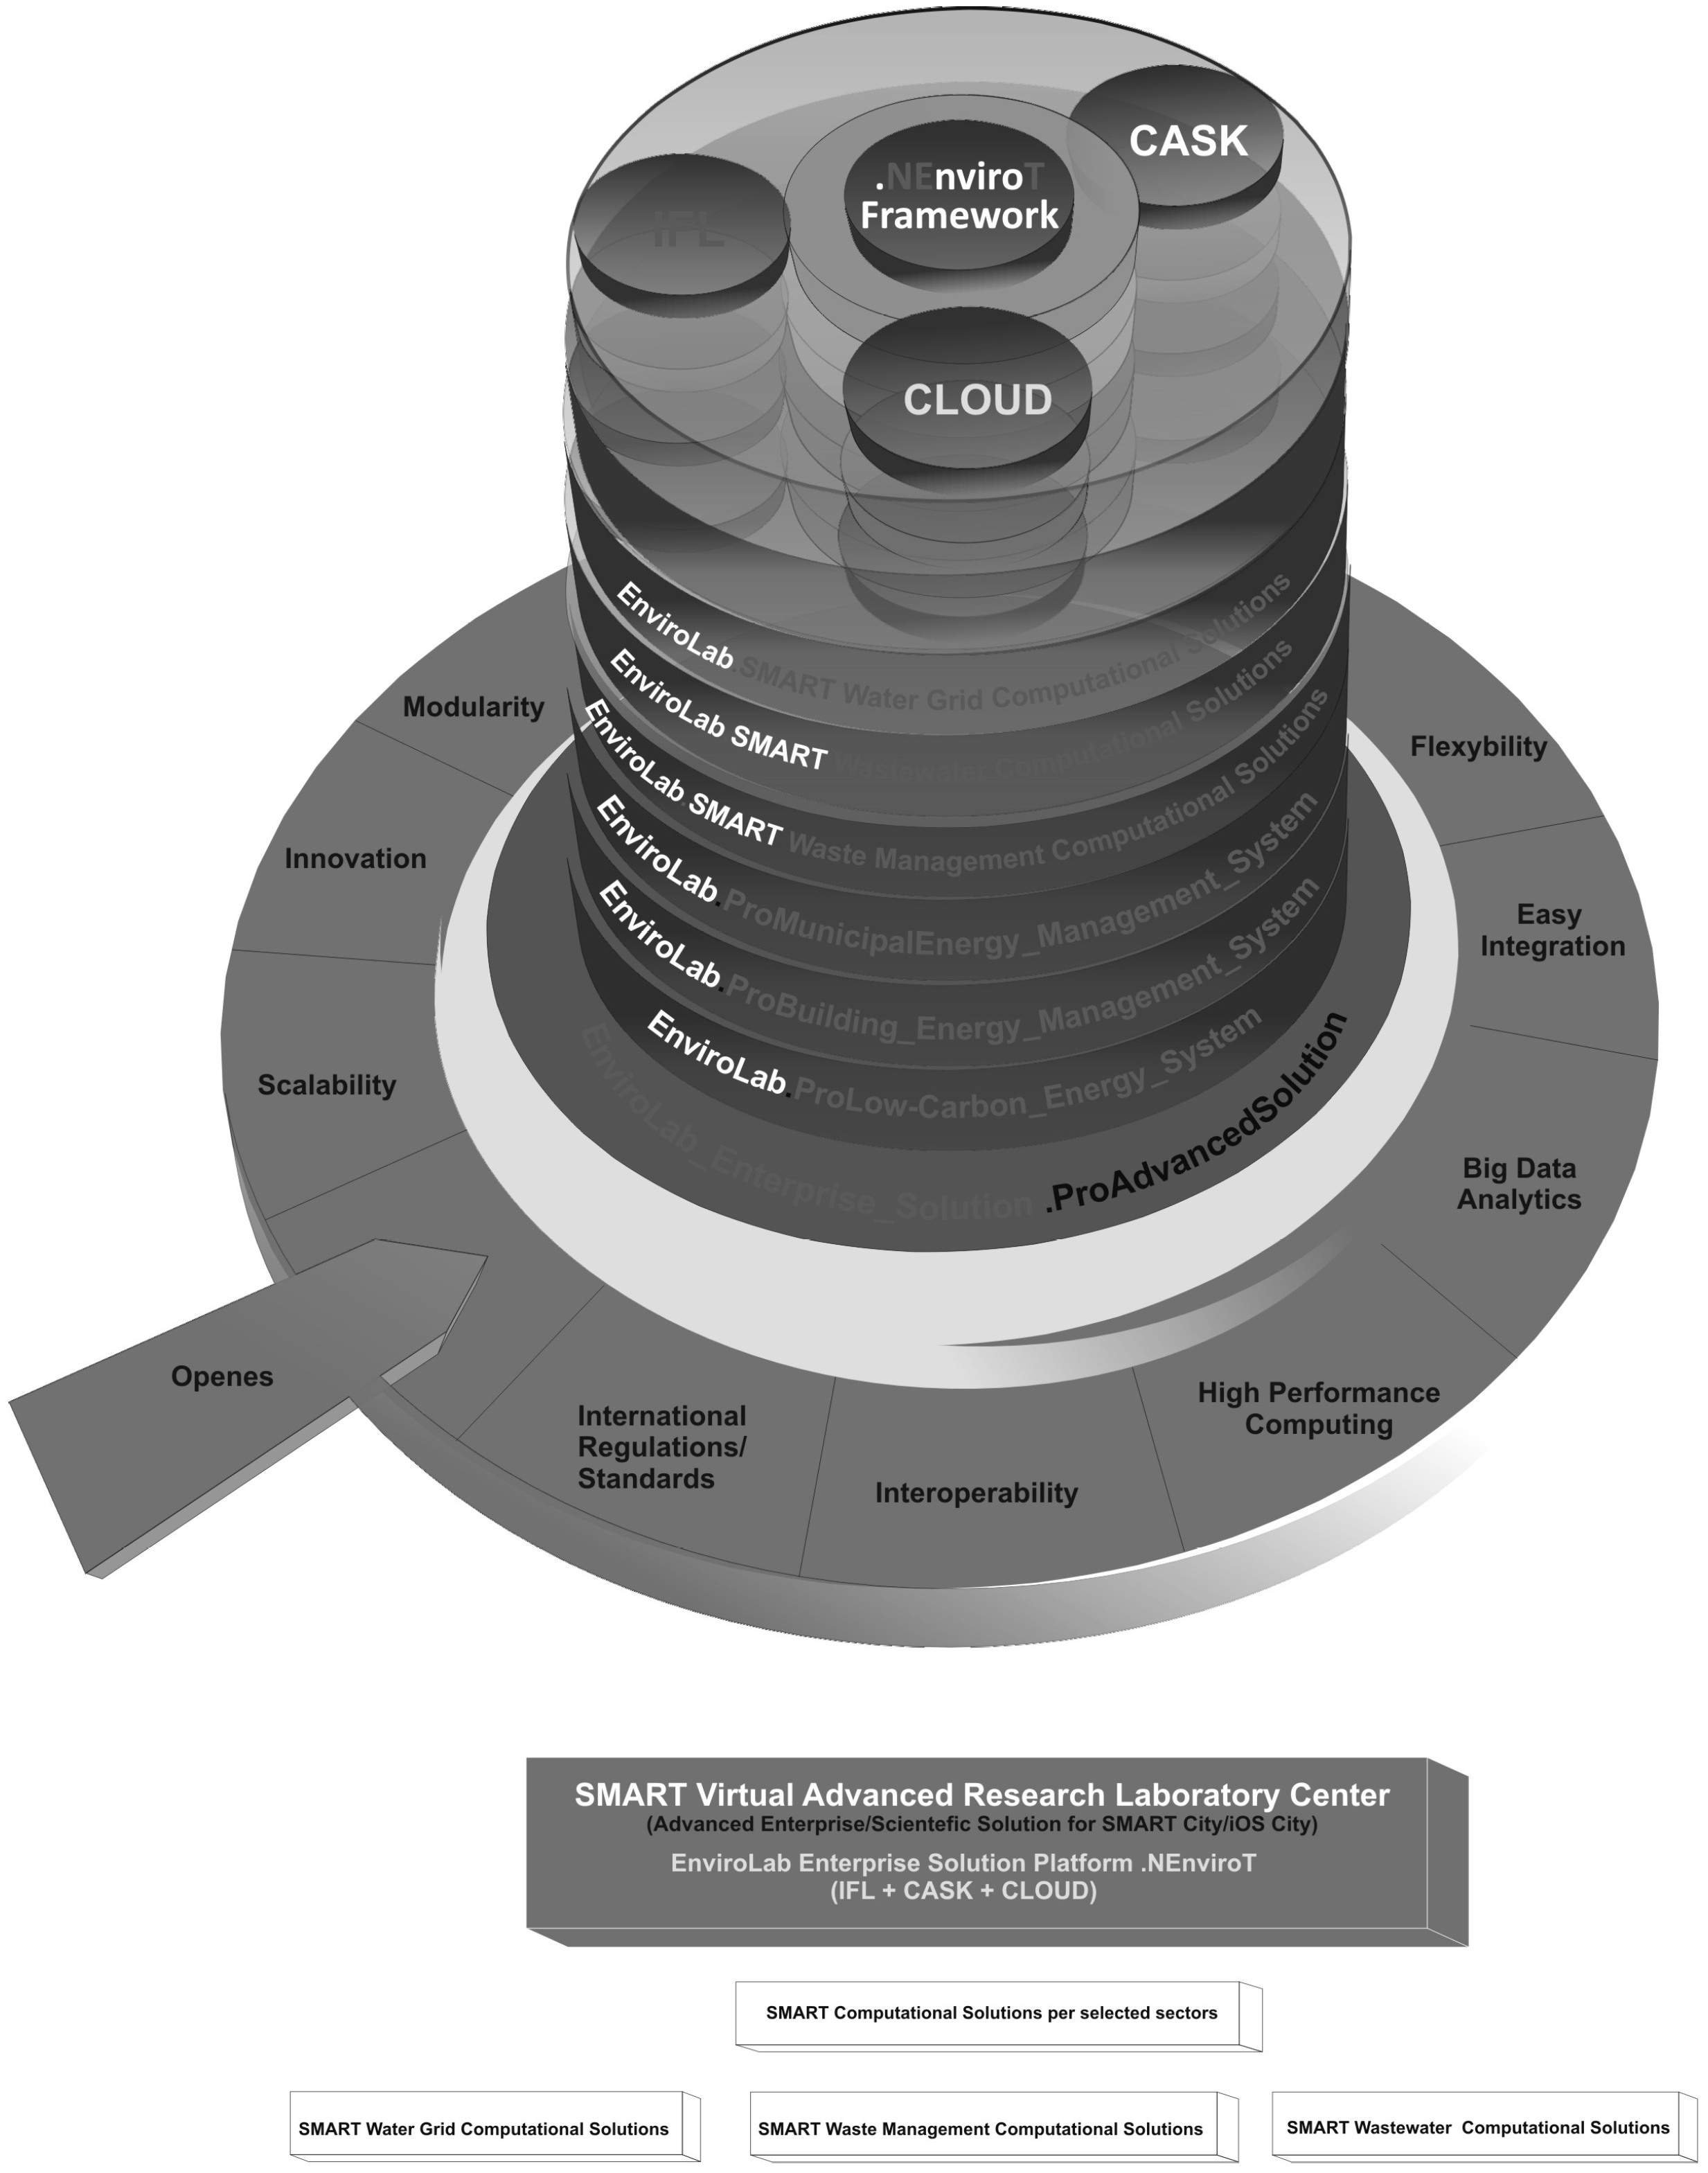
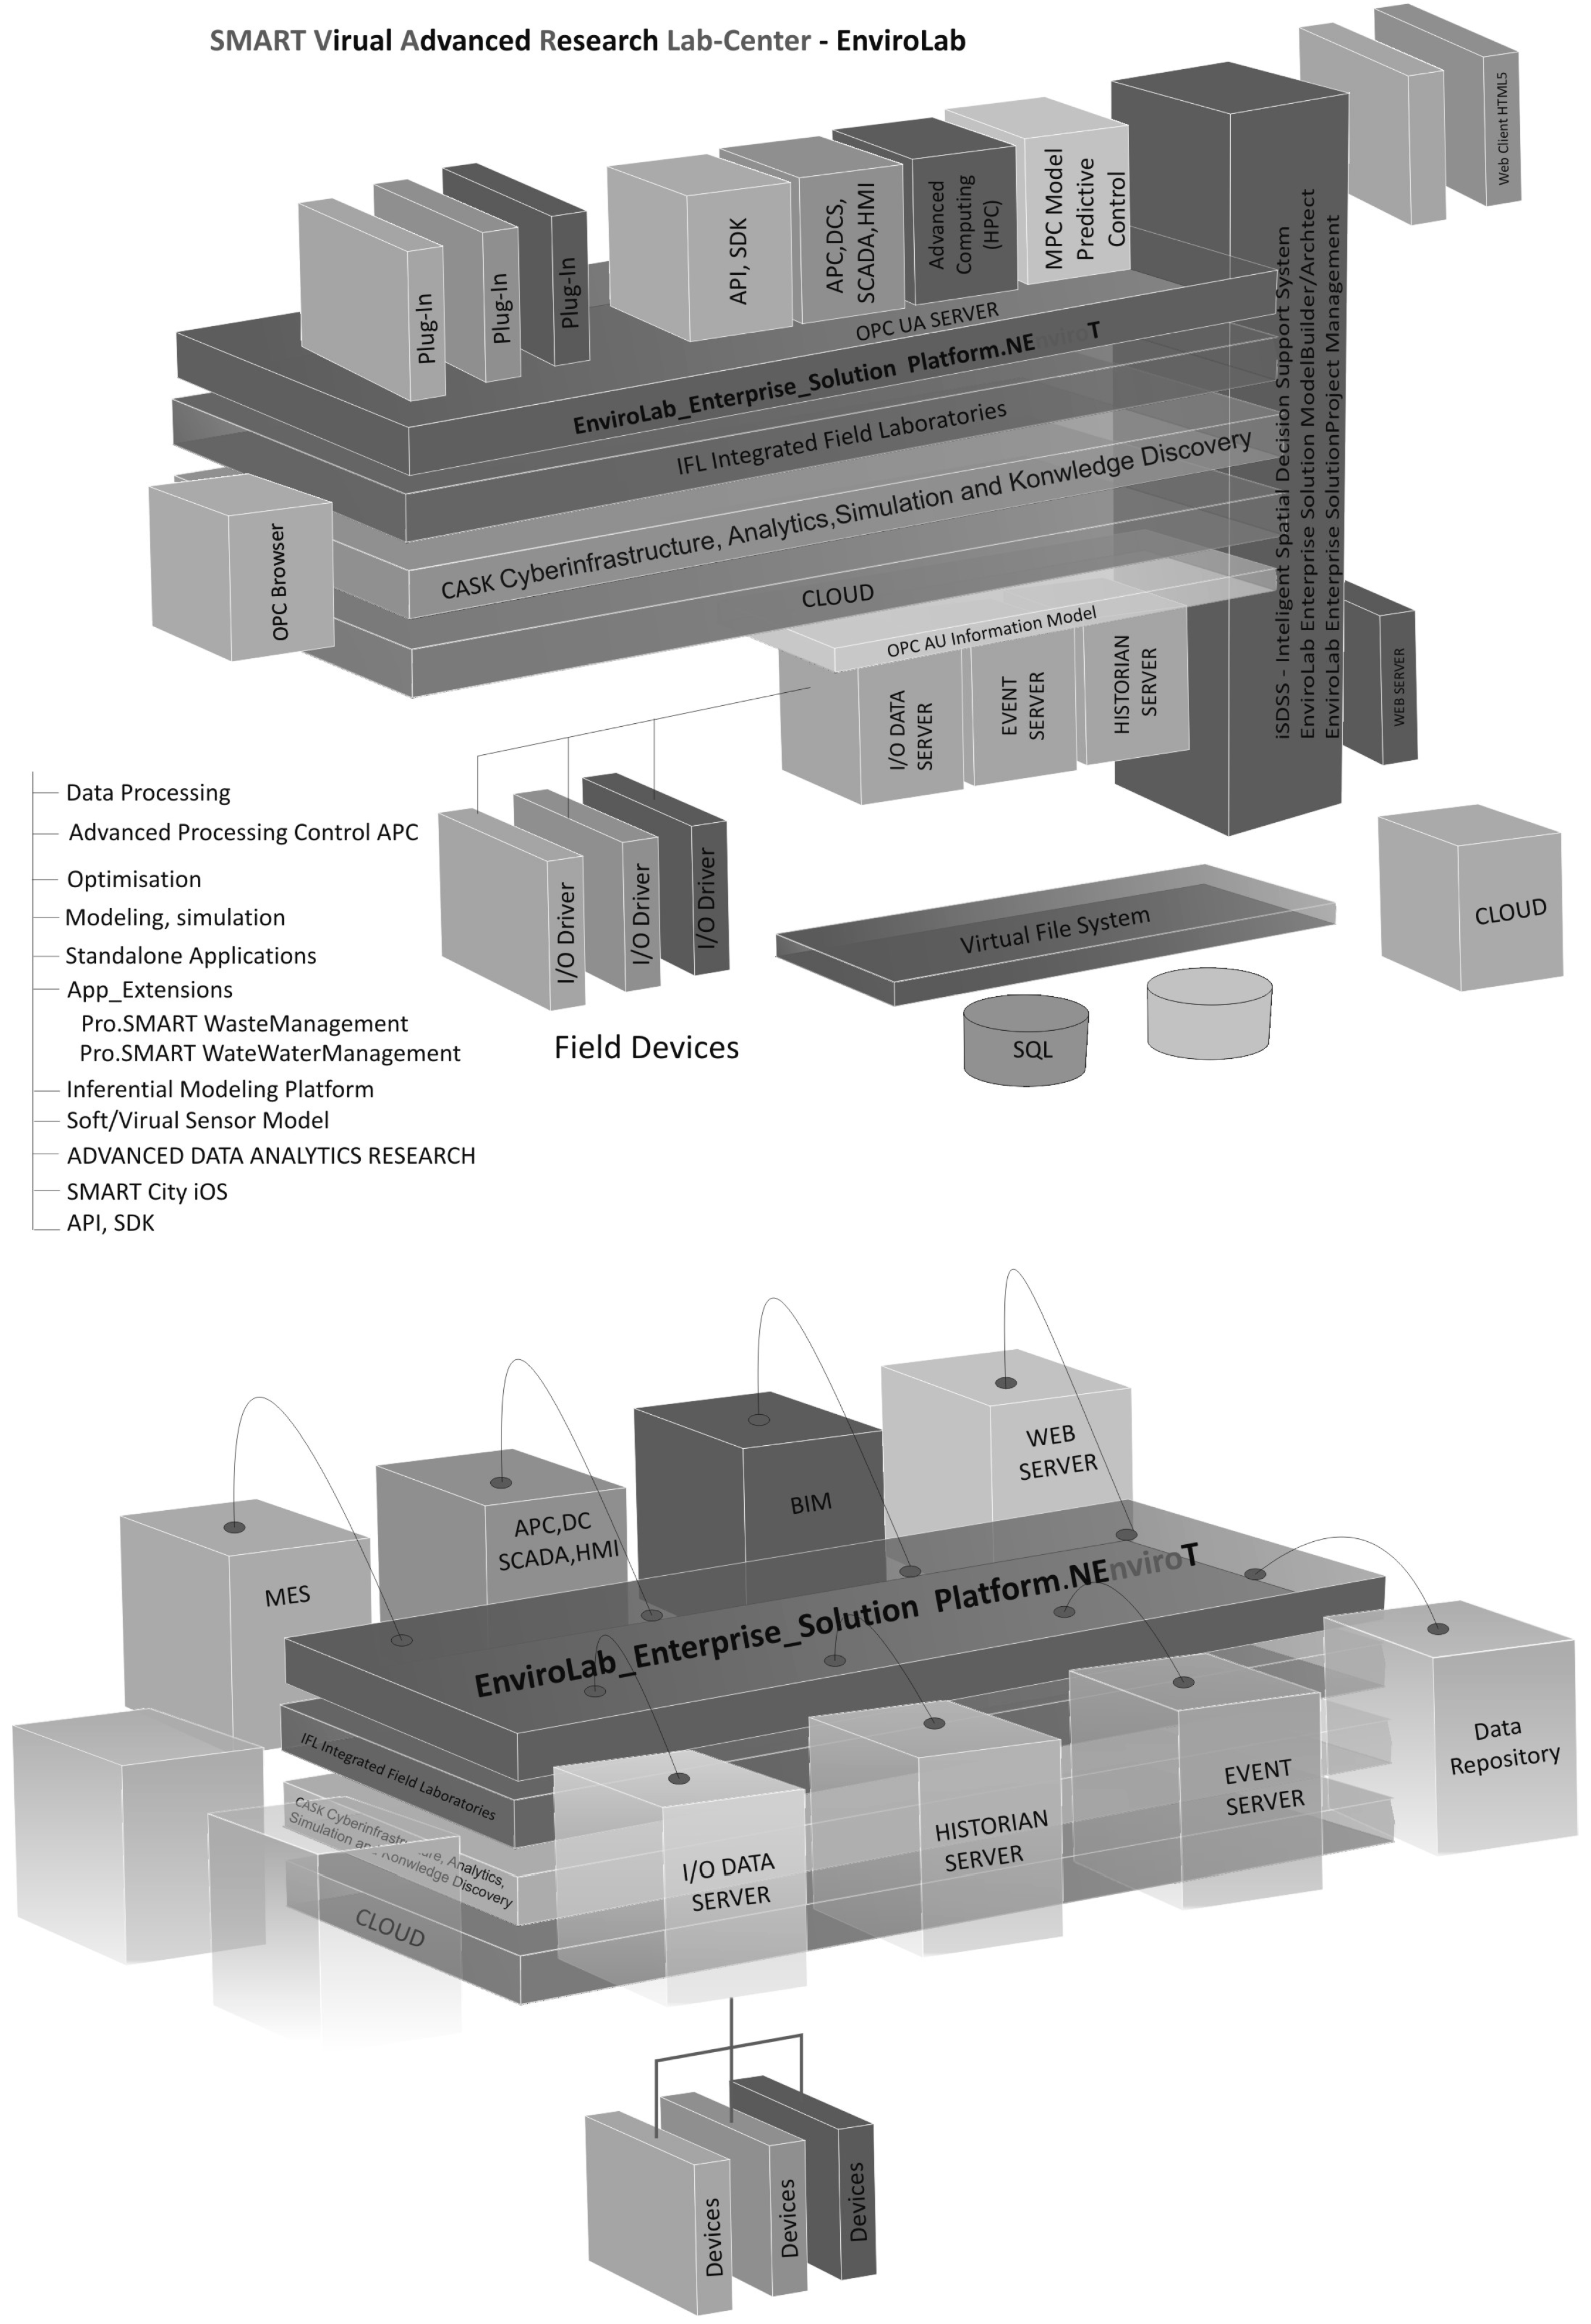
  • IFL—Integrated Field Laboratories
    • An advanced model of a virtualized laboratory space [12]. The IFL supporting the process of building and updating the knowledge base of an expert system (in the CASK layer).
  • CASK—Cyberinfrastructure, Analytics, Simulation and Knowledge Discovery [12] (The expert system in the CASK layer includes the following functional specialized modules:
    • EnviroLab.AdvancedProcessControl (an integrated package of diagnostic and optimization tools and advanced process control APC, predictive process control MPC),
    • EnviroLab.EnvironmentalMonitoring (an advanced solution of HPC class, enabling simulation of pollution propagation and the optimization of technological process parameters in order to reduce the negative impact on the environment),
    • EnviroLab.EnterpriseSolutions (an open and scalable platform based on .NET technology, using the latest IT technologies and modular plug-in solutions). The dedicated standard—EnviroLab.NEnviroT—provides SDK, API and many other tools—whereby it is possible to modify or expand applications, standard models etc.
  • Cloud-GRID—technology [12]
Highly communicated companies are constantly looking for ways to download data from industrial installations faster and more efficiently. One of them involves the use of solutions based on data support in the so-called Cloud computing, using the remote communication of HMI (Human Maschine Interface) interfaces. In the concept of modern industrial networks, employees and management staff have free and remote access to object-level system data.
The environment of the component models of the virtualized research space (Figure 2) is developed on the basis of. NET libraries that use processors with 64-bit architecture. The environment allows the use of “plug in” technology to guarantee full adaptation of the application to customer needs and integration of external components that complement the set of functional modules available as a standard, and it is based on the client /server architecture making use of the OPC (OPC UA) technology. The environment also offers integrated communication controllers for data exchange with external devices (PLC, fieldbus, distributed IO).
The virtualized research space model is based on the environment of intelligent components of the models of processes, events (Complex Event Processing), objects, and research models. Of key importance for the mapping precision of real processes, objects and events is the knowledge base, updated, analyzed and validated in real time, based on data from various computational sources (homo/heterogeneous, structured/unstructured etc.) (e.g., CFD modeling). The system is based on models, where the knowledge base on processes, state spaces, performance characteristics is based on expert knowledge and technologically advanced ICT systems, laboratory base and HPC class systems. Unlike other solutions, it is a complete, integrated environment which combines the elements of advanced research (IFL), modeling and simulation (CASK), transferring a part of solutions to CLOUD Computing (CLOUD module).
The crucial advantage of the modern control systems over other existing ones lies in the aspect of predicting future events (MPC model). This feature, in combination with the self-learning intelligent control system, allows not only to respond to changes in the state of sensors in real time, but also to anticipate these changes and correct the operation of the systems in advance, preparing them for the anticipated development of the situation, which is particularly important in systems with high inertia such as vast water and wastewater networks.
The tools embedded in integrated systems comprise support in terms of hydraulic modeling and calibration (recalibration), design, optimization of energy consumption, damage detection and predictive diagnostics of machines and installations.
The developing technologies of intelligent monitoring, control and management systems for dispersed network objects in metropolises are a response to contemporary challenges in the context of a dynamic development of intelligent cities (SMART cities) in the field of sustainable management of municipal infrastructure in metropolises, including sustainable management of resources, in terms of improving the efficiency of use of these resources.
Most integrated programming environments for industrial control systems (i.e., those in which applications for control, visualization, and control of electric drives, or communication in industrial networks are developed in parallel) enable the simulation of project operation before final compilation and dispatch to the controller. Innovative solutions in this regard combine simulation technology with three-dimensional visualization of the workspace of the programmed installations. The applied IT technologies are significant in this type of solutions. These comprise, among others, programming with the use of. NET framework platform, Microsoft Presentation Foundation and OPC server technology (OLE for Process Control), including mainly Data Access specification (the tools such as Matlab/Simulink have the OPC UA client function, whereby it possible to communicate with industrial control systems).
Nowadays, the most sophisticated technique for designing machine control systems is the so-called mechatronic or parallel design. In the case of hardware and software platforms for rapid prototyping of the development procedure of a new algorithm (using a typical, scientific approach) the following is to be considered:
  • Preparation of a simulation model.
  • Compilation of the project in the dedicated card containing analog/digital input/output interfaces.
  • Development of a target hardware module, e.g., using the systems ASIC, FPGA, microcontrollers.
The new approach to the prototyping of industrial control systems eliminates the need to use dedicated prototype cards in favor of compilation of the code in the target device. This approach significantly reduces implementation time and the cost of the entire solution. Rapid prototyping as a technique for developing new control algorithms has been known for a dozen or so years. It is successfully used in projects in the field of mechatronics, mainly due to shortening the time between the development of a concept and the implementation for final tests.
Many years of research and development works for business entities in the SMART City sectors have yielded an innovative solution of the hierarchical control system (Figure 3), which consists of main layers (Supervising, Optimizing, and Follow up) and sub-layers (slow, medium and fast) The upper layer generates controls and decisions that help the lower layer to accomplish its tasks. The division into layers results from the functional decomposition of the control system, while the division into sub-layers is the result of the decomposition of system dynamics in the time scale. In addition, it uses available information about the system, about its dynamics and mutual relations between its individual elements (knowledge base on control objects).
The novelty of the developed system lies in the mathematical model of technological processes and that of intelligent critical infrastructure of the network, including wastewater, water supply, comprising models of technological objects as well as models of control and monitoring systems. One of the key models is the mathematical model of an expert hierarchical system of predictive and adaptive control of water supply and wastewater networks, providing a significant upturn in the reliability of the systems and rapid stabilization of work and restoration of full functionality in response to failures and conditions destabilizing the operation of the network.
The decision-making problem involving (the control of) a complex technological process or object in the dispersed sewerage system (water supply) has been formulated as a problem of optimal control for intelligent dynamic objects (components of the critical network), with a logical representation of knowledge about the control and the control object for which the learning process consists in a successive validation and updating of knowledge, and in using the results of this update to determine control decisions. Intelligent objects of the network with a logical representation of knowledge about control, owing to the use of artificial neural network models (including auto associative memory) and neural-like algorithms have the so-called specialization and adaptation in response to a change in the operating status of devices, process and technological parameters of individual objects of the critical infrastructure of the network as well as detection and identification of erroneous signals from measurement paths, damage to control paths, etc.
The specialization follows up the learning process in the space of states and events through validation, reconstruction of object data structures and reconfiguration of control algorithms.
A three-layer hierarchical control system was introduced [12]. The direct control layer is used to control actuators, the supervisory control layer is responsible for data supervision and acquisition, and the third of the layers—the optimizing control layer, consists of an additional computer unit realizing complex predictive control algorithms, using specialized scientific applications (Matlab/Simulink, PADO, CEP, Neurosolution), including advanced proprietary solutions.
The developed structure of hierarchical control system (Figure 3) consists of main layers and sublayers. The higher layer generates controls and decisions that help the lower layer to accomplish its tasks. The division into layers results from the functional decomposition of the control system, while the division into sub-layers is the result of the decomposition of system dynamics in the time scale. In addition, it uses available information about the system, about its dynamics and mutual relations between its individual elements.
The Supervisory Control Layer (SuCL) has the task of coordinating individual elements of the control structure of the system, assessing the operational state of this system and selecting the best control trajectory. The observation of the current control results and comparing them with the prediction facilitates making decisions about a possible change in the control strategy.
The Optimizing Control Layer (OCL) is responsible for generating control trajectories of individual control variables. Here, the MPC technology is applied-Model of Predictive Control. This layer determines the trajectories of values preset for the lowest layer.
The Follow Up Control Layer (FCL) is the lowest layer, and it is responsible for safe operation of processes in the object, in line with the control trajectories determined in the upper layer. It has direct access to the control object. These tasks are realized by direct control algorithms in the form of classic PID algorithms, or by the algorithms stored in the memory of logic programmable controllers of the PLC type.
The work of MPC algorithms is based on the use of knowledge about the future behavior of the controlled quantity to determine the values of control variables. When predicting the future values of controlled parameters, we use the mathematical model of the control object (control object model), previous values of the control signal and the values of interfering signals (past, present and possibly future ones).
The MPC algorithm directly takes into account various types of constraints; constraints involving the value of control variables; constraints involving the increments in the value of control variables; constraints involving output variables; constraints of technological variables, which are formulated analogously to the constraints involving output variables. The MPC/APC system is implemented at a higher level of supervision to manipulate the setpoints of many control loops, to optimize control systems and track the changes in the values of process variables, and it is based on modeling the state space of the processes [12].

3. Materials and Methods

In Section 3 the authors present the advanced algorithmic models in the selected areas of critical infrastructure of smart cities and the implementation details of the predictive optimal strategy, as well as the application of the optimal operational control of the real objects of the SMART town of Nowy Sącz (Poland), i.e.,
  • Section 3.1—SMART Waste Management Computational Solution,
  • Section 3.2—Computational Solution of SMART Wastewater Treatment Plant.

3.1. SMART Waste Management Computational Solution

In this section was presented the model of multi-threaded optimization of the manufacturing process of fuel components. A growing demand for heat and electricity used in many industry sectors and in the municipal economy leads to a drastic reduction of natural resources of conventional fuels, i.e., hard coal, lignite, crude oil and natural gas. Excessive exploitation of natural energy carriers results in environmental degradation and irreversible climate changes [13]. In effect of the production of energy carriers and products or semi-finished products used in various technological processes, we generate post-process secondary waste of various types. The wastes (apart from industry) are also generated by other entities, as streams of hazardous wastes, municipal wastes, whose enthalpy of devaluation allows its secondary use after proper treatment [14]. Owing to the use of molded fuel components from segregated waste groups, in the associated co-firing processes with conventional fuels, significant savings are obtained resulting from a partial replacement of fossil fuels and the reduction of ecological nuisance resulting directly from the reduction of the migration of waste substances to the environment (to soil, atmospheric air, surface water and groundwater). A special emphasis should be placed on the possibility of using certain groups of hazardous waste (pesticides, medical waste) in these processes. Conducting technological processes with the use of molded fuel components in associated thermal systems must be conditioned by technical criteria, which means that they cannot interfere with basic processes, and in global terms, with sustainable development factors. The process involving the preparation of fuel from wastes requires careful analysis in terms of technological conditions and physic-chemical properties of the waste fraction of the produced fuel components. The regulations involving the process of thermal decomposition of substances in BIO-power boilers impose a number of requirements for fuels. The molded fuel must have [15,16,17]:
  • Optimal calorific value (enthalpy of devaluation).
  • Appropriate fractional, elemental composition, fuel properties (moisture content, combustible content, non-combustible content, volatile content, aggressive content.
  • Suitable ash softening and melting temperature, flash point, combustion temperature), as well as relevant material properties (shape, porosity).
The concept of converting segregated combustible components generated by various technological operations into fuel is essentially based on the following assumptions:
  • Substances included in fuels have identified chemical properties and composition.
  • The combustion process involving molded fuels is known.
The recycling process of the post-process waste must be preceded by detailed technical as well as ecological and economic analyses [18]. At present, there are a number of technologies that allow the recovery of materials and energy raw materials from various waste groups and the reuse of such materials as raw materials or as energy resources in various industries. Molded fuels can be introduced directly into the furnace chamber as an addition to conventional fuels, or after being processed (degassing, gasification) into process gas, they can be burned, e.g., in energetic dust boilers.
Technological processes of producing fuel components is controlled by advanced supervisory control systems of SCADA type, which ensure monitoring of process parameters, visualization of the process and implement complex control algorithms, through the use of freely programmable PLC controllers, (including adaptive, predictive and inferential control algorithms).

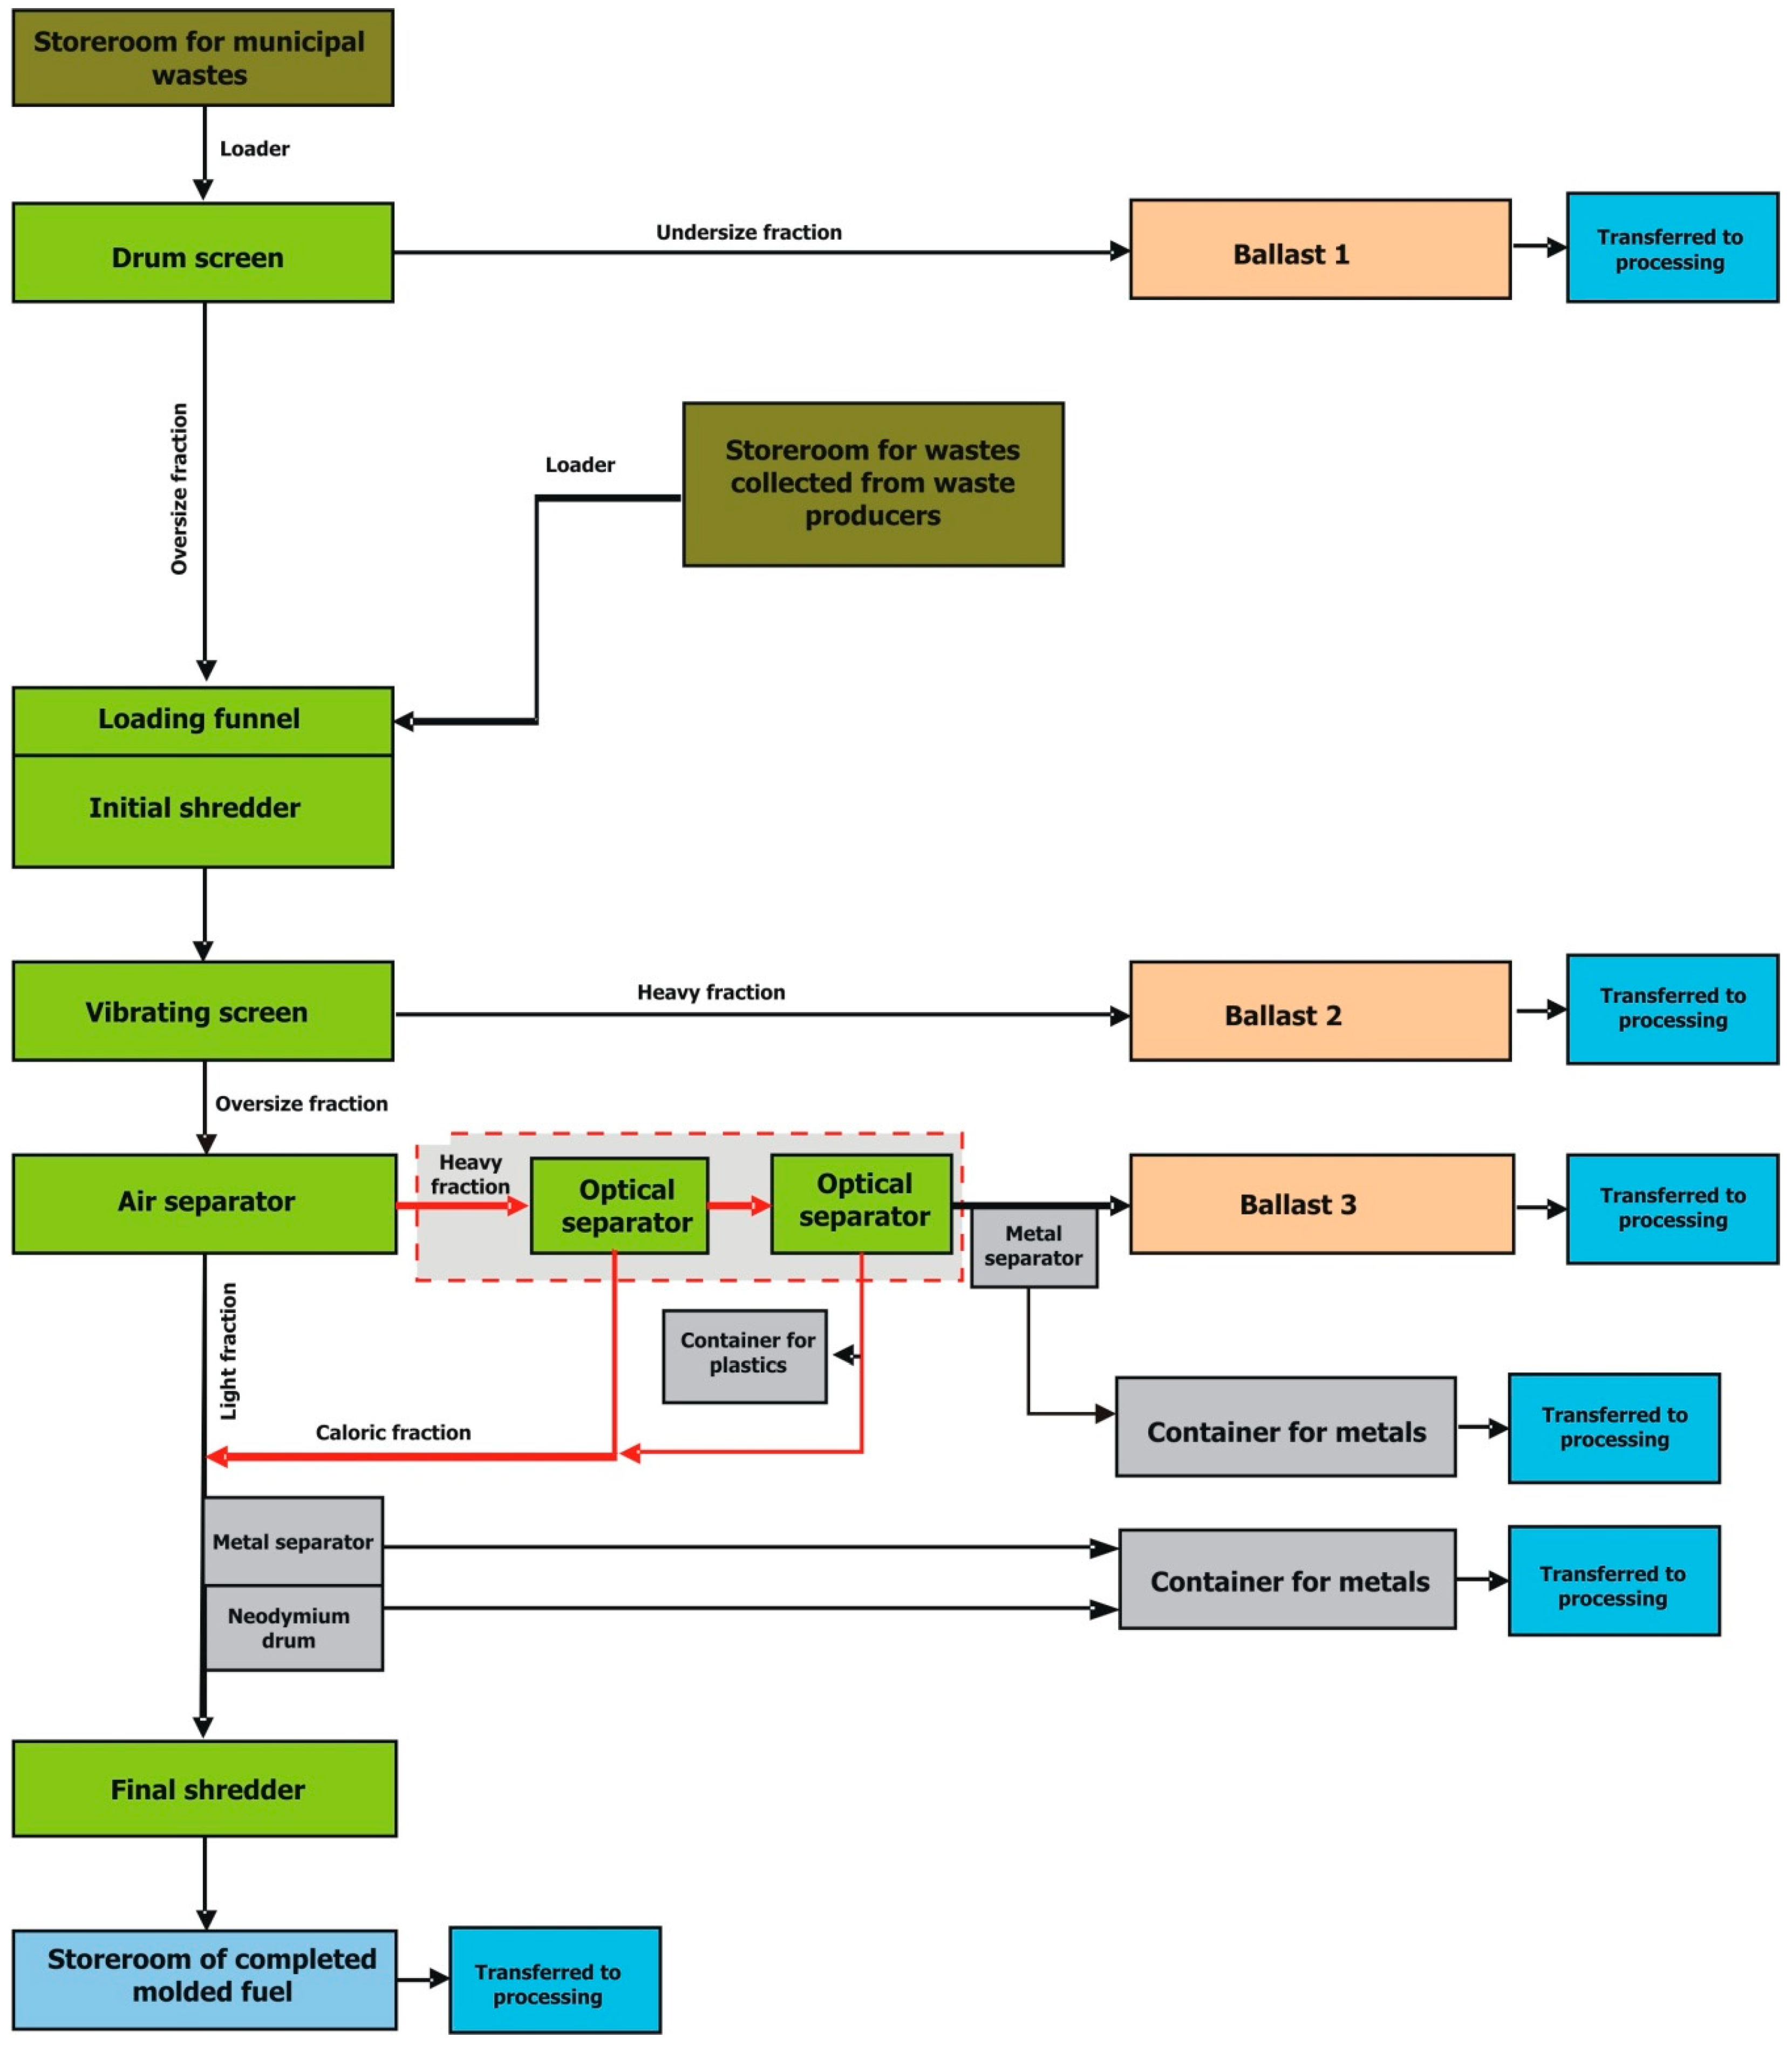
3.1.1. Algorithmic Model of Multi-Threaded Optimization of the Manufacturing Process of Fuel components

The task of optimizing a complex technological process involving the production of fuel components molded from separated combustible fractions of municipal waste to be applied in the cement industry, thermal power engineering and professional power engineering comprises two main threads:
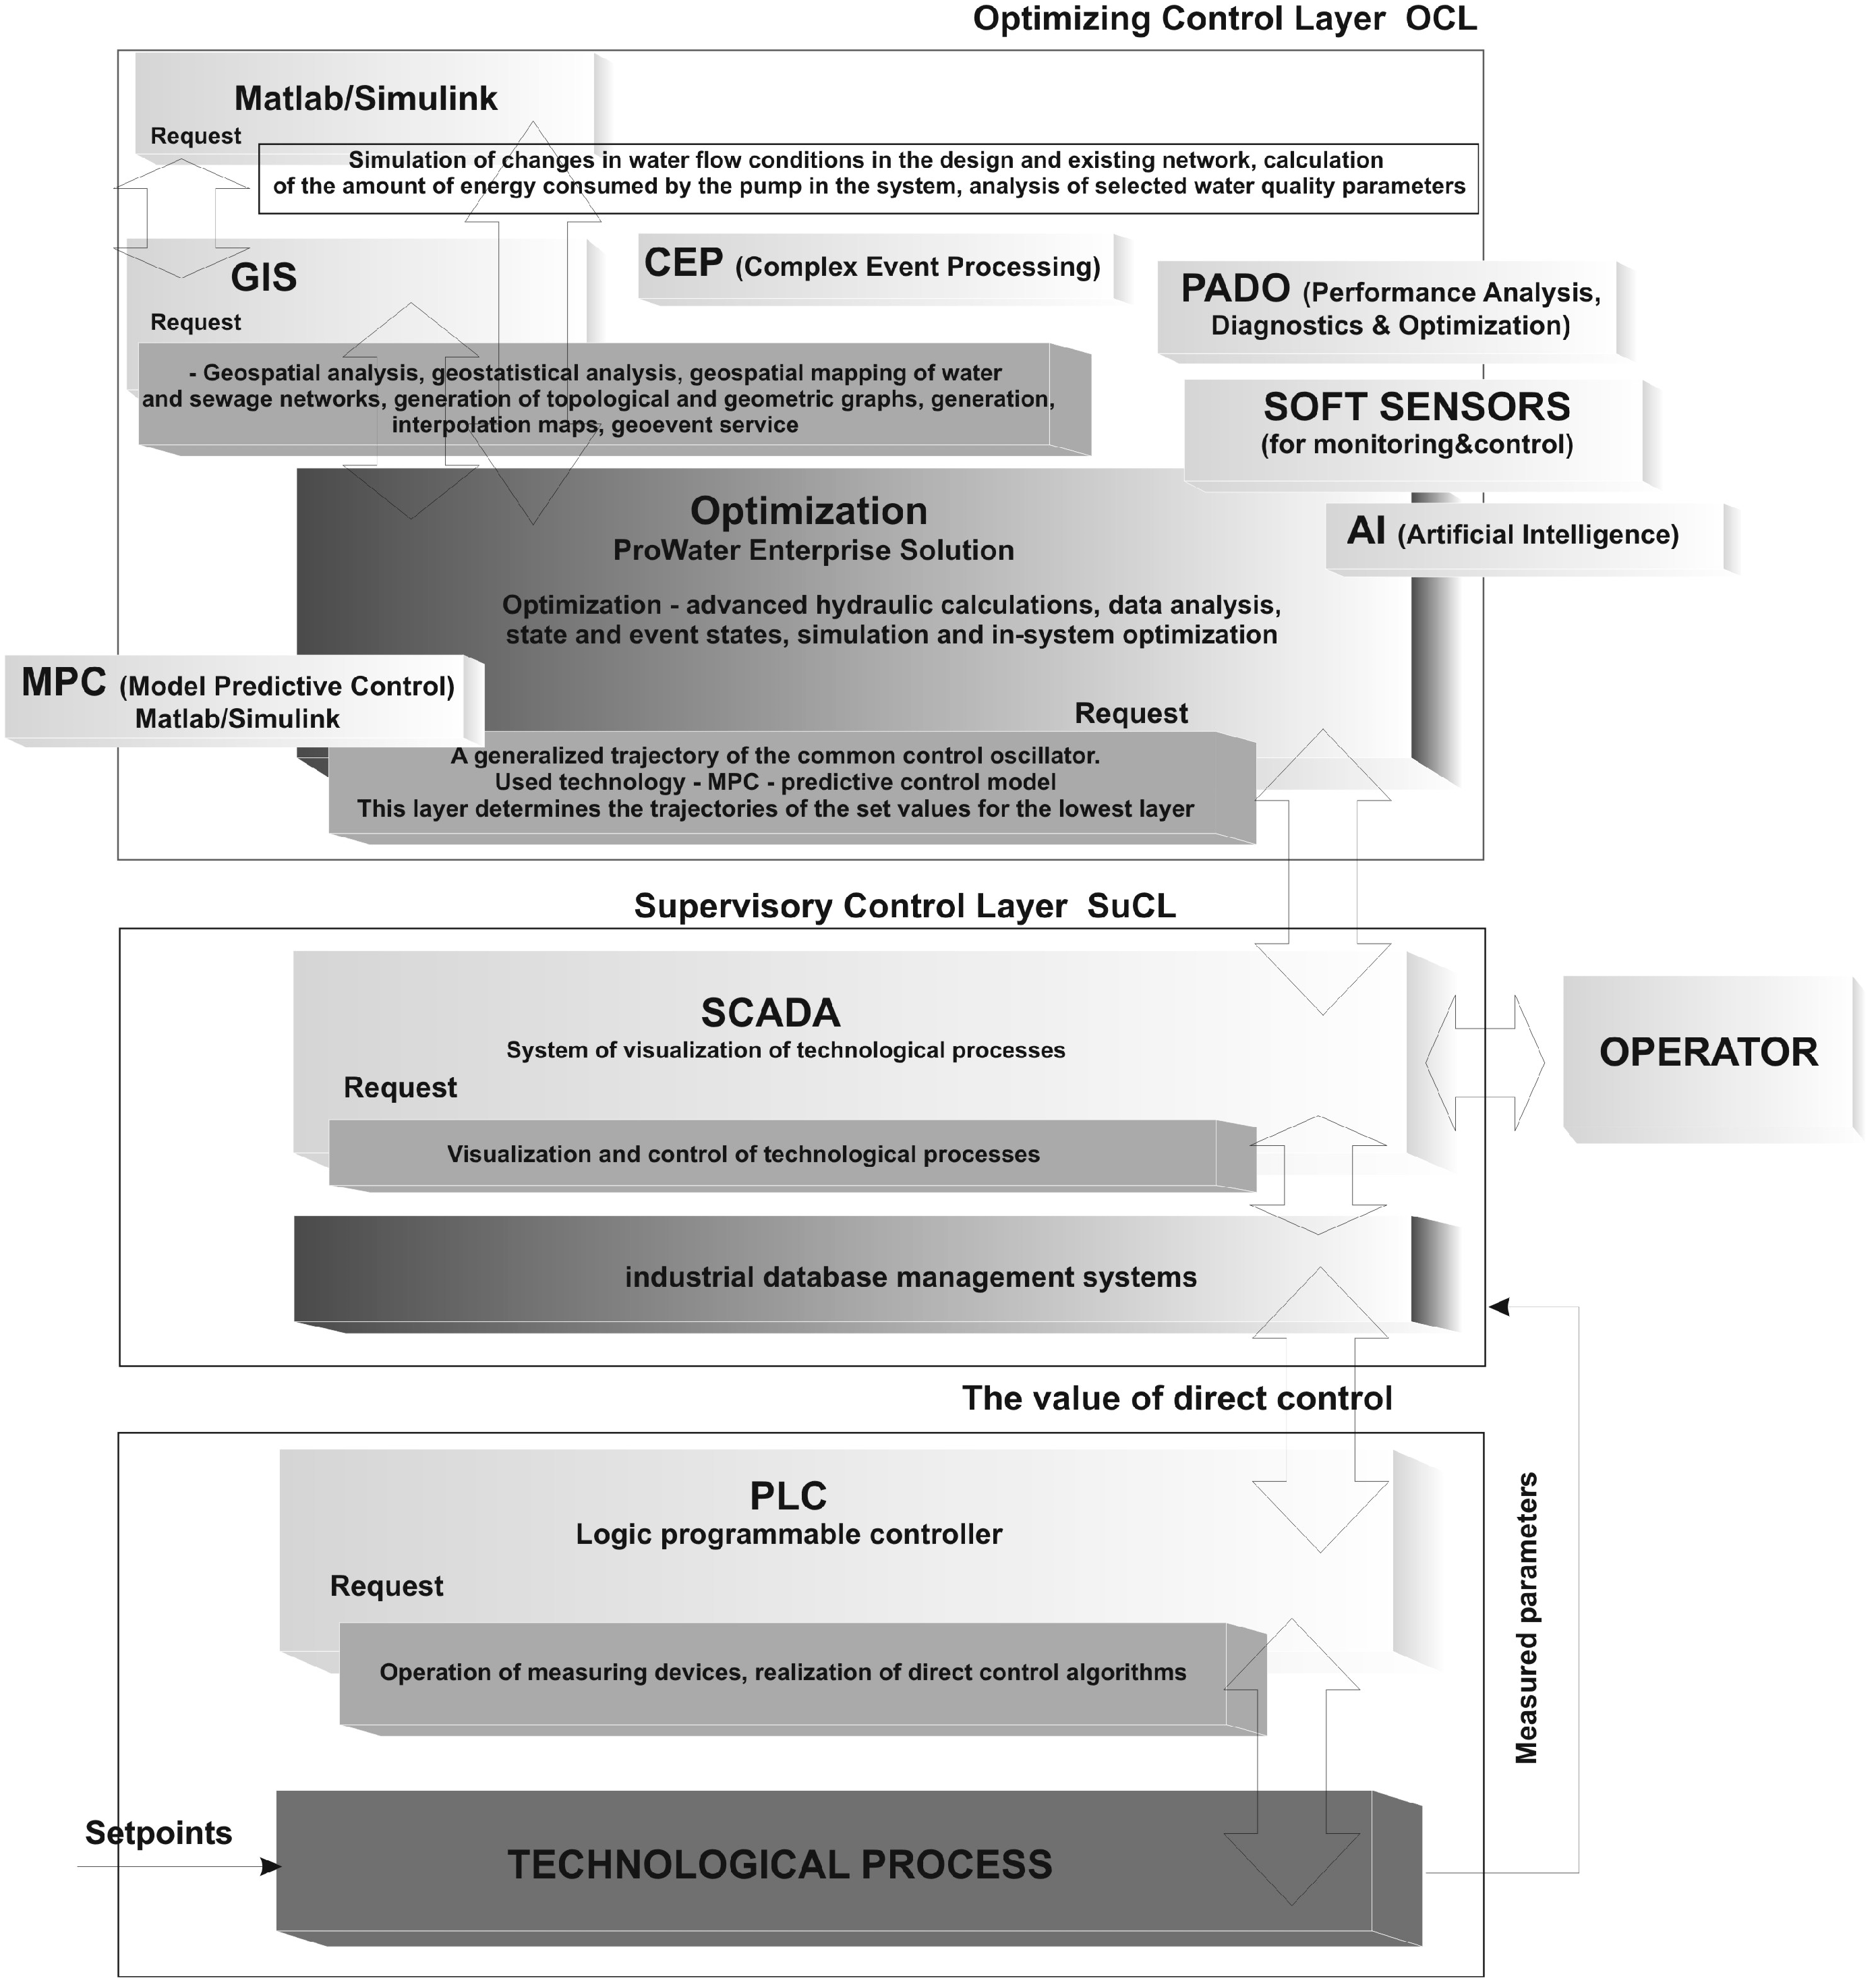
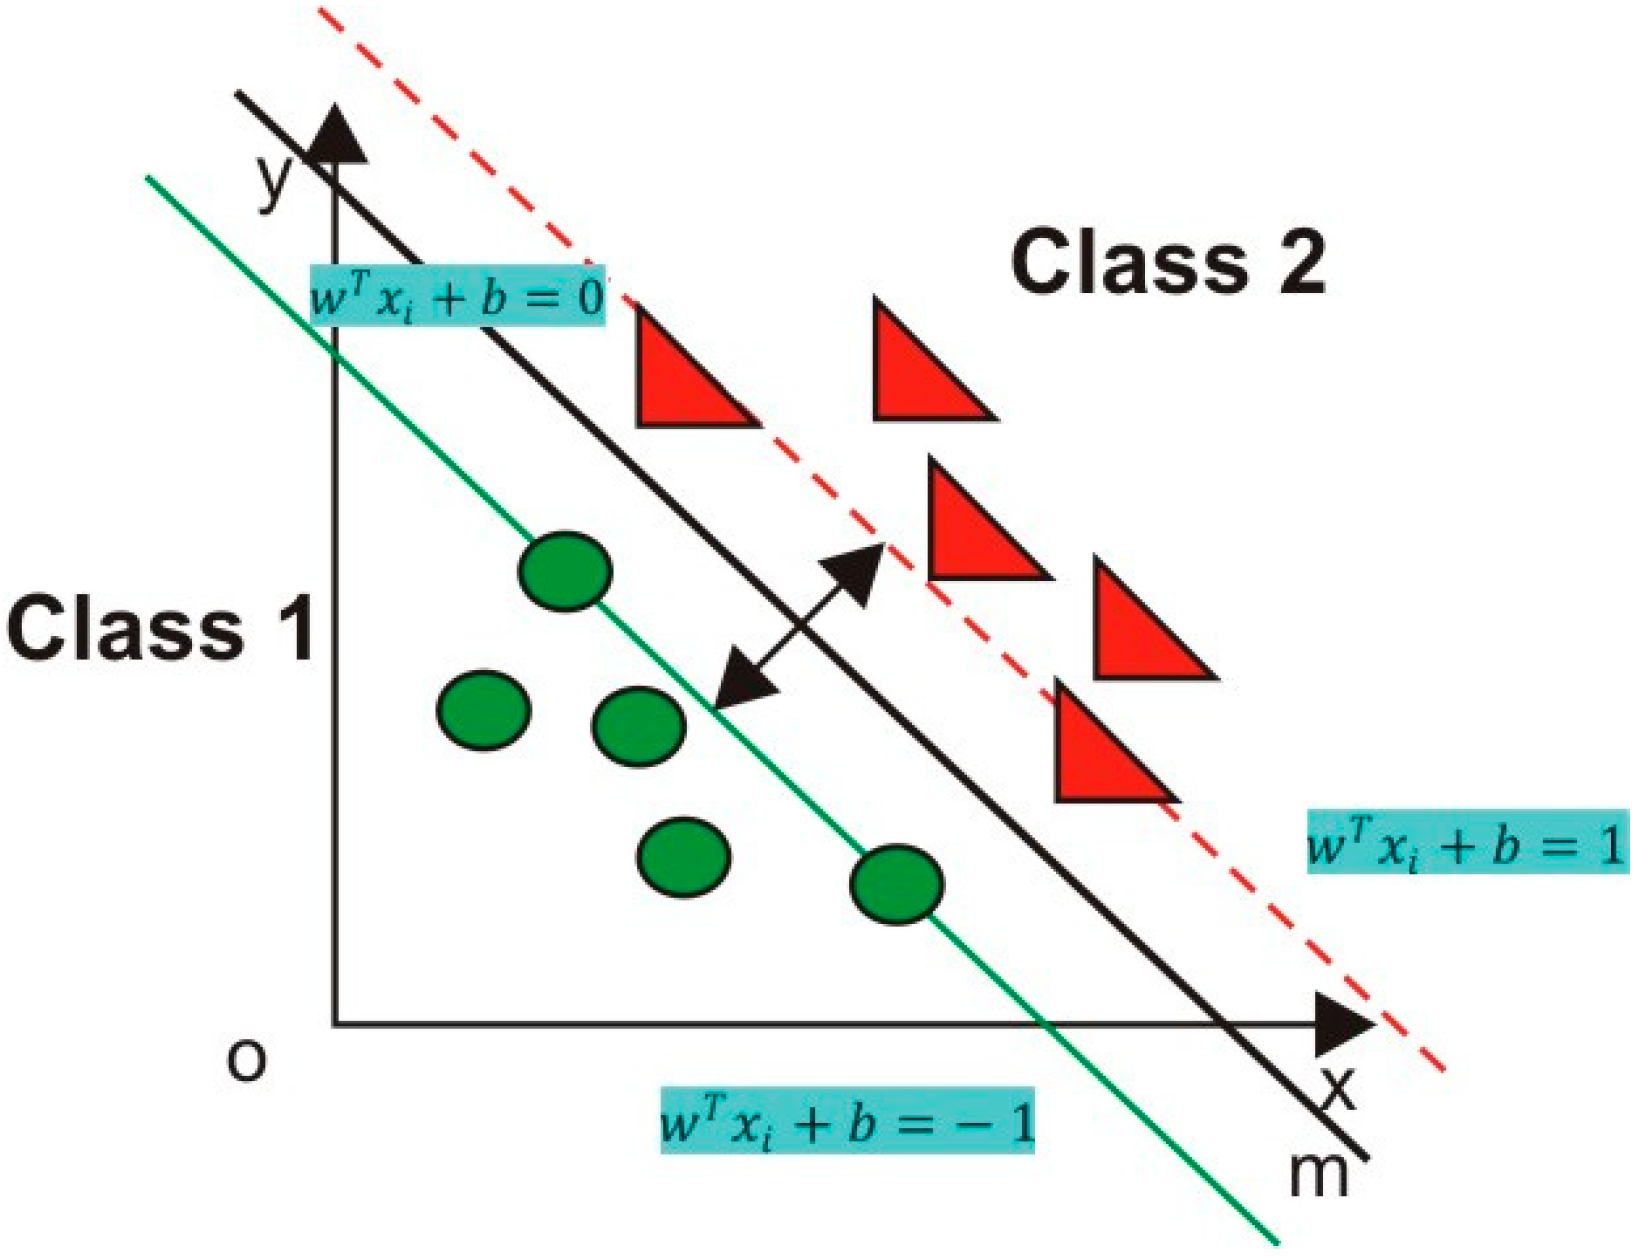
  • optimization of the light fraction production process-consisting in separating (in the optical separator/s) from the heavy oversize fraction of waste stream- non-metallic components with high calorific value Wd, exceeding 38 MJ/kg in the case of PE using the advanced MPC predictive control algorithm (based on a Multi Class Vector Support Machine algorithm model) implemented in the optimizing control layer of the SCADA system,
  • optimization of the production process of hybrid fuel components-consisting in mixing the light fraction (obtained as a result of the optimization of the optical separation process-thread A) with fossil fuels, while fulfilling the objective function, i.e., its maximizing max u S W d T u while meeting the constraints imposed on decision variables of the optimization task, determined by the parameters of the realized technological processes. The optimization of the process is carried out by the modified simplex algorithm.
The selection of technological processes and their mechanical parameters as well as the interrelationship between the processes is defined on the basis of knowledge in the field of morphological composition, the frequency and amount of supplied waste, as well as on the concept involving further handling of the recovered fractions. Quite significant are such physical properties as humidity (fully mechanical sorting plant is preferred for dry waste) and density of waste. Depending on these parameters, the technological process will take different forms. These installations can differ not only in terms of the devices used in them, but also in terms of their number and order of location in the technological line. Only the proper selection of individual elements of the segregation line guarantees the acquisition of the assumed fraction recovery rates from the mixed municipal waste. In this aspect, the knowledge of the processes used to extract individual fractions from waste seems to be of key importance in the design and operation of a waste segregation line.
All components of the system are connected by a control system based on a complex algorithm. In the context of ensuring the correct course of the technological process, we must consider the Molded Fuels Production Plant as a complex, non-linear, multidimensional control object.
A complex, multi-threaded control algorithm of the process, built into the PLC logic controller, freely programmable (supervised by SCADA) performs the task of solving the optimization problem defined as a neural classifier model (network Support Vector Machine—SVM) of non-metallic fraction components (mainly ballistic and optical separation) where it reproduces the patterns of predefined classes-subsets generated by the greedy approximation algorithm (greedy set cover) containing components-fractions, described by a set of features (including physicochemical properties, fuel properties, emission properties, texture, structure, spectroscopic spectra).
Each subset-representing a pattern of a class of fractions-components-making the molded fuel is the effect of optimization, using the greedy approximation algorithm (greedy set cover), maximizing the objective function (calorific value Wd), meeting at the same time the process and technological constraints imposed on the decision variables of the linear programming tasks (humidity, chlorine share, heavy metals). The patterns of classes are described by a set of features (texture, structure, spectroscopic spectrum), which allows the algorithm at a lower level of the control of the sorting process to carry out classification using the network model SVM (MC SVM) on the basis of a set of features assigned to predefined patterns of classes, represented by disjoint subsets of the cover generated by the master algorithm, Greedy Set Cover, and finally to check if the identified component/fraction belongs to the pattern of class by the incident matrix.

3.1.1.1. Algorithmic Subsystem Model for the Optimization of the Light-Caloric Fraction Production Process—Thread A

The optimization of the production process of light fraction (so-called caloric)—consists in the separation (in the optical separator/s) the waste stream components with high calorific value Wd, exceeding 38 MJ/kg in the case of PE (mainly plastics PE, PET, PP) using the advanced MPC predictive control algorithm (based on the modified multi class vector support machine—MC SVM algorithm model) implemented in the optimizing control layer of the SCADA control system.
The control algorithm of the technological process (Figure 4), built into the PLC logic controller, freely programmable (supervised by the SCADA system) performs the task of solving the optimization problem defined in the form of a neural classifier model (network Support Vector Machine—SVM) of non-metallic fraction components (mainly ballistic and optical separation) where it reproduces the patterns of predefined classes—subsets generated by the greedy approximation algorithm (greedy set cover) containing components-fractions, described by a set of features (including physicochemical properties, fuel properties, emission properties, texture, structure, spectroscopic spectra).
Each subset-representing a pattern of class of fraction-components-forming the molded fuel is the effect of optimization using the greedy approximation algorithm (greedy set cover), maximizing the objective function (calorific value Wd), meeting at the same time the process and technological constraints imposed on the decision variables of the linear programming tasks. The class patterns are described by a set of features (texture, structure, spectroscopic spectrum), which allows the algorithm at a lower level of the control of the sorting process to carry out classification using the network model SVM (MC SVM) on the basis of a set of features assigned to predefined class patterns, represented by disjoint subsets of the cover, generated by the master algorithm, Greedy Set Cover, and finally to check if the identified component/fraction belongs to the class pattern by the incident matrix.
Pneumatic segregation is based on the use of the correlation of the compressed air stream and the density of the segregated wastes, ensuring that at least two fractions differing in density parameter are selected. An undisputed advantage of this process is the ability to define a segregating parameter, which is the resultant of the gravity and momentum of the segregated particles, thanks to which the pneumatic segregation is a very flexible process that can comprise the applicability of many waste fractions belonging to the raw or partially selected municipal waste stream. The ballistic separation has a similar nature, except that the driving force is provided by the impeller that mechanically ejects the waste into the sorting chamber. The process of aerodynamic separation is carried out in aerodynamic separators, and the process of ballistic separation in ballistic separators. They allow the separation of wastes into two main fractions: light and heavy. The light fraction obtained from aerodynamic segregation may include, for example, paper, foil, plastics, fabrics, and then by passing it to the ballistic separator, it is easy to extract geometrically unstable fractions such as foil, paper, fabrics. The heavy fraction remaining from the processes of aerodynamic and ballistic segregation can be passed for further segregation or classed as ballast and taken to landfills.
Optical separation should be considered noteworthy when separating especially the non-metallic fraction. The development of optoelectronics and computer control systems has contributed in recent years to a significant refinement of this process and to the development of optical separators with the constantly increasing separation efficiency of waste fractions, which in consequence led to the change in economic indicators for the processing of wastes using optical separation methods. An optical separator of any fraction extracted from the stream of mixed municipal waste consists of a scanner (detector) with a system of lamps and a compressed air installation equipped with adjustable impulse nozzle bars, powered by a compressor. It is possible to use a collective power supply system for all devices installed in the technological line fed by compressed air and to recover the waste air stream.
In the optical separation the role of scanners is most frequently taken by detectors:
  • NIR (near infrared)
  • VIS (visible light)
  • X-ray (high resolution x-ray)
  • AAS (atomic spectrometry).
The distribution of mixed wastes is controlled by a conveyor belt with an advanced feed speed control system. All components of the system are connected by a control system based on a complex algorithm, defined for a specific waste fraction. It should be noted that the change of the algorithm in the situation when the process does not require the replacement of hardware can take place online. For the installations with high throughput, in the event of an unstable morphological composition of wastes, it is economically justified to use even many scanners that classify different optical parameters of the sorted waste. The segregation process itself takes place in the separator chamber, which, like for other belt devices used in the sorting plant, must guarantee the minimization of thickness and uniformity of concentration of the waste layer along the entire working width of the belt, in order to eliminate the overlap of individual waste. The working width is determined by the size of the measuring area generated by a scanner or many scanners, and by the width of the impulse nozzle bar. The transported waste stream is passed to the measuring area of the scanner located above the conveyor belt. The scanner identifies properties of the material such as texture, shape, structure, color, density and spectroscopic spectrum required for it to be recognized. The materials with predefined properties are pneumatically separated at the end of the conveyor belt by an impulse nozzle system. Advanced optical separators based on AAS technology are used in the installations for the production of molded fuels because they allow for the separation of e.g., only plastics desired in fuel (PE, PP, PET), and the ballast e.g., PVC containing chlorine, undesirable in combustion processes is passed to landfills.
The output signals of the preprocessor in the form of successive components of Fourier descriptors, after the transformation ensuring the invariance in terms of scaling, rotation and displacement, are becoming input signals for a multilayer neural network that functions as a pattern recognition system, and at the same time performs classification, i.e., assigns the pattern to the appropriate class. The number of input neurons is equal to the number of Fourier descriptors taken into account in the classification. Given that each output neuron represents one class, their number is also constant and equal to the number of classes. The classifier is trained on a set of learning data representing subsequent classes of patterns to be recognized (or detection based on spectroscopic spectra, texture, outline, structure). In the reproduction mode, the classified pattern, after passing through all the phases of the preprocessor, is fed to the network input, stimulating the output neuron that corresponds with a given class. At the recognition stage of patterns, due to noise pollution, the output signals of network neurons can assume continuous values in the range [0,1], instead of the expected binary values, with one corresponding to the recognized class. In the classification problem, we used the MC SVM (Multi Class Vector Support Machine) classifier based on a unidirectional neural network implementing various types of activation functions, including, polynomial, radial and sigmoid functions. The task of the classification is to maximize the margin of separation between two different classes described by the set of pairs (xi, di), where xi is the input vector and di is preset value (for two classes it reaches 1 for class 1 or −1 for class 2). Assuming a linear separability of both classes, the equation of hyperplane separating both classes can be written in the following form [19]
g ( x ) = w T x + b = 0
where w = [ w 1 , w 2 , , w N ] T , x = [ x 1 , x 2 , , x N ] T .
In this equation, assuming N inputs, the weight vector w is N-dimensional. The weight b is the polarization. The decision equations that determine class membership take the following form:
w T x i + b > 0   d i = 1
w T x i + b < 0   d i = 1
or after transformations:
w T x i + b 1   d i = 1
If a pair of points (xi, di) satisfies the above equation with an equal sign, then the vector xi = xsv forms the so-called support vector. Supporting vectors are those data points that are closest to the optimal hyperplane.
The problem of training of SVM linear networks, i.e., the selection of synaptic connection weights for linearly separable training data, narrows down to maximizing the separation margin (Figure 5). It is a problem of quadrant programming with linear weight constraints, which is solved by the method of Lagrange multipliers by minimizing the so-called Lagrange function.
Taking into consideration the fact that the task of training narrows down to maximizing Lagrange function relative to Lagrange multipliers, the primal problem transforms into a dual one, which is formulated as follows [19]:
m a x { i = 1 p α i 1 2 i = 1 p j = 1 p α i α j d i d j x i T x j }
with constraints:
α i 0
i = 1 p α i d i 0
By solving the above optimization problem involving Lagrange multipliers we can determine the equation of optimal hyperplane, determined by the weight vector x and the parameter of polarization b.
When solving the problem of classifying non-linearly separable patterns, the problem is narrowed down to determining the optimal hyperplane that minimizes the likelihood of classification error on the training set with the widest possible separation margin.
As in the case of linearly separable patterns, the primal problem is reduced to a dual problem, which is formulated as follows:
m a x { i = 1 p α i 1 2 i = 1 p j = 1 p α i α j d i d j x i T x j }
with constraints:
0 α i C
i = 1 p α i d i = 0
For i = 1, 2, …, p and for the constant value C adopted by the user. Thus, from the solution of the dual problem we obtain the expression on the vector of weights of the optimal hyperplane in the form:
w 0 i = 1 N s v α i d i x i
The summation applies only to training components for which Lagrange multipliers are different from zero. They are the so-called support vectors, whose number is Nsv.
The optimal hyperplane equation depends only on the support vectors. Other vectors from the training data set do not affect the solution result.
The equation for the output signal y(x) of the SVM linear network is expressed by the following relationship:
w 0 i = 1 N s v α i d i x i
It is a linear equation relative to the input variables described by the vector x and weight dependent on non-zero Lagrange multipliers and corresponding to them Nsv support vectors xi and the setpoints di.
Linear non-separability of patterns does not mean a lack of their separability at all.
Generally, if x is an input vector describing the pattern, then after projecting it into the K-dimensional space, it is represented by a set of features φj (x) for j = 1,2,..., K.
As a result of this transformation, the equation of the hyperplane in the linear space is defined by the formula:
g ( x ) = w T φ ( x ) + b = j = 1 N w j φ j ( x ) + b = 0
where wj denotes the weights from φj (x) to the output neuron. The vector W is K-dim and b is the weight of the polarization. The features of the process described by the functions φj (x) have taken over the role of the individual variables xj.
The value of the output signal is defined by the formula:
y ( x ) = w T φ ( x ) + b
The primal problem is solved by the transformation into a dual problem, identically as for networks with linear pattern separability by minimizing Lagrange functions:
J ( x ,   b ,   ϵ ,   α ,   μ ) = 1 2 w T w + C i = 1 p [ d i ( w T φ ( x i ) + b 1 + ϵ i ] α i = i = 1 p μ i ϵ i
The solution to this optimization problem assumes in the first stage that the partial derivatives of Lagrange’s functions should be compared to zero with respect to, w, b and ϵ.
The primal problem is transformed into a dual problem defined relative to Lagrange multipliers αi in the following form:
m a x { i = 1 p α i 1 2 i = 1 p j = 1 p α i α j d i d j K ( x i T x j ) }
with constraints:
0 α i C
i = 1 p α i d i = 0
The function K (xixj) present in the formulated dual task is a scalar product of the vector function F φ ( x ) = [ φ 1 ( x ) , φ 2 ( x ) , ,   φ K ( x ) ] T :
K ( x i T x j ) = φ T ( x i ) φ ( x j )
This product defines the so-called kernel function.
Ultimately, we obtain the expression defining the SVM nonlinear output signal:
y ( x ) = w T φ ( x ) + b = i = 1 N s v α i d i K ( x , x i ) + b
which depends on the kernel function K (x, xi) and not on the activation function φ (x).
Due to the classification problem necessitating the split of data into a larger number of classes, multiple classifications are required using the method “one against all” and “one against one”. In the “one against all” method with M classes, we define M SVM networks that recognize exactly one class. The method requires the training of M SVM networks, each of which is trained on a different data set.
After training all M networks, there is a reconstruction step in which the same vector x is fed to each SVM network, and the output signals (M decision functions) of all trained SVM networks are determined.
The SVM network was selected for the task of classifying patterns due to generalization capabilities. The SVM network is only slightly sensitive to the selected training hyperparameters determining the number of neurons in the hidden layer.
The algorithm for classifying waste fractions in the optical separator, based on the classic version of SVM network, allows to separate fractions-components on the basis of the predefined class patterns described by the vector of parameters characterizing spectral bands (spectroscopic spectra) of textures, structure, shape.
Due to the need to increase the quality indicator of the control of a technological process realized in the optical separator, in terms of the acquisition of products with precisely defined physicochemical, combustion and emission properties, the SVM algorithm was modified by expanding the library of base class patterns (defined on the basis of spectroscopic spectra, textures and geometric features) with a library of predefined class patterns described by physicochemical and combustion properties (calorific value, humidity, volatile content).
The master algorithm, i.e., the greedy approximation algorithm that solves the problem of set cover, is responsible for generating class patterns corresponding to the optimized, disjoint subsets of the set, whose elements are the components of the waste fraction directed to the optical separator(s).
The class patterns are described by a set of features (texture, structure, spectroscopic spectrum), which allows the algorithm at the lower level of the control of the sorting process to carry out a classification using the SVM network model (MC SVM) on the basis of the set of features assigned to the predefined class patterns, represented by disjoint subsets of the cover generated by the master algorithm Greedy Set Cover.
The modification of the algorithm involving the solution of the optimization problem consists in implementing a method that allows to check whether the identified component (based on the analysis of images) belongs to the class pattern defined on the basis of fuel-related and physicochemical properties and in meeting the criterion of the formulated objective function [20], i.e.,
max u S W d T u S = { u R n : A u b max , A u b min , u 0 }
where: W d T is the vector of the dimension | j | (the number of fraction components participating in the molding process of a fuel component) with the components ( w j ) denoting the calorific values of the molded fuel components. Therefore, the optimization process is narrowed down to a linear programming task (linear objective function and linear constraints) with the constraints imposed on decision variables, determined by the vector U , with the components ( u j ) that in this way determine a set of permissible solutions.
U = ( u j ) = [ u 1 , u 2 , , u j ] T of the dimension | j | such that: ( u j ) —denotes the share of the j-th fuel of the fraction.
The objective function given in the general form (1) can be written as follows:
W d ( u ) = w d 1 u 1 + w d 2 u 2 + + w d j u j = j = 1 n w d j u j max
while the system of limit equations in the form:
U min U U max
B min A U B max
B min = ( b k min ) = [ b 1 min , b 2 min , , b k min ] T
is a one-dimensional matrix (vector of the left sides of the limit equations) of the dimension | k | such that the components denote the minimum contents of harmful substances (chlorine, sulfur, PCB, metal, mercury, cadmium) and:
B max = ( b k max ) = [ b 1 max , b 2 max , b k max ] T ,
denotes a one-dimensional matrix (vector of the right sides of the limiting equations) of the dimension | k | such that the components denote the maximum contents of harmful substances. The meaning of particular components of the vector is analogous to B min = ( b k min ) .
The method solving the optimization problem of the coverage of Greedy Set Cover.
The parameter of the method is the pair ( X , F ) consisting of a finite set X (the set of waste fraction components) and family F of subsets X (corresponding to the predefined class patterns defined on the basis of fuel-related and physicochemical properties and meeting the criterion of the formulated objective function, i.e., max u S W d T u , such that the elements of the set X belongs to at least one subset of the family F: X = S F S In this case, the subset S F covers its elements. The solution of the method is the subfamily ξ F whose elements cover the entire set X: X = S ξ S .
GreedySetCover(X, F ) [19]
1
U X
2
ξ
3
while U
4
to select S F , which is maximizing | S U |
5
U U S
6
ξ ξ { S }
7
return
The presented listing is the implementation (in pseudo-code) of the GREEDY-SET-COVER algorithm, the operation of which is as follows. In each phase, U is the set of elements not yet covered. The set ξ contains the constructed cover. Line 4 is the step in which the greedy decision is made, i.e., the subset S is selected, covering as many as possible of the uncovered elements (components of the fraction). After the selection of S, its elements are removed from U, and S is added to ξ . When the algorithm stops work, the set ξ is the subfamily F, covering X.
The mathematical model for the optimization of the production process of light (the so-called caloric) fraction-consisting in the separation (in the optical separator/s) of non-metallic components with high calorific value Wd from the oversize heavy fraction of waste stream, is represented by the matrix (column vector).
Z = (zj) of the components with stored indices of class patterns corresponding to the generated by the optimization algorithm Greedy Set Cover, subsets of the coverage of the set P k = ( p i j ) of the components pij containing the i-th component contained in the waste stream directed to the optical separator, in the j-th class pattern.
The number of the predefined class patterns is determined by the number of optimal subsets P k satisfying the criterion below, found by the Greedy Set Cover algorithms, i.e., greedy approximation algorithm of set coverage:
max u S W d T u S = { u R n : A u b max , A u b min , u 0 }
The master algorithm relative to SVM checks in each iteration whether the identified (based on the analysis of spectroscopic spectra) component/fraction belongs to the pattern of the class defined on the basis of fuel-related and physicochemical properties and meets the criterion of the formulated objective function.
To sum up, the algorithm implemented in the control optimizing layer of the SCADA supervisory system must reproduce the patterns of the predefined class patterns-subsets generated by greedy set cover containing components-fractions described by a set of features, including physicochemical properties, fuel-related properties, Wd, texture, spectroscopic spectra, structure.
Thus, each subset-representing the class of fractions-components-forming the molded fuel is the effect of the optimization with the use of greedy set cover algorithm in line with the criteria on Wd and with the constraints on the decision variables of the optimization task.
In order to resolve the problem of making sequences of control decisions (generating optimal control decision trajectories for the actuators of optical separators), a polymorphic component model of the class representing the MC SVD algorithm was developed, taking into account changes in its definition, with logical representation of knowledge about the object for which the training process consists in successive validation and updating of knowledge and the use of the results of this update for the validation and reconstruction of data structures.
The Multi-Class-Support-Vector-Machine class type contains field definitions with logical representation of knowledge about the control of a technological process and methods which implement the algorithms that realize the task of specializing and adapting the class component in response to the changes in the operating status of devices, process parameters and technological parameters. The specialization follows the training process in the space of states and events through validation, reconstruction of data structures of the object and reconfiguration of the control algorithm.
The component-oriented model of the sorting process of the heavy oversize fraction in the optical separator is a computer implementation of mathematical models (data sets and algebraic expressions) describing individual components (objects, processes, relations). The essence of the model definition involves the use of special class types, whose design allows mapping the specific properties of object components and operations performed on data structures in the form of the so-called fields and methods. Object fields have another important advantage, enabling (through appropriate assignments) to refer to the components which are created in other programs, e.g., Matlab, launched in different address spaces and which make available a number of component categories stored in executable libraries (DLL or EXE), which can be used to develop their own programs by directly using the predefined interfaces or by defining child objects. The purpose of these references is to use the properties and methods (of object components of the predefined libraries).
Definition of the “one against all” MCSVM algorithm.
Algorithm 1 MCSVM
1: Input: Category N, input D = { D 1 ,   D 2 , , D N } for training samples; testing sample T.
2: Output: Categories of T.
3: Algorithm:
4: // training section
5: for n = 1 to N
6: Positive Sample ← D N , Negative Sample ← other samples except D N
7: Store the data of S V M n classifier
8: end for
9: // testing section
10: for n = 1 to N
11: Use classifier S V M n to calculate the value of f ( x ) n
12: end for
13: Compare all f ( x ) n , output the n corresponding to the maximum of f ( x ) n

Algorithmic Model for the Optimization of the Production Process of Hybrid Fuel Components—Thread B

The task of optimizing the production process of hybrid fuels from the separated combustible fractions of municipal waste (RDF—light fractions obtained in the technological process described in Section 3.1.1.1) and fossil fuels (hard coal, lignite) consists in maximizing the objective function defined in the form of a general (standard) relation) [20]:
max u S W d T u S = { u R n : A u b max , A u b min , u 0 }
where: W d T is the vector of dimension | j | (the number of fraction components participating in the molding process fuel component) with the components ( w j ) denoting the calorific values of the molded fuel components. Therefore, the optimization process is narrowed down to a linear programming task (linear objective function and linear constraints) with the constraints imposed on decision variables, determined by the vector U , with the components ( u j ) that in this way determine a set of acceptable solutions. Since the solution of the linear programming task is only at the vertex of the set of acceptable solutions, the search method should review the vertices (in the space of acceptable solutions). However, this is not a comprehensive review but a greedy strategy which uses a modified algorithm of simplexes. The modification of a classic simplex algorithm consists in changing the limitation equations set by adding additional limitation equations which allow decision variables to be changed. A set of constraint equations expressed by the vector U | j | in defined ranges, determined by the equation:
U min U U max
Objective function given in general form Equation (1) may be expressed in the following manner:
W d ( u ) = w d 1 u 1 + w d 2 u 2 + + w d j u j = j = 1 n w d j u j max
while set of limiting equations may be expressed as:
b 1 min a 11 u 1 + a 12 u 2 + + a 1 j u j b 1 max
b 2 min a 21 u 1 + a 22 u 2 + + a 2 j u j b 2 max
b k min a k 1 u 1 + a k 2 u 2 + + a k j u j b k max
or in matrix notation:
B min A U B max
B min = ( b k min ) = [ b 1 min , b 2 min , , b k min ] T
denotes a one-dimensional matrix (the vector of the left sides of the constraint equations) of the dimension | k | such that the components denote minimum contents of harmful substances (chlorine, sulfur, PCB, metal, mercury, cadmium) and:
B max = ( b k max ) = [ b 1 max , b 2 max , b k max ] T ,
denotes a one-dimensional matrix (vector of the right sides of the limiting equations) of the dimension | k | such that the components denote the maximum contents of harmful substances. The meaning of particular components of the vector is analogous to B min = ( b k min ) .
The revised simplex algorithm finds the optimal solution by examining a sequence of points in the permissible area—in the area of n-dimensional space whose points satisfy the systems of inequalities A U B max and A U B min .
Substitution of auxiliary variables ε min and ε max gives:
b k max a k j u j = ε max   and   a k j u j b k min = ε min
In general, the solution of the algorithm is based on the observation that the solution that maximizes the objective function W d ( u ) is located at a certain extreme point or at the vertex of the permissible area. In the algorithm there is a sequential review of the vertices delimiting the permissible area until further correction of the value of objective function is no longer possible.
The solution of the linear programming problem involves the following options:
  • There is one constrained solution (the objective function takes the smallest value at one vertex of the set of permissible solutions).
  • There is an unrestricted solution (when the objective function can adopt any small value while not violating the constraints).
  • There are infinitely many solutions (there are at least two vertices of the set of permissible solutions at which the function assumes the same minimum value).
  • There is no solution, i.e., the set of permissible solutions is an empty set.
This problem can be resolved in polynomial or exponential time.
Optionally, additional constraints can be introduced (extending the basic model), which result from the permissible concentration values of the emitted substances in the combustion process of the obtained fuel components, which determine the process of their formation:
C f = ( c i f ) < C d o p
where C f denotes the matrix of process gas parameters (products of combustion process), of the dimension | i | such that:
( c i f ) —denotes the i-th parameter-molar share of the component i in the fumes (CO2, O2, SO2, HCl, N2, H2O).
C d o p = ( c i d o p ) —denotes as above, but for permissible values specified in standards.
Molar shares of process gas components are determined from the set of stoichiometric equations of the combustion process of fuels.
The scalability of the model allows to formulate further equations and inequalities limiting the scope of changes of decision variables of the optimization task taking into account the geometry of combustion chamber, type of grate, etc.

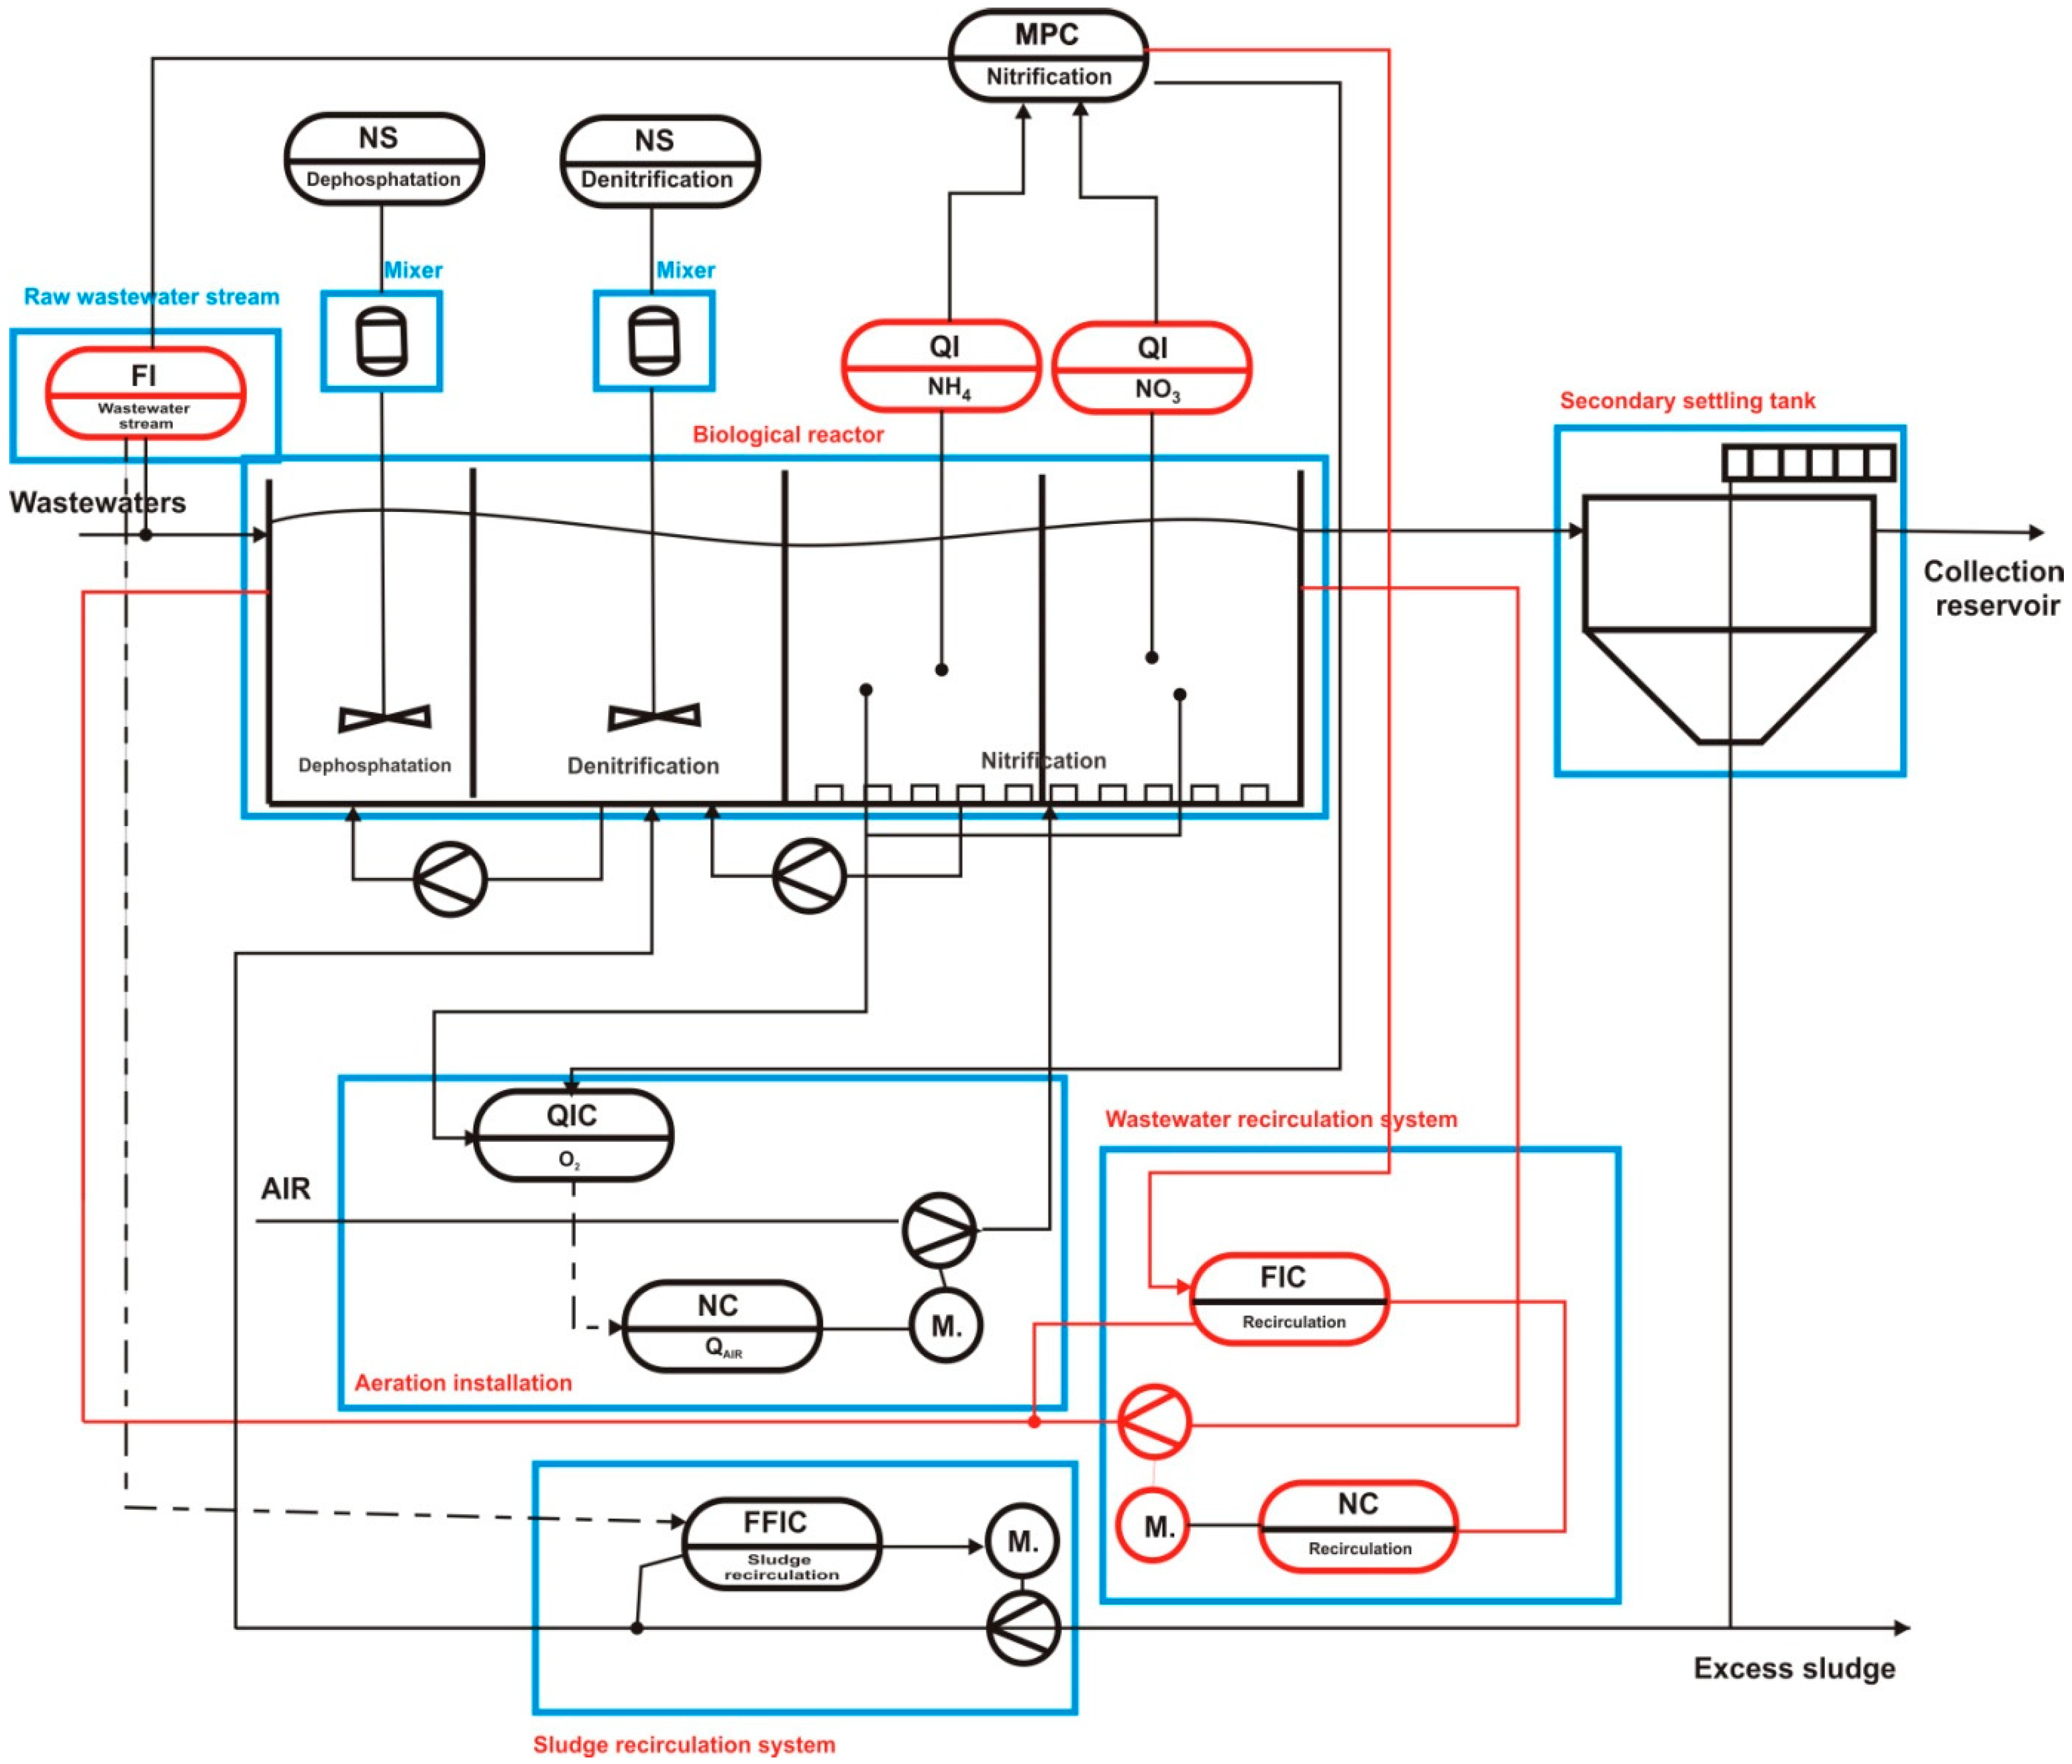
3.2. SMART Wastewater Treatment Plant Computational Solution

In this section was presented the algorithmic model for the optimization of the biological process of wastewater treatment using adaptive hierarchical control. The objective of the biological wastewater treatment process is to provide the bioreactor with the required amount of air (oxygen) determining the optimal development of bacteria that break down organic substances contained in the wastewater. In the solution of the aeration control system used so far, the concentration of dissolved oxygen was adopted as the reference value. In the proposed solution of the control system, we take into account the strongly non-linear characteristics of the bioreactor’s operation as a control object. The non-linear character of the object, variable operating conditions of the sewage treatment plant, the impact of disturbance, e.g., irregular supply of sewage to the bioreactor, the change of pollution load, temperature and content of mineral substances enforce the change of reference concentration of oxygen over time. The reference value of oxygen is determined by the master control. The reference value of oxygen concentration depends on the content of ammonium nitrogen and nitrate nitrogen. The dependence of the reference value on the content of ammonium nitrogen leads to the increased efficiency of wastewater treatment. In the presented approach, the control trajectory of oxygen concentration is tending to obtain the reference value. The use of advanced event prediction tools, detection systems of occurring damages in the measuring paths, paths of control and process visualization are aimed at the poly optimization of electricity consumption and the control of the biological process of municipal wastewater treatment [21,22,23]. In the work we used the non-linear activated sludge model ASM2d, taking into account 21 biochemical processes, calibrated based on the measurement results of process parameters and laboratory tests.
It was a scientific and technological challenge to be able to develop algorithms that control the operation of the bioreactor, allowing for the following in particular:
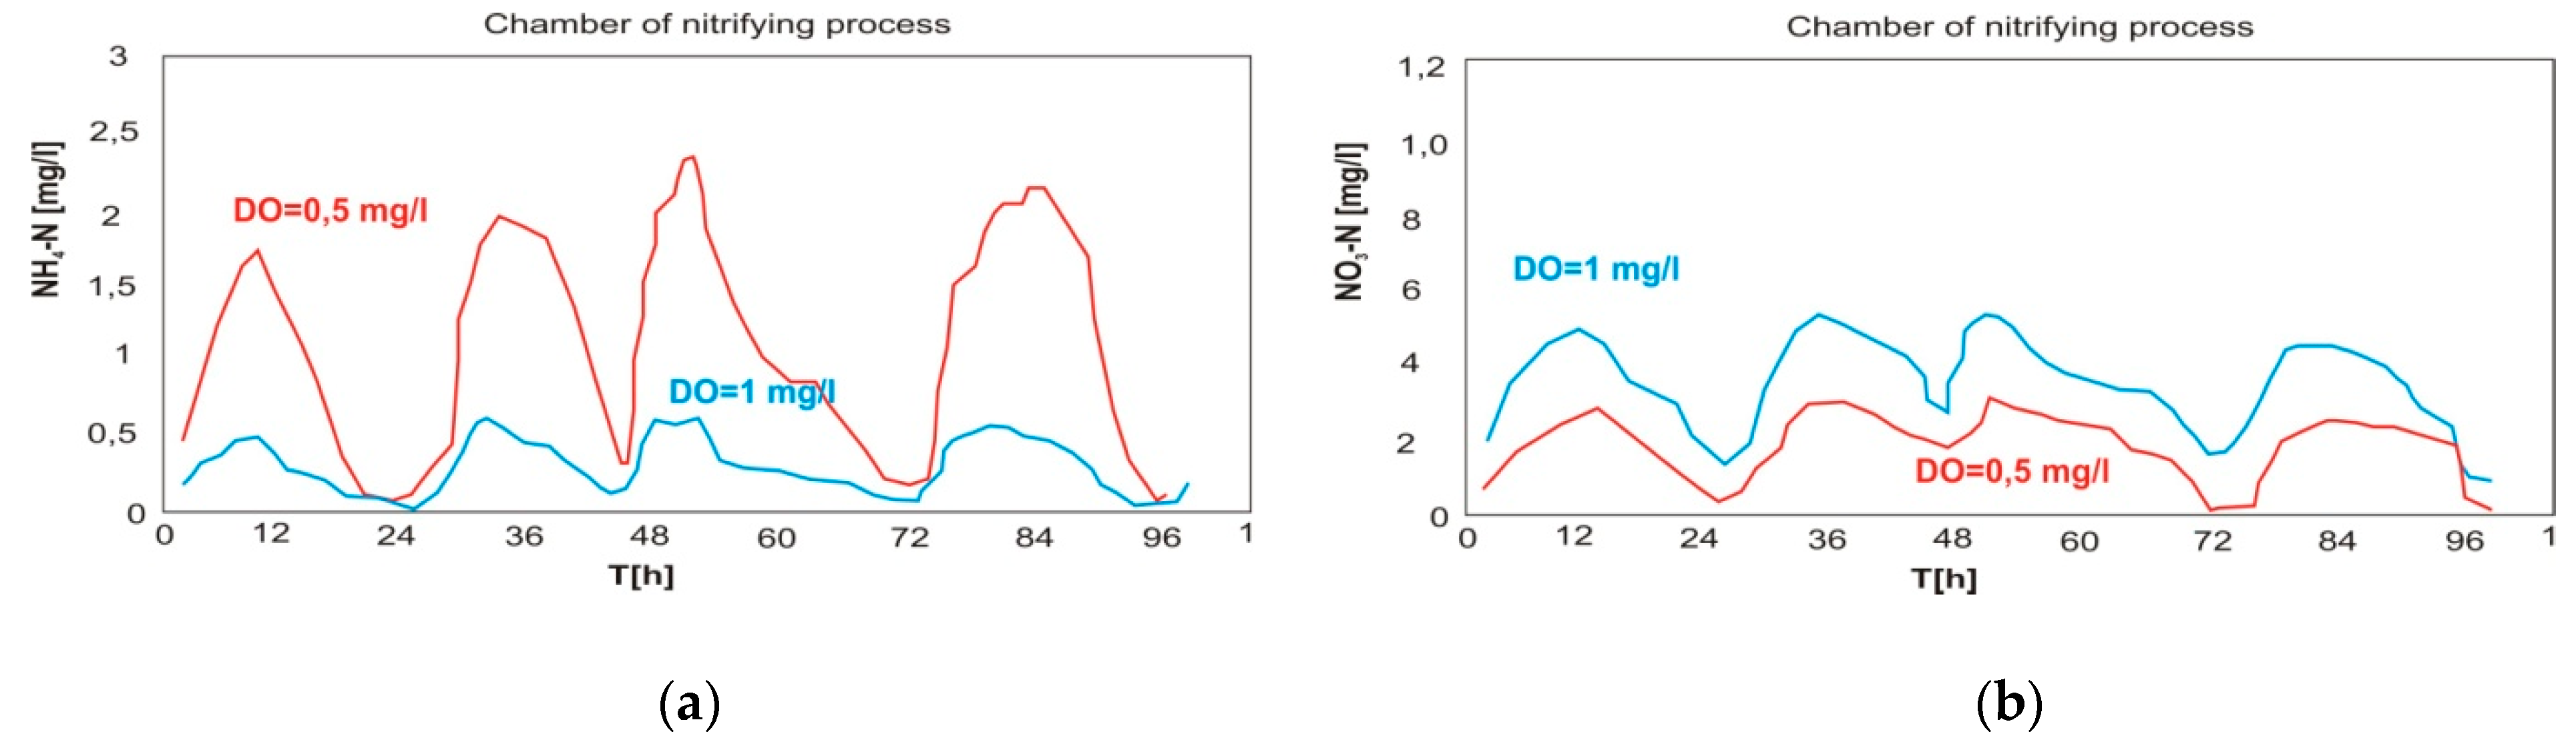
  • Automatic control of the nitrification and denitrification process, with simultaneous control of total nitrogen in the treated wastewater.
  • Elimination of situations related to the overload of activated sludge chambers at the time when the inflow of the load of ammonium nitrogen in raw sewage was lower, and related to it disturbance of the denitrification process.
  • Optimization of the internal and external recirculation processes of the bioreactor.
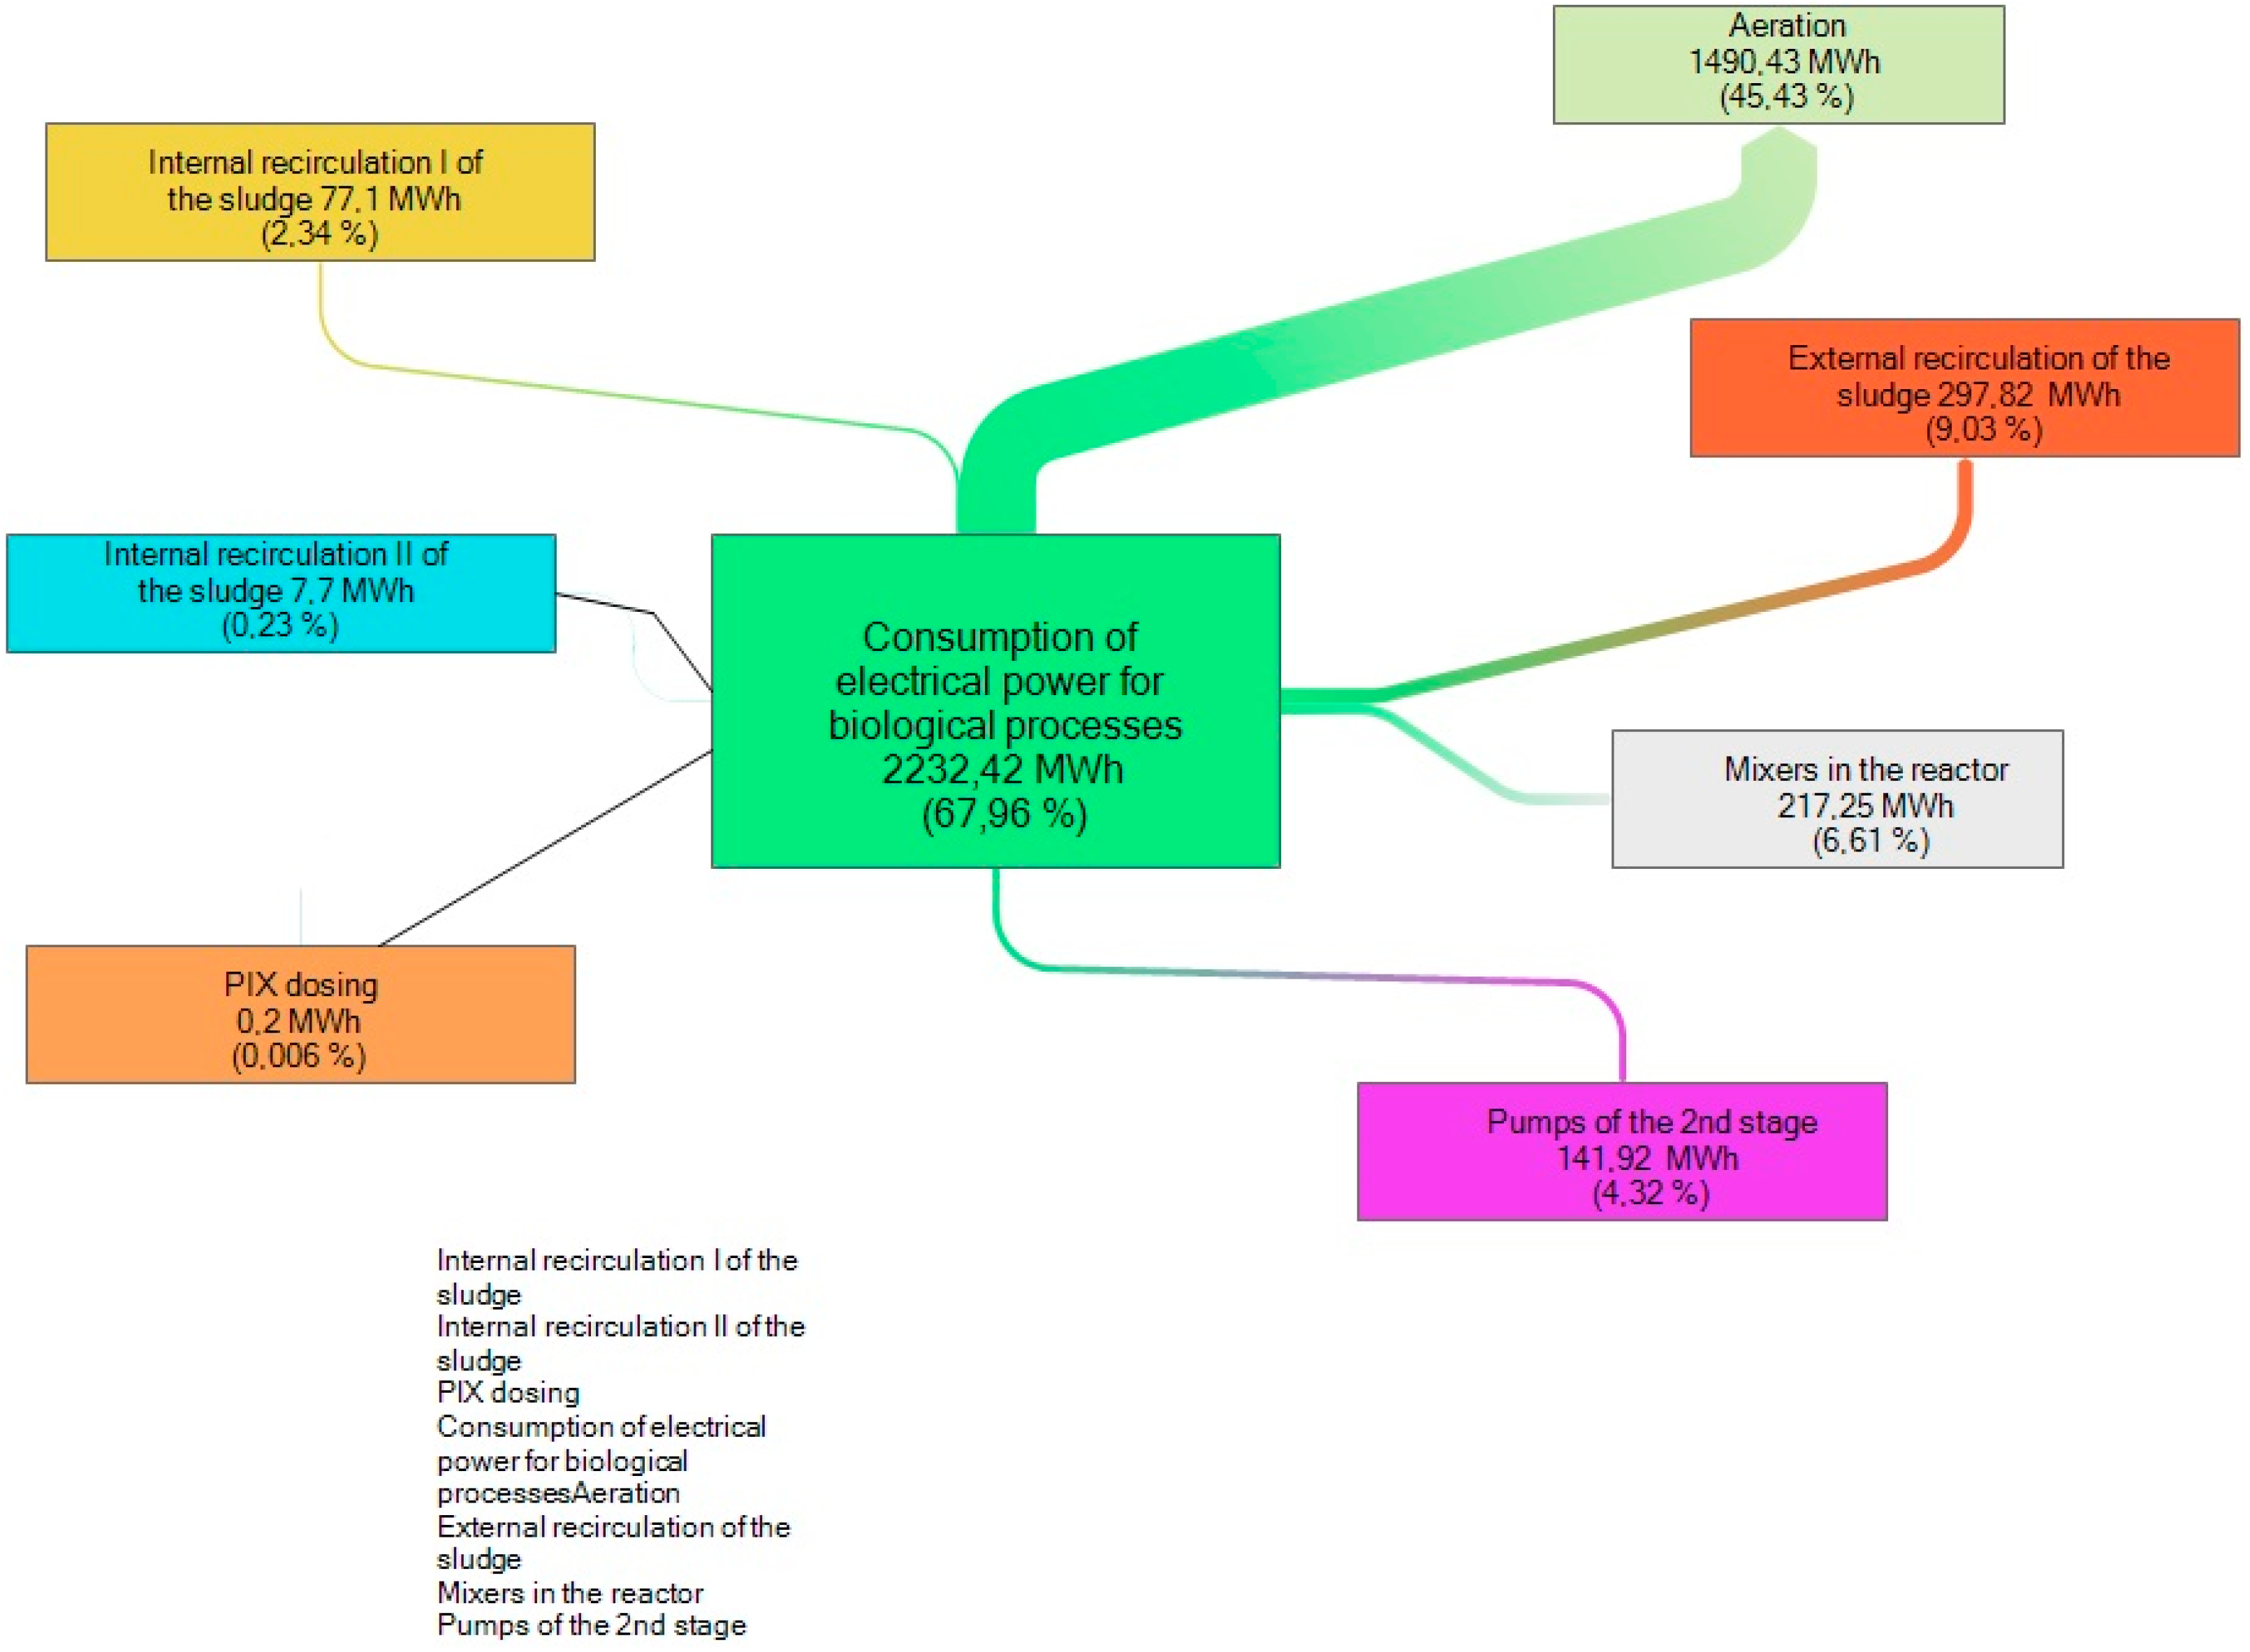
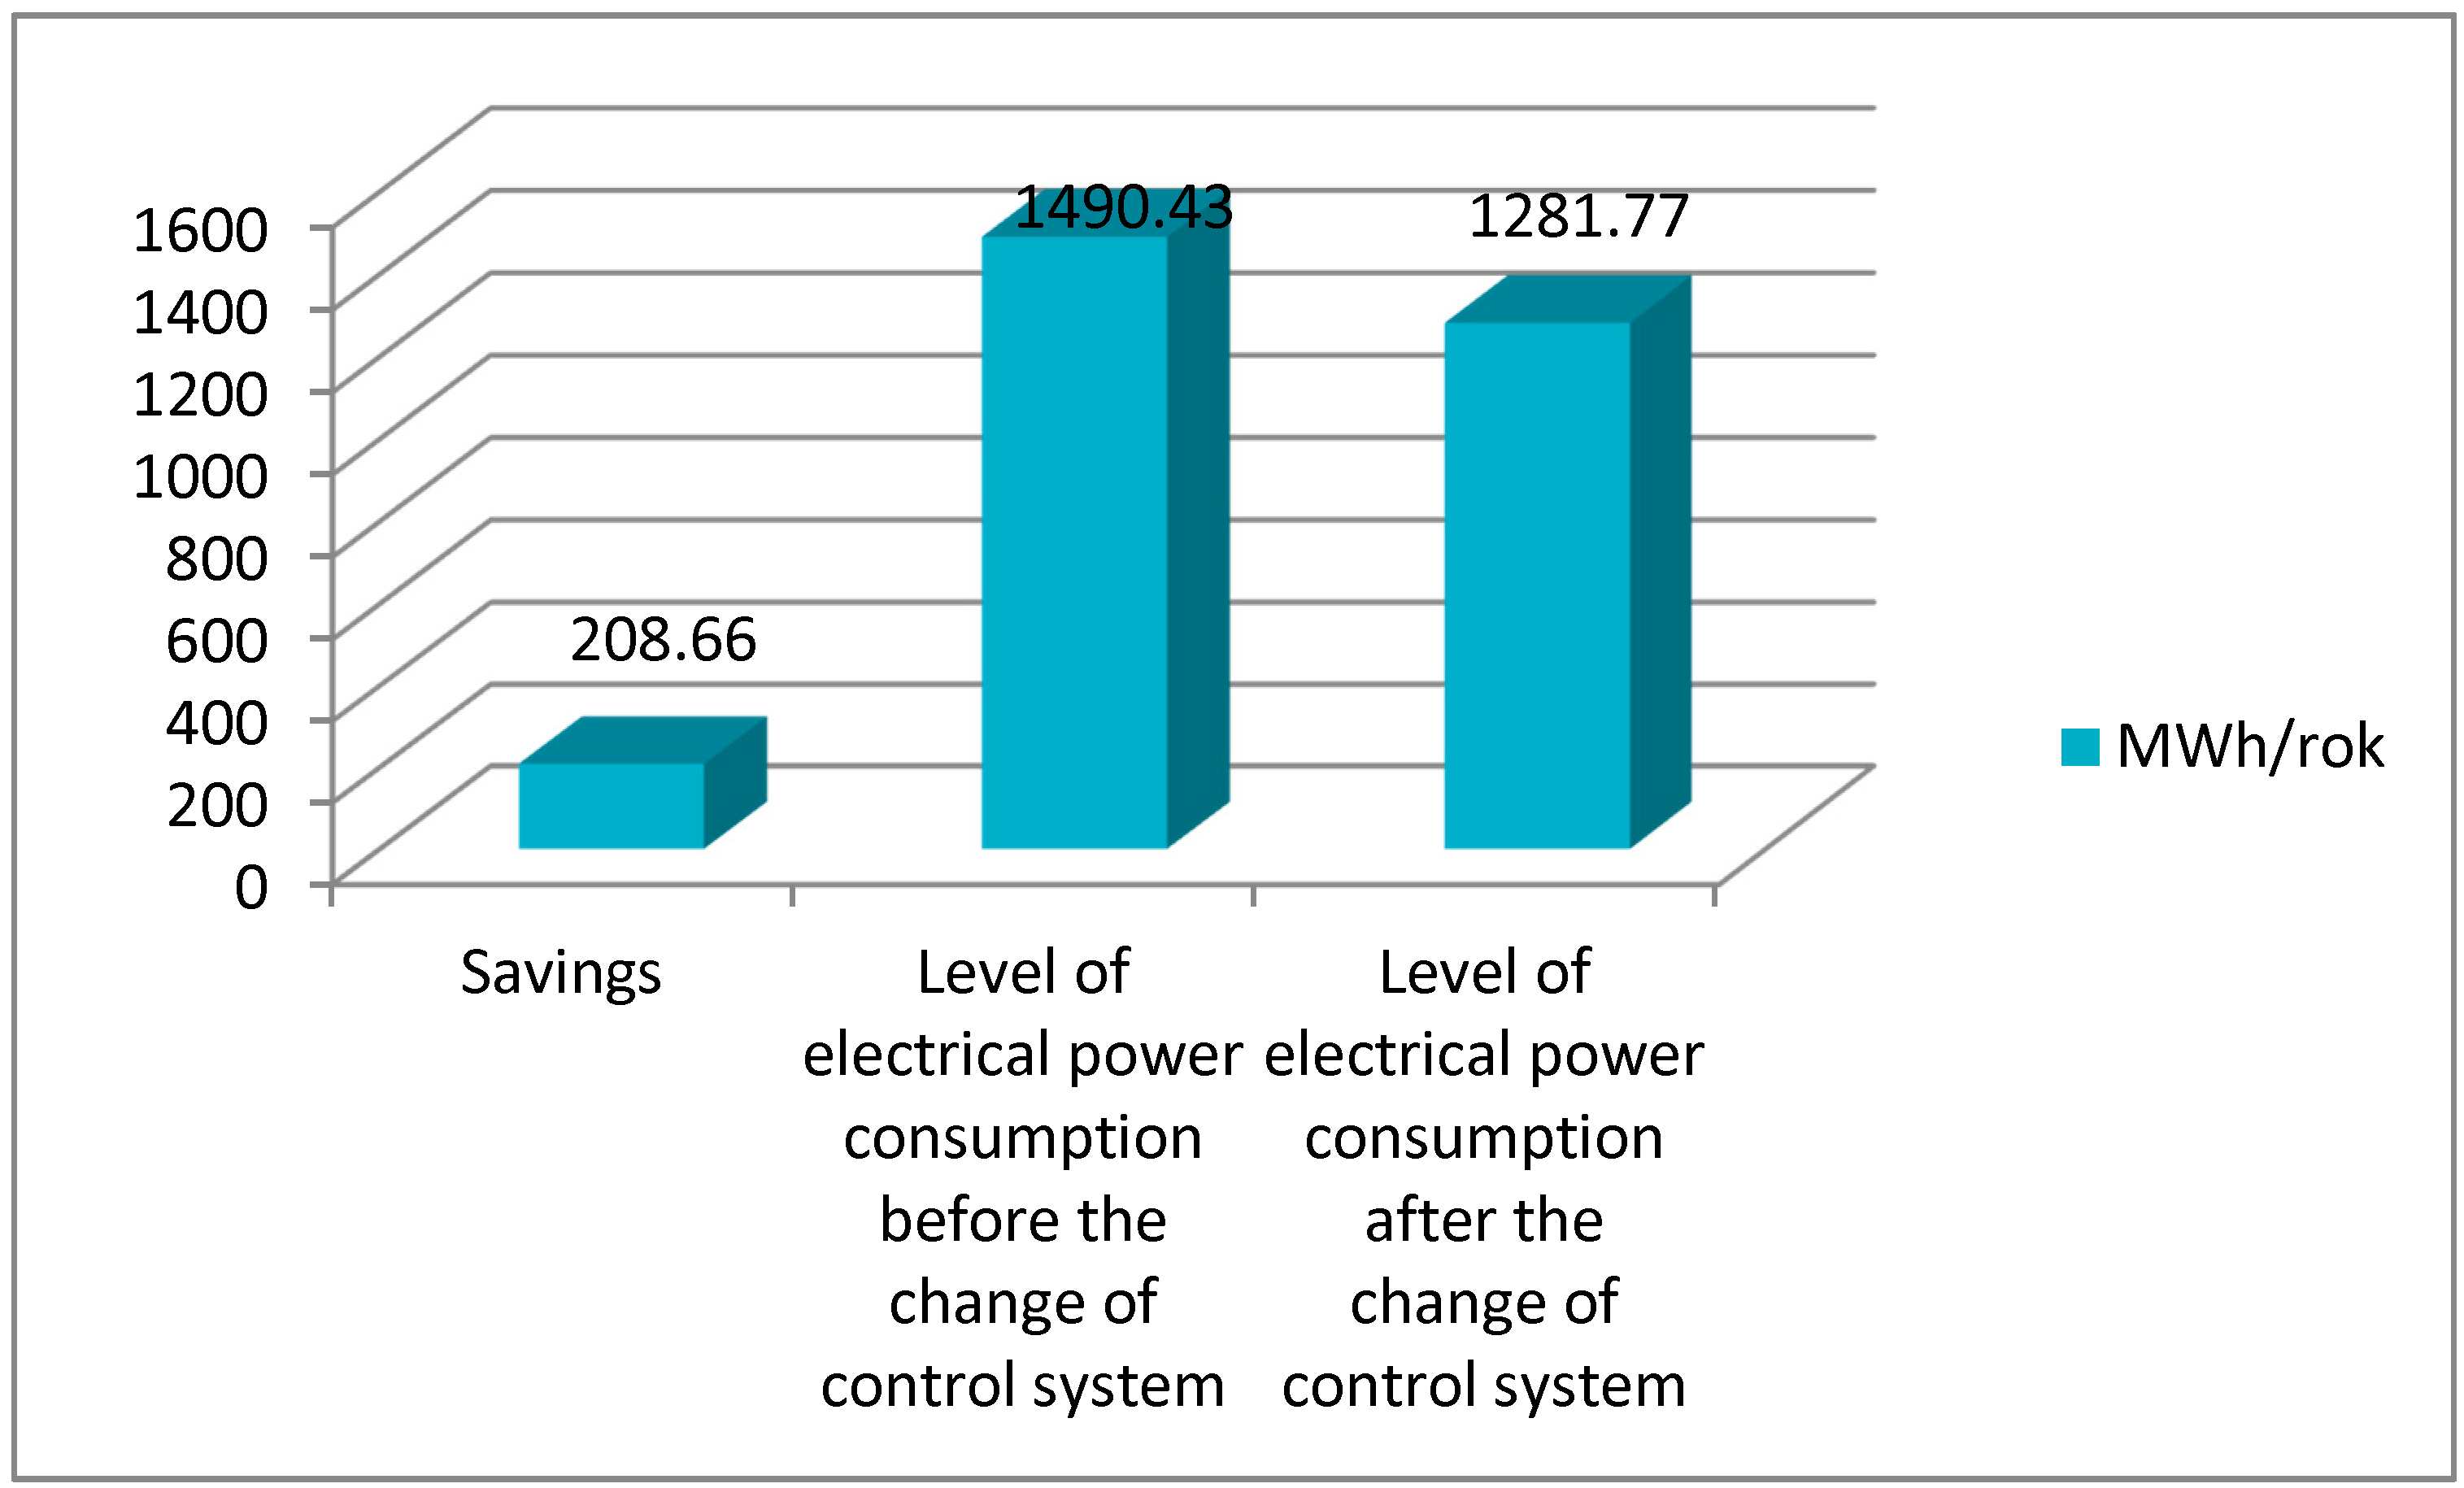
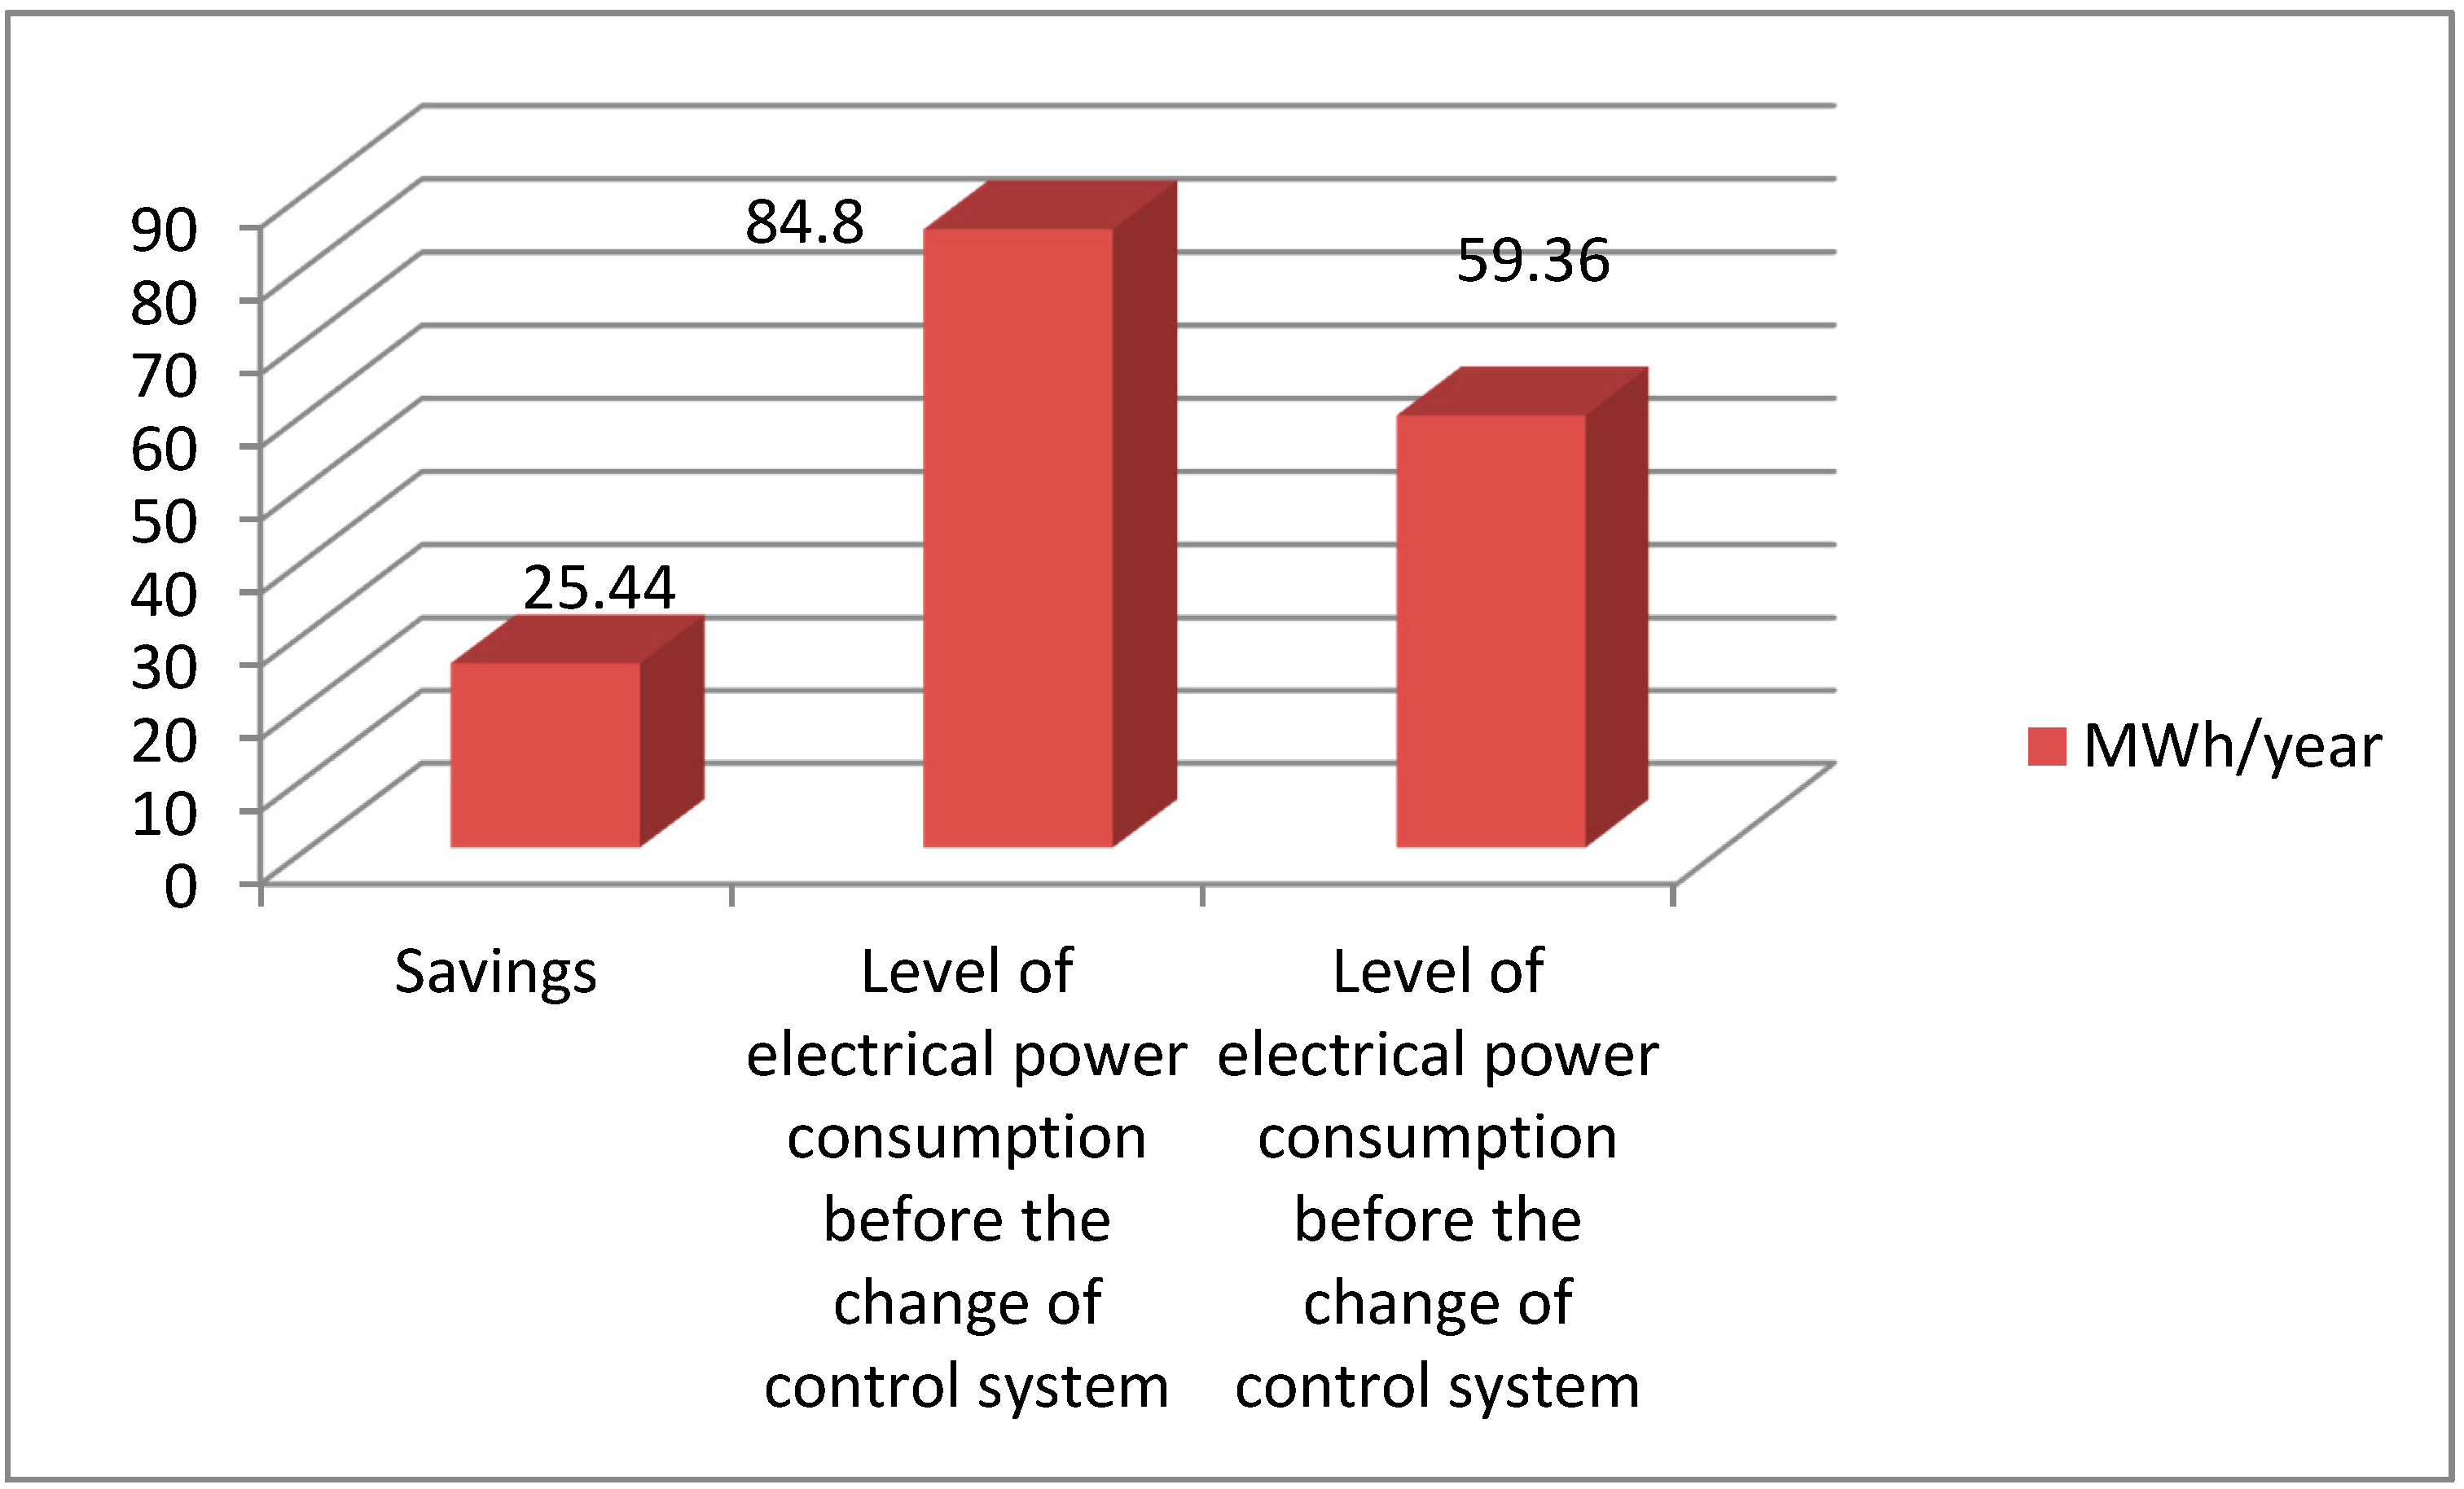
  • Reduction of electricity consumption in the aeration and recirculation processes.

3.2.1. Multi-Threaded Optimization of Electricity Consumption in the Biological Wastewater Treatment Process

The multi-threaded control system comprises quality control of wastewater, i.e., ammonia (NH4) and nitrate (NO3) concentrations, whose permissible values are limited by legal regulations specifying the permissible parameters of nitrogen compounds in treated wastewater released into public waters.
The concentration of ammonia (NH4) and nitrates (NO3) in the oxygen chamber is regulated by a multidimensional regulator. Oxygen concentration and the stream of recirculated wastewater are used as manipulated variables. Manipulated variables are used as external setpoints for lower level PID controllers. The biological reactor is divided into the anoxic part in which the denitrification process is carried out and the oxygen part in which the nitrification process is carried out.
The concentration of oxygen (controlled variable) is regulated by the PID controller by changing the rotation speed of the induction motor (through the inverter) driving the blowers (manipulated variable), which supplies air to the oxygen chamber of the biological reactor. The PID controller receives a signal corresponding to the setpoint from the MPC controller [24,25].
The multifunction meter measures the concentration of ammonia (NH4) and the concentration of nitrates (NO3), and controls them through the concentration of oxygen and through the flow of the recirculating wastewater stream, by changing the pump efficiency effected by changing the rotation speed of the induction motor. The slave controller receives a signal from the MPC controller. The slave controller sends a signal requesting a change in the airflow, depending on the preset value of oxygen concentration (via the MPC controller). For this purpose, the subordinate controller determines the rotational speed of the blower motor.

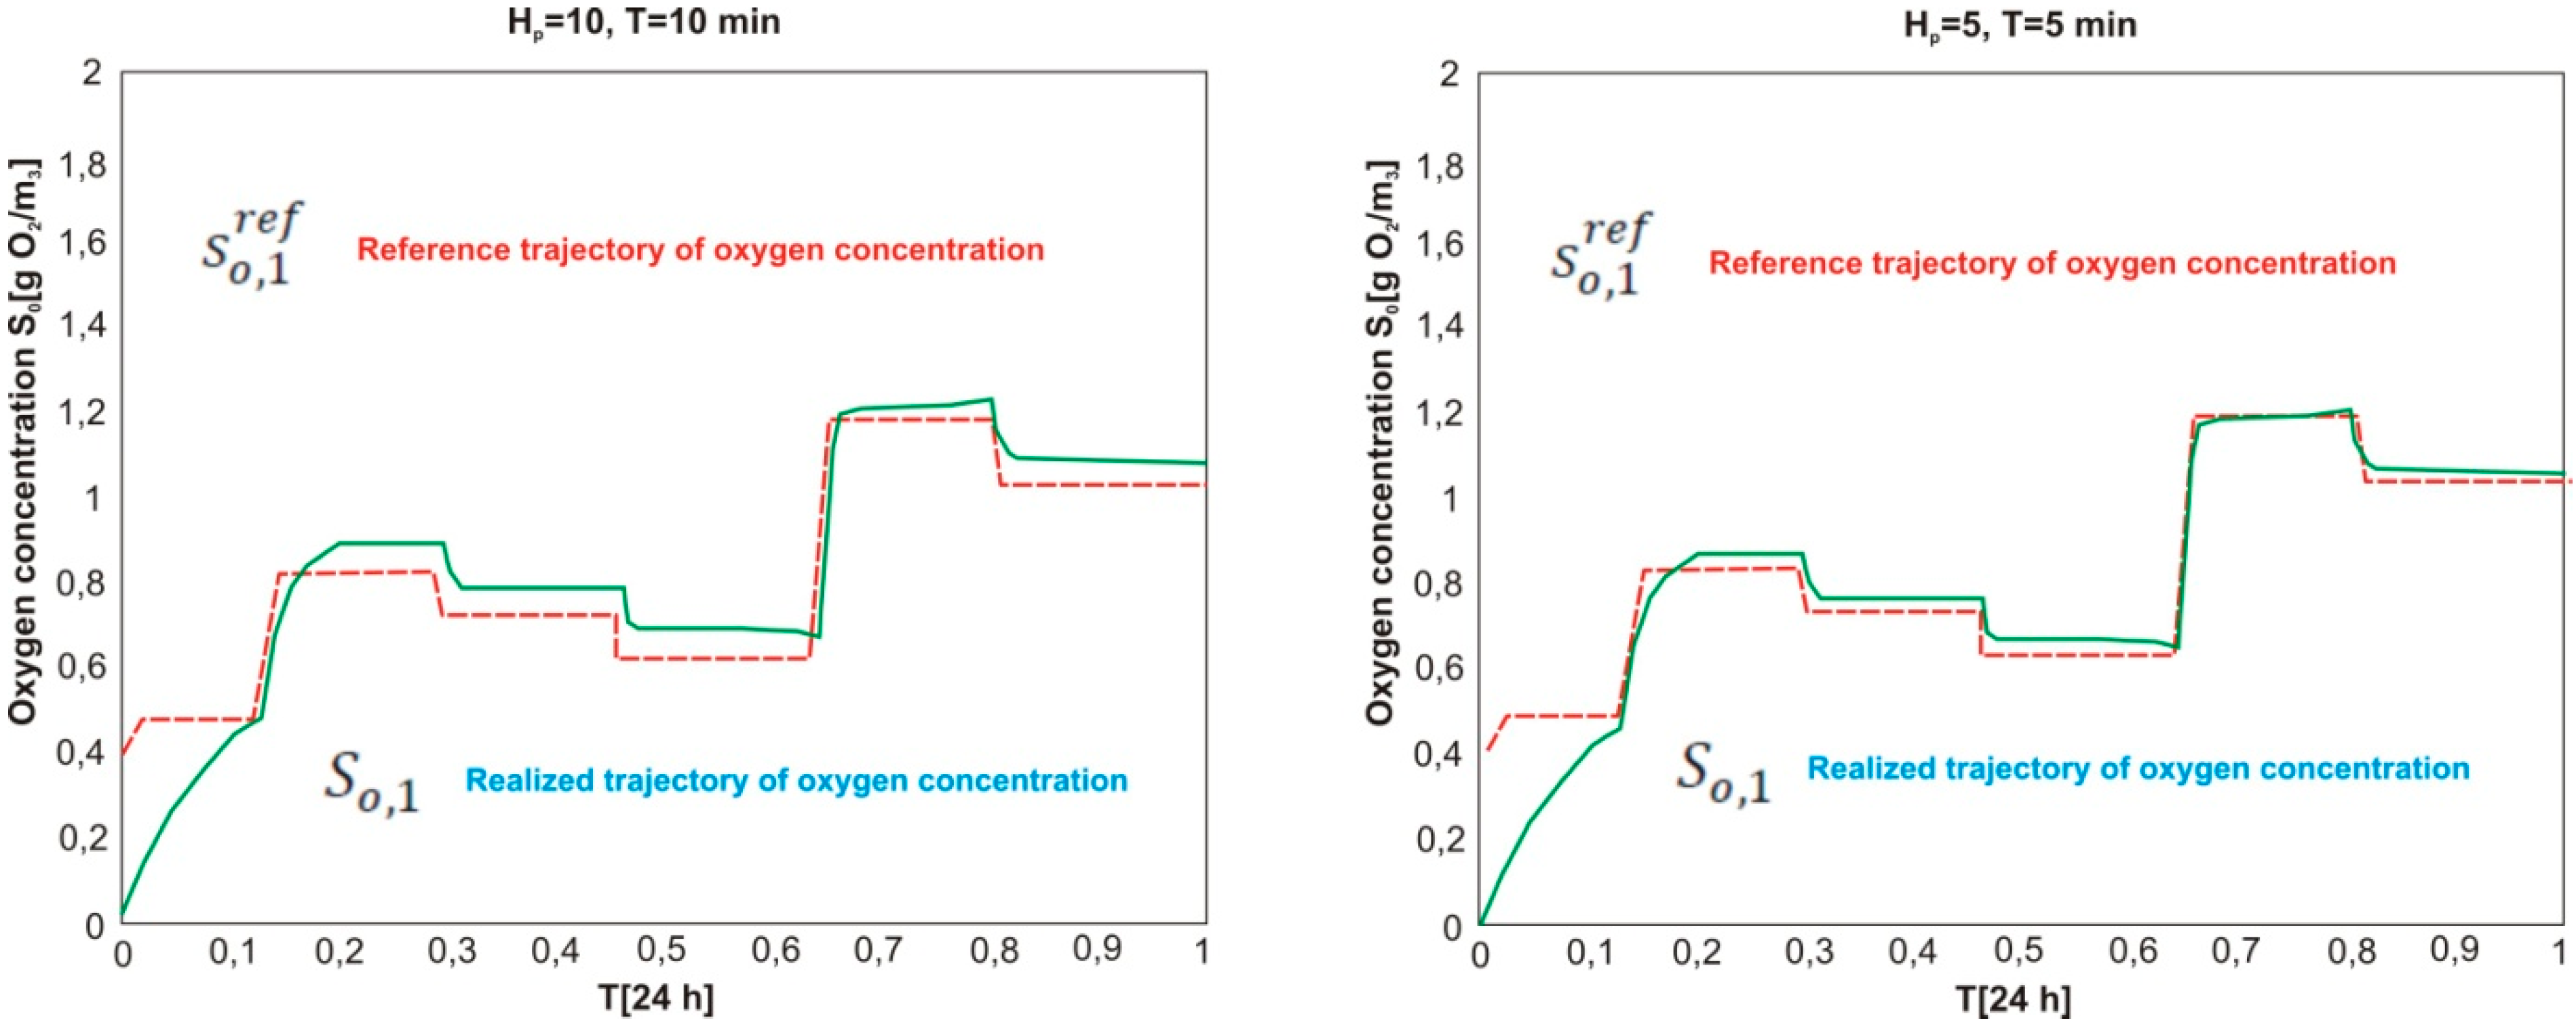
Model of the Subsystem for Oxygen Concentration Control—Thread A

The purpose of the control is to minimize the electricity consumption of the blower assembly, while meeting the process and technological constraints.
The objective function is described by the expression [26]:
J = j { 1 , 2 } ( i = l H p ( S o , j ( k + i | k ) S o , j r e f ( k + i | k ) )      + i = l H p γ ( Q a i r , j ( k + i | k ) ) Q a i r , j ( k + i l | k ) ) 2      + μ ( Q a i r , j ( k l | k l ) ) Q a i r , j ( k | k ) ) 2 + i = l H p ϑ ( Q a i r , j ( k + i l | k ) ) 2
The coefficients γ, μ and υ were determined experimentally based on the simulation results. The first expression in dependence 29 represents the follow up error after the preset trajectory of oxygen. The second and third components correspond to the technological constraint, i.e., (duty cycle) the switch-over frequency of the blowers. The fourth element is connected with the energy used by air pumping to the nitrification chamber. The multidimensional nonlinear predictive controller generates, at the moment k on the horizon Hp, controls:
{ Q ^ a i r , j ( k ) , ,   Q ^ a i r , j ( k + H p l ) } j = l 2
Based on the discretized non-linear model of oxygen concentration So, with the prediction of respiration value:
R r , j ^ ( k )   f o r   k [ k ,   k + H p l ]
defined by the controls (30), minimizing the objective function (35), while meeting the constraints (37–43).
For the j-th oxygen chamber (j = {1, 2}) the discretized model of oxygen concentration in the j-th oxygen chamber is described by the dependences:
S o , j ( k + i ) S o , j ( k + i l ) T      = k L a ( Q a i r , j ( k + i l ) ) ( S o , s a t S o , j ( k + i l ) )      S o , j ( k + i l ) S o , j ( k + i l ) K o + S o , j ( k + i l ) R r , j ( k + i l )
where: So—oxygen concentration; kLa—oxygen transfer function; Qair—inflow intensity of air to the oxygen chamber; S(o, sat) = 8.64 [g O2/m3]-oxygen saturation coefficient; Ko = 0.2 [g/m3]—Monod constant for dissolved oxygen and Rr—respiration.
The oxygen transfer function kLa was made dependent on the air supply rate Qair and it was adopted as the function:
k L a ( k ) = 0 , 208 · Q a i r , j ( k )
The variable R r , j is treated as an external disturbance. This value is estimated (no measurement) assuming that the dynamics of oxygen concentration is faster than that of respiration. The respiration estimates at the momentk-1 is described by the relationship:
R r , j ( k l ) = K o + S o , j p ( k l ) S o , j p ( k l ) ( S o , j p ( k ) S o , j p ( k l ) T k L a ( Q a i r , j ( k l ) ) · ( S o , j p ( k ) S o , j p ( k l ) ) )
Due to slow variability of respiration in relation to the rate of change of oxygen concentration in the reactor, this value is also adopted as an estimate of respiration at the moment k. Since in the dependence (34), we use direct readings from on-line measurements, when determining the respiration estimates we are witnessing a kind of “differentiation” of measurement noise occurring in the measurement of oxygen concentration.
The control variables the airflow Q a i r , j and the controlled variables the concentration of oxygen in the nitrification chamber S o , j p . In addition, the object is subject to the following disturbances: sewage inflow intensity, chemical demand for oxygen, total nitrogen and total phosphorus [26,27,28,29]:
Q a i r , j m i n j { 1 , 2 } Q a i r , j ( ( k + i l | k ) ) Q a i r , j m a x ,   i = l , H p
where: Q a i r , j m i n —minimal stream of air inflow to the oxygen chamber, Q a i r , j m a x —maximumstream of air inflow.   Q a i r , j m i n with constraints imposed on the minimum and maximum control value in a single prediction step, i.e., where: Q a i r , j m i n = 0; Q a i r , j m a x = 5700 [m3/h].
The constraint on the maximum change in control rate in a single prediction step was expressed by the system of inequalities:
| Q a i r , j ( k + i | k ) ) Q a i r , j ( k + i l | k ) | Δ Q a i r , j m a x ;     j { 1 , 2 } ;   i = l , H p
| Q a i r , j ( k l | k l ) ) Q a i r , j ( k | k ) | Δ Q a i r , j m a x ;     j { 1 , 2 } ;   i = l , H p
where: Δ Q a i r , j m a x = 5700 [m3/h].

Model of the Subsystem for Internal Recirculation Control—Thread B

Parallel to the external recirculation process, internal recirculation is carried out from the end of the nitrification chamber to the denitrification chamber, where nitrates are reduced to gas nitrogen. Internal recirculation can be directed to anoxic chambers, and the wastewater stream can be separated in any proportions. The recycled sludge is directed from the bottom of the secondary settler to the anaerobic chamber. The manipulating variables are flow rates (internal, external recirculation, recirculation of air to oxygen chambers, and excess sludge removal, dosing of reagents), (Figure 6). The degree of the removal of nitrogen compounds is determined by the ratio of wastewater recirculation from the oxygen chamber to the anoxic one, i.e., the rise of the degree of recirculation results in the rise of removal efficiency of nitrogen compounds [30,31]. The control of the recirculated wastewater and sludge streams depends on the volume of raw sewage stream at the inlet and on the pollution load.
The system of balance equations for the determination of changes in the concentration of organic compounds by gradual wastewater treatment in anaerobic and aerobic bioreactors with internal recirculation of the sludge mixture [32,33], taking into account the recirculation of activated sludge from the secondary settler, can be presented as follows:
n N = Q p / Q i n ;   n N = Q p / Q i n ;   C m i x = C i n + C e x · R 1 + R ;   ;   R = a i 1000 J i a i
C I e x = C I i n 1 ( 1 + n H ) · d C I d t t I ( 0 , t i I ) ;   C I I i n = C I e x ;   C I I e x = C I I i n 1 ( 1 + n H ) · d C I I d t t I I ( 0 , t i I I )
where C i n is the inlet concentration of organic compounds into the bioreactor, mg BOD/L; C e x —concentration of organic compounds in treated wastewater, mg BOD/L; Cp—concentration of organic substances in the internal recirculation flow, mg BOD/L; Cmix—concentration of organic compounds in the mixture of activated sludge and sewage, mg BOD/L; nH—internal recirculation coefficient, C I —concentration of organic compounds in the anaerobic bioreactor, mg BOD/L; t I —duration of wastewater treatment in the anaerobic bioreactor, t I I —duration of wastewater treatment in the oxygen chamber; J i —activated sludge indicator, cm3/g; R—recirculation ratio of activated sludge.
In the recirculation process, electrical power is mainly used to drive the pump motor, which is expressed by the following relationship:
P E = 0.04 T t 0 t i ( Q a ( t ) + Q r ( t ) + Q w ( t ) ) d t
where: P E denotes the energy consumption for pumping the recirculated stream Q a ; Q p —stream of recirculated sewage from the nitrification chamber for denitrification in m3/day; Q i n —stream of inflowing sewage in m3/day; Q r —recirculated wastewater stream in m3/day and Q w —recirculated sludge stream from the secondary settling tank in m3/day.
The unit pumping energy consumption depends on pump head and on the efficiency of pump unit γz, which is the product of the pump efficiency γ, induction motor γs and frequency converter (inverter) γ f :
γ z = γ · γ s · γ f

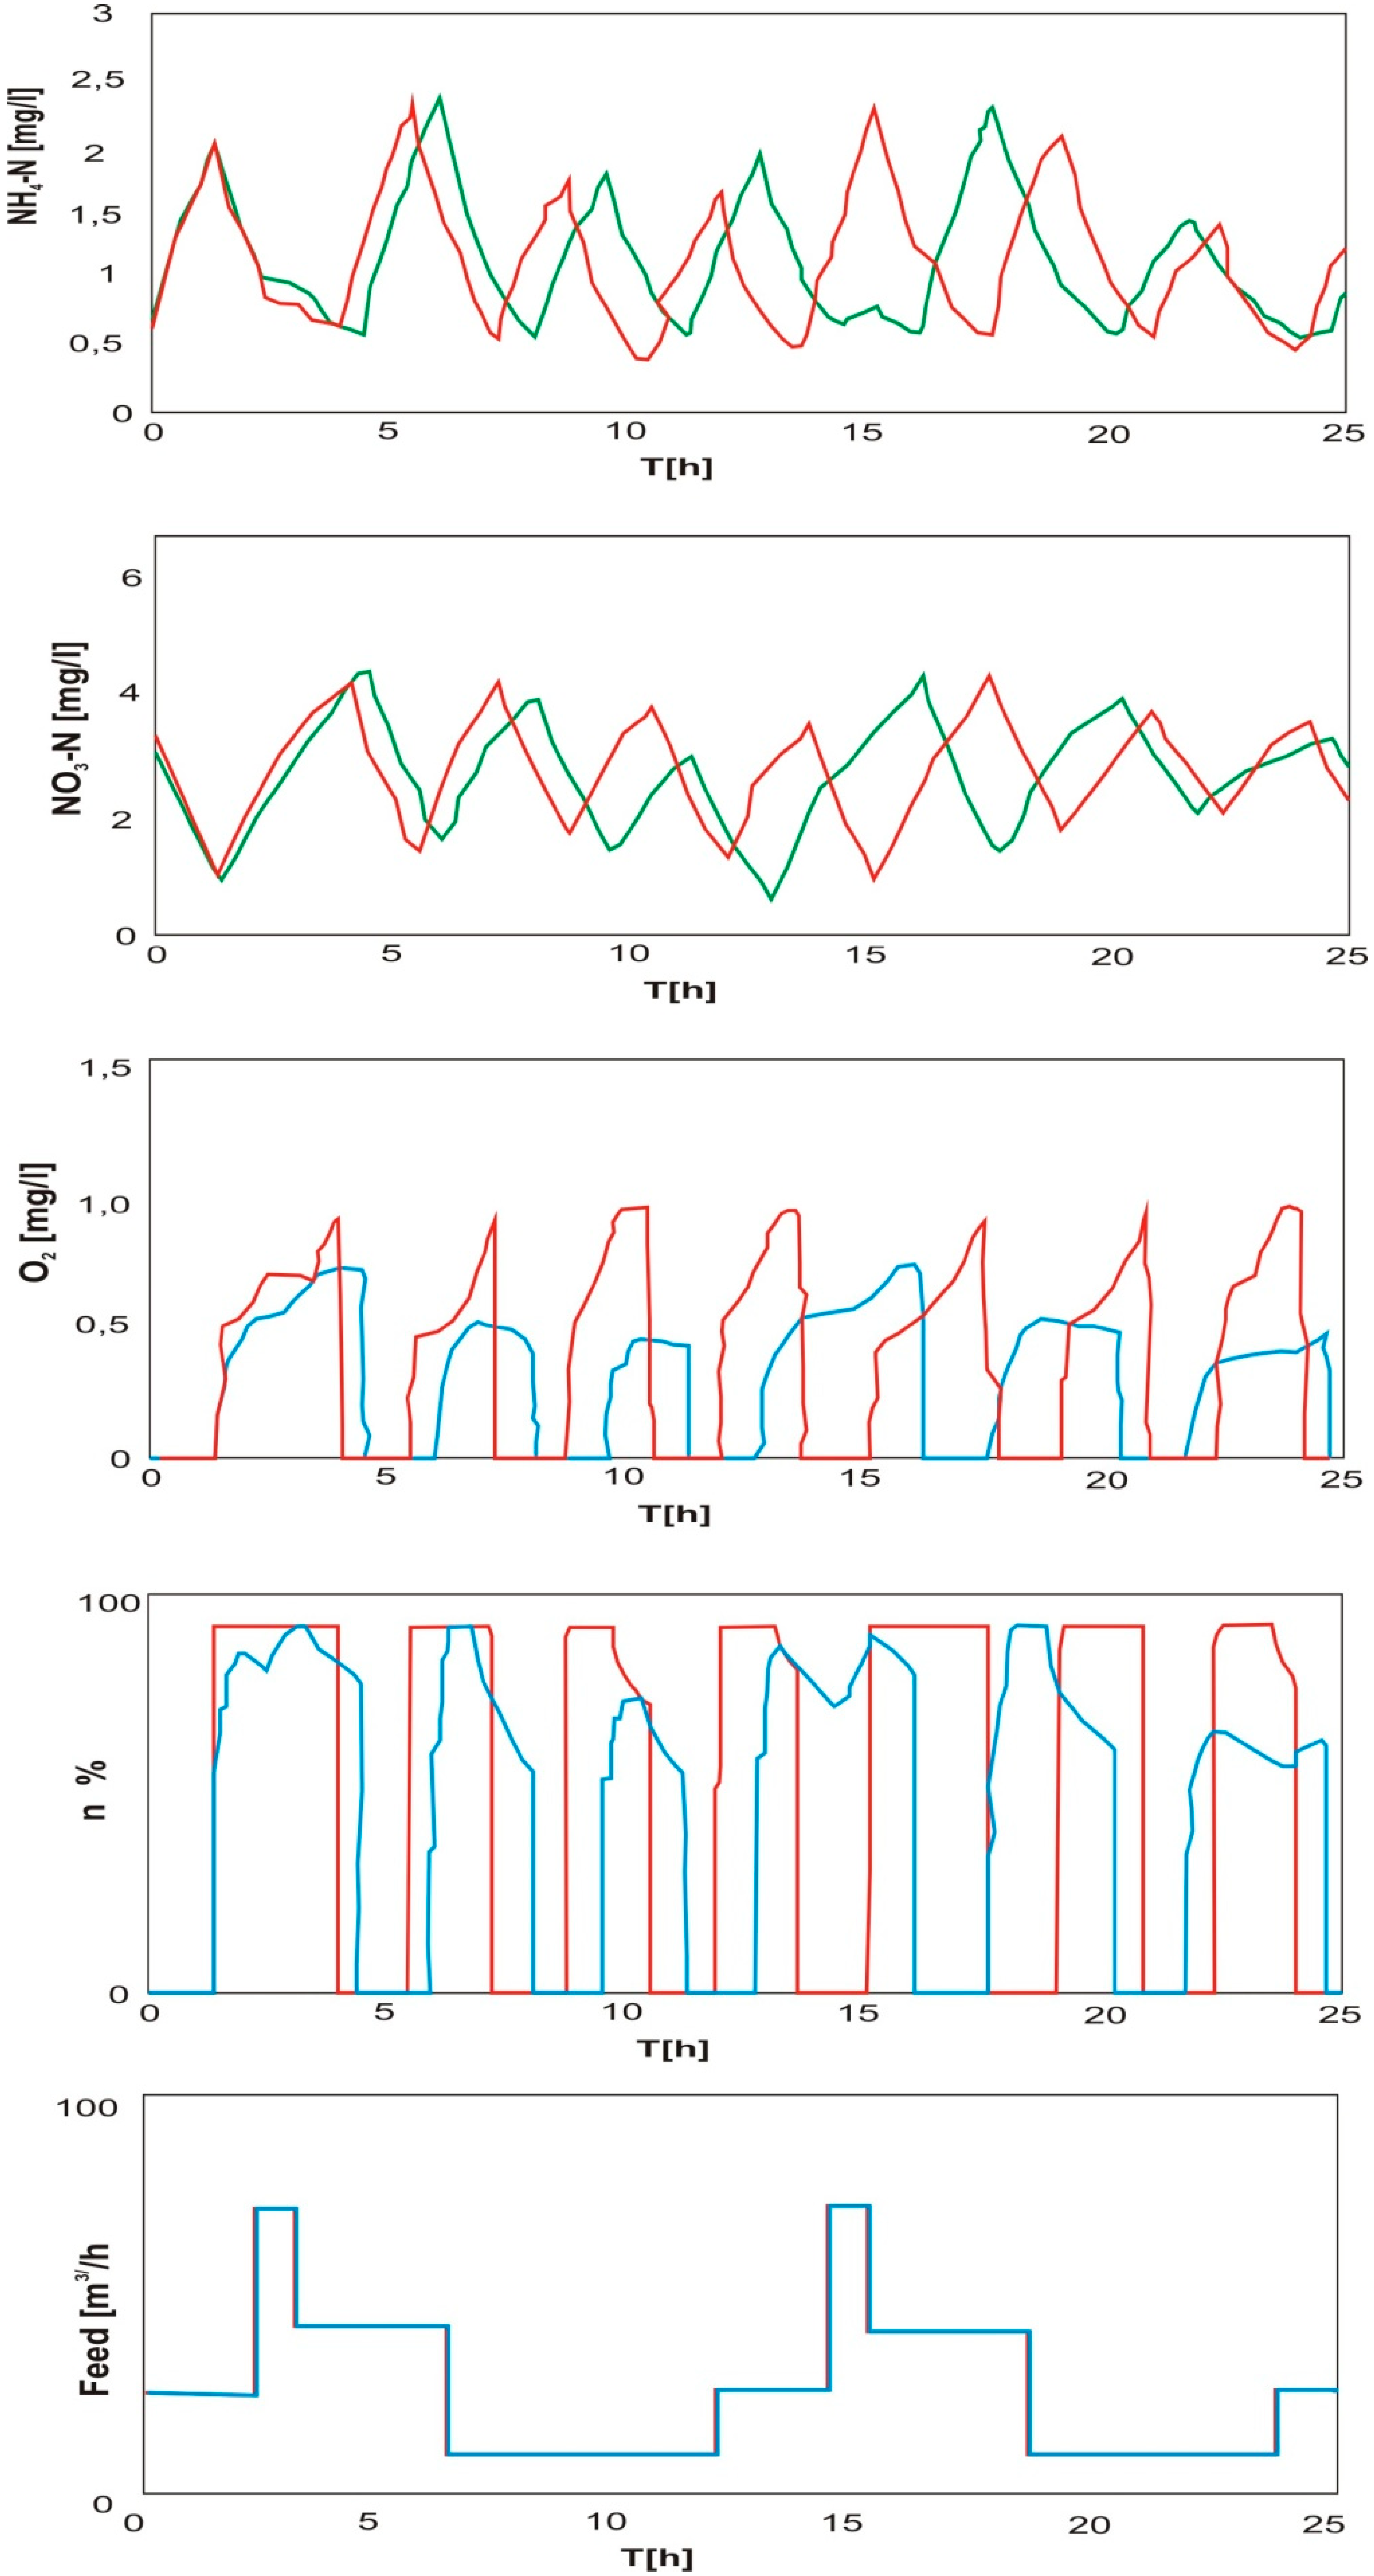
3.2.2. Simulation of the Operation of Biological Reactor-Classic Closed-Loop Control Versus MPC

In order to analyze energy efficiency of the biological reactor, a simulation was carried out, taking into account the changes in the raw sewage stream flowing into the bioreactor. Two cases were analyzed, i.e., the classic closed-loop control and MPC controller [25,33,34], taking into account the concentration parameters of ammonia (NH4), nitrate (NO3), dissolved oxygen in nitrification chambers (O2) and rotational speed of blowers (n).
The classic closed-loop control system as well as the MPC controller were implemented in Matlab/Simulink. The simulation was carried out over a period of 25 h. The classic closed-loop control is presented on the diagrams in red, while the system with MPC in blue. The duration of individual phases may vary depending on the two control methods [35].
The simulation begins in the unsaturated denitrification phase. After the break-down of the sufficient amount of nitrate, the aeration begins. The curves in the graphs (Figure 7) vary because two controllers specify different speeds of the blower. The treatment efficiency is comparable in the two control methods because the average concentrations of ammonia and nitrate remain the same. It can be clearly seen that the MPC controller ensures lower dissolved oxygen concentration than the conventional closed-loop control. Because the blower assembly often operates at maximum speed with the classic closed-loop control, the introduction of MPC provides significant energy savings of up to 14% over the investigated period of time. The rise of the flow after 2.5 and 14.5 h results in the rise of blower speed via control.
The increases of the influent flow rates after 3 and 15 h trigger an increase in the blower speed by means of the closed-loop ammonium control and feedforward control of the MPC. The behavior of the MPC control loop thus approaches that of the conventional oxygen control loop, which blows at maximum speed nearly all the time anyway. Of interest, in contrast, are the decreases in the influent. In the case of small influent flows, the MPC throttles back the blower speed considerably, which explains the significant energy savings and reduced DO concentration due to optimized blower speed. In addition, the MPC is able to handle fluctuations in influent.
The presented multi-threaded polymorphic control system for the hierarchical process of municipal sewage sludge treatment using active sludge methods was used on an industrial scale to optimize the consumption of electricity consumed by the blower station and pump motors in the internal and external recirculation systems.

4. Results and Discussion

4.1. A Case Study—Energy Economics of Waste-Based Fuel Production Processes

As an application case study to demonstrate the performance of the proposed modelling and control approach, some results of its application off-line (in simulation) in one of the technologies for processing municipal wastes into fuels are presented. The simulator of the network was built using Matlab/Simulink and it was validated using real data obtained from SCADA.
Municipal waste from storage boxes is fed with loaders via a belt conveyor to the drum screen (Figure 8). The undersize fraction is transported by means of four conveyor belts to the storage box of the undersize fraction. The oversize fraction is passed via conveyor belt to the initial shredder. The analyzed installation can work in parallel with two sources of waste collected in the hall, and in such a case both waste streams having different calorific values are mixed in the initial shredder.
The sensor measuring the filling level of the shredder funnel controls the amount of waste input for crushing through a conveyor belt and direct loading with a loader. Initial shredding is carried out in a shredder to crumble larger pieces of waste. The waste is crushed to the size of about 300 mm.
The capacity of the shredder is regulated by an inverter based on the measurement of the stream of the output material. Initially shredded waste is directed by means of a belt conveyor to a vibrating screen. The undersize fraction is transferred by a system of conveyors to ballast containers (ballast No. 2).
The oversize fraction is fed via a conveyor belt to the air separator, where the blowing of a compressed air stream separates the light fraction of waste with the air stream.
The separated light fraction is fed by means of an assembly of conveyor belts through a metal separator and a neodymium drum to the final shredder to be shredded to the 30–40 mm fraction being ready-made alternative fuel. The heavy fraction after the air separation process is transported by conveyors to two optical separators, whereof task is to separate the caloric fractions, i.e., plastics, wood, cardboard, etc., which were not separated in the ballistic separator. The separated fractions go directly via a belt conveyor to the final shredder in which the molded fuel is obtained. The remaining waste, not separated in the two optical separators, goes to reverse conveyor belts via a belt conveyor at the end of which a metal separator is mounted.
Fuels made from wastes, produced by production plants of (alternative) molded fuels have the following composition and physicochemical properties summarized in Table 1 and Table 2.
The presented multi-threaded, polymorphic system for hierarchical control of the production process of fuel components was applied on an industrial scale to optimize the production process of fuel components of the required composition and parameters, including:
  • Optimization of the light fraction production process with preset physicochemical, combustion and emission properties (the Algorithm 1 MCSVM classifying waste fractions in the optical separator, based on the SVM network and the master algorithm greedy set cover).
  • Optimization of the production process of hybrid fuel components, by mixing the light fraction with fossil fuels, while maximizing the objective function (Wd—calorific value) and constraints imposed on the decision variables of the optimization tasks (modified simplex algorithm).
The algorithm controlling the separation process of combustible fraction in the optical separator and the simplex algorithm were implemented in the optimizing control layer of SCADA system, responsible for generating control trajectories for the actuators of the optical separator (including compressor stations) and the mixing device. Before the implementation, a number of tests were carried out on an industrial scale on a real object, i.e., the waste segregation installation with the production of alternative fuels from municipal waste. The tests were performed by feeding 18.2 Mg of mixed municipal waste to the system input, using the classic control algorithm (Test A) and using the authors’ algorithm presented in Section 3.1.1.1 (Test B). The duration of a single reference test was 85 min. Table 3 presents the results of the carried out tests. The parameters of obtained hybrid fuel presented the Table 4.
Validation of the model was carried out with the following assumptions:
  • For the production process of hybrid fossil fuel process two components are used: dark coal and light-caloric fraction of the chemical composition given in Table 5.
  • Optimizations constraints imposed on hybrid fossil fuel process are used as given in Table 6.
As a result of computer simulations and laboratory tests the model gives the results that are very close to the obtained from the real process.
Application of the algorithmic model of multi-threaded optimization of the manufacturing process of fuel components allowed the identification of the optimal mass fractions of components C1 and C2 in hybrid fuel U1 and U2 with the following constraints on the decision variables: b 1 min a 11 u 1 + a 12 u 2 b 1 max , where a 11   , a 12 are sulphur mass fraction in components of the formed fuel and b 2 min a 21 u 1 + a 22 u 2 b 2 max , where a 21   , a 22 are chlorine mass fraction in components of the formed fuel. Symbols b 1 min , b 1 max and b 2 min , b 2 max denotes allowable values of sulphur and chlorine mass fractions in components of the formed fuel respectively ( b 1 min 0 ,   b 1 max 0.016   kg   s / kg and b 2 min 0 , b 2 max 0.0024   kg   cl / kg . Optimum value of the objective function W d o p t was found within the range of 23.14 to max 24.31 MJ / kg .
In effect of the optimization of the technological process, the efficiency index of optical separator increased from 81% to 92%. Savings in electricity consumption were also reported, and thus the unit cost of RDF fuel production decreased from PLN 18.24/Mg to PLN 16.33/Mg.

4.2. A Case Study—Energy Economics of Wastewater Treatment Plant Processes

The subject of the research involved a municipal sewage treatment plant with the capacity of 165,000 RLM, with an average daily flow of 23,000 m3/day. The biological wastewater treatment process is carried out in the UCT type flow bioreactor using activated sludge technology with fine-bubble compressed air aeration. The optimal aeration process of an aerobic chamber requires the supply of large amounts of electricity (to drive blowers) and accounts for over 45% of the annual electricity consumption in the entire wastewater treatment process. The second element of the installation that requires optimization of electricity consumption is the internal and external recirculation process, which accounts for over 10% of annual energy consumption.
The actual process of biological transformation is represented by a group of activated sludge models (ASM) proposed by the International Water Association (IWA). In the considered object, for modeling of the real process, we used the ASM2d model, described by the vector of 21 state variables, 20 stoichiometric and kinetic parameters. The model also describes the removal processes of organic carbon and nitrogen, as well as transformations with the use of bacteria which have the ability to store phosphorus in cell biomass.
The non-linear nature of the process, different operating conditions of the sewage treatment plant, a strong impact of disturbances (including mainly irregular inflow of sewage to the treatment plant, a changing load of wastes) enforce a change of reference trajectory of oxygen concentration over the 24 h operation period. It is determined by the optimizing control layer of the technological process. Following up the oxygen reference trajectory by changing the air supply intensity as a control quantity is a classic task of controlling the process of biological decomposition of organic matter [34,36].
The biological part of the treatment plant includes radial secondary settling tanks and two bioreactors. The internal recirculation (versus external rec.) is carried out from the end of the nitrification chamber to the denitrification chamber, where nitrates are reduced to gas nitrogen. Internal recirculation can be directed to anoxic chambers, and the wastewater stream can be divided in any proportions. The recycled sludge is directed from the secondary settling tank to the anaerobic chamber. The manipulating variables are flow rates (internal and external recirculation, air stream to oxygen chambers and the level of excess sludge discharge, dosing of reagents). The removal degree of nitrogen compounds is determined by the degree of recirculation of wastewater from the oxygen chamber to the anoxic chamber, i.e., the rise of the degree of recirculation rises the removal efficiency of nitrogen compounds. The control of the recirculated streams of wastewater and sludge depends on the volume of raw wastewater stream at the inlet and on the pollution load.
The computer model of the wastewater treatment plant was developed in the Matlab/Simulink and SIMBA environment. To model biochemical processes, we applied the model Activated Sludge Model No. 2d (ASM2d), comprising removal processes of organic carbon and nitrogen as well as the transformation involving bacteria having the ability to store phosphorus in cell biomass. Then, the quantitative and qualitative parameters were identified and the model was calibrated. The final step involved the validation of the entire model. It was carried out using a set of data from outside those that were used to calibrate the model. Both in the calibration process and in model validation we used genetic algorithms. High accuracy of the model was obtained and its usability for the purposes of designing the control system was confirmed.
The model was calibrated in two stages. In the first stage, static model calibration was performed. Static calibration does not consider the variability of parameters over time and is the first approximation to determine the values of kinetic coefficients of individual groups of microorganisms that are part of the activated sludge. In the second stage dynamic calibration was carried out, which took into account the variability of sewage composition and treatment plant operation parameters during the day.
Static calibration consisted of simulations at different values of kinetic coefficients of processes occurring in the biological reactor. Factors of fundamental importance for the processes of nutrient removal:
  • Maximum growth rates of autotrophs, heterotrophs and phosphorus accumulating heterotrophs.
  • Decomposition rates of autotrophs, heterotrophs and phosphorus accumulating heterotrophs.
  • Appropriate saturation constants and other coefficients, describing, e.g., the hydrolysis process, yields of growth of individual groups of microorganisms and other, with slightly less importance for the course of purification processes.
Calibration was carried out until an acceptable level of compliance of the simulation results with the results of the treatment plant was obtained. As values to which the calibration results were referred, the average values of the basic concentrations of pollutants in the wastewater flowing out of the secondary settling tank during the 14 days of testing were adopted. For the approximate assessment of compliance of simulation results with real values, so-called “Compliance indicator” being the sum of squares of relative differences in concentrations of basic pollution indicators: COD, suspension, N-NH4, N-NO3 and total phosphorus as well as biomass concentration in the reactor.
The values of kinetic coefficients obtained as a result of static calibration constituted the starting point for carrying out dynamic calibration of the model, the purpose of which was to precisely determine the values of these coefficients in such a way that the dynamic reaction of the model to changes in the composition of the wastewater flowing into the reactor during the day was similar to that of the real system. It should be remembered that the model’s response to input changes will never perfectly match reality. This is because the model always idealizes the conditions at the sewage treatment plant, without taking into account e.g., the lack of full mixing in the reactor, changes in sewage temperature, the amount of air supplied to the system and certain unregistered operating activities. During the dynamic calibration of the model, the growth rates of individual groups of microorganisms and the rate of their breakdown in the ranges of about ±10% in relation to the values obtained as a result of static calibration were changed. As a result of the dynamic calibration of the model, the following values of kinetic coefficients were determined:
  • Growth rate of autotrophs: μA = 0.69
  • Growth rate of heterotrophs: μH = 4.8
  • Growth rate of phosphorus accumulating heterotrophs: μPH = 3.9
  • Autotroph decomposition rate: bA = 0.039
  • Heterotroph decomposition rate: bH = 0.49
  • Decomposition rate of phosphorus accumulating heterotrophs: bPH = 0.011
For the obtained kinetic coefficients, the model was validated on an independent data set assuming at the entrance to the model the average concentrations of pollutants flowing into the biological reactor, obtaining a compliance index value of 1.12.
Optimization of technological process parameters-objective function and constraints imposed on decision variables of the optimization task.
The purpose of the control is to minimize the objective function expressing the consumption of electricity by the aeration station (a set of blowers, diffusers, throttles), while meeting the process and technological constraints described by the expressions (expressions).
The sewage treatment plant was modeled in the Matlab/Simulink environment using the calibrated ASM2d model. Then, a nonlinear regulation system was implemented using the Optimization Toolbox library. Wastewater flowing into the treatment plant (vector of disturbing variables) was characterized by four quantities: variable intensity of wastewater inflow and chemical demand for oxygen as well as constant values of nitrogen and total phosphorus (respectively: 90 mg/dm3 and 10 mg/dm3). The influence of the length of the Hp prediction horizon and the T prediction step on the control quality, measured by the RMSE error, was analyzed. The basic factor determining the choice of Hp was the dynamics of the analyzed object. The selection of the prediction step T is determined by the required control quality with the maximum reduction of computational complexity. This is particularly important in nonlinear systems. The RMSE (Root Mean Square Error) involving the follow up of oxygen concentration trajectory is given in Table 7. The said error was calculated from the relationship 48.
The root means square error (RMSE) was determined from the following relationship (where n = 2—two oxygen chambers):
M S E = j = 1 n ( S o , j s o , j r e f ) 2 n
Since the equations of the oxygen concentration model, which are equality constraints in the task of predictive optimization, are solved during the operating optimization procedure by integrating the differential equations of this model by the simulator, so most of the processors time is spent solving the oxygen concentration model for a given system. The time is proportional to the period in which the model is solved. The reduction of Hp shortens the calculation time and has little effect on the quality of the control. The control results are presented for two sets of parameters: Hp = 10, T = 10 min (Figure 9) and Hp = 5, T = 5 min (Figure 10).
For both cases, follow-up of the trajectory of oxygen concentration can be observed. For the second case, the quality of control process is better, and it results directly from more frequent interventions of the regulator. The average calculation time of one optimization task is short enough to make it possible to implement it with the appropriate length of the prediction step, required by the dynamics of the object and the rate of disturbance changes. In some situations, e.g., in the case of increased sewage inflows with high concentration of pollutants, the oxygen concentration trajectories can be significantly different, and the system with independently working MPC regulators may have problems with proper air distribution. It also applies to the decision to divide the restriction involving the maximum air supply. The control system with a multidimensional MPC controller takes into account the needs of two oxygen chambers and thus it finds an optimal distribution of air stream.
When optimizing the electricity consumption of actuators in the system of biological reactor, special attention was paid to the required degree of wastewater treatment, in order to ensure the quality parameters of wastewater in compliance with the accepted standards. For the analyzed sewage treatment plant, whereof capacity is 165,000 RLM, the concentration of total nitrogen in the treated wastewater should not exceed 10 mg/L, and the concentration of total phosphorus should not exceed 1 mg/L. The highest permissible values for the individual nitrogen compounds should be 10 mg/L for NH4+ ammonium nitrogen, 30 mg/L for NO3- nitrate nitrogen and 1 mg/L for NO2- nitrite nitrogen, respectively.
The analysis involved also the changes of dissolved oxygen concentration in the nitrification chamber in relation to the electric energy consumption by the actuators. When conducting the analysis of computer simulation, we assumed the concentration of dissolved oxygen in the activated sludge chambers in the range of 0.5 to 2 mg/L. The changes in the concentration of ammonium nitrogen (NH4+-N) and nitrate nitrogen (NO3-N) are presented in Figure 11.
Based on the results of dynamic modeling, it was found that the dissolved oxygen content in the range of 0.5 mg/L to 2 mg/L is correct in terms of the quality of sewage outflow. Nevertheless, during the hours of the largest inflow of pollution load, the concentration of ammonium nitrogen increases significantly. Based on the analysis, we can state that the most optimal concentration of dissolved oxygen is within 1 mg/L at high efficiency of the process. The consumption of total energy can be reduced by up to 14% by adopting the concentration of oxygen at the level of 1 mg/L relative to 2 mg/L in the nitrifying chamber.
Oxygen concentration levels in both nitrification chambers are different due to the fact that the first part of the nitrification chamber not only receives a large N-NH4 load, but also a large load of organic pollutants. It follows that the load of activated sludge with an organic charge in the first part of the nitrification chamber is higher than in the second part of the nitrification chamber, and thus, in addition to the oxygen demand of Nitrosomonas bacteria (the first nitrification phase), very high oxygen demand is shown by heterotrophic bacteria that mineralize the organic contaminants. In the second part of the nitrification chamber, the demand for oxygen is definitely lower due to the fact that the greater part of the organic charge has been removed in the first part of the chamber. In addition, the demand for oxygen by nitrifying bacteria of the first phase of nitrification (oxidation of N-NH4 to N-NO2) is as much as 75% of the total oxygen pool needed to achieve full nitrification, and for the second phase of nitrification (oxidation of N-NO2 to N-NO3) oxygen by Nitrobacter only 25%, which is also associated with lower oxygen demand in the second part of the nitrification chamber.
The next step in optimizing the costs of wastewater treatment involves the analysis of the impact of stream change in the internal recirculation process from the nitrification chamber to the denitrification chamber. During the simulation, a constant dissolved oxygen concentration (1 mg/L) was adopted. The simulation was carried out at various internal recirculation rates from 50% to 300% of the inflowing sewage. The results of the simulation are presented in Figure 11.
Based on the simulation results, it can be observed that recirculation changes significantly affect the concentration of NO3-N in the outflow. Lowering the flow rate deteriorates the efficiency of the process. With the 50% recirculation, the nitrate nitrogen concentration is on the border of the permissible value of total nitrogen (<10 mg/L).
As part of the research carried out on an industrial scale, an impact analysis was carried out involving the change of the recirculated wastewater stream (internal recirculation) from the outlet of the nitrifying chamber to the denitrification chamber. For the simulation, a constant concentration of dissolved oxygen (1 mg/L) was adopted. The simulation was carried out at various internal recirculation rates from 50% to 300% of the inflowing sewage. Lowering the flow rate deteriorates the efficiency of the process. With the 50% recirculation, the nitrate nitrogen concentration is on the border of the permissible value of total nitrogen (<10 mg/L).
The degree of internal recirculation at most wastewater treatment plants is about 300% of raw sewage inflow. By adopting the internal recirculation of 200% of the incoming sewage, we can save up to 30% of electricity by reducing the total nitrogen concentration by about 13% in the outflow. However, the total nitrogen concentration is below the permissible threshold (<10 mg/L). By comparing the results of the carried out computer simulations with the actual operating conditions of the sewage treatment plant, the operating costs of the treatment plant can be reduced by up to approx. 20%. (data calculated in the GPS-X 6.4 program). The simulation results obtained with the use of the computer model were similar to the parameter values of treated sewage obtained under operating conditions in sewage treatment plants.
The current (before changing the control system) annual electricity consumption used for the biological process of wastewater treatment in the reactor is presented in Figure 12.
The measurable effects of the optimization of the aeration process in the bioreactor chamber are presented in Figure 13. The reduction of the electricity consumption by 14% for blower drives in the aeration installation was obtained.
The optimization of electricity consumption by pump assemblies in the process of internal recirculation of wastewater from the outlet of the nitrification chamber to the denitrification chamber yielded savings, i.e., the reduction of energy consumption by 30%. (Figure 14).
The increase of energy efficiency of the wastewater treatment technological process (reduction of the total electricity consumption in the wastewater treatment plant by 11%) in the analyzed sewage treatment plant also translated into an economic effect, i.e., the total operating costs were reduced from EUR 103856.5 net to EUR 92423.00 net.

5. Conclusions

In effect of the completed research and development works we have developed advanced computational solutions per selected sectors in the context of the optimization of technology processes as an innovation and progress in improving energy efficiency of smart cities. We focused on the sectors of critical urban infrastructure, including in particular the use of algorithmic models based on artificial intelligence implemented in control systems (SCADA type, including virtual SCADA) supervising technological processes in the preparation and distribution systems of drinking water, in sewage treatment systems and in waste management systems.
The problem of optimizing the electricity consumption by technological processes in strategic sectors for urban agglomerations of water and wastewater management and waste management has been solved. The low energy efficiency of these processes results from the generation of erroneous control trajectories for actuators (motors driving pumps, fans) in supervisory control systems, determined by the lack of predictive diagnostics of the technological process (predictive diagnostics of device operating states) and predictive diagnostics of measurement data (in measuring tracks), as well as the lack of precise calibration of process models (including hydraulic) in real time.
The novelty of the presented solution involves the use of predictive diagnostic tools, based on multi-threaded polymorphic models supporting decision making in the control of complex technological process and objects of dispersed network systems (smart water grid, smart sewage system, smart waste management system) and solving the problems of optimal control for intelligent dynamic objects with logical representation of knowledge about the process, about the control object and the control process itself for which the learning process consists in successive validation and updating of knowledge and the use of the results of this updating to determine control decisions.
The advantage of the proposed solution in relation to the existing ones lies in the use of advanced models of predictive diagnostics, validation and reconstruction of data, implemented in functional tools, allowing the stabilization of the work of technological objects through the use of FTC technology (fault tolerant control) and soft sensors, predictive measurement path diagnostics (sensors, transducers), validation and reconstruction of measurement data from sensors in measuring paths in real time. The solution comprises two modules implementing validation methods based on the so-called quality levels to detect anomalies and missing data, and the data reconstruction method based on the method of space time series analysis used to estimate the missing/incorrect data.
The superiority of the discussed systems in relation to the existing ones lies, among others, in the application of MPC predictive control model, which is integrating the knowledge base on control objects and technological processes, models of state and event space. By using evolutionary strategies, the MPC is less sensitive to signal errors, and by the application of soft sensors and Performance Analysis Diagnostics & Optimization (PADO) and Complex Event Processing (CEP) technologies, it allows to generate optimal control trajectories for the supervisory control layer. The dedicated tools (Intelligent Real Time Diagnostic System − iRTDS) built into the system of a hierarchical, multi-threaded optimizing control system of SCADA system allow for advanced diagnostics of technological processes in real time using the HPC technology. By the application ofthe proprietary iRTDS tool, we can obtain a significant increase of energy efficiency of technological processes in key sectors of the economy, which in global terms, e.g., urban agglomeration, improves the economic efficiency. The application programming interface (API, for the needs to expand SCADA system) is delivered in the form of compiled .NET libraries as files (.dll), as the dedicated tools for control systems supervising technological processes in many industries, including in particular network companies in the energy, water and sewage and waste management sectors. The set of these tools comprises in particular the following, e.g., for such sectors as SMART Water Grid or SMART Sewage Grid, including the SMART Wastewater treatment plant:
  • Dedicated tool—Diagnostics and optimization of electricity consumption in network objects (pumps rooms, pumping stations, hydrophore rooms).
  • Dedicated tool—Validation and reconstruction of process data (Sensor Data Validation and Reconstruction).
  • Dedicated tool—Identification and diagnostics of errors (in real time) of measurement parameters in the hydraulic model and in the monitoring and control systems.
  • Dedicated tool—Current (in real time) control of the performance characteristics and load profile of pump units.
  • Dedicated tool—Diagnostics (in real time) of the operating point of pump units.
  • Dedicated tool—Optimization (in real time) of the efficiency of pump units, including motors, inverters, regulation systems.
  • Dedicated tool—Diagnostics (in real time) of error detection in the measuring paths of SCADA system.
  • Dedicated tool—Diagnostics and optimization of the control quality indicator.
  • Dedicated tool—Diagnostics and updating of pipeline characteristics.
The models presented in the article are available in the form of API, and thus they can be implemented in monitoring and control systems, providing advanced tools to expand the environment of SCADA systems with a thread optimizing the control of process parameters and thus to generate significant economic benefits.
In the case of the presented system supporting the production process of fuels (Section 4.1), a significant rise of economic efficiency was obtained for the company dealing with waste management in the town area. Another factor of key importance is that the potential of energy production from wastes has increased, leading to a significant reduction in the share of fuels from non-renewable sources on the energy production market.
The implementation of specialized solutions in the wastewater treatment plant (Section 4.2) has optimized the consumption of electricity in the process of biological treatment of municipal wastewater using multi-threaded polymorphic control systems.
Further research and development works are aimed at extending the precision and functionality of the methods of damage detection in measuring tracks and reduction of calibration errors of predictive models (including hydraulic and hydrodynamic in water and sewage systems) and reduction of prediction errors in control signal trajectories for executive devices controlled by freely programmable PLC controllers in SCADA systems, determining the increase in the quality indicator of technological processes control and the increase in energy efficiency of these processes.

Author Contributions

Conceptualization, K.G., A.G.; methodology, K.G.; validation, A.G., data curation, A.G.; writing—original draft preparation, K.G.; writing—review and editing, A.G.; supervision, K.G. and A.G. funding acquisition, K.G. All authors have read and agreed to the published version of the manuscript.

Funding

The work was performed in the framework of the national operational program project “publication supported within the Rector’s Professor’s Grant; Silesian University of Technology, 08/040/RGP19/0123”.

Acknowledgments

The authors wish to thank the employees of Water Company in Nowy Sącz (Poland) and ENCO Company for the authorization to conduct the tests and for their assistance in performing them and their professionality and availability.

Conflicts of Interest

The authors declare no conflicts of interest. The funders had no role in the design of the study; in the collection, analyses or interpretation of data; in the writing of the manuscript or in the decision to publish the results.

Abbreviations

ICTInformation and communications technology
SCADASupervisory Control And Data Acquisition
FTCFault Tolerant Control
HPCHigh Performance Computing
MPCModel Predictive Control
iRTDSintelligent Diagnostic System in Real Time
CEPComplex Event Processing
OPC UAOpen Platform Communications—Unified Architecture
PLCProgrammable Logic Controller
PADOPerformance Analysis Diagnostics & Optimization
SVMSupport Vector Machine
MCSVMMulti-Class Support Vector Machine
FPGAField Programmable Gate Arrays
ASICApplication-specific Integrated Circuit

References

  1. Nitivattananon, V.; Sadowsky, E.; Quimpo, R.G. Optimization of water supply system operation. J. Water Resour. Plan. Manag. 1996, 122, 374–384. [Google Scholar] [CrossRef]
  2. Tu, M.Y.; Tsai, F.T.C.; Yeh, W.W.G. Optimization of water distribution and water quality by hybrid genetic algorithm. J. Water Resour. Plan. Manag. 2005, 131, 431–440. [Google Scholar] [CrossRef]
  3. Westphal, K.S.; Vogel, R.M.; Kirschen, P.; Chapra, S.C. Decision support system for adaptive water supply management. J. Water Resour. Plan. Manag. 2003, 129, 165–177. [Google Scholar] [CrossRef] [Green Version]
  4. Brdys, M.A.; Ulanicki, B. Operational Control of Water Systems: Structures, Algorithms and Applications; Prentice-Hall International: New York, NY, USA, 1994. [Google Scholar]
  5. Butler, D.; Memon, F.A. Water Demand Management; IWA Publishing: London, UK, 2006. [Google Scholar]
  6. Cembrano, G.; Wells, G.; Quevedo, J.; Pérez, R.; Argelaguet, R. Optimal control of a water distribution network in a supervisory control system. Control Eng. Pract. 2000, 8, 1177–1188. [Google Scholar] [CrossRef] [Green Version]
  7. Maksimović, C.; Butler, D.; Memon, A.F.A.K. Advances in Water Supply Management. In Proceedings of the International Conference on Computing and Control for Water Industry, London, UK, 15–17 September 2003. [Google Scholar]
  8. Brdys, M.A.; Grochowski, M.; Gminski, T.; Konarczak, K.; Drewa, M. Hierarchical predictive control of integrated wastewater treatment systems. Control Eng. Pract. 2008, 16, 751–767. [Google Scholar] [CrossRef]
  9. Ocampo-Martínez, C. Model Predictive Control of Wastewater Systems; Springer: London, UK, 2010. [Google Scholar]
  10. Ocampo-Martínez, C.; Ingimundarson, A.; Puig, V.; Quevedo, J. Objective prioritization using lexicographic minimizers for MPC of sewer networks. IEEE Trans. Control Syst. Technol. 2008, 16, 113–121. [Google Scholar] [CrossRef]
  11. Pascual, J.; Romera, J.; Puig, V.; Creus, R.; Minoves, M. Operational predictive optimal control of Barcelona water transport network. In Proceedings of the 18th world congress of the International Federation of Automatic Control, IFAC’2011, Milano, Italy, 28 August–2 September 2011; pp. 10571–10578. [Google Scholar]
  12. Gaska, K.; Generowicz, A.; Zimoch, I. A high-performance computing (HPC) based integrated multithreaded model predictive control (MPC) for water supply networks. Arch. Civ. Eng. Environ. 2017, 10, 141–151. [Google Scholar] [CrossRef] [Green Version]
  13. Koseki, H. Evaluation of Various Solid Biomass Fuels Using Thermal Analysis and Gas Emission Tests. Energies 2011, 4, 616–627. [Google Scholar] [CrossRef] [Green Version]
  14. Guerrero, L.A.; Maas, G.; Hogland, W. Solid waste management challenges for cities in developing countries. Waste Manag. 2013, 33, 220–232. [Google Scholar] [CrossRef]
  15. Jewiarz, M.; Mudryk, K.; Wróbel, M.; Frączek, J.; Dziedzic, K. Parameters Affecting RDF-Based Pellet Quality. Energies 2020, 13, 910. [Google Scholar] [CrossRef] [Green Version]
  16. Antizar-Ladislao, B.; Turrion-Gomez, J.L. Decentralized Energy from Waste Systems. Energies 2010, 3, 194. [Google Scholar] [CrossRef] [Green Version]
  17. Brunner, P.; Rechberger, H. Waste to energy—Key element for sustainable waste management. Waste Manag. 2014, 1, 1–10. [Google Scholar] [CrossRef]
  18. Czop, M.; Poranek, N.; Czajkowski, A. Energetic usability and nuisance to the environment of selected fuels made of wastes. Przem. Chem. 2018, 97, 1460–1462. [Google Scholar]
  19. Gaska, K.; Generowicz, A.; Lobur, M.; Jaworski, N.; Ciuła, J.; Vovk, M. Advanced algorithmic model for poly-optimization of biomass fuel production from separate combustible fractions of municipal wastes as a progress in improving energy efficiency of waste utilization. E3S Web Conf. 2019, 122, 01004. [Google Scholar] [CrossRef]
  20. Gaska, K.; Wandrasz, A.J. Mathematical modeling of biomass fuels formation process. Waste Manag. 2008, 28, 973–985. [Google Scholar] [CrossRef] [PubMed]
  21. Longo, S.; d’Antoni, B.M.; Bongards, M.; Chaparro, A.; Cronrath, A.; Fatone, F. Monitoring and diagnosis of energy consumption in wastewater treatment plants. A state of the art and proposals for improvement. Appl. Energy 2016, 179, 1251–1268. [Google Scholar] [CrossRef]
  22. Daw, J.; Hallett, K.; Dewolfe, J.; Venner, I. Energy Efficiency Strategies for Municipal Wastewater Treatment Facilities; National Renewable Energy Laboratory: Golden, CO, USA, 2012. [Google Scholar]
  23. Di Matteo, U.; Nastasi, B.; Albo, A.; Astiaso Garcia, D. Energy Contribution of OFMSW (Organic Fraction of Municipal Solid Waste) to Energy-Environmental Sustainability in Urban Areas at Small Scale. Energies 2017, 10, 229. [Google Scholar] [CrossRef] [Green Version]
  24. Brdyś, M.A.; Chang, T.; Konarczak, K. Estimation of wastewater treatment plant state for model predictive control of N-P removal at medium time scale. In Proceedings of the IFAC 10th Symposium Large Scale Systems: Theoryand Applications, Osaka, Japan, 26–28 July 2004. [Google Scholar]
  25. Suchodolski, T.; Brdys, M.A.; Piotrowski, R. Respiration rate estimation for model predictive control of dissolved oxygen in wastewater treatment plant. In Proceedings of the 11th IFAC Symposium on Large Scale Systems: Theory and Applications, Gdansk, Poland, 23–25 July 2007; Elsevier: Laxenburg, Austria, 2008; Volume 11. [Google Scholar]
  26. Gaska, K.; Generowicz, A.; Lobur, M.; Jaworski, N.; Ciuła, J.; Mzyk, T. Optimization of Biological Wastewater Treatment Process by Hierarchical Adaptive Control. In Proceedings of the IEEE XVth International Conference on the Perspective Technologies and Methods in MEMS Design (MEMSTECH), Polyana, Ukraine, 22–26 May 2019; pp. 119–122. [Google Scholar] [CrossRef]
  27. Dellana, S.; West, D. Predictive modeling for wastewater applications: Linear and nonlinear approaches. Environ. Model. Softw. 2009, 24, 96–106. [Google Scholar] [CrossRef]
  28. Dudley, J.; Buck, G.; Ashley, R.; Jack, A. Experience and extensions to the ASM2 family of models. Water Sci. Technol. 2002, 45, 177–186. [Google Scholar] [CrossRef]
  29. Rosen, C.; Larsson, M.; Jeppsson, U.; Yuan, Z. A framework for extreme-event control in wastewater treatment. Water Sci. Technol. 2002, 45, 299–308. [Google Scholar] [CrossRef]
  30. Yamashita, T.; Shiraishi, M.; Yokoyama, H.; Ogino, A.; Yamamoto-Ikemoto, R.; Osada, T. Evaluation of the Nitrous Oxide Emission Reduction Potential of an Aerobic Bioreactor Packed with Carbon Fibres for Swine Wastewater Treatment. Energies 2019, 12, 1013. [Google Scholar] [CrossRef] [Green Version]
  31. Smol, M.; Włodarczyk-Makuła, M. Effectiveness in the Removal of Polycyclic Aromatic Hydrocarbons FromIndustrial Wastewater by Ultrafiltration Technique. Arch. Environ. Prot. 2013, 38, 49–58. [Google Scholar] [CrossRef] [Green Version]
  32. Drewnowski, J.; Remiszewska-Skwarek, A.; Duda, S.; Łagód, G. Aeration Process in Bioreactors as the Main Energy Consumer in a Wastewater Treatment Plant. Review of Solutions and Methods of Process Optimization. Processes 2019, 7, 311. [Google Scholar] [CrossRef] [Green Version]
  33. Santos-Clotas, E.; Cabrera-Codony, A.; Castillo, A.; Martín, M.J.; Poch, M.; Monclús, H. Environmental Decision Support System for Biogas Upgrading to Feasible Fuel. Energies 2019, 12, 1546. [Google Scholar] [CrossRef] [Green Version]
  34. Godo-Pla, L.; Emiliano, P.; Valero, F.; Poch, M.; Sin, G.; Monclús, H. Predicting the oxidant demand in full-scale drinking water treatment using an artificial neural network: Uncertainty and sensitivity analysis. Process Saf. Environ. 2019, 125, 317–327. [Google Scholar] [CrossRef]
  35. Garrido-Baserba, M.; Reif, R.; Hernández, F.; Poch, M. Implementation of a knowledge-based methodology in a decision support system for the design of suitable wastewater treatment process flow diagrams. J. Environ. Manag. 2012, 112, 384–391. [Google Scholar] [CrossRef]
  36. Drewnowski, J. Advanced supervisory control system implemented at full-scale WWTP—A case study of optimization and energy balance improvement. Water 2019, 11, 121. [Google Scholar] [CrossRef] [Green Version]
Figure 1. Logical structure of the virtualized research space model [own elaboration].
Energies 13 03338 g001
Figure 2. Specialized platform of the virtual laboratory EnviroLab [own elaboration] [12].
Energies 13 03338 g002
Figure 3. Topology of the optimization control system [12].
Energies 13 03338 g003
Figure 4. Block diagram of the ballistic and optical separation processes separated from the technological line[own elaboration].
Energies 13 03338 g004
Figure 5. Interpretation of the margin of separation between data classes.
Energies 13 03338 g005
Figure 6. Diagram of the biological wastewater treatment system [own elaboration].
Energies 13 03338 g006
Figure 7. Simulation results for a variable raw sewage stream. The classic closed-loop control in red was marked in blue, using the MPC controller; (NH4) ammonia concentration, (NO3) nitrate concentration, (O2) dissolved oxygen concentration in nitrifying chambers, (n) blower speed, influent flow rate (feed) [own elaboration].
Energies 13 03338 g007
Figure 8. Block diagram of the process of municipal waste segregation with the production of the formed fuels [own elaboration].
Energies 13 03338 g008
Figure 9. Trajectories of oxygen concentration (reference and realized) in the oxygen chamber 1 [own elaboration].
Energies 13 03338 g009
Figure 10. Trajectories of oxygen concentration (reference and realized) in the oxygen chamber 2 [own elaboration].
Energies 13 03338 g010
Figure 11. Changes in the concentration of ammonium nitrogen (a) and nitrate nitrogen (b) in the both nitrifying chambers at different concentrations of dissolved oxygen [own elaboration].
Energies 13 03338 g011
Figure 12. Amount of electricity used exclusively in the biological wastewater treatment process.
Energies 13 03338 g012
Figure 13. Results of the optimization of aeration process in the bioreactor.
Energies 13 03338 g013
Figure 14. Results of energy optimization of the internal recirculation process.
Energies 13 03338 g014
Table 1. Properties of molded fuel-values required by cement plants.
ItemParameterRequired Value
1.Calorific value≥15 000 kJ/kg
2.Ash content≤20.0%
3.Total sulfur content≤2.0%
4.Chlorine content≤1.0%
5.Granulation≤40 mm
6.Moisture content≤30%
7.Average bulk density0.2 Mg/m3–0.6 Mg/m3
8.Scrap content≤0.5%
Table 2. Permissible values of the share of heavy metals in the molded fuel.
ParameterPermissible Value [ppm]
Total (As, Co, Ni, Sb, Pb, Cr, Cu, Mn, V)1000
Table 3. The results of the carried out tests (A and B)—result of application the classic control algorithm (Test A) and using the author’s algorithm presented in Section 3.1.1.1 (Test B).
ItemFractionTest A [Mg]Test B [Mg]
1Undersize fraction3.7 (20.33%)1.79 (9.84%)
2Oversize fraction2.42(13.30%)3.1 (17.03%)
3 RDF fuel10.74 (59.01%)13.3 (73.08%)
4Loss1.34 (7.36%)0.01 (0.05%)
Table 4. Parameters of obtained hybrid fuel.
ItemParameterRequired Value
1.Calorific value24.31 MJ/kg
2.Ash content8%
3.Total sulfur content1.4%
4.Chlorine content0.21%
5.Granulation30–38 mm
6.Moisture content24%
7.Average bulk density0.48 Mg/m3
8.Scrap content0.32%
Table 5. Mass composition of components C1 and C2.
Fuel ComponentsMass Fractions in Components C1 and C2 (kg i/kg)
cshonwpcl
C1 (dark coal)0.603500.002700.041000.089700.000100.071400.184200.00740
C2 (light-caloric fraction)0.500100.009200.067600.218600.135800.020000.047100.00160
Table 6. Constraints for optimization procedure.
Mass Fraction in Formed Fuel (kg i/kg)
cshonwpcl
Criterium <0.016 <0.0024
Table 7. RMSE prediction error with preset parameters Hp, T in oxygen chambers 1, 2 of the biological reactors.
MPC—ParametersRoot Mean Square Error
RMSE
Prediction Horizon
Hp
Time
T [min]
Oxygen Chamber 1Oxygen Chamber 2
550.0410.037
10100.0470.042

