Abstract
In this study, an analysis is carried out to determine the optimal application of multiple renewable energy resources, namely wind and solar, to provide electricity requirements for green smart cities and environments. This was done to determine the potential of renewable energy to provide clean, economically viable energy for the case study of Zagazig, located at 30°34′ N 31°30′ E in the North East of Egypt. The relevant data surrounding the production of energy were collected, including the meteorological data from NASA, and specifications regarding renewable resources including solar panels, wind turbines, and storage batteries. Then a hybrid model was constructed consisting of Photovoltaics (PV) panels, wind turbines, a converter, and storage batteries. Once the model was constructed, meteorological data were added alongside average daily demand and cost of electricity per kWh. The optimal solution for Zagazig consisted of 181,000 kW of solar panels feeding directly into the grid. This system had the lowest Net Present Cost (NPC) of the simulations run of US$1,361,029,000 and a net reduction of 156,355 tonnes of CO2 per year.
1. Introduction
Renewable energy is one of, if not the, fastest-growing sectors when it comes to electricity sources. In many countries, including the US, renewable energy is the fastest-growing energy source; renewable capacity increased in the US by 100% from 2000 to 2018. Globally, renewables made up 24% of electricity generation in 2016. This is expected to rise to 45% by 2040 and this rise is expected to come mostly from wind, solar and hydropower [1]. As of 2016, four countries had a Renewable Fraction (RF) of 100%, meaning that 100% of the electricity demand was generated from renewables. These countries were Paraguay, Iceland, Democratic Republic of Congo, and Albania [2]. This shows that renewable energy has the potential to meet a large amount of a country’s electricity demand provided sufficient resources are available. The reason these four countries have a large RF is because they have access to large quantities of hydropower due to the particular geography of their country. This factor, in combination with a relatively small demand, results in an extremely high RF. For many countries, achieving this level of RF is much more difficult. Many countries do not have the option of large-scale hydropower available to them and hence alternative renewable resources must be used instead. It is, therefore, important to look at alternative, more commonly found renewable resources such as wind and solar energy [3]. Each country should determine what renewable energy solution is optimal for them, and this solution should provide electricity that both reduces CO2 emissions and creates economic opportunities for growth based on the available resources. Manmade climate change is increasingly at the forefront of both national and international concerns. Several countries have started this transition towards renewable energy resources based on their geographical locations and local resources.
Solar based energy is an important sector within energy generation due to its versatility. Solar energy can be harnessed directly from the sun even in cloudy conditions and can be harnessed in multiple ways including generating power [4], desalinating seawater [5,6] and heating water [7,8,9]. Therefore, sustainable technologies are applicable to MENA (Middle East and North Africa) countries where freshwater sources are persistently over-used and renewable sources of energy are widely procurable. Solar power alongside other renewable energy sources has the potential to allow these countries to meet their needs for both electricity and water and potentially offer surplus electricity to export to other countries.
The MENA region has one of the highest potentials for solar energy in the world, reaching as high as 2200 kWh/kWp per year. Despite the region’s abundance of solar irradiance, the solar industry in many of the countries within this region remains relatively small compared to their potential. The total share of renewables made up 0.6% across the GCC countries (Bahrain, Kuwait, Oman, Qatar, Saudi Arabia, and the UAE) [10]. Saudi Arabia developed several solar based projects to improve its energy resources using its available intense solar energy [11,12,13]. In the MENA region, Egypt has been investing heavily in renewables, specifically solar energy. Egypt has a great potential for solar and wind energy technologies [14]. Currently, the Egyptian government’s target is to provide 20% of Egypt’s electricity mix through renewables by 2022 and 42% by 2035. This would require an estimated US$6.5 billion per annum investment to reach this target, which is an increase over the current investment of US$4.3 billion per annum [15]. This country has begun to realise the potential of solar energy and has recently completed construction of the first of 41 plants making up Benban Solar Park [16].
The park has a capacity of 1.8 GW and is estimated to reduce CO2 emissions by about 2 million tonnes every year. This project highlights Egypt’s willingness to invest in solar energy and backs up its claims that it will produce 20% of its electricity from renewable sources by 2022. The Egyptian energy demand is set to increase from 27.6 GW in 2018 to 67 GW by 2030 [17]. Meeting this demand through locally sourced solar energy is an attractive solution. This would have many advantages, such as reduced dependence on potentially unreliable imported energy as well as being an investment in future industries that creates jobs and helps to meet the country’s renewable targets.
Wind is the second-largest renewable energy source for power generation, producing more than 5% of global electricity in 2019, with 651 GW capacity. Onshore wind makes up the majority of this capacity with 622.6 GW [18]. The growth of wind power was highlighted in recent years as one of the fastest growing of all renewable energy technologies. According to their report, onshore and offshore wind have increased in capacity by 556.5 GW between 1997 and 2018, which is a factor of almost 75 which attributes this rise globally to the falling costs of wind power generation [19]. This is also a very good source of renewable energy for Egypt.
Figure 1 illustrates the solar potential in Egypt in kWh/kWp. From this image it is clear that Egypt has a large solar potential. The legend shows average daily photovoltaic output ranging from 4.6 to 5.8 kWh/kWp and annual totals ranging from 1680 to 2118 kWh. The lower PV potential is at the mouth of the Nile river just North of Cairo.
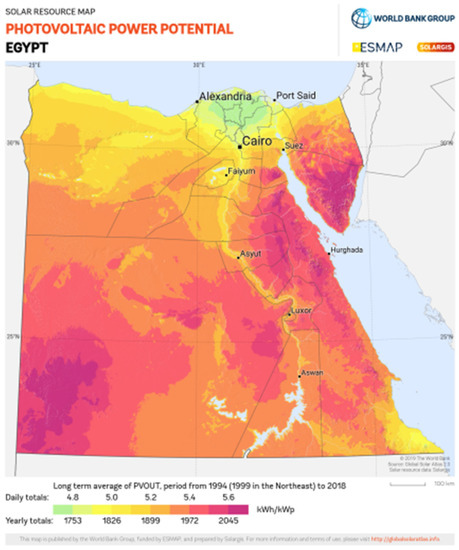
Figure 1.
Specific solar energy output of Egypt, Reproduced from [20]., World Bank Group: 2018.
Egypt is within the lower half of the legend range. According to this figure Zagazig has a mean wind power density slightly below 200 W/ (See Figure 2). This may imply a lesser wind focus when supplying electricity in Zagazig.
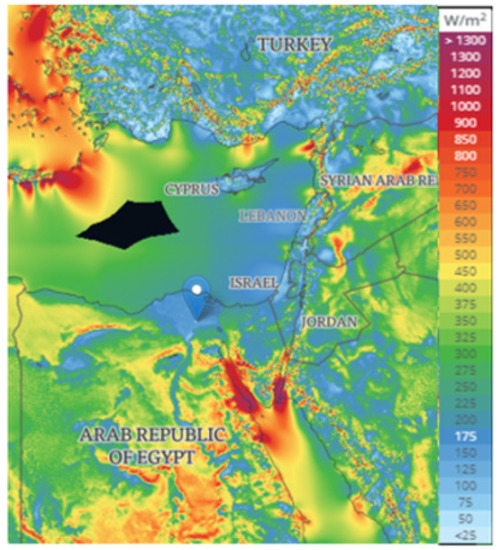
Figure 2.
Wind energy potentials across Egypt, Reproduced from [21] Energy data information: 2020.
This study aims to determine what hybrid energy systems [22] would be optimal for the city of Zagazig in Egypt (see Figure 3) by modelling its population and energy demand. A hybrid power generation system was developed for the city of Zagazig to determine whether renewably sourced electricity could be economically feasible whilst reducing CO2 emissions based on an optimal solution, alongside calculating other economic and environmental conditions.
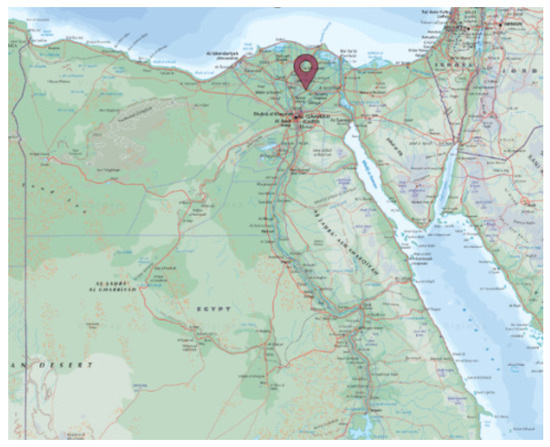
Figure 3.
Location of Zagazig, coordinates: 30°34′ N 31°30′ E [23].
A database including solar panel costs, wind turbine costs, and other monetary investments was used for this study. Meteorological data such as wind speed and photovoltaic intensity were collected from the NASA database [24]. The application and integration of renewable energy have become a subject of increasing importance within modern society based on the 2017 Paris agreement. One of the problems solar energy must overcome is the huge amount of land that panels require; many more densely populated countries may struggle to find this space. However, there are solutions to this problem. For example, roof space can be utilised within cities to supply this space without using limited open spaces within cities which works for Egypt [25,26]. Another solution to the large area that solar panels require to be effective is to use otherwise unused space or isolated regions [27].
Another issue with using solar energy for electricity generation is the difficulty in storing large quantities of electricity [28]. The reason a large amount of storage is needed is because the supply of electricity produced by the solar panels seldom correlates with the energy demand. This means that solar energy is not able to be used to its full potential due to its inability to consistently meet demand. A solution to this issue is to use converters and batteries that can store energy during a surplus and release it during a deficit, allowing solar energy to consistently meet demand provided there is a high enough capacity. Many companies are working on solving the battery problem faced by solar power. One example of this is the Tesla Powerwall which is a power pack that can be used for larger-scale storage and can be scaled. This power pack has a 232 kWh energy capacity and could potentially be used alongside renewable energy sources [29]. Batteries could be an important factor in allowing renewable energy sources to be used more efficiently and on a larger scale. Once the problem of storage is solved, the potential for renewable energy will become even higher. Cheap efficient storage could allow renewable energy to meet a greater demand due to the ability to store energy when a surplus is being produced. This would mean that provided the capacity of the PV and storage were high enough, solar could theoretically provide 100% of the load demand. For this reason, batteries and converters were chosen to be part of the hybrid model as they could potentially allow wind and solar energies to provide a greater percentage of the electricity demand.
2. Materials and Methods
2.1. Case Study: Zagazig, Egypt
Zagazig is located at 30°34′ N 31°30′ E in the North East of Egypt. As with other Egyptian cities, it has enormous potential for solar energy due to its latitude, having a very high solar irradiance and also has a mean wind power density of about 650 W/m2.
2.2. Input Data
An estimate of Zagazig’s electricity usage was calculated using the World Bank data from 2014, which states that the electricity consumption per capita per annum in Egypt is 1657.77 kWh. This value was multiplied by the population of Zagazig (approximately 500,000) and divided by 365 to obtain an estimate for the daily electricity consumption of Zagazig. This gave a value of 2270.9 MWh/day which was rounded to 2000 MWh/day. Once the average daily consumption was obtained, the yearly profile could then be calculated. The yearly profile of load demand was synthesised using the pre-set yearly seasonal profile supplied by the HOMER software (HOMER Grid, Version 1.7, Boulder, CO, USA) [27], which was scaled to have the average daily load demand of 2000 MWh/day.
Figure 4 shows an estimate for the annual load demand for Zagazig across 2020. This heat map shows when the most energy is consumed.
Figure 4.
Seasonal profile of energy usage based on the input data from [24].
The heat map (Figure 5) shows the maximum demand is 411.66 MW occurring between 18:00 and 21:00. This pattern of the highest daily demand occurring during this time continues throughout the rest of the year. The cost of electricity in Egypt was taken about US$0.178 per kWh.
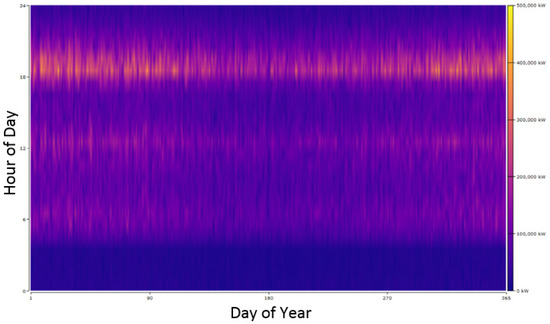
Figure 5.
Heat map of energy consumption based on the input data from [24].
In order to generate synthetic wind data, wind resources were downloaded from the internet and input into HOMER. These resources included average monthly wind speeds, Weibull k, 1-h autocorrelation factor, diurnal pattern strength, and hour of peak wind speed. From these resources, HOMER synthesised wind data for Zagazig, which were then used to calculate the power output of the wind turbines using the Wind shown in Figure 6.
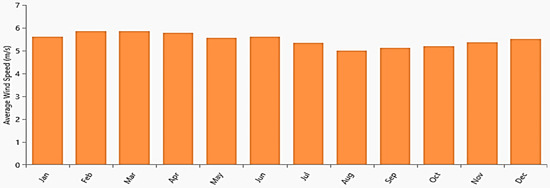
Figure 6.
Monthly average wind speed data, Zagazig based on the input data from [24].
The synthetic hourly solar data from the monthly average data are based on the solar intensity data for Zagazig, which were obtained from NASA’s Surface meteorology and Solar Energy database. The synthesised data obtained for Zagazig are shown in Figure 7. This figure includes a clearness index, which is a measure of the clearness of the atmosphere. This is given as a dimensionless number between 0 and 1, with 1 being 100% of the extra-terrestrial solar radiation hitting the surface. A high value on this scale indicates a clear day and a low number indicates cloudy conditions. The values shown in the solar intensity graphs are an average for their respective months. The annual GHI for Zagazig (in Figure 7) has an average daily radiation of 5.19 kWh//day with a clearness fluctuating between 0.53 and 0.65.
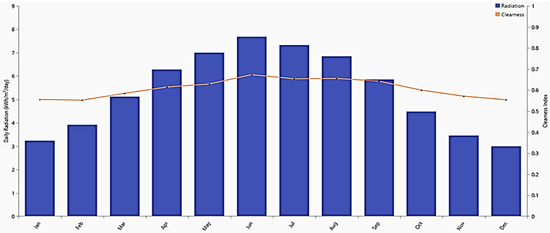
Figure 7.
Solar global horizontal irradiance (GHI), Zagazig based on the input data from [24].
2.3. Simulation
The HOMER software was chosen because of its ability to create a hybrid model for different energy resources such as wind and solar which have been used in previous studies [30,31]. For the simulation, firstly, the load demand was determined which gave the scale at which the hybrid system must operate. This is an important factor to consider in the creation of an optimal hybrid system. Secondly, data regarding solar irradiance (GHI) and wind speed were collected and imported into the HOMER energy software. Each component within the system was then selected and the data for these were imported into HOMER. These components included varying wind turbines, solar panels, batteries, and converters. HOMER’s optimisation model is based on the system power’s physical behavior, and its related cost. The software compares different designs based on their technical and economic values. This is mainly to find the best configuration at the lowest life-cycle cost. The results help the system designer to control the decision variables such as the PV array size, the number of wind turbines, or the batteries to achieve the least possible net present cost [27].
Batteries were used to store excess energy should the renewable electricity sources generate more than the required load at any given point. The electricity could then be released later when the demand exceeds the supply. To store electricity in a battery, it must first be converted from AC to DC, which is why a converter is needed if a battery is to be used. Thirdly, once the components had been chosen, they were built into a functional model. The model was ordered to run producing average daily power of 2000 MWh. To aid with the optimisation of these variables, the HOMER optimiser was used. This software uses an algorithm to identify the best hybrid compositions of elements for a given desired outcome. For this model, 10,000 simulations were run, and the system was optimised to find the solution with the lowest Net Present Cost (NPC). Other factors were calculated, including the Cost of Energy (COE), CO2 emissions, and payback time. Once the load demand was determined, the potential components could be added. These components consisted of generic PV panels and G10 wind turbines as well as a converter and a lithium-ion battery to store excess energy produced. The volume of each of these components was optimised using the HOMER optimiser. For the generic PV panels and wind turbines, additional data needed to be input in order for the synthesised data to be produced. The PV panels required solar intensity data from NASA’s Surface meteorology and Solar Energy database and the G10 wind turbines required average monthly wind speeds, Weibull k, 1-h autocorrelation factor, diurnal pattern strength, and hour of peak wind speed, all of which were downloaded from the HOMER website. In this study, G10 wind turbines were simulated, due to their ability to be more easily constructed in the rural outer area of Zagazig. Smaller wind turbines also have the advantage of a more consistent electricity output providing stability.
Figure 8 depicts a representation of the hybrid system used for decarbonising the energy demand through the combination of wind and solar energy with excess energy stored in batteries. The left-hand side of this schematic shows the components that provide AC towards the demand load. These energy sources include electricity provided by the grid and wind turbines. PV provides electricity in the form of DC, this alongside electricity released by the Absorbent Glass Mat (AGM) batteries, must be converted to AC to be of use to the demand load. Therefore, the schematic includes converters to allow electricity from PV and LI ASM batteries to contribute towards the load demand. Alongside this, it allows the components that generate AC to store electricity by directing electricity into the LI ASM batteries via the converter.
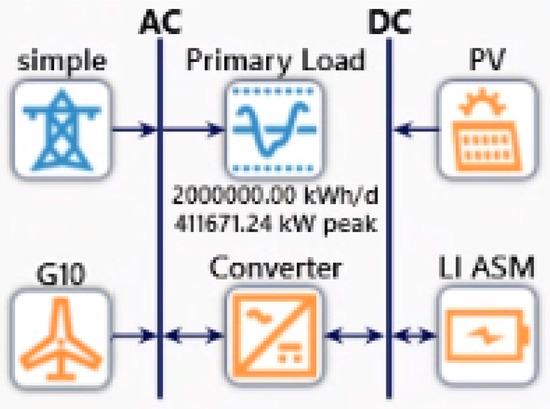
Figure 8.
Schematic presentation of the developed model.
Table 1 shows the initial cost of the varying components: PV, LI ASM batteries, and 10 kW wind turbines within the schematic, as well as the constant values within the schematic which are the converter’s properties as well as the economic factors. It should be noted that the cost per kW of PV in system 5 is lower than the previous three systems due to the way in which the cost per unit is calculated. HOMER uses a cost curve [32] to calculate the cost per kW capacity. Since system 5 has a higher solar capacity compared to systems 2–4 the cost is US$2 less per kW than within the other systems.

Table 1.
Details of the model components for Zagazig.
Table 2 shows the operation and maintenance and lifetimes of the generic flate-plate PV, LI ASM battery, and generic 10 kW wind turbine. These values remain constant throughout the systems.
Table 2.
Operational and maintenance costs of components.
The converter is needed to change the current from alternating current to direct current so that it can be stored. If the renewable energy resources do not meet the demand load, then energy can be transferred from the battery to the demand load in the opposite conversion via the converter. During both directions of this conversion, some energy is lost and therefore this stored energy is not 100% efficient.
The wind turbine power output was evaluated using Equation (1):
where:
- = the wind speed at the hub height of the wind turbine (m/s),
- = the wind speed at the anemometer (m/s),
- = the hub height of the wind turbine (m),
- = the anemometer height (m),
- = the power-law exponent.
After calculating hub height wind speed, HOMER refers to the wind turbine’s power curve in Figure 9 to determine the expected power output from the wind turbine at the given wind speed under standard conditions of temperature and pressure.
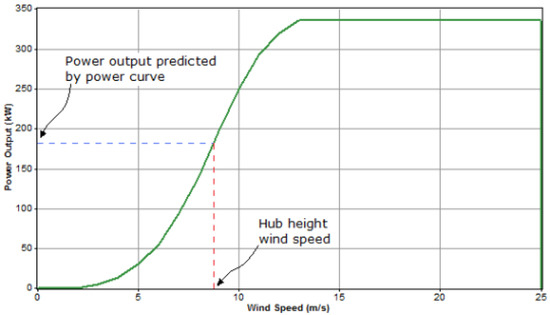
Figure 9.
Wind speed to power output transformation graph, based on the input data from [24].
The density of the air is assumed to be consistent. Using Equation (2), the output of PV array is then calculated:
where:
- = the rated capacity of PV array, meaning its power output under standard test conditions (kW),
- = the PV derating factor (%),
- = the solar radiation incident of the PV array in the current time step (kW/m2),
- = the incident radiation at standard test conditions (1 kW/m2),
- = the temperature coefficient of power (%),
- = the PV cell temperature in the current time step (°C),
- = the PV cell temperature under standard test conditions (25 °C).
The PV model chosen was a generic flat-plate PV, which has an efficiency of about 13% and a lifetime of 25 years. The initial cost of the array differed depending on the capacity of the array used. The cost per kW capacity of the PV was calculated using the cost curve provided by HOMER [33].
This is based on the cost per kW capacity of the PV array on the total capacity and resulted in larger arrays having a lesser cost per kW capacity as shown in system 5.
Figure 10 illustrates the PV power ouput distrubution of system 2. The figure shows that the system’s peak power output is around 200,000 kW and occurs during midday, this distribution is expected and each system including PV will show a similar distribution with slightly varying values. For this reason it was decided that only the PV power output for system 2 would be included.
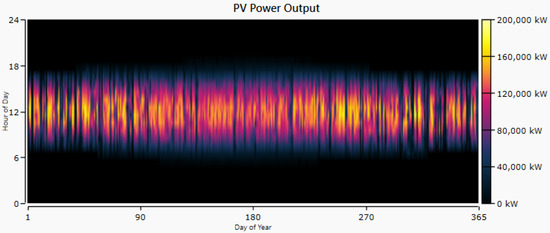
Figure 10.
PV power output, Zagazig.
A converter was assumed for simulations that included storage in the form of a battery. It was assumed that the converter was 90% efficient with a lifetime of 20 years and cost US$300 for a 1 kW converter. The storage chosen was an LI ASM battery that uses a modified kinetic storage model. This model is based on Manwell and McGown [34] and calculates the amount that a storage bank can absorb or release at each time interval. The storage is modelled as a two-tank system that separates the bound energy, which is the energy that cannot be used, from the available energy. The grid used simple rates, which allowed a constant power price and sell-back price to be set. The grid meets the demand for electricity and therefore the renewable sources within the hybrid system only act to provide the grid with low carbon electricity towards this demand.
The net present cost (NPC) is defined as the total life cost of the system minus the present value of all the revenue it earns in its lifetime. The cost of energy (COE) is analysed as the average cost per kWh of electrical energy produced by the system, using Equation (3):
where:
- boiler marginal cost (US$/kWh),
- total thermal load served (kWh/year).
However, in wind and PV systems, the thermal load () is zero. Therefore, the equation is:
where:
- total annualised cost of the system (US$/year),
- total electrical load served (kWh/year).
3. Results and Discussion
The optimal solutions are presented for each combination of components that have a lower NPC than the base system whilst providing the load demand. Table 3 shows the most optimal systems in terms of NPC for each combination of components (systems 2–5) as well as the base system (system 1).
Table 3.
Scenarios of the developed model for Zagazig.
The system with the highest RF is system 5 with 41.9%. This system consists of 193,000 kW of solar, 10 kW energy from the wind turbines, and 6375 kWh of ASM batteries. This system has the lowest CO2 emissions of 295,369 tonnes per year. Despite having the highest RF, system 5 has the highest NPC excluding the base system, and therefore this system was not chosen. The system with the lowest NPC is system 2 with US$1357 m which is US$18,953,000 less than system 5. System 2 has a cost of electricity US$0.045 per kWh less than system 1 and a Capital expenditure (CAPEX) $444,502,000 cheaper than system 5. System 2 is the optimal system according to NPC and still results in a reduction of 156,355 tonnes of CO2 per year. The most optimal system in terms of NPC was system 2. This option comprised of 181,000 kW of solar energy feeding straight into the grid. The CAPEX of system 2 was US$243,665,100 and had a predicted lifetime of 25 years. The estimated total lifetime savings for system 2 was US$1,100,919,500 with a payback time of 5.6 years. This system would reduce the amount of CO2 emissions when compared to using the grid electricity of 156,355 tonnes per year, resulting in a reduction throughout its lifetime of 3,908,875 tonnes. The cost of electricity produced by this system is estimated at US$0.133 per kWh. Table 4 shows the important results for the most optimal system (system 2) including payback time and annual CO2 emissions.
Table 4.
Zagazig optimal proposed system.
The additional power needed to be purchased for each hour of an average day in each month is presented in the Supplementary Materials (S1). Since the graphs are constructed using the base system (system 1), the power supplied is entirely purchased from the grid. These graphs are useful for comparative purposes since they show a system in which no renewable energies are present and hence any changes to these graphs can purely be attributed to wind or solar energy being present in the system.
A summary of system 2′s performance which can generate 181,000 kW of solar energy potentially is illustrated (S1). The primary graph illustrates the total renewable output of system 2 shown in green, which is equivalent to the solar output (in yellow). Alongside this the grid purchases are shown (in black), giving an overview of when renewable energy is most usable and when grid purchases are most needed. The solar energy is shown to generate most of its electricity between the hours of 6 a.m. and 5 p.m. This is reflected in the black line as there is a significant drop in the need for grid purchases during these hours. The secondary graph illustrates the same plot of grid purchases seen in the primary graphs but now is illustrated in red. The secondary graph overlays these grid purchases with the purchases in the base system. This allows direct comparison between the purchases in the base system and the purchases in system 2. The secondary graphs show that, overall, less energy is required to be purchased in system 2 compared to the base system. This is mostly due to purchasing less during daylight hours as solar energy provides the electricity that would otherwise need to be purchased. During the non-daylight hours (roughly 5 p.m.–6 a.m.) the grid purchases remain the same.
Figure 11 illustrates the reduction in raw CO2 when comparing the CO2 produced by the base system to the optimal solution (system 2). This raw reduction between the two system was estimated by HOMER to be 156,355 tonnes per year, or a percentage reduction of 33.9%. Compared to the base system, system 2 also reduced NPC by US$322,106,000. These results show that using system 2, Egypt can provide more economically and environmentally beneficial electricity through the implementation of solar energy. This is under the assumption that the cost of electricity is US$0.178.
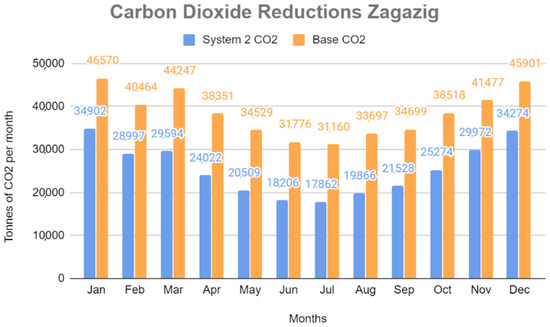
Figure 11.
CO2 emissions, Zagazig.
In this study, the NPC was the main weighted metric, and therefore, the systems with batteries were not optimal by this parameter. However, in future, the application of batteries alongside renewable sources could be considered more optimal. Firstly, a higher importance placed on decreasing CO2 emissions could lead to taxes on these emissions, resulting in the use of batteries to store additional renewably produced electricity to become the most economically optimal solution for providing load demand. Secondly, if a more cost-effective battery were developed and applied to a similar model, the resultant NPC of the systems including batteries could significantly decrease. This battery-based system could then become the most optimal in terms of NPC. Both scenarios have the potential to occur within the near future, especially the increase in battery efficiency.
Table 5 shows the composition of the electricity produced by system 2 both in terms of raw production (kWh/year) as well as percentage (%).
Table 5.
Optimal system electricity production, Zagazig.
In regards to the surface area required for the systems, it can be shown that it is technically feasible to easily accommodate 181,000 kW of PV. The total area around Zagazig is 726 km2 (see Figure 12) and the area of Zagazig that has been urbanised (see Figure 13) is 26.3 km2, which is unable to be used for PVs. The difference between these two areas, and hence useable land for solar panels, is 699.7 km2 (roughly 700 km2). The area required for the PV panels in system 2 is the PV capacity, 181,000 kW, multiplied by the area per kW of solar panels. Each kW requires an area of a 10 m2 of land. Therefore, the total area required to facilitate 181,000 kW capacity of PV is about 1.81 km2 which is feasible in the available area of 700 km2 to decarbonise this city.
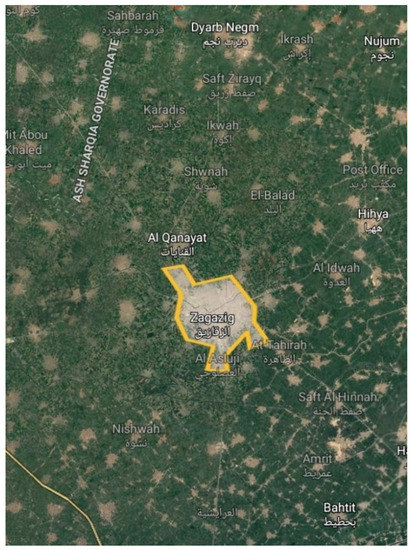
Figure 12.
Urbanised area of Zagazig.
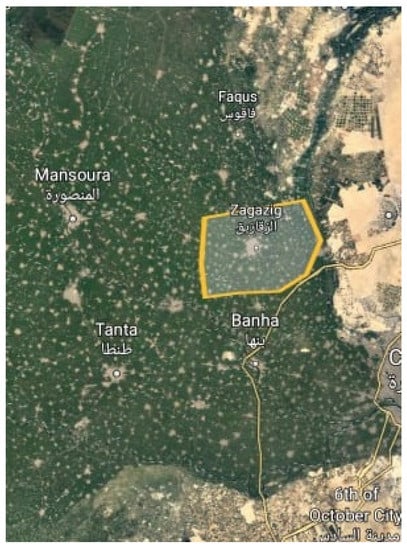
Figure 13.
Total area of Zagazig.
4. Conclusions
This simulation showed that renewable energy could not only be environmentally more beneficial but also it has the potential for economic profitability if applied correctly. That is to say, the composition of the optimal solutions strongly correlated to the resources available in the respective location resulting in significant reductions in CO2 emissions of about 156,355 tonnes per year, for the city of Zagazig, this is a reduction of roughly 33.9% when compared to the base system using the grid. This shows how cities around the world can plan towards decarbonising their societies using renewable energy resources. In conclusion, Zagazig would benefit from the implementation of renewable resources being used in parallel with non-renewable sources currently already in place to meet demand. It should be noted further research into the social and technical feasibility of implementing large scale PV has the potential to be a more environmentally and economically sustainable solution for energy production. This study has theoretically proven that a hybrid system in which wind turbines and PV are utilised smartly and appropriately, can improve upon the current system of electricity generation.
Supplementary Materials
The following are available online at https://www.mdpi.com/1996-1073/13/18/4680/s1. Figure S1. Monthly plots of peak day grid purchases for the base case (System 2) during January-March. Figure S2. Monthly plots of peak day grid purchases for the base case (System 2) during April-June. Figure S3. Monthly plots of peak day grid purchases for the base case (System 2) during July-September. Figure S4. Monthly plots of peak day grid purchases for the base case (System 2) during October-December.
Author Contributions
Conceptualization, M.A., S.J.G., M.D.; methodology, M.A., S.J.G.; software, M.A.; validation, M.A., S.J.G.; formal analysis, M.A., S.J.G.; investigation, M.A., A.A.J., A.N.; resources, M.A., A.A.J.; data curation, M.A., M.D., S.J.G.; writing—original draft preparation, M.A., S.J.G.; writing—review and editing, M.A., M.D., A.A.J., R.F., A.N., H.E.S.F.; visualization, S.J.G., M.A., A.H.S.; supervision, M.A., A.A.J.; project administration, M.A.; funding acquisition, A.A.J., A.N., R.F. All authors have read and agreed to the published version of the manuscript.
Funding
This paper is based on work that supported by the British Council (BC) of UK, Grant No. (332435306) and Science, Technology, and Innovation Funding Authority (STIFA) of Egypt, Grant No. (30771), through the project titled “A Novel Standalone Solar-Driven Agriculture Greenhouse-Desalination System: That Grows its Energy and Irrigation Water” via the Newton-Musharafa funding scheme.
Acknowledgments
The authors would like to appreciate the anonymous reviewers for their insightful comments and suggestions.
Conflicts of Interest
The authors declare no conflict of interest.
Nomenclature
| AC | Alternating Current |
| CAPEX | Capital Expenditure |
| CO2 | Carbon dioxide |
| COE | Cost of Energy |
| DC | Direct Current |
| HOMER | Hybrid Optimisation for Multiple Energy Resources |
| LCOE | Levelised Cost of Energy |
| NASA | National Aeronautics and Space Administration |
| NPC | Net Present Cost |
| OPEX | Operational expenditure |
| PV | Photovoltaics |
| RF | Renewable Fraction |
References
- Murdock, H.E.; Gibb, D.; André, T.; Appavou, F.; Brown, A.; Epp, B.; Kondev, B.; McCrone, A.; Musolino, E.; Ranalder, L. Renewables 2019 Global Status Report. 2019. Available online: https://wedocs.unep.org/bitstream/handle/20.500.11822/28496/REN2019.pdf?sequence=1&isAllowed=y (accessed on 10 March 2020).
- Zervos, A.; Adib, R. REN21, Renewables 2018 Global Status Report. Renewable Energy Policy Network for the 21st Century. 2018. Available online: https://www.ren21.net/wp-content/uploads/2019/08/Full-Report-2018.pdf (accessed on 10 March 2020).
- Sayigh, A. Solar and Wind Energy Will Supply More Than 50% of World Electricity by 2030. In Green Buildings and Renewable Energy; Springer: Berlin/Heidelberg, Germany, 2020; pp. 385–399. [Google Scholar]
- El-Shimy, M. Viability analysis of PV power plants in Egypt. Renew. Energy 2009, 34, 2187–2196. [Google Scholar] [CrossRef]
- Fath, H.E.; Elsherbiny, S.M.; Hassan, A.A.; Rommel, M.; Wieghaus, M.; Koschikowski, J.; Vatansever, M. PV and thermally driven small-scale, stand-alone solar desalination systems with very low maintenance needs. Desalination 2008, 225, 58–69. [Google Scholar] [CrossRef]
- Akrami, M.; Salah, A.H.; Dibaj, M.; Porcheron, M.; Javadi, A.A.; Farmani, R.; Fath, H.E.; Negm, A. A Zero-Liquid Discharge Model for a Transient Solar-Powered Desalination System for Greenhouse. Water 2020, 12, 1440. [Google Scholar] [CrossRef]
- Ghoneim, A.; Fisch, N.; Ammar, A.; Hahne, E. Design of a solar water heating system for Alexandria, Egypt. Renew. Energy 1993, 3, 577–583. [Google Scholar] [CrossRef]
- Sorour, M.; Ghoneim, A. Feasibility study of solar heating and cooling systems at different localities in Egypt. Renew. Energy 1994, 5, 489–491. [Google Scholar] [CrossRef]
- Ammar, A.; Okaz, A.; Ghoneim, A. Investigation of optimum parameters for solar domestic hot water system in Alexandria, Egypt. Sol. Wind. Technol. 1989, 6, 627–632. [Google Scholar] [CrossRef]
- Munawwar, S.; Ghedira, H. A review of renewable energy and solar industry growth in the GCC region. Energy Procedia 2014, 57, 3191–3202. [Google Scholar] [CrossRef]
- Hepbasli, A.; Alsuhaibani, Z. A key review on present status and future directions of solar energy studies and applications in Saudi Arabia. Renew. Sustain. Energy Rev. 2011, 15, 5021–5050. [Google Scholar] [CrossRef]
- Alawaji, S.H. Evaluation of solar energy research and its applications in Saudi Arabia—20 years of experience. Renew. Sustain. Energy Rev. 2001, 5, 59–77. [Google Scholar] [CrossRef]
- Baras, A.; Bamhair, W.; AlKhoshi, Y.; Alodan, M.; Engel-Cox, J. Opportunities and challenges of solar energy in Saudi Arabia. In World Renewable Energy Forum, Denver; 2012; Available online: https://pdfs.semanticscholar.org/a14d/f6514044aad588bb67f9966441bf652bd44d.pdf (accessed on 20 March 2020).
- Patlitzianas, K.D. Solar energy in Egypt: Significant business opportunities. Renew. Energy 2011, 36, 2305–2311. [Google Scholar] [CrossRef]
- Hales, D. Renewables 2018 Global Status Report. Renewable Energy Policy Network. 2018. Available online: https://www.ren21.net/gsr-2018/chapters/chapter_01/chapter_01/ (accessed on 20 March 2020).
- Jäger-Waldau, A. PV Status Report 2013; Institute for Energy and Transport, Renewable Energy Unit, 2013; p. 55. Available online: https://setis.ec.europa.eu/system/files/JRC_PV_Status_Report_2013.pdf (accessed on 20 March 2020).
- IRENA, Renewable Energy Statistics. International Renewable Energy Agency; Renewable Energy Target Setting: Abu Dhabi, UAE, 2015. [Google Scholar]
- Wiser, R.; Lantz, E.; Mai, T.; Zayas, J.; DeMeo, E.; Eugeni, E.; Lin-Powers, J.; Tusing, R. Wind vision: A new era for wind power in the United States. Electr. J. 2015, 28, 120–132. [Google Scholar] [CrossRef]
- Saidur, R.; Islam, M.; Rahim, N.; Solangi, K. A review on global wind energy policy. Renew. Sustain. Energy Rev. 2010, 14, 1744–1762. [Google Scholar] [CrossRef]
- World Bank Group. Available online: https://www.worldbank.org/ (accessed on 10 March 2020).
- Energy Data Information. Available online: https://energydata.info/ (accessed on 10 April 2020).
- Lambert, T.; Gilman, P.; Lilienthal, P. Micropower system modeling with HOMER. Integr. Altern. Sources Energy 2006, 1, 379–385. [Google Scholar]
- Digimap. Available online: https://digimap.edina.ac.uk/ (accessed on 20 May 2020).
- NASA Database. Available online: https://www.homerenergy.com/products/pro/docs/latest/finding_data_to_run_homer.html (accessed on 10 March 2020).
- Dabaieh, M.; Makhlouf, N.N.; Hosny, O.M. Roof top PV retrofitting: A rehabilitation assessment towards nearly zero energy buildings in remote off-grid vernacular settlements in Egypt. Sol. Energy 2016, 123, 160–173. [Google Scholar] [CrossRef]
- Samir, H.; Ali, N.A. Applying building-integrated photovoltaics (BIPV) in existing buildings, opportunities and constrains in Egypt. Procedia Environ. Sci. 2017, 37, 614–625. [Google Scholar] [CrossRef]
- Abdelhady, S.; Borello, D.; Tortora, E. Design of a small scale stand-alone solar thermal co-generation plant for an isolated region in Egypt. Energy Convers. Manag. 2014, 88, 872–882. [Google Scholar] [CrossRef]
- Hall, P.J.; Bain, E.J. Energy-storage technologies and electricity generation. Energy Policy 2008, 36, 4352–4355. [Google Scholar] [CrossRef]
- TESLA PowerPack. Available online: https://www.tesla.com/en_GB/powerpack (accessed on 12 May 2020).
- Antonio Barrozo Budes, F.; Ochoa, G.V.; Obregon, L.G.; Arango-Manrique, A.; Álvarez, J.R.N. Energy, Economic, and Environmental Evaluation of a Proposed Solar-Wind Power On-grid System Using HOMER Pro®: A Case Study in Colombia. Energies 2020, 13, 1662. [Google Scholar] [CrossRef]
- Martinez, N.; Benchaabane, Y.; Silva, R.E.; Ilinca, A.; Ibrahim, H.; Chandra, A.; Rousse, D.R. Computer Model for a Wind–Diesel Hybrid System with Compressed Air Energy Storage. Energies 2019, 12, 3542. [Google Scholar] [CrossRef]
- HOMER Energy. Available online: https://www.homerenergy.com/products/pro/ (accessed on 10 March 2020).
- HOMER Energy. Photovoltaic Panels Information. Available online: https://www.homerenergy.com/products/pro/docs/latest/photovoltaic_panels_pv.html (accessed on 10 March 2020).
- Manwell, J.F.; McGowan, J.G. Lead acid battery storage model for hybrid energy systems. Sol. Energy 1993, 50, 399–405. [Google Scholar] [CrossRef]


© 2020 by the authors. Licensee MDPI, Basel, Switzerland. This article is an open access article distributed under the terms and conditions of the Creative Commons Attribution (CC BY) license (http://creativecommons.org/licenses/by/4.0/).