Article

Security Assessment and Coordinated Emergency Control Strategy for Power Systems with Multi-Infeed HVDCs

School of Electrical Engineering, Beijing Jiaotong University, Beijing 100044, China
*
Author to whom correspondence should be addressed.
Energies 2020, 13(12), 3174; https://doi.org/10.3390/en13123174
Submission received: 23 May 2020 / Revised: 12 June 2020 / Accepted: 15 June 2020 / Published: 19 June 2020

Abstract

:
Short-circuit faults in a receiving-end power system can lead to blocking events of the feed-in high-voltage direct-current (HVDC) systems, which may further result in system instability. However, security assessment methods based on the transient stability (TS) simulation can hardly catch the fault propagation phenomena between AC and DC subsystems. Moreover, effective emergency control strategies are needed to prevent such undesired cascading events. This paper focuses on power systems with multi-infeed HVDCs. An on-line security assessment method based on the electromagnetic transient (EMT)-TS hybrid simulation is proposed. DC and AC subsystems are modeled in EMTDC/PSCAD and PSS/E, respectively. In this way, interactions between AC and DC subsystems can be well reflected. Meanwhile, high computational efficiency is maintained for the on-line application. In addition, an emergency control strategy is developed, which coordinates multiple control resources, including HVDCs, pumped storages, and interruptible loads, to maintain the security and stability of the receiving-end system. The effectiveness of the proposed methods is verified by numerical simulations on two actual power systems in China. The simulation results indicate that the EMT-TS hybrid simulation can accurately reflect the fault propagation phenomena between AC and DC subsystems, and the coordinated emergency control strategy can work effectively to maintain the security and stability of systems.

1. Introduction

With the growing penetration of line-commutated converter-based high-voltage direct-current (LCC-HVDC) lines, power systems with multi-infeed HVDCs, where several HVDC lines feed into nearby AC systems, are becoming more common [1,2]. Due to the complicated interactions among HVDCs and AC systems, such systems are facing challenges in secure and stable operation, especially when the short-circuit capacity of the receiving-end AC system is low relative to the rated power of the HVDCs [3,4,5]. An AC system fault that occurs at the receiving-end system can cause not only commutation failure of the directly-connected HVDC but also concurrent commutation failures or even blockings of adjacent HVDCs, giving rise to risks of instability and large-scale blackouts [6,7,8]. Therefore, it is critical to conduct on-line pre-decisions before such credible contingencies occur so that effective emergency controls can be implemented in time to prevent such cascading failures.
There are two steps involved in the on-line pre-decision-making [9,10,11]. One is the security assessment, which estimates the system security and stability under anticipated contingencies at the current operation point. The other is emergency control strategy decision-making, which generates emergency control strategies based on the security assessment result. Therefore, a control strategy table composed of emergency control strategies and corresponding contingencies will be generated in the pre-decision-making. Once a contingency occurs, emergency controls can be implemented in time by searching the control strategy table. In the on-line pre-decision-making, the control strategy table is updated within a fixed period to adapt to the changing operating conditions.
Up to now, many security assessment methods have been proposed for AC/DC systems. The time-domain simulation method is widely used for its good model extensibility and can be classified into two categories: One is based on mature transient stability (TS) simulators with the built-in models and solvers, like Power System Simulator/Engineering (PSS/E) [12], Bonneville Power Administration (BPA) [13], and Transient Security Assessment Tool (TSAT) [14], and the other is based on customized models and solving algorithms, like the voltage source equivalent-based method [15], multi-decomposition method [16], and optimal subinterval selection method [17]. However, in these methods, HVDC converters are expressed by steady-state models, and the fault propagation phenomena between AC and DC subsystems, such as commutation failures and blocking events caused by AC system faults, may not be reflected accurately. Similarly, in transient energy-based methods [18,19] and their derived methods, which combine them with time-domain simulation methods [20,21], the transient energy function cannot incorporate HVDC converter-involved dynamics, and there is a probability that the commutation failures or blocking event-related issues cannot be identified. However, considering the credible impact of interactions between AC and DC subsystems on the secure and stable operation, accurately detecting the fault propagation phenomena is crucial in the above methods [22,23]. Recently, data-driven artificial intelligence (AI) methods have been proposed as fast tools, e.g., the generative adversarial network (GAN) [24], convolutional neural network (CNN) [25], and deep belief network (DBN) [26]. Most of these methods are at their early stages and their practicality needs to be improved [26]. Therefore, improving the accuracy of the time-domain simulation method or transient energy-based methods is necessary. In fact, to describe the detailed dynamics of HVDCs accurately, electromagnetic transient (EMT) simulation is a suitable tool, but it cannot be used directly in the on-line security assessment due to its low computational efficiency [27]. Therefore, a method that can take advantage of the modeling accuracy of EMT and the computational efficiency of existing security assessment methods should be explored. EMT-TS hybrid simulation, in which the HVDC-related subsystems are modeled in EMT and the rest in TS, provides an idea for solving the problem.
In emergency control, load shedding (LS) is a common measure and its optimization method is continuously improved to achieve cost-effective control for issues like frequency instability [28] and voltage collapse [29]. Subsequently, considering that large disturbances can affect the power angle, voltage, and frequency simultaneously, the authors of [30] constructed an LS optimization model considering multiple security constraints, including transient voltage deviation security, transient frequency deviation security, and transient angle stability, which can remedy the limitation of single security constraint-based methods. In addition to LS, other control resources, such as HVDCs [31,32] and pumped storages [33], can also be used for emergency control. However, their control amount is usually determined separately [31,32,33]. The authors of [34,35] comprehensively coordinate HVDCs, pumped storages, and interruptible loads in the emergency control strategy to handle frequency stability issues in the East China power grid. Nevertheless, similar to [28], only frequency instability is considered in the proposed scheme. The authors of [36] developed a multi-resource coordinated control strategy for an actual power grid to cope with the impact the DC blockings have on weak AC channels, but it was obtained based on the characteristics of the grid without mathematical analysis, which may be not suitable for other grids.
According to the above analysis, for power systems with multi-infeed HVDCs: (1) A security assessment method that can well reflect the fault propagation phenomena between AC and DC subsystems, and generate reliable results within an acceptable time should be studied; and (2) the emergency control strategy that can comprehensively coordinate multiple control resources while satisfying multiple critical security constraints is needed.
In this paper, an on-line pre-decision-making scheme, including security assessment and emergency control strategy decision-making, is proposed for power systems with multi-infeed HVDCs. The contributions are as follows:
(1)
A security assessment method based on EMT-TS hybrid simulation is achieved. DC and AC subsystems are modeled in EMTDC/PSCAD and PSS/E, respectively. The security assessment method can accurately identify the security and stability issues related to interactions between AC and DC subsystems while maintaining the high computational efficiency;
(2)
An emergency control strategy decision-making method that can coordinate HVDCs, pumped storages, and interruptible loads is developed subject to multiple security constraints. The decision-making method can minimize the control costs while maintaining the security and stability of the receiving-end system.
This paper is structured as follows: Section 2 introduces the procedure of the on-line pre-decision-making scheme. Section 3 describes the implementation of the security assessment based on EMT-TS hybrid simulation. Section 4 presents the optimization model and solution method of the emergency control decision-making problem. Two actual provincial systems in China are used to verify the proposed method in Section 5. Section 6 concludes the paper.

2. Procedure of the On-Line Pre-Decision-Making Scheme
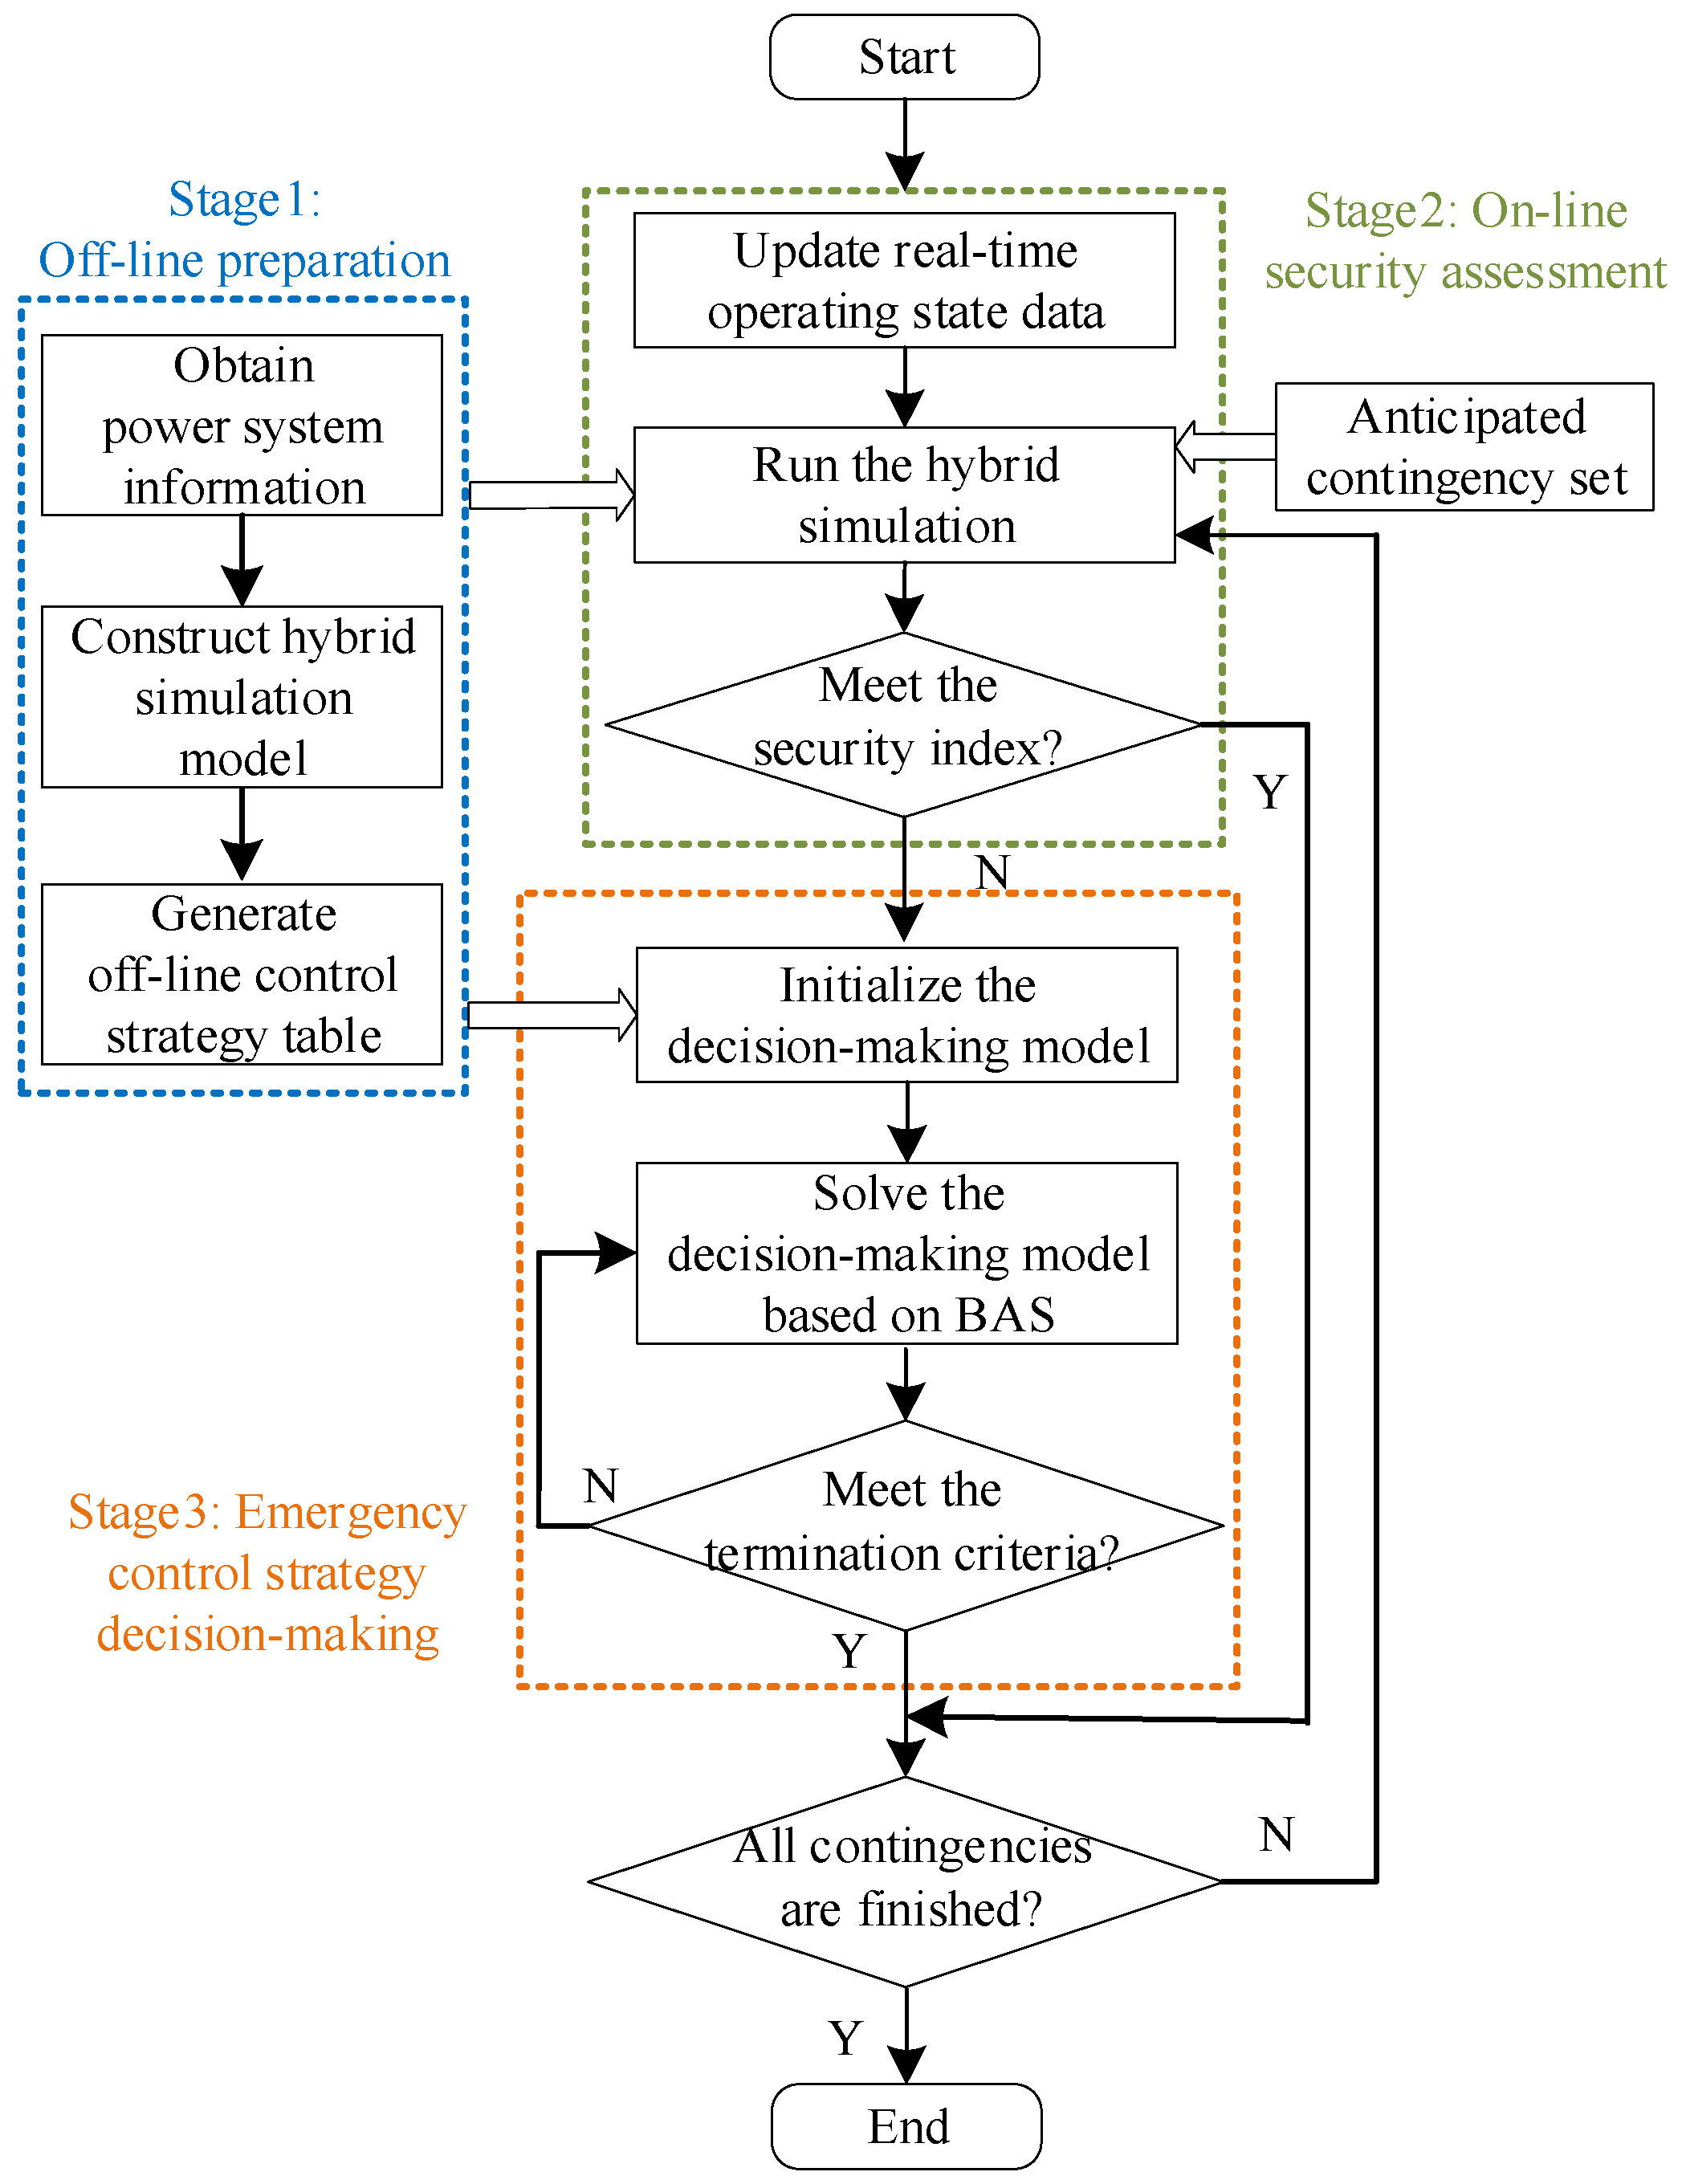
In the on-line decision-making scheme, the control strategy table is updated at fixed intervals. During each interval, the operating condition of the system is assumed as being unchanged [11], and the anticipated contingencies include merely the fault and protection action information. According to the severity and probability, the contingencies can be divided into three levels [37]: (1) Single component fault; (2) single severe fault; and (3) multiple severe faults. Especially, in the third level, operation failure of the protection and reclosing failure caused by a permanent fault may induce HVDC blocking events and result in instability of the receiving-end system [38], which should be paid more attention to.
When updating the control strategy table, security assessment is conducted for the anticipated contingency set based on the current operating condition, and the emergency control strategy will be developed if system security and stability issues arise. Therefore, the procedure can be divided into three stages, as shown in Figure 1.
(1)
Off-line preparation. Construct the EMT-TS hybrid model based on the information of the network topology, electrical parameters, control parameters, etc. Then, generate an off-line control strategy table under the anticipated contingency set and pre-determined typical operating conditions (different from the on-line control strategy table, various typical operating conditions need to be considered in the off-line control strategy table [39]), which will provide the initial solution of the decision-making model for the emergency control strategy;
(2)
On-line security assessment based on EMT-TS hybrid simulation. Update the real-time operating state data, including the operation mode of the system and the power flow of the main transmission section; choose one contingency from the anticipated contingency set and run the hybrid simulation. Then, identify possible security and stability issues according to the security indices. Finally, generate the assessment result for contingencies that cause security and stability issues, including the current operating condition, contingency, and power shortage in the receiving-end system; and
(3)
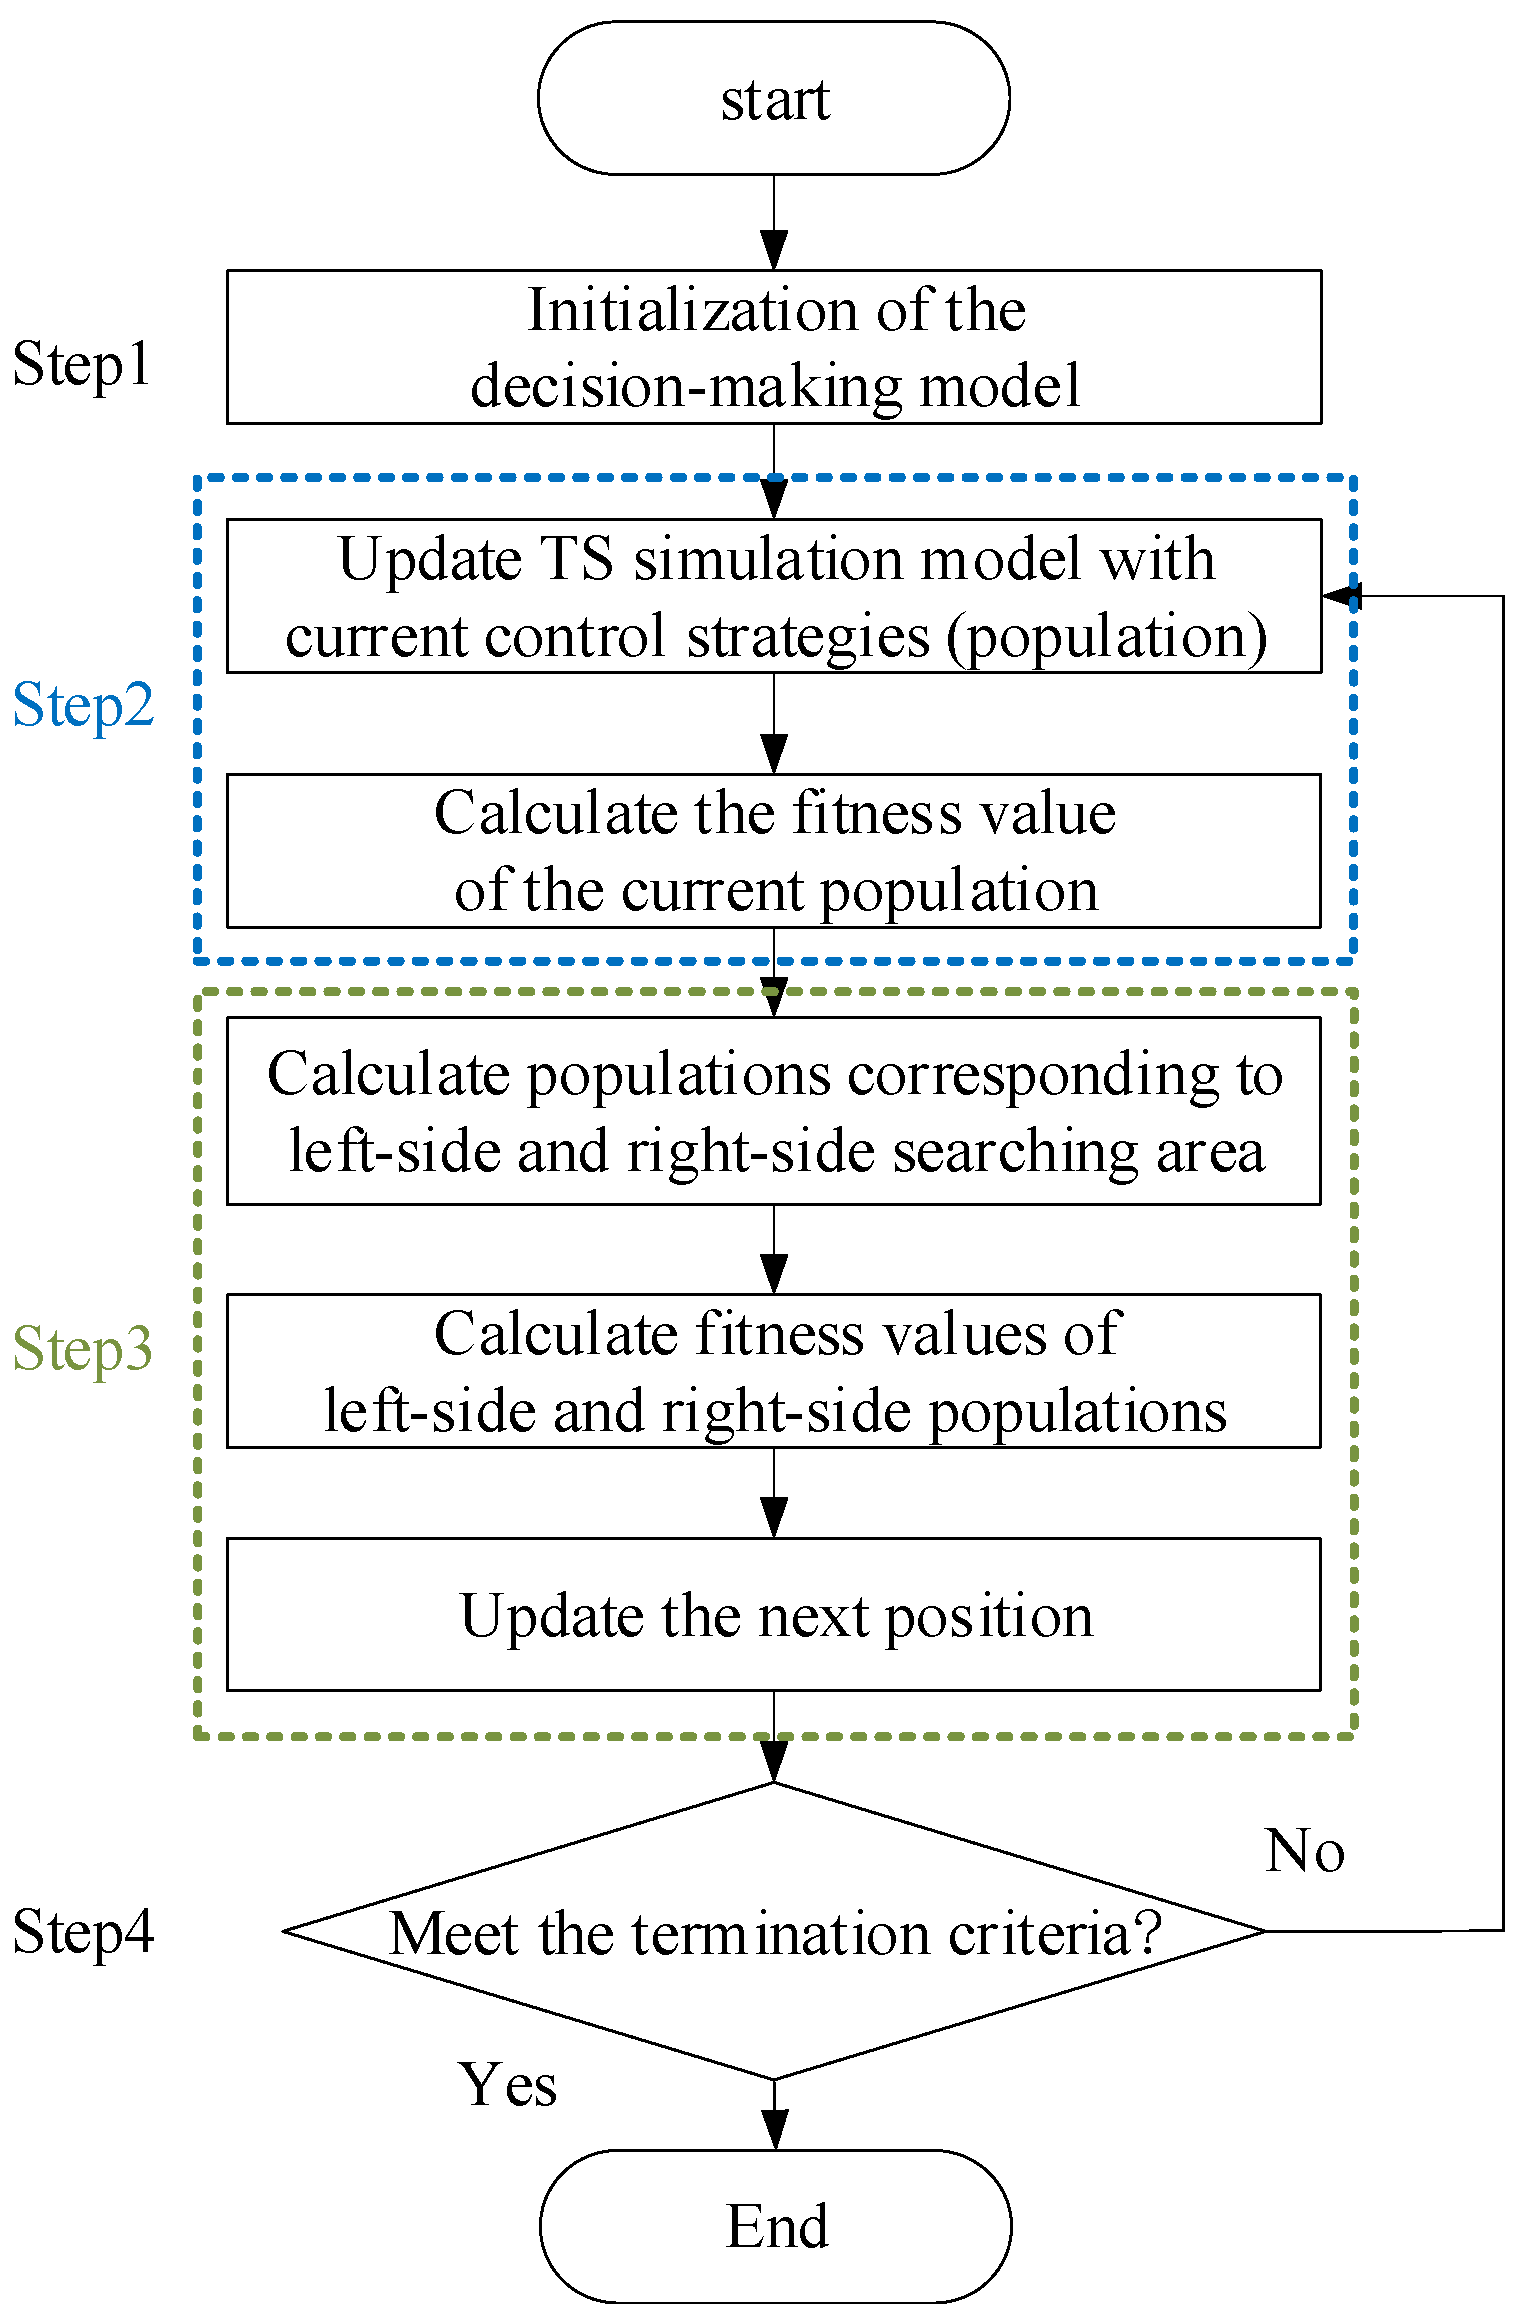
Emergency control strategy decision-making. Initialize the decision-making model with the operating condition and the control strategy. The operating condition is obtained from the assessment result. The control strategy, which is used as the initial solution, is determined based on the power shortage and the control strategy obtained through an approximate search of the off-line control strategy table. Then, solve the decision-making model based on the beetle antennae search (BAS) algorithm [40], a meta-heuristic algorithm developed by the inspiration of the beetle forging principle, until the termination criteria are met.

3. Security Assessment Based on EMT-TS Hybrid Simulation

Security assessment refers to the analysis required to determine whether a power system can meet specified security criteria in both transient and steady-state time frames under credible contingencies [41]. Therefore, assessment methods and security indices are two of the parts involved in the security assessment. Considering that commutation failures and blocking events caused by AC system faults are typical fault propagation phenomena between AC and DC subsystems, the analysis of commutation failures and blocking events simulation is firstly analyzed in the following subsections. Then, the principle of EMT-TS hybrid simulation modeling and the security assessment index system are introduced.

3.1. Analysis of Commutation Failures and Blocking Events Simulation

The essence of the commutation failure is that the thyristor cannot establish a forward voltage blocking capability due to the insufficient negative voltage time, which can be represented by the extinction angle [42]. Therefore, a commutation failure can be considered to occur when the extinction angle is less than the inherent limit of the thyristor. As stated in [38], a commutation failure, which occurs again after an interval of 200 ms, is called a continuous commutation failure in engineering and may cause an HVDC blocking event. Therefore, in the study, a continuous commutation failure with an interval of 200 ms is taken as the condition of HVDC blocking.
However, in the simulation analysis, different criteria are developed to determine the occurrence of commutation failures and blocking events due to different modeling methods of HVDC converters. Table 1 compares the typical criteria of commutation failures and blocking events in the pure TS simulation and EMT-TS hybrid simulation. In the pure TS simulation, the models of the HVDC converter, such as the CDC4 model in PSS/E, are represented by steady-state equations. That is, the HVDC converter is modeled without thyristor valves, so commutation failures and blocking events can only be identified according to the AC voltages at commutation buses [43]. The AC voltage criteria are usually obtained under the assumption of an infinite AC system and the effect of voltage waveform distortion on commutation failures is ignored, so the accuracy is poor [42]. In the EMT-TS hybrid simulation, HVDC converters are modeled by thyristor valves, which are consistent with the actual condition, so commutation failures and blocking events can be identified accurately through detection of the extinction angle and the interval between two commutation failures.
Therefore, the EMT-TS hybrid simulation can achieve more accurate results in the commutation failures and blocking events simulation. It is more suitable for the security assessment of receiving-end systems to identify HVDC-related security and stability issues, which is validated in Section 5.

3.2. Principle of EMT-TS Hybrid Simulation Modeling
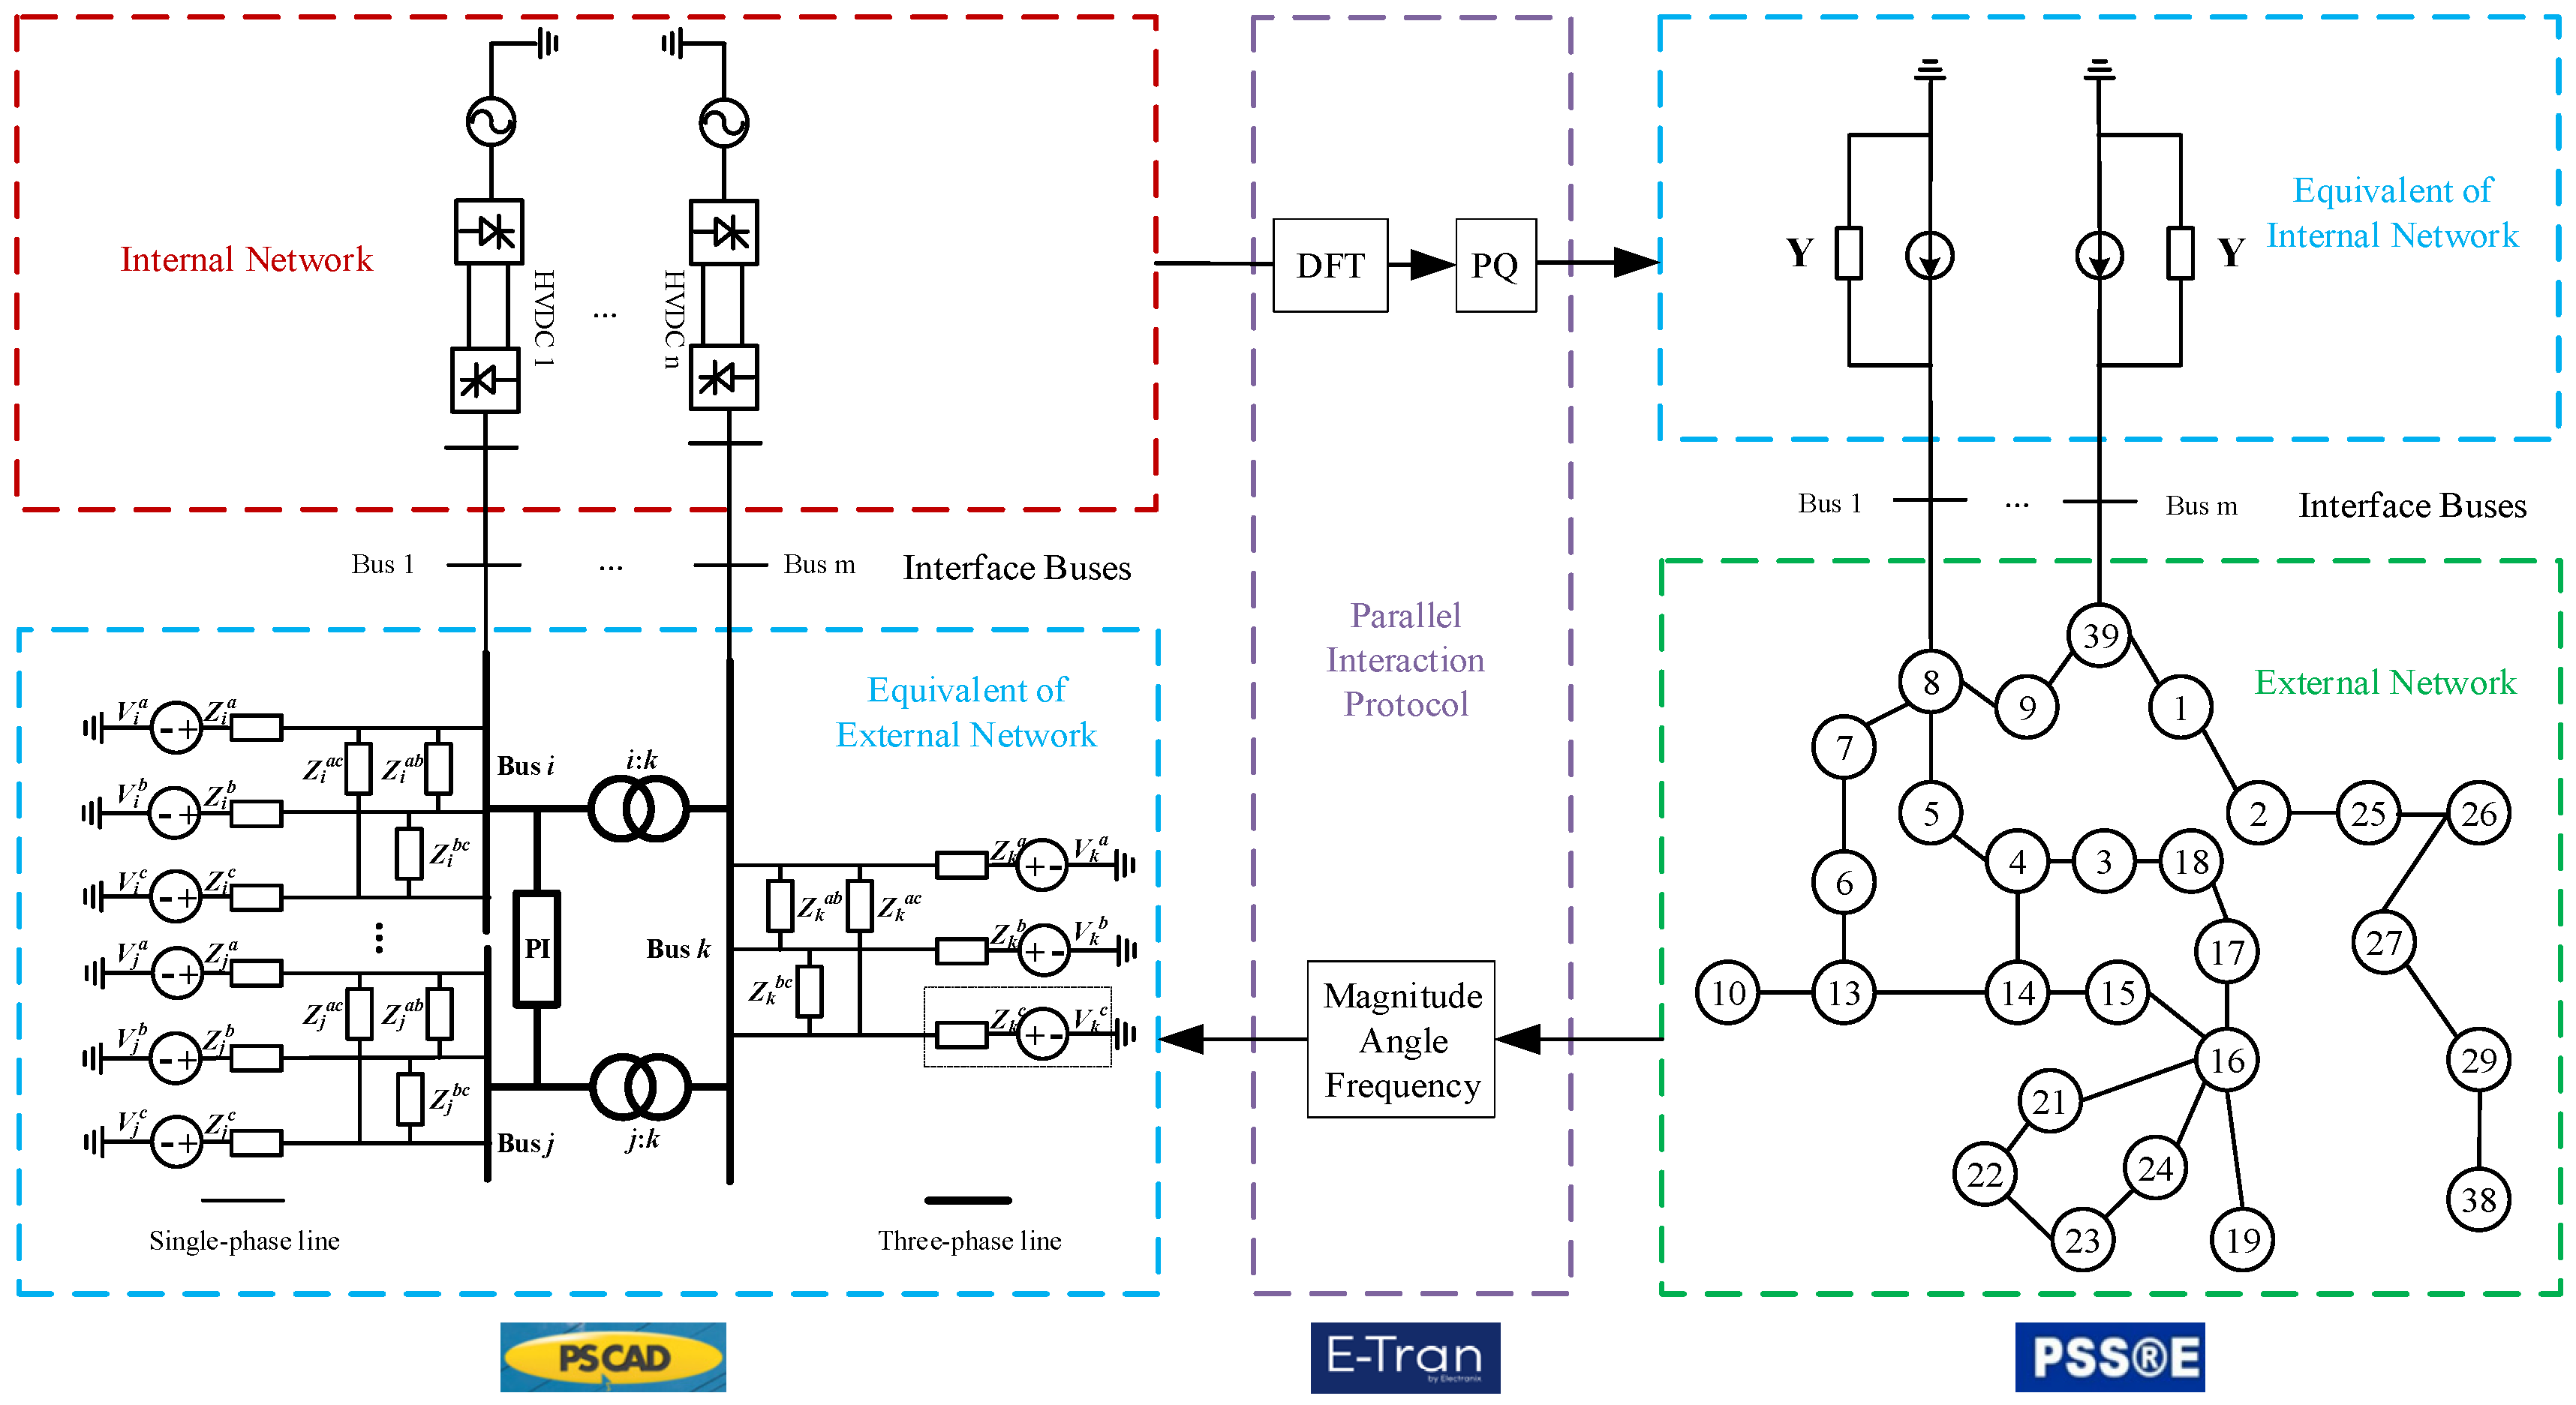
To build the hybrid simulation platform, two mature business software, PSS/E [45] and EMTDC/PSCAD [46], are integrated based on the interface software E-Tran Plus [47]. To construct the hybrid simulation model, several issues should be addressed:
(1)
Interface location. As shown in Figure 2, the power system will be divided into two parts: The internal network and the external network. The internal network is comprised of HVDCs and the nearby AC buses, and it is modeled in the EMT simulator EMTDC/PSCAD. The rest of the system is the external network and is represented in the TS simulator PSS/E. To guarantee the accuracy and efficiency of the hybrid simulation, a proper interface location should be identified.
(2)
Equivalent models of the external and internal networks. For the model in EMTDC/PSCAD, in addition to the detailed model of the internal network, an equivalent model of the external network needs to be constructed to ensure the integrity of the system. Similarly, an equivalent model of the internal network in PSS/E is also indispensable.
(3)
Interaction protocol and data. During the hybrid simulation, the two simulators will exchange data through a certain interaction protocol to update the states of the equivalent models in time.

3.2.1. Identify the Interface Location

When HVDC was first simulated in an EMT-TS hybrid simulation, the interface was located at the terminal buses of converters [48,49]. Subsequently, considering that TS simulation based on the fundamental frequency positive-sequence phasor model cannot effectively represent the waveform distortion or phase imbalance at converter terminals, an extension of the internal network into the AC system was suggested [50]. However, the specific methods for identifying the interface location were not mentioned. In PSS/E, phase imbalance caused by asymmetrical faults can be described by appending negative-sequence and zero-sequence parameters to the positive-sequence system, so the interface location mainly depends on the description of harmonic distortion, which is related to the frequency [51].
Based on the above analysis, a frequency-domain characteristics analysis method is used here to identify the location of the interface. The range of the internal network is expanded continuously and the impedance-frequency characteristics at the buses of interest are analyzed in the hybrid simulation, until the differences among the impedance-frequency characteristics under different locations reduce to a certain range. That is, expanding the scope of the internal network has almost no effect on the impedance-frequency characteristics anymore. Then, the interface location is finally identified based on the smaller internal network of the last two-scope internal networks.
In the security assessment of power systems with multi-infeed HVDCs, HVDC dynamics are essential and should be described accurately. Therefore, the commutation buses at the rectifier side and inverter side can be taken as the buses of interest.

3.2.2. Equivalent Models of the External and Internal Networks

In the study, the construction of equivalent models is implemented in E-Tran Plus. In order to consider the asymmetrical faults, a multi-port three-phase equivalent circuit with voltage sources, PI sections and transformers, is constructed in EMTDC/PSCAD to represent the external network. PI sections represent the impedance between buses of the same voltage level, whereas transformers represent the impedance between buses of different voltage levels. As for the equivalent model of the internal network, the generator model is used in PSS/E. When performing the power flow calculation to get the updated data, which will be transferred to EMTDC/PSCAD, the generator model will act as a current injection and a change in the system admittance matrix in PSS/E. The equivalent models of both networks can be found in the implementation of the hybrid simulation shown in Figure 3.

3.2.3. Interaction Protocol and Data

A parallel interaction protocol is adopted to exchange the updated data, indicating both simulators run simultaneously during the simulation process. Before the simulation, initialization will be executed, in which the equivalent voltage sources in EMTDC/PSCAD and the equivalent generators (or current sources and admittance matrix) in PSS/E are initialized based on the power flow results of the pure TS simulation in PSS/E. During the simulation, the voltage magnitude, phase angle, and frequency information from PSS/E will be sent to EMTDC/PSCAD to update the equivalent voltage sources. At the same time, a discrete Fourier transform (DFT) will be used to extract PQ values from EMTDC/PSCAD to update the equivalent generators. All the data are exchanged at the time step of the TS simulation.

3.3. Security Assessment Index System

During the security assessment, the EMT-TS hybrid simulation model is updated with the real-time operating data obtained by the intelligent measurement system and run under the pre-defined contingency. Then, the results are evaluated based on a security assessment index system to identify the security and stability issues. Once any security index in the simulation results exceeds the preset range, the current operating condition, contingency, and power shortage in the receiving-end system will be sent to the decision-making model to obtain the optimal emergency control strategies.
The security assessment index system is composed of static security indices and dynamic security indices. The steady-state frequency deviation, voltage deviation, and power flow of the lines belong to static indices while the maximum/minimum value of the transient voltage and frequency, as well as the maximum transient relative power angle, belong to dynamic indices. Referring to [52], the preset ranges of the security assessment index system are shown in Table 2. In static indices, the threshold values of the steady-state frequency deviation Δf and steady-state voltage deviation ΔV are 0.05 Hz and 0.1 p.u., respectively; and the power flow of lines should be less than the transmission power limit pmax, which is 1 p.u. in the study. As for dynamic indices, the security threshold of equipment, as well as coordination among different controls, needs to be considered. To ensure the safety of power system equipment, the maximum value of the transient voltage should be less than 1.3 p.u.; to avoid triggering low-voltage LS, high-frequency generator tripping, and low-frequency LS, the minimum value of the transient voltage should be higher than 0.85 p.u. and the threshold values of the maximum/minimum transient frequency are 51.5 and 49.25 Hz, respectively. At the same time, the power angle difference Δδ of any two units should be less than 360° to avoid the out-of-step of the first and second pendulums.

4. Emergency Control Strategy Decision-Making Based on BAS

When a security or stability issue is identified by security assessment, the emergency control strategy will be generated by solving the decision-making model with BAS. In the following subsections, the mathematical decision-making model and the decision-making procedure of the emergency control strategy are described.

4.1. Mathematical Decision-Making Model

The emergency control strategy decision-making problem can be formulated as a constrained optimization problem. The objective includes minimizing control costs and deviations of the frequency and voltage, and adjustment amount constraints, steady-state constraints, and transient-state constraints are considered.

4.1.1. Objective Function

The primary objective is minimizing the total control costs of multiple resources, and the secondary objective is minimizing the total weighted deviations of the frequency and voltage. The two objectives are normalized and combined through a weighted coefficient to formulate the objective function f, as shown in the following equations:
min f = f 1 + ω 0 f 2 ,
min f 1 = ( i = 1 N D Δ p i DC + j = 1 N S Δ p j pump x j + k = 1 N L Δ p k load ) / S base ,
min f 2 = ε f g Δ f g ( p ) σ g f base + ε v m Δ V m ( p ) V base K V ,
Δ f g ( p ) = Δ f s ( p ) + Δ f g d ( p ) ,
Δ V m ( p ) = Δ V m s ( p ) + Δ V m d ( p ) ,
where f 1 is the primary objective; f 2 is the secondary objective; ω 0 is the weighted coefficient; N D , N S , and N L are the numbers of HVDCs, pumped storages, and interruptible loads in emergency resources; Δ p i DC is the power adjustment of HVDC i; Δ p j pump is the consumed power of the tripped pumped storage j ; x j is a 0–1 variable, 1 represents tripping the pumped storage j while 0 represents keeping the original state; Δ p k load is the power adjustment of load k ; S base is the base value of the power system capacity; ε f and ε v are the weighted coefficients of the frequency and voltage; Δ f g and σ g are the frequency deviation and coefficient of the primary frequency adjustment at the generator g , respectively; f base is the reference frequency; Δ V m is the voltage deviation of bus m ; K V is the voltage regulation factor; V base is the reference voltage; Δ f s is the steady-state frequency deviation of the system; Δ f g d is the transient-state frequency deviation of bus g ; and Δ V m s and Δ V m d are the steady-state and transient-state voltage deviations of bus m .
Equation (1) is the objective function, in which the weighted coefficient ω 0 is defined by users. Equation (2) is the primary objective, with Δ p i DC , x j , and Δ p k load as decision variables. Equation (3) describes the secondary objective. Considering that the power imbalance of the receiving-end system due to the HVDC blocking event will seriously affect the system frequency, assume ε f > ε v . Equations (4) and (5) represents the frequency deviation and voltage deviation, respectively.
It should be noted that the priority of three kinds of control resources is different, which is reflected by the control action time in the control strategy. Taking the control speed and control cost into account, the action sequence adopted here is HVDCs, pumped storages, and interruptible loads. Considering the communication delay and control device response time, the control action time of HVDCs is 100 ms after the security or stability issue occurs, and the pumped storages and interruptible loads are followed, which are 300 and 500 ms, respectively [53]. Therefore, the control action time for control resources is fixed and not taken as the decision variable in the decision-making.

4.1.2. Adjustment Amount Constraints

The adjustment amount of each equipment should not exceed its maximum power capacity, such as the maximum active power of HVDC can be increased up to being 1.1 times the rated capacity [54]. Therefore, the emergency control strategies should meet the following constraints:
p i DC , min p i DC Δ p i DC p i DC , max p i DC ( i = 1 , , N D ) ,
p k load , min p k load Δ p k load p k load , max p k load ( k = 1 , , N L ) ,
where p i DC is the transmission power of HVDC i ; p i DC , max and p i DC , min are the transmission power limits of HVDC i ; p k load is the power of load k ; and p k load , max and p k load , min are the LS amount limits of load k .
Equation (6) is the power adjustment amount limits of HVDC and Equation (7) is the LS limits.

4.1.3. Steady-State Constraints

Based on the indices discussed in Section 3.3, the steady-state constraints are as follows:
Δ f s , min < Δ f s ( p ) < Δ f s , max   ,
Δ V m s , min < Δ V m s ( p ) < Δ V m s , max ( m = 1 , , N B ) ,
S q s ( p ) < S q s , max ( q = 1 , , N T ) ,
where Δ f s , max and Δ f s , min are the steady-state frequency deviation limits of the system; N B is the total number of the buses; Δ V m s , max and Δ V m s , min are the upper and lower limits of the steady-state voltage deviation at bus m ; N T is the total number of lines; S q s is the transmission power of line q ; and S q s , max is the transmission power limit of line q .
Equations (8) and (9) are the steady-state deviation limits of the frequency and voltage. Equation (10) is the transmission power limit of lines.

4.1.4. Transient-State Constraints

The transient variables, such as the transient frequency deviation, transient voltage deviation, and relative power angle, of the generators should meet:
Δ f g d , min < Δ f g d ( p ) < Δ f g d , max ( g = 1 , , N G ) ,
Δ V m d , min < Δ V m d ( p ) < Δ V m d , max ( m = 1 , , N B ) ,
Δ δ s , r ( p ) < Δ δ max ( s , r = 1 , , N G ) ,
where N G is the total number of the generators; Δ f g d , max and Δ f g d , min are the upper and lower limits of the transient frequency deviation at generator g ; Δ V m d , max and Δ V m d , min are the upper and lower limits of the transient voltage deviation at bus m ; Δ δ s , r is the power angle difference between generators s and r ; and Δ δ max is the maximum power angle difference between any two units during the transient process.
Equations (11) and (12) are the transient deviation limits of the frequency and voltage. Equation (13) is the transient limit of the power angle difference.

4.2. Decision-Making Procedure of the Emergency Control Strategy

As described in Section 4.1.1, the priority and the control action time of the emergency resources are different. In the decision-making process, the resources are optimized in order of priority, which is HVDCs, pumped storages, and interruptible loads. Only when the adjustable amount of the resource with high priority is insufficient to maintain the security and stability will the resource with low priority be adjusted. Therefore, the types of control resources that need to be adjusted should be determined firstly according to the power shortage and the control strategy obtained from the off-line table. Then, those with high priority are adjusted to the maximum adjustment amount, and those with low priority are optimized by solving the decision-making model.
As for the solution method, there are two kinds that can be used to solve the non-linear decision-making problems: One is to transform the non-linear function to a linear function, such as the trajectory sensitivity-based method in [30], and the other is to handle the problems with AI algorithms. In the study, the latter one is adopted, in which the BAS algorithm [40] and TS simulation are combined to obtain the optimal control strategy. Considering that the BAS algorithm may take several iterations during the decision-making process and the influence of the control strategies brought by the steady-state model in TS simulation is relatively small, TS simulation is used to improve the overall efficiency. At the same time, it should be noted that the decision variable corresponding to the pumped storages is an integer variable. In the optimization, it is treated as a continuous variable, and finally rounded to the nearest integer to obtain the decision-making result.
The specific decision-making procedure is as follows and the flowchart is shown in Figure 4.
Step 1: Initialization of the decision-making model.
Determine the types of control resources that need to be adjusted through comparing the adjustable amount of the resources and the power shortage. Obtain the control strategy corresponding to the pre-determined contingency and the current operating condition through an approximate search of the off-line control strategy table. If the control resource types in the control strategy are the same as those determined based on the power shortage, then the control strategy is used as the initial population x ; otherwise, if the control resource types in the control strategy differ from those determined based on the power shortage, the control resource types are consistent with those determined based on the power shortage, and the resource with the lowest priority in the control resource types will be optimized, with the initial adjustment amount as 0. Then, initialize the decision-making model with the current operating state data, initial population x , and other solution parameters. The solution parameters include the variable step-size parameter E, the step-size s p , the distance between left and right populations d 0 , and the number of iterations n .
Step 2: Fitness value calculation of the current population.
Update the TS simulation model with the current control strategy, i.e., the current population x. Then, extract the deviations of the frequency and voltage described in Section 3.3 through traversing the simulation results. Finally, calculate the fitness value of the current population based on the fitness value function shown in Equations (1)–(5).
Step 3: Update of the population.
Assume that the beetle forages randomly in any direction, then the direction vector from its right antenna to the left antenna should also be random. Therefore, the optimization problems in k dim dimensional space can be represented and normalized by a random vector:
D = r a n d s ( k dim , 1 ) | r a n d s ( k dim , 1 ) | ,
where k dim is the spatial dimension and r a n d s ( ) is a random function.
To imitate the activities of the beetle’s left and right antennae, populations x l and x r are defined to represent a population in the left-side and right-side searching areas, respectively:
x l x r = d 0 D ,
x l = x + d 0 D / 2 ,
x r = x d 0 D / 2 .
Then, the fitness values of populations x l and x r are calculated based on TS simulation results and Equations (1)–(5), and expressed as f left and   f right , respectively.
Finally, the position where the beetle will go next, i.e., the next population, can be determined by comparing the fitness values f left and   f right based on Equation (18):
x = { x + E s p D ( f left < f right ) x E s p D ( f left >   f right ) .
The variable step-size parameter E is between 0 and 1, and 0.95 is an acceptable value here.
Step 4: Termination criteria
If the difference between the fitness values of two adjacent populations is less than the threshold value ε or the number of iterations n has reached the maximum value, as shown in Equation (19), then the decision-making is terminated and the new population is considered as the optimal emergency control strategy; otherwise, take the previous population as the input and perform step 2 and step 3 again until Equation (19) is met:
f n f n 1 ε   or   n n max ,
where f n and f n 1 are the fitness values of the n th iteration and ( n 1 ) th iteration, respectively; and n max is the maximum number of iterations.

5. Case Studies

In this section, two actual power systems in China are used as the test systems to verify the proposed scheme.

5.1. Test System 1

The topology of test system 1 is shown in Figure 5. There are 64 equivalent loads, 39 equivalent generators, 101,000 kV buses, 80,500 kV buses, and 3 HVDC lines: ±660 HVDC 1, ±800 HVDC 2, and ±800 HVDC 3. The total capacity of equivalent loads is 59.6 GW, and the transmission power of the HVDC lines are 4, 8, and 8 GW, respectively. That is, the capacity proportion of HVDCs is 33.56% of the equivalent loads.

5.1.1. Construction of the Hybrid Simulation

As discussed in Section 3.2.1, the accuracy of the hybrid simulation is related to the interface buses, so the frequency-domain characteristics analysis is conducted to determine the interface buses.
For the convenience of description, the number of branches in the shortest path between two buses is defined as the electrical distance. For example, the electrical distance between bus 38 and bus 66 is 3. Since the commutation buses are modeled as the internal nodes of the HVDC model in PSS/E, the buses with an electrical distance of 2, 3, 4, and 5 from the commutation buses are taken as the interfaces to construct the hybrid simulation models, respectively. According to Section 3.2.1, the impedance-frequency characteristics at the commutation buses of HVDCs are obtained based on the frequency-domain characteristics analysis. Take HVDC 2 as an example, the positive-sequence impedance-frequency characteristics of the rectifier-side bus 301 and inverter-side bus 55 are shown in Figure 6.
As can be seen in the figures, the differences of the impedance-frequency characteristics at bus 301 under different interface locations are negligible, which may result from the direct connection with generator 302. Additionally, the four waveforms at bus 55 match well when the frequency is lower than 110 Hz and higher than 400 Hz. Although some differences exist under other frequencies, the characteristics under 2 buses away and 3 buses away are very close. Buses with an electrical distance of 2 from the commutation buses are taken as the interface location.

5.1.2. Implementation of Security Assessment and Emergency Control Strategy Decision-Making

As discussed in Section 2, operation failure of protection and reclosing failure caused by a permanent fault are two issues of interest to researchers in recent years. Therefore, they are studied as two scenarios in the study. To verify the accuracy of the proposed EMT-TS hybrid simulation, the PSS/E simulator is adopted as the pure TS simulation tool for comparison.
In the EMT-TS simulation, the limit of the extinction angle for commutation failures determination is 7.2°. In PSS/E, the actual AC voltage criteria of commutation failures for HVDC 1, HVDC 2, and HVDC 3 are 528, 628, and 628 kV while the criteria of blocking events are 0.6 p.u.
• Scenario 1: Operation Failure of Protection
a. Implementation of Security Assessment.
In this case, a three-phase short-circuit fault occurs at line from bus 29 to bus 46 at 1.1 s, and the opening of the circuit breaker fails due to its malfunction. Therefore, the faulted line is finally isolated by tripping circuit breakers of adjacent lines at 1.4 s, which is called failure protection.
Figure 7 shows the corresponding responses of typical interface buses and HVDC 2 in the hybrid simulation and PSS/E. As can be seen from Figure 7a, the waveforms of interface buses match well before the fault occurs. Although there is a slight deviation in the transient process before the fault removal, a similar trend is obtained, which can verify the correctness of the hybrid simulation results. Meanwhile, continuous commutation failures of HVDC 2 are observed in both PSS/E and hybrid simulations during the fault. It should be noted that due to the different modeling methods of HVDC converters, the extinction angle under commutation failures is different in PSS/E and the hybrid simulation. In PSS/E, the extinction angle is set to 90° [45], while in the hybrid simulation, the extinction angle is lower than 7.2° [46]. Therefore, it can be seen from the waveforms of the extinction angle in Figure 7b, in both PSS/E and the hybrid simulation, the intervals between two commutation failures (extinction angle is lower than 7.2° in the hybrid simulation while equals to 90° in PSS/E) are longer than 200 ms, which indicates the occurrence of continuous commutation failures. Nevertheless, HVDC 2 is blocked at 1.4 s in the hybrid simulation while not in PSS/E, which can be seen from the slow restoration of the inverter-side active power in PSS/E. Therefore, it validates that the ETM-TS hybrid simulation proposed in this paper can detect the blocking event while there is a limitation in using pure TS simulation to detect blocking events.
Through traversing the simulation results of scenario 1, it can be found that the steady-state frequency deviation |Δf| is 0.24956, which exceeds the threshold of 0.05, and the minimum transient frequency is 49.169, which is lower than the threshold of 49.25 Hz. Therefore, the emergency control strategy should be developed to maintain the security and stability of the receiving-end system.
b. Implementation of Emergency Control Strategy Decision-Making.
Since there is no pumped storage in the provincial power system, only HVDCs and interruptible loads are taken as the control resources. By applying the decision-making method proposed in Section 4.2, the emergency control strategy for the bipolar blocking event of HVDC 2 is to increase the transmission power of the rest HVDC systems by 1.2 GW at 1.5 s and shear a load of 6.16 GW at 1.7 s. The static security indices and dynamic security indices before and after adopting the emergency control strategy are shown in Figure 8. The steady-state and transient frequency indices will exceed the preset range without control, while all static and dynamic indices are within preset ranges with the control strategy obtained by the proposed method.
In order to further verify the control effect of the emergency control strategy, the trajectory sensitivity-based LS scheme proposed in [55] is compared with the proposed scheme in the paper, and the results are shown in Figure 9. The LS ranges of the sensitivity-based scheme are set as (0, 10%) and (0, 14%), respectively. As can be seen from the results, the LS amount under the two ranges are concentrated at the upper or lower limit, and there is significant non-uniformity. The control costs are 6.4763 and 6.4712 GW, respectively. In comparison, the LS amount obtained from the proposed scheme has higher consistency among the entire network, and the local LS is not uniform. Furthermore, the control cost of LS is reduced to 6.1646 GW.
• Scenario 2: Reclosing at a Permanent Fault
a. Implementation of Security Assessment.
In this scenario, a three-phase short-circuit fault occurs at the line between bus 65 and 66 at 1.1 s, and the circuit breaker is opened at 1.2 s. In addition, the reclosing of the circuit breaker at 2.2 s fails due to a permanent fault. Therefore, the circuit breaker is reopened at 2.3 s.
The results of typical interface buses, HVDC 2 and HVDC 3, are shown in Figure 10. It can be seen in Figure 10a that the voltage waveforms of interface buses in hybrid simulation and PSS/E before reclosing are close. However, the HVDC systems show different characteristics during the transient process. As can be seen in Figure 10b,c, in the hybrid simulation, continuous commutation failures are observed in HVDC 2 and HVDC 3 due to the unsuccessful reclosing of the breaker, so they are blocked at 2.3 s; while in PSS/E, the active power of the HVDC systems restores slowly after the reopening of the breaker. Obviously, reclosing to a permanent fault does not cause the second commutation failure in PSS/E, which shows the limitation of adopting the AC voltage at the inverter side as the criterion for detecting the commutation failure.
Different from Scenario 1, in addition to the steady-state frequency deviation and the minimum transient frequency, the maximum transient frequency exceeds the threshold. Therefore, the emergency control strategy should be developed.
b. Implementation of Emergency Control Strategy Decision-Making.
As discussed in the above, the permanent fault will cause bipolar blocking events of HVDC 2 and HVDC 3, leading to a power loss of 16 GW. Through applying the decision-making method proposed in Section 4.2, the emergency control strategy is to increase the transmission power of the rest HVDC systems by 0.4 GW at 2.4 s and shear a load of 15.3 GW at 2.6 s. The static and dynamic indices before and after adopting the emergency control strategy are shown in Figure 11. The steady-state and transient frequency indices will exceed the preset ranges without control, while all static and dynamic indices are within preset ranges with the control strategy obtained by the proposed method.

5.2. Test System 2

Test system 2 is divided into three regional grids by 8 HVDC lines, as shown in Figure 12. There are 271 buses and 296 AC transmission lines. The total capacity of the generators and loads are 27,550 and 26,878 MW, respectively. For the HVDCs, the rated voltage is ±800 kV and the transmission power is 800 MW, respectively. The specific information of regions is shown in Table 3.
Due to the space limitations, only the results of the emergency control strategy are presented. Assume that HVDC 3 is blocked at 1.4 s under the scenario of operation failure of protection. The steady-state frequency and the transient frequency of region A and C exceed the threshold. Therefore, the emergency control strategy is developed based on the decision-making method proposed in Section 4.2.
The emergency control strategy for the bipolar blocking event of HVDC 3 is to increase the transmission power of the rest HVDC systems between region A and C by 160 MW (HVDC 2 and HVDC 6), HVDC systems between region B and C by 320 MW (HVDC 4, HVDC 5, HVDC 7, and HVDC 8), and decrease the transmission power of HVDC 1 by 320 MW at 1.5 s. Then, a generator of 600 MW in region A is sheared at 1.6 s and a load of 500 MW in region C at 1.7 s. The static and dynamic security indices of the three regions before and after adopting the emergency control strategy are shown in Figure 13, Figure 14 and Figure 15, respectively. The steady-state and transient frequency indices of region A and C finally meet the preset ranges with the control strategy obtained by the proposed method.

6. Conclusions

This paper proposes an on-line pre-decision-making scheme, including security assessment and an emergency control strategy decision-making, for power systems with multi-infeed HVDCs. The security assessment method is based on the EMT-TS hybrid simulation, and can generate accurate assessment results while maintaining the high computational efficiency. The emergency control strategy decision-making method can make full use of HVDCs, pumped storages, and interruptible loads to maintain the security and stability of receiving-end systems. The case studies showed that the proposed scheme is reliable. In addition, the results also indicate that it is essential to describe interactions between AC and DC subsystems in security assessment to identify HVDC-related security and stability issues.
In future work, the dynamic average-value modeling method can be used in HVDC modeling to further improve the computational efficiency. In addition, more attention will be paid to the detailed design of the emergency control strategy, such as the coordination of HVDC controllers and the classification of interruptible loads.

Author Contributions

All authors contributed to the research in the paper. Conceptualization, Y.W. and Y.X.; Data curation, Z.S.; Formal analysis, Q.Z. and Z.S.; Funding acquisition, J.H.; Investigation, Q.Z.; Methodology, Q.Z. and Z.S.; Project administration, Y.W., J.H. and Y.X.; Resources, M.L.; Software, Q.Z. and Z.S.; Supervision, J.H., Y.X. and M.L.; Validation, Y.W.; Visualization, M.L.; Writing—original draft, Q.Z. and Z.S.; Writing—review & editing, Y.W. and Y.X. and all the authors have read and approved the final manuscript. All authors have read and agreed to the published version of the manuscript.

Funding

This work was funded by the Fundamental Research Funds for the Central Universities, Grant No. 2018YJS155, and the National Key R&D Program of China, Grant No. 2017YFB0902600.

Conflicts of Interest

The authors declare no conflict of interest.

References

  1. Pedroso, F.R.V.A.; Bassini, M.T.; Horita, M.A.B.; Jardini, J.A.; Graham, J.F.; Liu, G. HVDC multi-infeed analysis of the Brazilian transmission system and possible mitigation methods. CSEE J. Power Energy Syst. 2018, 4, 487–494. [Google Scholar] [CrossRef]
  2. Li, X.; Li, Y.; Liu, L.; Wang, W.; Li, Y.; Cao, Y. Latin hypercube sampling method for location selection of multi-infeed HVDC system terminal. Energies 2020, 13, 1646. [Google Scholar] [CrossRef] [Green Version]
  3. Li, H.C.; Yuan, Y.B.; Bian, Z.D.; Xu, W. Analysis of frequency emergency control characteristics of UHV AC/DC large receiving end power grid. J. Eng. 2017, 36, 27–31. [Google Scholar] [CrossRef]
  4. Zhou, B.R.; Rao, H.; Wu, W.; Wang, T.; Hong, C.; Huang, D.Q.; Yao, W.F.; Su, X.R.; Mao, T. Principle and application of asynchronous operation of china southern power grid. IEEE J. Emerg. Sel. Top. Power Electron. 2018, 6, 1032–1040. [Google Scholar] [CrossRef]
  5. Aik, D.L.H.; Andersson, G. Impact of renewable energy sources on steady-state stability of weak AC/DC systems. CSEE J. Power Energy Syst. 2017, 3, 419–430. [Google Scholar] [CrossRef]
  6. Zhang, F.; Xin, H.H.; Wu, D.; Wang, Z.; Gan, D.Q. Assessing strength of multi-infeed LCC-HVDC systems using generalized short-circuit ratio. IEEE Trans. Power Syst. 2019, 34, 467–480. [Google Scholar] [CrossRef]
  7. Shao, Y.; Tang, Y. Fast Evaluation of commutation failure risk in multi-infeed HVDC systems. IEEE Trans. Power Syst. 2017, 33, 646–653. [Google Scholar] [CrossRef]
  8. Wu, P.; Zhao, B.; Guo, J.B.; Bu, G.Q. Coordinated control method of interconnected grid to solve cascading faults of UHVDC valve groups. Power Syst. Technol. 2017, 41, 1460–1467. [Google Scholar]
  9. Luo, J.; Gong, Y.; Li, H.C. Online emergency control and corrective control coordination strategy for UHVDC blocking faults. In Proceedings of the International Conference on Electronics Technology, Chengdu, China, 23–27 May 2018; pp. 5–10. [Google Scholar]
  10. Tian, F.; Zhang, X.; Yu, Z.H.; Qiu, W.J.; Shi, D.Y.; Qiu, J.; Liu, M.; Li, Y.L.; Zhou, X.X. On-line decision-making and control of power system stability based on super-real-time simulation. CSEE J. Power Energy Syst. 2016, 2, 95–103. [Google Scholar] [CrossRef] [Green Version]
  11. Bao, Y.H.; Xu, T.S.; Zhou, H.; Ren, X.C.; Lou, B.L.; Wu, F. An online pre-decision method for security and stability emergency regulation. Electr. Power 2019, 52, 91–97. [Google Scholar]
  12. Lin, L.; Zhang, K.; Sun, F.; Li, Q.J. Comparison and conversion of dynamic models of speed governor for transient stability analysis in BPA and PSS/E. In Proceedings of the Asia-Pacific Power and Energy Engineering Conference, Chengdu, China, 28–31 March 2010; pp. 1–4. [Google Scholar]
  13. Cui, Y.; Feng, N.; Feng, Y.Y.; Yu, Y.H.; Wang, W.H. Evaluation of security and stability risk of AC/DC grid under extreme contingencies. In Proceedings of the Asia-Pacific Power and Energy Engineering Conference, Xi’an, China, 25–28 October 2016; pp. 1284–1290. [Google Scholar]
  14. Li, H.; Diao, R.; Zhang, X.; Lin, X.; Lu, X.; Shi, D.; Wang, Z.W.; Wang, L. An integrated online dynamic security assessment system for improved situational awareness and economic operation. IEEE Access 2019, 7, 162571–162582. [Google Scholar] [CrossRef]
  15. Wang, Y.; Li, K.; Zhang, G.H.; Su, J.J.; Xie, J.P.; Li, J.L. Online dynamic voltage stability assessment method of AC/DC power systems. J. Eng. 2019, 16, 1356–1360. [Google Scholar] [CrossRef]
  16. Zadkhast, S.; Jatskevich, J.; Vaahedi, E. A multi-decomposition approach for accelerated time-domain simulation of transient stability problems. IEEE Trans. Power Syst. 2015, 30, 2301–2311. [Google Scholar] [CrossRef]
  17. Kim, S.; Overbye, T.J. Optimal subinterval selection approach for power system transient stability simulation. Energies 2015, 8, 11871–11882. [Google Scholar] [CrossRef] [Green Version]
  18. Zhan, F.J.; Du, Z.B.; Zhao, F.; Zhang, Y. Analysis of the transient voltage stability of AC/DC system based on numerical energy function method. In Proceedings of the Asia-Pacific Power and Energy Engineering Conference, Xi’an, China, 25–28 October 2016; pp. 2204–2208. [Google Scholar]
  19. Chen, X.; Xu, Y.; He, J.H. Transient stability analysis of AC-DC hybrid power systems using direct method. In Proceedings of the 2nd International Electrical and Energy Conference (CIEEC), Beijing, China, 4–6 November 2018; pp. 76–81. [Google Scholar]
  20. Xu, Y.; Dong, Z.Y.; Zhang, R.; Xue, Y.; Hill, D.J. A decomposition-based practical approach to transient stability-constrained unit commitment. IEEE Trans. Power Syst. 2015, 30, 1455–1464. [Google Scholar] [CrossRef]
  21. Bhui, P.; Senroy, N. Real-time prediction and control of transient stability using transient energy function. IEEE Trans. Power Syst. 2017, 32, 923–934. [Google Scholar] [CrossRef]
  22. Xu, T.; Li, G.; Yu, Z.; Zhang, J.; Wang, L.; Li, Y.; Zhang, Y.; Zhuang, K.; Luo, J.; Li, D. Design and Application of emergency coordination control system for multi-infeed HVDC receiving-end system coping with frequency stability problem. Autom. Electr. Power Syst. 2017, 41, 98–104. [Google Scholar]
  23. Yin, J.J. Research on load friendly interactive technology for safe operation of UHV interconnected power grid. Proc. CSEE 2016, 36, 5715–5723. [Google Scholar]
  24. Ren, C.; Xu, Y. A fully data-driven method based on generative adversarial networks for power system dynamic security assessment with missing data. IEEE Trans. Power Syst. 2019, 34, 5044–5052. [Google Scholar] [CrossRef]
  25. Zhang, R.Y.; Wu, J.Y.; Xu, Y.; Li, B.Q.; Shao, M.Y. A hierarchical self-adaptive method for post-disturbance transient stability assessment of power systems using an integrated CNN-based ensemble classifier. Energies 2019, 12, 3217. [Google Scholar] [CrossRef] [Green Version]
  26. Wang, H.; Chen, Q.; Zhang, B. Transient stability assessment combined model framework based on cost-sensitive method. IET Gener. Transm. Distrib. 2020, 14, 2256–2262. [Google Scholar] [CrossRef]
  27. Szechtman, M.; Ximenes, M.J.; Saavedra, A.R. Comparative analysis of stability and electromagnetic transient studies for HVDC multi-infeed systems. CSEE J. Power Energy Syst. 2017, 3, 253–259. [Google Scholar] [CrossRef]
  28. Shekari, T.; Aminifar, F.; Sanaye-Pasand, M. An analytical adaptive load shedding scheme against severe combinational disturbances. IEEE Trans. Power Syst. 2016, 31, 4135–4143. [Google Scholar] [CrossRef]
  29. Sun, D.; Zhou, H.; Ju, P.; Zhou, R.; Su, D.; Xu, C. Optimization method for emergency load control of receiving-end system considering coordination of economy and voltage stability. Autom. Electr. Power Syst. 2017, 41, 106–112. [Google Scholar]
  30. Xu, X.; Zhang, H.; Li, C.; Liu, Y.; Li, W.; Terzija, V. Optimization of event-driven emergency load-shedding considering transient security and stability constraints. IEEE Trans. Power Syst. 2017, 32, 2581–2592. [Google Scholar] [CrossRef]
  31. Zhang, C.L.; Chu, X.D.; Zhang, B.; Ma, L.L.; Li, X.; Wang, X.B.; Wang, L.; Wu, C. A coordinated DC power support strategy for multi-infeed HVDC systems. Energies 2018, 11, 1637. [Google Scholar] [CrossRef] [Green Version]
  32. Zhang, N.Y.; Zhou, Q.; Hu, H.M. Minimum frequency and voltage stability constrained unit commitment for AC/DC transmission systems. Appl. Sci. 2019, 9, 3412. [Google Scholar] [CrossRef] [Green Version]
  33. Song, Y.Z.; Meng, J. Optimization strategy of under-frequency load shedding for pumped storage units in power system. Meas. Control Technol. 2017, 36, 52–56. [Google Scholar]
  34. Li, H.; Yuan, Y.; Zhang, X.; Su, C. The frequency emergency control characteristic analysis for UHV AC/DC large receiving end power grid. Electr. Power Eng. Technol. 2017, 36, 27–31. [Google Scholar] [CrossRef]
  35. Dong, X.J.; Luo, J.B.; Li, X.M.; Li, B.; Wan, F.; Xue, F.; Wang, Z.; Li, Z. Research and application of frequency emergency coordination and control technology in hybrid AC/DC power grids. Power Syst. Prot. Control 2018, 46, 59–66. [Google Scholar]
  36. Yuan, S.; Chen, D.Z.; Luo, Y.Z.; Ren, J.; Song, Y.; Jia, L.; Zi, P.; Wang, Q.; Li, Z.; Zhang, C.; et al. Stability characteristics and coordinated control measures of multi-resource for DC blocking fault impacting weak AC channel. Electr. Power Autom. Equip. 2018, 38, 203–210. [Google Scholar]
  37. Shu, Y.B.; Tang, Y.; Sun, H.D. Research on power system security and stability standards. Proc. CSEE 2013, 33, 1–8. [Google Scholar]
  38. Jing, L.M.; Wang, B.; Dong, X.Z. Review of consecutive commutation failure research for HVDC transmission system. Electr. Power Autom. Equip. 2019, 39, 116–123. [Google Scholar]
  39. Pipelzadeh, Y.; Moreno, R.; Chaudhuri, B.; Strbac, G.; Green, T.C. Corrective control with transient assistive measures: Value assessment for Great Britain transmission system. IEEE Trans. Power Syst. 2017, 32, 1638–1650. [Google Scholar]
  40. Jiang, X.; Li, S. BAS: Beetle antennae search algorithm for optimization problems. Int. J. Robot. Control 2018, 1, 1–5. [Google Scholar] [CrossRef]
  41. Sauer, P.W.; Tomsovic, K.L.; Vittal, V. Power System Stability and Control, 2nd ed.; CRC Press: Boca Raton, FL, USA, 1985; Chapter 15. [Google Scholar]
  42. Thio, C.V.; Davies, J.B. Commutation failures in HVDC transmission systems. IEEE Trans. Power Deliv. 1996, 11, 946–957. [Google Scholar] [CrossRef]
  43. Huang, Y.; Xu, Z.; He, H. HVDC Models of PSS/E and their applicability in simulations. Power Syst. Technol. 2004, 28, 25–29. [Google Scholar]
  44. Li, W.; Niu, S.B.; Lv, Y.Z.; Ke, X.Y.; Huo, C.; Yu, Y.; Xu, Z.; Wen, Y.; Liu, N. HVDC electromechanical transient model and comparison with HVDC electromagnetic transient model. High Volt. Appar. 2018, 54, 155–160. [Google Scholar]
  45. PSS/E-High-Performance Transmission Planning and Analysis Software. Available online: https://new.siemens.com/global/en/products/energy/services/transmission-distribution-smart-grid/consulting-and-planning/pss-software/pss-e.html (accessed on 10 May 2019).
  46. PSCAD. Available online: https://hvdc.ca/pscad/ (accessed on 5 March 2019).
  47. E-Tran. Available online: http://www.electranix.com/software/ (accessed on 15 May 2019).
  48. Heffernan, M.D.; Tunrer, K.S.; Arrillaga, J.; Arnold, C.P. Computation of AC-DC system disturbances-Parts I: Interactive coordination of generator and convertor transient models. IEEE Trans. Power Appar. Syst. 1981, 100, 4341–4348. [Google Scholar] [CrossRef]
  49. Tuner, K.S.; Heffernan, M.D.; Arnold, C.P.; Arrillaga, J. Computation of AC-DC system disturbances-Parts II: Derivation of power frequency variables from convertor transient response. IEEE Trans. Power Appar. Syst. 1981, 100, 4349–4355. [Google Scholar] [CrossRef]
  50. Reeve, J.; Adapa, R. A new approach to dynamic analysis of ac networks incorporating detailed modeling of DC systems. Part I: Principles and implementation. IEEE Trans. Power Deliv. 1988, 3, 2005–2011. [Google Scholar] [CrossRef]
  51. Zhang, H.; Li, R.; Song, Y.T.; Liu, W.Z. Research on the interface algorithm of power system electromechanical-electromagnetic hybrid simulation. In Proceedings of the 5th International Conference on Electric Utility Deregulation and Restructuring and Power Technologies (DRPT), Changsha, China, 26–29 November 2015; pp. 296–300. [Google Scholar]
  52. Shi, Z.; Xu, Y.; Wu, X.Y.; He, J.H.; Yang, R.; Yang, M. Assessment of system protection strategy and aided decision scheme for AC/DC hybrid power systems. Electr. Power Autom. Equip. 2020, 40, 25–31. [Google Scholar]
  53. Chen, G.P.; Li, M.J.; Xu, T. System protection and its key technologies of UHV AC and DC power grid. Autom. Electr. Power Syst. 2018, 42, 8–16. [Google Scholar]
  54. Li, G.; Liang, J.; Ma, F.; Ugalde-Loo, C.E.; Liang, H.F. Analysis of single-phase-to-ground faults at the valve-side of HB-MMCs in HVDC systems. IEEE Trans. Ind. Electron. 2019, 66, 2444–2453. [Google Scholar] [CrossRef]
  55. Xu, X.; Zhang, H.X.; Li, C.G.; Liu, Y.K.; Li, W. Emergency load shedding optimization algorithm based on trajectory sensitivity. Autom. Electr. Power Syst. 2016, 40, 143–148. [Google Scholar]
Figure 1. Procedure of the on-line pre-decision-making scheme.
Energies 13 03174 g001
Figure 2. Topology of the power system.
Energies 13 03174 g002
Figure 3. Implementation of the hybrid simulation.
Energies 13 03174 g003
Figure 4. Flowchart of the decision-making procedure.
Energies 13 03174 g004
Figure 5. Topology of test system 1.
Energies 13 03174 g005
Figure 6. (a) Impedance-frequency characteristic of the rectifier-side bus 301; (b) Impedance-frequency characteristic of the inverter-side bus 55.
Energies 13 03174 g006
Figure 7. (a) Voltage of typical interface buses; (b) Active power, dc voltage, and extinction angle at the inverter side of HVDC 2.
Energies 13 03174 g007aEnergies 13 03174 g007b
Figure 8. (a) Static indices; (b) Dynamic indices corresponding to the minimum transient frequency and voltage; (c) Dynamic indices corresponding to the maximum transient frequency and voltage.
Energies 13 03174 g008
Figure 9. Load shedding amount under different schemes.
Energies 13 03174 g009
Figure 10. (a) Voltage of interface buses; (b) Active power, dc voltage and extinction angle at the inverter side of HVDC 2; (c) Active power, dc voltage, and extinction angle at the inverter side of HVDC 3.
Energies 13 03174 g010aEnergies 13 03174 g010b
Figure 11. (a) Static indices; (b) Dynamic indices corresponding to the minimum transient frequency and voltage; (c) Dynamic indices corresponding to the maximum transient frequency and voltage.
Energies 13 03174 g011
Figure 12. Topology of test system 2.
Energies 13 03174 g012
Figure 13. Static and dynamic security indices of region A. (a) Static indices; (b) Dynamic indices corresponding to the maximum transient frequency and voltage.
Energies 13 03174 g013
Figure 14. Static and dynamic security indices of region B. (a) Static indices; (b) Dynamic indices corresponding to the maximum transient frequency and voltage.
Energies 13 03174 g014
Figure 15. Static and dynamic security indices of region C. (a) Static indices; (b) Dynamic indices corresponding to the minimum transient frequency and voltage.
Energies 13 03174 g015
Table 1. Typical criteria of commutation failures and blocking events in two simulation methods.
Simulation MethodsCommutation FailuresBlocking Events
Pure TS simulationAC voltage at the inverter side (e.g., 0.785 p.u.)AC voltage at the
rectifier side (e.g., 0.6 p.u.)
EMT-TS simulationExtinction angle (7.2° [44])Interval between two commutation failures (200 ms [38])
Table 2. Preset ranges of the security assessment index system.
Static Security IndicesPreset RangeDynamic Security IndicesPreset Range
steady-state
frequency deviation (Hz)
f| < 0.05maximum/minimum transient frequency (Hz)49.5 < f < 50.5
steady-state
voltage deviation (p.u.)
V| < 0.1maximum/minimum transient voltage (p.u.)0.85 < V < 1.1
steady-state
power flow of lines (p.u.)
p < pmaxmaximum transient relative power angle (°)Δδ < 360°
Table 3. Specific information of regions.
RegionsCapacity of Generators (MW) Capacity of Loads (MW)Sending HVDC (MW)Feeding HVDC (MW)
Region A810063633200800
Region B10,000565340000
Region C945014,86205600

