1. Introduction
Buildings constitute a very high percentage of energy consumption compared to other sectors of the economy. As cited by Ji and Chan (2019), on average, the total energy consumption globally from the residential buildings sector is around 20% which may reach 30% by 2040 due to increasing population, economic activities and the improved standards of living [
1]. This situation has led many countries to formulate energy policies that help to reduce energy consumption and ultimately CO
2 emissions. Many countries have begun to adopt mandatory green requirements for their building developments, and green rating systems have become increasingly widely adopted worldwide. Some of the most widely used rating systems include: (i) Leadership in Energy and Environmental Design (LEED), (ii) Building Research Establishment Environmental Assessment Methodology (BREEAM), and (iii) Green Globe Canada [
2]; while other well-recognised rating systems include: (iv) Green Star Australia, (v) Building Environmental Performance Assessment Criteria (BEPAC) Canada, (vi) GB tool Korea, and (vii) Comprehensive Assessment System for Built Environment Efficiency (CASBEE) in Japan [
3]. The green rating systems mentioned above have a very limited focus on occupant behaviour monitoring systems during a building’s operational phase. Evidence exists [
4,
5] in support of the fact that by improving occupant behaviour, energy consumption can be reduced by 8–15% in all types of buildings, resulting in lower carbon emissions. The importance of environmentally friendly behavioural improvement is evident from the fact that many buildings using new technology-oriented systems fail to meet their ‘as designed’ performance expectations [
6]. Large discrepancies exist between as-designed (predicted) and real building energy performances (performance gap), typically averaging around 30% [
7]. At least some of this performance gap is attributable to unforeseen usages by occupants of these green/LEED-certified buildings and their equipment.
It has been known for a long time that occupant behaviour can greatly influence energy use in buildings [
8]. As stated by Nguyen and Aiello [
9], the ways in which occupants interact with a building have shown to exert large impacts on heating, ventilation and air-conditioning (HVAC) demand and building controls. According to Schipper et al. (1989) [
10] where 50% of energy use in homes is attributed to the intrinsic building shell, HVAC, lighting, and electronics, the rest occurs due to the occupant interaction with these systems. In their study in mid-1990s, FSEC determined the magnitude of occupancy-related effects by examining energy usage in ten identical homes in Florida [
11]. With the same number of occupants and identical appliances and equipment, energy use varied by 2.6 to 1 from the highest to the lowest consumer with a standard deviation of around 13 kWh/day—32% of the mean. On further examination FSEC found that while the electrical consumption of appliances like refrigerators were remarkably similar, air conditioning e.g., varied by 5:1 from highest to lowest. The measurements of interior temperature displayed huge differences due to differing thermostat behaviour. In another study [
11,
12], the utility bills of eleven similarly efficient solar homes in Sacremento were compared to other non-solar homes in the same community, to show large variations in annual energy use in the solar homes. In comparison with the most frugal home, where solar electricity generation was more than the consumption, the highest-consuming solar home used almost twice as much electricity as the average energy use of non-solar homes. These studies suggest that motivating changes to occupant behaviour could be a powerful measure for achieving energy reductions, especially in more efficient homes with renewable energy features.
Occupant environmental behaviour is therefore one of the major reasons behind the significant uncertainty regarding building energy consumption and the performance gap [
13,
14]. Dynamic building energy models are now commonly used in academia and industry for a detailed analysis of heating and cooling energy consumption. Although these models interpret thermal behaviour of a building with high precision in relation to its ambient indoor and outdoor environment, the interpretation of occupant behaviour is subjected to relatively simplified input data. Extensive research has been undertaken to evaluate the sensitivity of models to the buildings technical design parameters whereas evaluation of factors such as energy management and energy users behaviour, which play a significant role in influencing building energy consumption, have rarely been performed [
15,
16]. Several recent studies have focused on measures for achieving highly efficient and comfortable buildings, using the Operative Air Temperature or the PMV and PPD indices as parameters, but sometimes the numerical predictions are different from the real performance of the building, if the behaviour of the occupant is not taken into account [
17]. Other studies have revealed that advances in technology and investments alone cannot warrant a low energy future in a building. Zhang et al. (2020) e.g., undertook a survey in Beijing, China highlighting that no significant correlation exists between occupant purchase behaviour of energy efficient equipment against their usage behaviour and confirmed that there was no coherent pattern that could be explained by any single socio-demographic factor [
18]. Ashouri et al. (2019) introduced a new ranking procedure for performing comparisons between the occupants of several buildings in order to perform an evaluation of the energy performance of each building in comparison with the others and provide suggestions to occupants for energy conservation in order to improve their rank [
19].
The widening gap between real energy consumption and the estimated energy consumption at the design stage demands that behavioural aspects should be taken into account more rigorously than ever [
20]. A better understanding of occupant environmental behaviour is therefore needed to improve this uncertainty [
21] and to reduce energy consumption by up to 8–15% in all types of buildings [
4,
5].
The industry contains green building initiatives, such as the LEED and many other good practices around the globe, which are meant to promote sustainability in the built environment by incorporating measures that raise awareness among the public about environmental issues and energy conservation. Most studies on energy consumption of LEED-certified buildings have concluded that an energy performance gap exists between predicted and actual energy consumption [
6]. One of the key common factors is that the buildings may not be operated properly in cases where a knowledge gap exists with respect to energy between the industry professionals, the building operators, and the occupants. In addition to these considerations, occupants perform various actions to satisfy their needs in buildings; actions which can negatively affect building energy consumption, because those occupants do not always behave in an environmentally friendly manner to achieve the energy-saving potential of their buildings [
22]. This micro-focus has therefore created a research opportunity to investigate LEED-certified residential buildings in use in detail and to explore how we can better understand occupant behaviour through more intensive post occupancy evaluations.
In this paper, we introduce a novel way of using Structural Equation Modelling (SEM) to investigate in detail the interrelationships between latent (unobserved) variables, occupant environmental Attitudes, Knowledge and Behaviour (AKB), based on observed data to understand their true environmental behaviour. Questionnaire data from the residents of four LEED-certified multi-residential buildings in Dubai, United Arab Emirates (UAE) were used for this purpose. Data analysis was conducted through SPSS for the survey questionnaire, with the data later being transferred to Analysis of Moment Structure (AMOS) software in order to develop a measurement and a structural model using the SEM.
The paper is structured as follows:
Section 2 provides background and context on the challenges associated with energy conservation for the chosen location,
Section 3 describes the research methodology, the SEM technique used and the development and enhancement of the measurement and structural models,
Section 4 describes the questionnaire and experimental results,
Section 5 discusses the results and
Section 6 draws the conclusions.
2. Background and Context
The hot and arid climate of the UAE poses great challenges with respect to reducing energy consumption in buildings. The extremely high insolation and humidity levels together with the lack of consideration given towards energy conservation and green practices over the several years of its early development, identify the UAE as one of the top ten countries in electricity usage and second in carbon dioxide emissions per capita [
23]. Over the past 20 years, the UAE has experienced rapid growth, which has resulted in a large and growing stock of modern high-density buildings. Today the UAE has become one of the world’s biggest per capita air polluters, and it has been listed as the country with the highest per capita fossil fuel consumption and carbon dioxide emission rates worldwide [
24]. In addition, because of increasing tourism, together with average population growth, the UAE’s demands on natural resources have also increased in terms of water and energy consumption, in addition to a massive production of waste.
In the UAE, cooling accounts for almost 80% of a building’s electricity demand. The outdoor air temperature in the UAE is above 25 °C for 75% of typical working hours, with relative humidity being above 60% for more than 20%, and insolation being in excess of 893 W/m
2 for more than 15% of the year. These environmental conditions necessitate the use of mechanical cooling by air conditioning to maintain internal thermal comfort for the majority of the year [
25]. It is reasonable to conclude that the construction industry practices in the UAE were not sustainable when they were created, especially when compared to today. The focus of investors was mainly on obtaining the quickest returns on their investments; a focus that ultimately led to the downfall of the UAE’s construction sector. Studies [
24,
26] have demonstrated the high energy consumption and CO
2 emissions of most existing buildings in Dubai and Abu Dhabi when compared to international benchmarks. Statistics show that 43% of the CO
2 production is due to electricity usage within buildings in the UAE, and only 4% is due to the direct emissions of buildings [
26]. The UAE’s government has recognised the importance of energy efficiency and has focused on the building sector as the main energy consumer.
In 1991, the UAE established an NGO called the Emirates Environmental Group for the purpose of promoting sustainability in the UAE [
27]. Since then, buildings in the commercial stock, in both the growing and newer buildings, have increasingly adopted energy-efficient strategies to address demands for cooling. These changes in newer buildings are influenced by the national drive towards sustainability, and particularly the introduction of green building regulations in 2003, when the Dubai municipality enforced Degree 66 as an energy saving approach. These savings were to be achieved by improving the insulation and glazing systems in building. Subsequently, the Emirates Green Building Council (GBC) was created in 2006 to ensure environmental sustainability in the UAE, and the Estidama programme was established by the Abu Dhabi Planning Council in 2008, involving guidelines for both the design and operation of sustainable buildings [
28]. The UAE substantially promoted sustainable development after the 2008 economic crisis in order to bring the construction sector in the UAE into line with international sustainability standards [
29] and chose sustainability as an important factor in its bid for EXPO 2020 [
30,
31]. After winning the bid, the EXPO 2020 sustainability policy states the intention to host one of the most sustainable World Expos in history [
32].
Masdar City is one of the most remarkable projects in the UAE, such as; a carbon-neutral and sustainable city powered by renewable energy technologies under the supervision of the government-owned Mubadala Development Company for Abu Dhabi vision 2030. Innovative designs and technologies, such as (i) solar panels, (ii) wind turbines, (iii) recycled glass, (iv) high-temperature plasma torch systems, and (v) non-toxic plastic products, are used to promote a safer environment in the Masdar City Project [
33]. Thermal insulation and green building codes have been applied in both Dubai and Abu Dhabi; however, there is no model for analysing the impact of these codes on the reduction of CO
2 emissions [
26]. The most popular green agencies for buildings in the United Arab Emirates (UAE) are the LEED, which is mostly used in Dubai, and then BREEAM, which is mostly applied in Abu Dhabi [
28].
The existence of green building initiatives such as LEED and many other good practices regulated by the UAE government [
28,
30,
31,
34] does not necessarily mean that a building’s occupants behave in an environmentally friendly fashion. LEED’s rating categories generally encourage sustainable design, health, and economic benefits; however, they do not consider the significance of the human dimensions: capabilities, attitudes, knowledge and behaviour [
35,
36]. There is clearly a need for further research to clarify this issue in order to bridge the gap between estimated and true energy savings. Jones and Vyas (2008) [
37] stated that measuring or verifying the post-occupancy performance of homes will help by increasing the data available for improving on the real performance attributes of green residential buildings. The researchers noted that changes in occupant behaviour could be achieved by addressing everyone’s energy consumption awareness, as well as facilitating the occupant group’s knowledge and perceptions through advertising, marketing, and other information strategies [
38,
39]. Therefore, this research explored whether the occupants possessed the knowledge to change and/or improve their environmental behaviour in order to achieve energy savings, and whether their beliefs and attitudes could lead them towards greener behaviour. To fulfil the stated purpose, the interrelationships among occupant environmental Attitudes, Knowledge and Behaviour (AKB) were analysed as described in the later sections.
3. Research Methodology
The research design is summarized in
Figure 1 as follows:
3.1. Questionnaire Survey
In order to understand better different factors affecting occupant behaviour and their preferences to behave in a certain way, a questionnaire survey was designed to collect quantitative data needed to confirm the relationship between the observed and latent variables. The design of the questionnaire was based on studies on post occupancy evaluation (POE) survey questions and questions for other similar research studies [
40]. Reviewing such resources helped to address the identified questions in a way that was relevant to this research study. There was a total of 31 short questions with multiple choice answers. For simplicity, the structure of the questionnaire was made as easy as possible for the participants to respond to. The questionnaire consisted of five sections, starting with demographic questions followed by questions relating to occupant comfort/satisfaction level and the effectiveness of the management system in relation to the training and knowledge sharing in their buildings. The questions were aimed at gauging the attitudes and knowledge that influence the occupant’s environmental behaviour.
The questionnaire was rigorously tested for ease to manage and understandability for the volunteer respondents. Only a few modifications were made after completing the testing procedure. For example, there was no ‘Do not know’ option for the multiple choice questions, and after observing the lack of answers to some of the questions (knowing that occupants did not know the answer), it was decided to add the option to avoid missing values while analyzing the data in SPSS and AMOS.
3.2. Survey Sampling
By the time of setting the research study, there were 15 LEED-certified residential multi-family buildings and 14 villas with approximately 1724 units with less than a 60% occupancy rate. By speaking with building operators and the USGBC, it was found that there were approximately 1034 occupants in those LEED-certified units in the UAE in 2014 [
41]. The required sample size was then calculated with a 5% margin of error, 95% confidence level, and 50% sample proportion as follows:
By putting Sample Size (X) in the True Sample formula:
where ‘n’ is True Sample, X is Sample Size and N is Population,
The required response rate thus was 154 to reach the minimum acceptable threshold/True Sample. The questionnaire was distributed via email, as well as hand delivered. Respondents were reminded every three weeks through follow-up emails, or notes through their door, in order to improve the response rate. If a potential candidate was reminded two times, but still declined to respond then that occupant was removed from the list of potential participants.
3.3. Building Selection
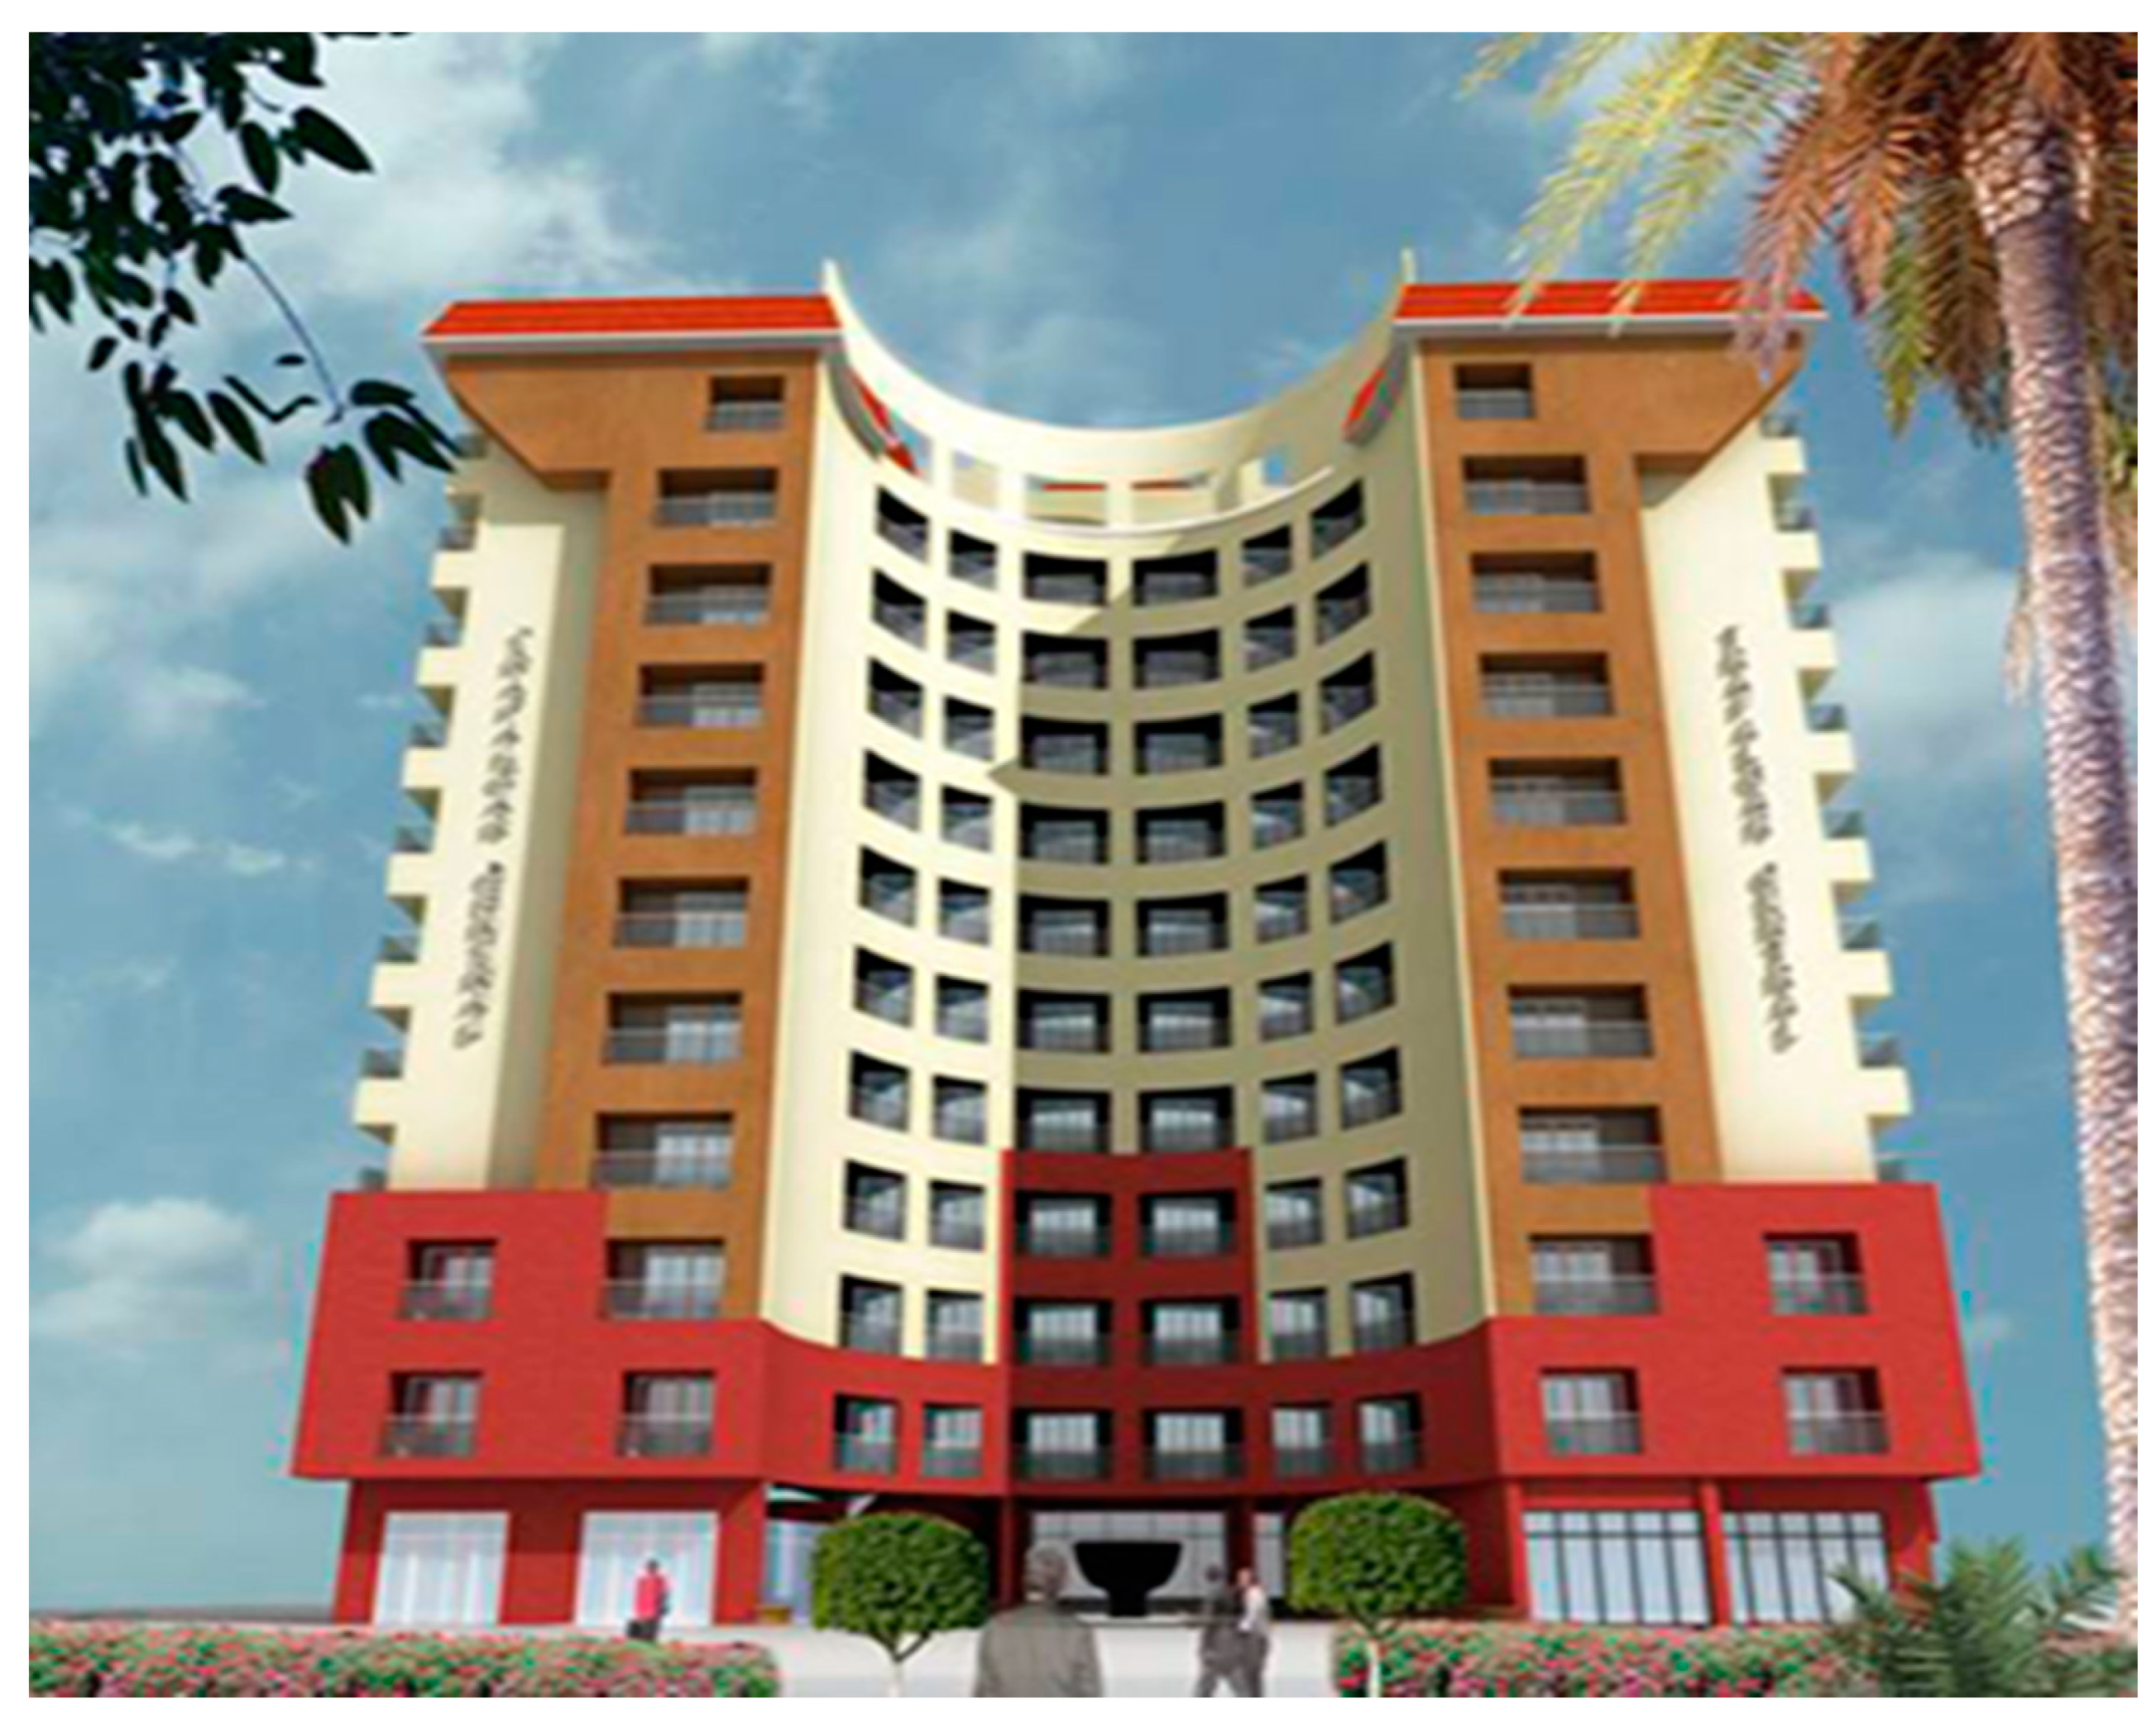
Most occupied LEED-certified buildings in 2014 were in ‘Dubai International City’, from which four LEED-certified multi-residential buildings were recruited (
Figure 2,
Figure 3,
Figure 4 and
Figure 5). The key specifications of these buildings are provided in
Table 1. PR I and PR II were completed in March 2011 and LEED certified in June and October 2011, respectively. TC was completed in July 2011 and certified in August 2012, and HDS SS II was completed in September 2012 and certified in September 2013. Out of the 628 units of the four LEED-certified buildings, there were 265 occupied units at the time of the survey. Therefore, the questionnaire was distributed to a total of 265 occupants residing in those units (flats/apartments). If more than 154 occupants out of 265 had not participated, then the researchers would have had to target more residential units to reach the minimum acceptable threshold (True Sample). A total of 203 occupants responded to the survey with valid answers, resulting in a response rate of 76.6%. Although the response rate is good, the authors acknowledge that their sample is limited to Dubai residents only, which might have incurred bias in terms of environmental concerns, age, etc. Therefore, future research is recommended, using datasets from a wide range of demographics and geographical regions.
3.4. Data Analysis
The collected data was first analysed using the SPSS statistics software (version 22) to obtain descriptive statistics, frequencies, and means, after which the data was transferred to AMOS for deeper analysis using Structural Equation Modeling (SEM) techniques. Descriptive statistics were used as a set of descriptive coefficients to summarise a given data set, which was a representation of the entire population. The mean rating statistical technique was selected to analyse participants’ ratings of the importance of different factors when choosing their homes, by using the numerical values assigned to each factor to compute their mean scores.
The SEM approach was chosen as it was the most appropriate data analysis method for this part of the study. Larger sample sizes (100–400) generally regarded as acceptable for SEM analysis among researchers [
42]. Therefore, the sample size of 203 (survey participants) in the current study was considered to meet the threshold of acceptability. Among all the available software, AMOS was chosen, as it is the most recent statistical package which has a user-friendly graphical interface, and it has become popular as a simpler way of specifying structural models.
The SEM is a forecasting method which can be used in a variety of contexts and offers a confirmatory, rather than an exploratory approach to the data analysis. Most multivariate procedures (e.g., exploratory factor analysis) are essentially descriptive in nature whereas SEM allows analysis of data for conclusive purposes [
42]. SEM has recently become an essential and influential statistical method in social science research [
43]. Ji and Chan [
1] described SEM as a second-generation multivariate analysis technique which combines the functions of exploratory factor analysis and linear regression analysis to achieve the assessment of both the measurement model and structural model simultaneously. SEM offers flexibilities by encompassing various formats and large numbers of variables with fewer limitations e.g., to the sample size and data normality [
44,
45,
46]. SEM has gained popularity in many research areas, e.g., strategic management [
47], information systems [
48], business management [
49,
50], tourism management [
51], accounting [
52], technology adoption by the construction industry [
53], and marketing [
54].
A limitation of traditional multivariate procedures is their incapability of either assessing or correcting for measurement error, SEM on the other hand presents explicit estimates of these error variance parameters. It offers a powerful substitute to multiple regression, path analysis, factor analysis, time series analysis and analysis of covariance. SEM became popular for non-experimental research, where methods for testing theories were not well developed or where ethical considerations make experimental design unfeasible [
55,
56]. According to Hair et al. (1998) [
57], SEM should usually be developed through several stages; first, to define structural components to identify the measurement components which deal with the relationships among the unobserved/latent variables and their indicators/observed variables, then to set up a model specification (hypothetical model) based on the aim of the research, and subsequently to evaluate the model estimates in order to validate the structural model variables and finally to modify the model based on potential changes. By using the confirmatory factor analysis (CFA) approach, SEM makes it possible to review the interrelationship between observed variables and their underlying latent variables. This technique was then used to test the interrelationships among the latent variables affecting occupant behaviour. Where goodness-of-fit is satisfactory, the model shows that there are interrelationships among variables, but where this is inadequate, then the interrelationships among the variables are rejected [
58]. At least three observed variables/indicators are recommended and a common practice whereas, problem exists with two or one observed variable as the measurement error cannot be modelled [
59]. If models use only two observed variables per latent variable, they are more likely to fail, and therefore error estimates might be unreliable.
For the present study, SEM was therefore used to develop a model to quantify complex relations between the environmental Attitude, Knowledge and Behaviour (AKB) of the occupants, as shown in
Figure 6. Such a model refers to implicit or explicit models that relate the latent variables to their observed variables. The measurement model, shows the relations between the latent variables AKB and their observed variables, where the structural model presents the interrelationships among the latent variables (AKB) only. Observed variables within questionnaires included five different sections: (i) building occupant backgrounds, (ii) knowledge, (iii) attitude, (iv) behaviour, and (v) satisfaction level. Three sections of the questionnaire which defined ATTITUDE, KNOWLEDGE and BEHAVIOUR known as AKB in this research study, were chosen for further analysis. The answers to each question were considered to be observed variables while the whole AKB cluster were labelled latent variables. It is the significance of the interrelationships between them that should be measured, analysed and modelled.
4. Results
The results of the questionnaire analysis in SPSS prior to conducting the SEM technique indicated that most occupants were young, the majority averaging between 30 and 49, with college/university degrees and a good knowledge and understanding of sustainability. The majority were renters with an average occupancy number of 2–4 persons. More than 65% of the respondents expressed concerns about the environment and considered climate change to be a global threat. On the other hand, the findings showed that while the majority were concerned about the environment and were aware of sustainability and climate change issues, only relatively few behaved in an environmentally friendly fashion in their daily lifestyle. The comments from the questionnaire indicated that although the majority of the respondents were aware of climate change and they claimed that they considered climate change to be a major or minor threat, and also confirmed the need for energy conservation, they still chose to behave in an un-environmentally friendly fashion; for example, they responded that they run the washing machine at a higher setting rather than using it at the eco mode, or they run the tap while brushing their teeth, etc. It is fair to conclude that their attitudes and values were not leading them to behave in an environmentally friendly manner. This outcome confirms the revelations from the literature review [
60], where the authors noted there were intervening constructs between attitude and behaviour. They mentioned knowledge as an intervening factor, and this research study adds to this finding, as the knowledge should inform and motivate occupants to engage in environmentally friendly behaviour.
Occupants explained that the main factor for moving into the building was the location, which provides easy access to their workplaces. Energy efficiency remains a minor consideration for consumers when choosing a home, with the majority of respondents identifying it as the least important factor out of six choices. In general, occupants displayed some positive attitudes towards environmental behaviour, such as energy and water conservation, but not for recycling, and especially not for alternative transportation. Recycling behaviour, on the other hand, was the most considered behaviour, in comparison to other environmentally sensitive conduct. Several occupants constantly displayed positive attitudes towards recycling due to their knowledge, previous habits, culture, and beliefs, and emphasised how effortless it was to recycle. The findings regarding using public transportation show that occupants relied on their vehicles for grocery shopping even during the wintertime and nice weather. Furthermore, none of the occupants mentioned that they owned a hybrid car.
The majority of occupants confirmed that their cooling system was responsive enough for their needs, so they were able to enjoy a satisfactory thermal comfort level. However, the findings showed that AC working hours, especially during summer days, were very high, and that this caused high energy bills. The other highly rated factor in satisfaction was related to privacy and security; in particular, the latter quality applied not only to their buildings, but to the whole of the UAE. Most of the respondents agreed that there was sufficient light in their homes during daylight hours in order not to need artificial light. There were some exceptions related to lack of daylight caused by inappropriate building design. The occupants agreed that maintenance and operation was of an acceptable level, with some occupants complaining about the quality of the building materials used and the finishes. Dissatisfaction was expressed with respect to high energy bills, and purchase and rental cost, and when asked if they had sufficient garden space and recreational areas, the majority of them were strongly dissatisfied.
Although many occupants received instruction manuals and/or training on how to operate the technologies inside their apartments, the results demonstrated that the quality of information was inconsistent, and was often inadequate or overly complicated, rendering the information incomprehensible, and therefore of little value to the occupants. It was also confirmed that no post-occupancy evaluations were conducted, and no information/feedback processes were implemented to raise awareness among occupants about the environmental outcomes of their behaviour.
The findings highlighted that green buildings require a high level of occupant and operator engagement and understanding in order for them to remain holistically green. Low levels of education, motivation and coordination lead to minimal levels of environmentally focused activity from the building occupants. The survey findings suggested that training and education (Knowledge) driven by motivational factors such as i) creating a good socio-cultural environment, and ii) offering financial incentives are key concerns for achieving sustainable development. Matching technology, management sophistication, understanding roles, social organisation, and interactions among building occupants and operators, together with economic incentives, combine to constitute a major avenue through which proper environmental behaviours can be encouraged.
The authors found inconsistency in occupant AKB-related results, and therefore they decided to further investigate the interrelationships between AKB using the SEM technique as described below.
4.1. Conceptual Measurement Model
The six questions under the attitude-related survey questionnaire were chosen as observed variables by the authors for ATTITUDE, twenty-six questions were included for the behaviour-related survey questionnaire as observed variables for BEHAVIOUR, and three questions related to the provided information and guidelines were chosen for KNOWLEDGE.
The conceptual (hypothesized) measurement model generated in AMOS is presented in
Figure 6. The model shows the interrelationships among the latent/unobserved variables (AKB) and their indicators/observed variables (questionnaire data) for the purpose of assessing goodness of fit and/or validity. The unobserved/latent variable is linked to an observed variable, in order to make its measurement possible. Assessment of ‘ATTITUDE’ (ATT) constitutes the direct measurement of six observed variables obtained through the questionnaire survey; similarly, ‘BEHAVIOUR’ (BEH) is measured through 26 variables (based on recycling, water use, electricity use, lighting use, summer/winter use and transport) and ‘KNOWLEDGE’ (KNOW) is measured through three observed variables. Further analysis was performed through SEM in AMOS, and was categorised and coded as given below:
ATTITUDE
ATT 1: View on climate change
ATT 2: Belief about the impact of energy use on the environment
ATT 3: Current lifestyle related to the environment
ATT 4: Environmentally friendly lifestyle changes and the comparison between now and 4 years ago
ATT 5: Attitude and belief about green buildings
ATT 6: Considering the term LEED-certified while choosing the home
BEHAVIOUR
BEH rec 1: Occupant behaviour towards recycling papers
BEH rec 2: Occupant behaviour towards recycling plastic pieces
BEH rec 3: Occupant behaviour towards recycling glass
BEH rec 4: Occupant behaviour towards recycling metal pieces
BEH rec 5: Occupant behaviour towards recycling carton boxes
BEH wat 1: Using a washing machine economically
BEH wat 2: Using a dishwasher economically
BEH wat 3: Using less water in toilets
BEH wat 4: Pressing both buttons on WC flush
BEH wat 5: Taking showers instead of bathing
BEH wat 6: Turning tap off when brushing teeth
BEH elec 1: Leaving appliances on standby mode
BEH elec 2: Turning off lights if they’re not needed
BEH elec 3: Using low energy light bulbs
BEH elec 4: Using low energy labelled appliances
BEH elec 5: Setting the thermostat for air conditioning
BEH elec 6: Keeping AC off when windows are open
BEH elec 7: Keeping windows open during summer
BEH elec 8: Keeping windows open during winter
BEH elec 9: Closing window shades/blinds
BEH elec 10: Controlling doors/windows airtightness
BEH light: Hourly usage of artificial lighting in a day
BEH ac win: Hourly working of AC in a winter day
BEH ac sum: Hourly working of AC in a summer day
BEH trans 1: Walking or cycling to your work/supermarket
BEH trans 2: Using public transportation
KNOWLEDGE
KNOW 1: Day-to-day energy usage guide
KNOW 2: Operation and maintenance guide
KNOW 3: Emergency cases guide
Figure 6 shows that the CFA model focuses solely on the interrelation between AKB factors and their measured variables. The model determines the goodness-of-fit between the factors in the hypothesised model and the sample data. The factor loading between each latent variable and its observed variables is important to be higher, i.e., ATTITUDE and its observed variables ATT3, ATT4, ATT5 and ATT6, with 0.03, 0.26, 0.12 and 0.22, respectively, are very low, which might be problematic, as they should be closer to 1 in order to achieve goodness of fit.
The above equation, if confirmed, indicates that the model in
Figure 6 is over identified:
t = items to be identified= 70 (35 ‘e’ + 32 factor loading + 3 latent variables)s = number of observed variables (35)
Based on the above result, it is confirmed that the model (
Figure 6) is over identified, meaning that we have more than enough observed variables (35) to identify unobserved items (70), and therefore we have the possibility of eliminating some if we need to, in order to achieve the best model fit.
4.2. Conceptual Measurement Model Evaluation
The list given below explains the acceptable and good fit data ranges [
58,
61] that need to be achieved in order to confirm that a model is a good fit:
Ratio of minimum discrepancy to degrees of freedom (CMIN/DF)—This adjusts the chi-square by calculating the ratio of the minimum discrepancy to degrees of freedom. It ranges between 1 to 2 where values closer to 1 indicate better fit.
Goodness of fit index (GFI)—this determines whether the maximum likelihood estimate of the hypothesised model fits to the data set. It ranges between 0 to 1, GFI > 0.9 means satisfactory fit
Adjusted goodness of fit (AGFI) favours parsimony, AGFI > 0.90 indicates a good fit.
Incremental fit index (IFI)—This is the ratio of the difference between the hypothesised and baseline model degrees of freedom and discrepancy. It ranges between 0 and 1 where higher values indicate better fit.
Normed fit index (NFI)—NFI > 0.9 means satisfactory fit, and values greater than 0.80 suggest a good fit and indicates that the model of interest improves the fit by 80% relative to the model.
Non-normed fit index (NNFI) is preferable for smaller samples. NNFI is also called the Tucker-Lewis index (TLI). TLI > 0.9 indicates a satisfactory fit; TLI compares degrees of freedom and discrepancy between baseline model and those of the hypothesised model. It ranges between 0 and 1 where larger values indicate better fit.
Comparative fit index (CFI)—This compares the fit of a baseline model to the data with the fit of the hypothesised model to the same data. It ranges between 0 and 1, where larger values indicate a better fit. CFI > 0.9 means satisfactory fit.
Relative fit index (RFI), also known as RHO1, is not guaranteed to vary from 0 to 1. RFI close to 1 indicates a good fit.
Root mean square residual (RMR) computes the residual differences between model prediction and data set, and it also takes the square root of the result. It ranges from 0 to 1, with smaller values indicating better fit.
Root mean square error of approximation (RMSEA)—this is a measure of how close/approximate the fit of population data is with the model. <0.05 good fit and <0.08 acceptable fit. LO 90 and HI 90 include the lower and upper limits of a 90% confidence interval for the population
The parsimony ratio (PRATIO) is the ratio of the degrees of freedom in the model to degrees of freedom. It is not a goodness-of-fit test in itself, but is employed in goodness-of-fit measurements like PNFI and PCFI.
The parsimony goodness of fit index (PGFI), is a variant of GFI that penalises GFI by multiplying it by the ratio formed by the degrees of freedom in the model divided by degrees of freedom in the independence model.
The parsimony normed fit index (PNFI) is equal to the PRATIO times NFI.
The parsimony comparative fit index (PCFI) is defined as PRATIO multiplied with CFI. PCFI closer to 1 is a better fit.
PCLOSE tests the null hypothesis that RMSEA is not greater than 0.05. If PCLOSE is less than 0.05 the hypothesis is rejected to conclude that the computed RMSEA is greater than 0.05 which indicates the lack of a close fit.
The significance of the interrelationships among variables in the measurement/hypothesised model was tested in AMOS software in order to review the reliability and commonality of such a model. The results are presented in
Table 2.
The list below checks whether the parameters in
Table 2 related to the data for
Figure 6 are within range and are a good fit, as explained above:
In
Table 2 CMIN/DF is 6.187, which is not a good fit, upper threshold is 5.
GFI is 0.478, which ranges between 0 and 1, but is still not completely satisfactory.
AGFI is 0.410 and is not a good fit.
IFI is 0.417 is within the range, but it is better to be closer to 1 for a better fit.
NFI is 0.375 and it is not satisfactory.
TLI is 0.372, which is within the range, but it is not the best fit and is not satisfactory.
CFI is 0.412, which is within the range, but it is not the best fit.
RFI is 0.332, and it is not the best fit, although it is within the range.
RMR is 0.133, and it is within the range.
RMSEA is bigger than 0.08, at 0.160, which is not even an acceptable fit. In
Table 2, LO 90 is 0.155 and HI 90 is 0.165 which constitute the lower and upper limit of a 90% confidence interval for the population value of RMSEA
PRATIO is 0.936, which would be a better fit with a smaller value.
PGFI is 0.423, which is not a good fit.
PNFI is 0.351, where a value closer to 1 would be a better fit.
PCFI is 0.386, which is not satisfactory.
PCLOSE is 0, which is less than 0.05, RMSEA is 0.160, which is greater than 0.05; therefore the model is not a close fit (
Figure 6).
All of the figures in
Table 2 indicate that
Figure 6 is not a well-fitting measurement model, meaning that none of the observed variables/indicators have strong interrelationships with their own latent variables AKB.
4.3. Conceptual Measurement Model Modification
Based on the results given above, the measurement model was not a good fit, and needed to be modified. To achieve the best fitting measurement model, three main steps [
62] were carried out, as follows:
The first step was to delete paths which had very low factor loadings,
The second step was to covary variables based on the modification indices (MI) in
Table 3,
The third step was to eliminate the observed variables with very high values in the standardised residual correlation matrix,
The path coefficient and GOF sometimes reveal the need to modify models in SEM, which can result in the selection of the best fitting model falling within theoretical expectation and satisfying the GOF measures [
42].
STEP 1:
In the first step, some of the observed variables with a very low factor loading were eliminated from the measurement model as follows:
From ATTITUDE: ATT 3, ATT 5, ATT 6 were eliminated; ATT 4 (0.26) was kept, as it was an important observed variable for supporting the latent variable.
From BEHAVIOUR: BEH wat 1, BEH wat 2, BEH wat 5, BEH wat 6, BEH elec 2, BEH elec 5, BEH elec 6, BEH elec 8, BEH elec 9, BEH elec 10, BEH light, BEH ac win, BEH ac sum, BEH trans 2 were eliminated.
This was due to the very low factor loading shown by the arrow between the latent variable and the observed variables in
Figure 6.
Figure 7 shows the revised measurement model, including the observed variables with higher factor loadings after Step 1, although this might not be the best measurement, and further steps as described above should be carried out.
The above equation, if confirmed, indicates that the model in
Figure 7 is over identified:
t = items to be identified= 36 (18 ‘e’ + 15 factor loading + 3 latent variables)
s = number of observed variables (18)
Based on the above result, it is confirmed that the model (
Figure 7) is over identified, meaning that we have more than enough observed variables (18) to identify the unobserved items (36).
Modification Indices (MI) are often used to modify models in order to achieve a better fit, but this process should be carried out carefully and with theoretical justification [
58]. For the MI generated in Step 1, the threshold was set at 10, and the MI valued as equal to/greater than 11 were selected for Step 2 as shown in
Table 3.
STEP 2:
In this step the model fitting results for
Figure 7 were reviewed in light of the selected modification indices (
Table 3) from Step 1. The authors considered only those observed variables to be covaried that corresponded to the MI that were equal to/greater than 11.
Covarying can be seen in
Figure 8 as small curved two-way arrows between ‘e’ (error variance) of observed variables in the same factor that were equal to or more than 11. All of the errors (e) were from ‘Behaviour’, and they represented covariates or correlations between pairs of variables. For example, the MI between ‘e13′ and ‘e14′ in
Table 3 is 75.421; therefore, it is above the threshold, which was set at 10, and they should be covaried, as shown in
Figure 8.
Figure 8 is the modified measurement model after Step 2, covarying for all the ‘e’ that are shown in
Table 3, which is not yet the best model fit, due to the presence of the low factor loadings shown between each latent variable and their observed variables. There is still some factor loading below 0.1 shown by the arrows in
Figure 8. For example, the arrow going from the latent variable ‘Behaviour’ to its observed variable ‘BEH wat 4′ was very low at −0.12, and the arrow to ‘BEH wat 3′ was 0.02.
STEP 3:
The third step was to go through the standardised residual covariance in
Figure 8 after correlating errors and deleting some of the observed variables above 0.1, shown on the arrows from Behaviour to its indicators/observed variables. Different trials were conducted, and the best outcome was to eliminate the following observed variables: BEH wat 3, BEH wat 4, BEH elec 3, BEH elec 4, BEH elec 7, and BEH trans 1 in BEHAVIOUR. The resultant best fitting measurement model can be seen in
Figure 9.
The above equation, if confirmed indicates that the model in
Figure 9 is over identified:
t = items to be identified= 24 (12 ‘e’ + 9 factor loading + 3 latent variables)
s = number of observed variables (12)
Based on the above result, it is confirmed that the model (
Figure 9) is over identified, meaning that we have more than enough observed variables (12) to identify the unobserved items (24).
The list below checks all the parameters in
Table 4 related to the data for
Figure 9:
4 CMIN/DF is 1.273 which is a good fit.
GFI is 0.954, which ranges between 0 and 1 and is completely satisfactory.
AGFI is 0.922 and it is a good fit.
IFI is 0.994 is within the range and closer to 1, which is a good fit.
NFI is 0.974 and it is satisfactory.
TLI is 0.992, which is within the range and is the best fit and satisfactory.
CFI is 0.994, which is within the range and is a good fit.
RFI is 0.962 and it is a good fit.
RMR is 0.044 and it is within the range, while it is a better fit, as it is smaller and closer to 0.
RMSEA is smaller than 0.08, at 0.037, which is a close fit. In
Table 4, LO 90 is 0.000 and HI 90 is 0.063 which constitute the lower limit and upper limit of a 90% confidence interval for the population value of RMSEA
PRATIO is 0.697, which is smaller now, and indicates an acceptable fit.
PGFI is 0.563, which is an acceptable fit.
PNFI is 0.679, and as this is closer to 1, it is more acceptable.
PCFI is 0.693, and it is satisfactory.
PCLOSE is 0.777, which is now more than 0.05, RMSEA is 0.037, which is less than 0.05; therefore, the hypothesised model (
Figure 9) is confirmed, as it indicates all good fits.
The above list confirms that
Figure 9 is a good model fit after three steps of modifications on the model. This suggests the finding that many of the observed variables (questionnaire results) did not measure their latent variable ‘Behaviour’. Therefore, occupants did not behave in an environemtally friendly manner in all of their daily actions, despite having environmental knowledge, beliefs, and attitudes.
4.4. The Structural Model
The interrelationships among unobserved/latent variables and their observed/measured variables were analysed to reach the best fitting measurement model (
Figure 9,
Table 4). At this stage, where we are confident that the observed variables support their latent variables, we are now ready to create the structural model to identify and verify the interrelationships between latent/unobserved variables. For the latent variables, the direction of the arrows from Attitude and Knowledge toward Behaviour and the correlating arrows between Knowledge and Attitude were determined based on the literature review [
5,
10,
20,
60]. The observed variables remain the same as in
Figure 9, as their interrelationship with their latent variables are confirmed in
Table 4.
The structural model is a hypothesized/conceptualised model that defines interrelationships among the latent (unobserved) variables only, and describes how particular latent variables directly or indirectly influence other latent variables in the model [
58]. The resultant structural model is shown in
Figure 10.
In
Table 5, which is the result for
Figure 10, the estimate for regression weight, covariance and correlation are all below 0.40, without a significant
p-value (the
p-value indicates whether an observation results due to random occurrences or occurs due to a change that was made). This is because estimate values equal to or greater than 0.40 with a significant
p-value < 0.05 indicate strong measurement, while values closer to 1 indicate a stronger measurement [
42]. A smaller
p-value < 0.05 is at the level of significance and indicates that there is stronger evidence, assuming that the null hypothesis is true. The only estimated values with significant p-values were those for Knowledge variance at 0.952, and that for ATTITUDE variance at 1.033. Therefore, the interrelationships were not very significant among these three latent variables.
The standard errors (S.E.) do not present any extremely large or small values (outliers), and as suggested by Byrne (2010) [
42], the model is a reasonably good fit; on the other hand, (S.E.) should not be an extremely small value close to zero, as this indicates a poor model based on the explanation by Bentler et al. (1980) [
42,
55]. The critical ratios (CR) present small and/or negative values for regression weight, covariance, and correlation, and were only high for KNOWLEDGE and ATTITUDE variance; therefore, no correlations between the latent variables were totally supported. In other words, there are no strong interrelationships among AKB in this research, as the figures on the arrows between the latent variables would need to be closer to 0.1; however, each of them is supported by its observed variables and GOF indices in
Table 6 (GOF measures), which is discussed in
Section 5 of this paper.
5. Discussion
The results from the survey analysis revealed that the occupants were aware of climate change, and that the majority believed that it was either a major or minor threat. Most of them also confirmed that their high energy consumption could have negative impact on the climate change. However, these attitudes and beliefs were not transformed into environmentally friendly behaviour. For example, when they were asked if they used their washing machine economically, the majority answered occasionally or never. This demonstrated a lack of interrelationship between occupant Attitude, Knowledge and Behaviour (AKB).
To explore this further, an in-depth investigation of the interrelationships among different latent/unobserved variables (AKB) was carried out based on their indicators/observed variables (survey questionnaire results) using SEM.
After several iterations, the model depicted in
Figure 10 was the best conceptualised structural model. Even though the structural model was designed based on other existing research findings, interrelationships with a statistical significance level of
p < 0.05 were rejected in this research.
Table 6 compares the GOF measurements for the three models for: (i) conceptual measurement model, (ii) the best fitting measurement and structural model. It can be seen that there is a remarkable improvement in the outcome of the best fit measurement model compared to the conceptual model, where the GOF does not change for the best fitting structural model, as there are no further changes in the observed variables from the best fitting measurement model. Even though the structural model was a good fit, the interrelationships between AKB were not strong, and therefore, we further reviewed the factor loading between AKB (
Table 5). The key difference between
Figure 10 and
Figure 9 is:
Behaviour does not affect Attitude or Knowledge, while in
Figure 9, they are all interrelated and affect each other, as it was a measurement model.
The authors made one-way relationships from Attitude and Knowledge to Behaviour; therefore, Behaviour is endogenous. As shown by the arrows in
Figure 10, Attitude to Behaviour has a value of −0.01, and Knowledge to Behaviour has a value of −0.04. Based on this data, their interrelationship is not significant.
These results indicate a lack of statistically significant interrelationships among the latent/unobserved variables AKB; however, good model fit was achieved. The insignificant interrelationships among the latent/unobserved variables can viewed as people with good knowledge not necessarily behaving in an environmentally friendly manner; although there are interrelationships among their AKB (confirmed as good model fit in
Table 6), the factor loading in
Figure 10 among these three latent variables AKB is not close to 0.1. On the other hand, in
Table 5, the estimates for regression weight, covariance and correlation are all below 0.40, with insignificant
p-values.
Another important finding from this part of the research analysis and results revealed that appropriate attitudes and certain beliefs among the occupants did not necessarily influence their environmental behaviour. Although
Figure 9 and
Figure 10 are good fit measurements and structural models, respectively, these models were achieved after eliminating some of the observed variables (energy-related behaviours) in order to achieve good model fit in step 1 of the modification process. This was based on the comments from the questionnaire, which indicated that although the majority of the respondents were aware of the need for energy conservation due to the threat of climate change, they still behaved in an un-environmentally friendly manner, e.g., by running the washing machine on a setting higher than on eco-mode, or by leaving the tap on while brushing their teeth. This implies that the environmental behaviour of occupants is not in line with their knowledge and attitudes, as they are not careful with their water and electricity consumption. This uncovers the scope to further identify effective motivational factors in order to reinforce the interrelationships among unobserved variables in order to develop a model that could influence occupant behaviour. One of the strongest motivational factors could be a cash incentive; however, this factor might not be the most powerful motivational factor for occupants in Dubai, due to the salary-to-energy bill ratio, which is affordable for its residents. Future work needs to incorporate reinforcing factors in the best fitting structural model (
Figure 10) designed in this study to strengthen AKB interrelationships with the aim of improving the environmental behaviour of building occupants.
6. Conclusions
Increasing energy consumption and the resultant carbon emissions in residential buildings is becoming a critical issue that should be focused upon to achieve a green built environment and to mitigate global warming. Green rating systems such as the Leadership in Energy and Environmental Design (LEED) and many others are being actively practised in various regions of the world that aspire to achieve energy savings, reductions in carbon emissions, and occupant satisfaction. There is however, still a considerable performance gap which exists between energy consumption as-designed and the one in the actual buildings. Occupant behaviour accounts for one of the major reasons behind the significant uncertainty regarding building energy use. Little is known about how the occupants of these buildings cause the performance gap.
Green building initiatives, such as LEED and many other good practices, are now regulated by the UAE government in an attempt to achieve energy conservation, sustainability, health, and environmental and economic benefits. The key research question was whether the occupants of these buildings have the knowledge required to change and/or improve their environmental behaviour in order to achieve energy savings, and whether their beliefs and attitudes could lead them towards greener behaviour. The main novelties and objectives of the present work can be summarized as:
Data was collected from four LEED-certified multi-residential buildings in Dubai, UAE to better understand occupant behaviour and their level of involvement in building operations. A total of 203 occupants responded to the survey with valid answers, resulting in a response rate of 76.6%. Survey data was initially tested using SPSS statistics software to obtain descriptive statistics, frequencies, and means. Structural Equation Modelling (SEM) was then used to perform an in-depth analysis of the interrelationships between the three unobserved/latent variables—occupant environmental Attitude, Knowledge and Behaviour (AKB)—based on the observed/measured variables (survey data).
The comparison between the conceptual measurement model and the best fit measurement and structural models revealed significant improvement in all parameters. The final parameters fell within the GOF range, i.e., CMIN/DF improved from 6.187 to 1.273, RESEA from 0.160 to 0.037, RMR from 0.133 to 0.044, GFI from 0.478 to 0.954, CFI from 0.412 to 0.994, IFI from 0.417 to 0.994, and finally TLI from 0.372 to 0.992. On the other hand, the final regression weight from Knowledge to Behaviour was 0.557, and that from Attitude to Behaviour was 0.931; in both cases, the p-value was not less than 0.05, and therefore no significant interrelationship exists between them.
For the best fitting structural model, the estimates for regression weights, covariances and correlations were all below 0.40, without a significant p-value. The standard errors (S.E.) at 0.065 indicated that the model provided a reasonably good fit, as it was between 0 and 1, although being closer to zero indicates a poorer model, based on the explanation by Bentler et al. (1980) [
42,
55]. The critical ratios (CR) were either small or negative values, e.g., Attitude to Behaviour was -0.086, and the value for covariances among Attitude and Knowledge was 0.379. The CR was only high for variances for Knowledge, at 5.030, and for Attitude, at 9.406, thus indicating none of the correlations between the latent variables were totally supported.
These results indicate a lack of statistically significant interrelationships between the latent variables; however, a significant relationship exists between the latent and the measured/observed variables. In other words, occupants with good attitudes do not necessarily behave in an environmentally friendly manner. Well-fit measurements and structural models were obtained, but only after the elimination of observed variables related to electricity and water consumption in Step 1 of the modification (as explained in
Section 5). This reflects the fact that occupant environmental behaviour is not in line with design intent and confirms that “
the occupants of the LEED-certified buildings in UAE are not motivated to behave in an environmentally friendly manner”, by showing the insignificant relationship between the latent variables, AKB.
Since there is no apparent attention being paid to, or concern being expressed with respect to, occupant behaviour in the post-occupancy phase, it is suggested that the LEED-certification process should include a recommissioning/recertification phase after occupancy that includes occupant behaviour measurements and revision. Some of the real potential applications of the developed methodology, for instance, could be a public organisation and/or governmental authority in charge of energy efficiency in the built environment to review and monitor the interrelationships among AKB in the building’s occupants to provide revisions to LEED, rather than changing the LEED process, which is intended to value the work carried out during construction and design of the buildings.
The research findings present a logical guide and a well-fitting structural model (
Figure 10), which can form the basis for the development of a Building Occupant Environmental Behaviour model through the inclusion of motivational factors to trigger environmentally friendly actions and influence behaviour. It is accepted that today it is quite possible to produce an eco-friendly green building; however, it is also a priority need to adopt practices such as Soft Landings [
63,
64] in order to involve industry professionals and educate occupants with the aim of improving and altering their behaviour in an environmentally friendly fashion to achieve potential energy savings in their buildings.


