Article

The Role of Low-Load Diesel in Improved Renewable Hosting Capacity within Isolated Power Systems

Centre for Renewable Energy and Power Systems, School of Engineering, University of Tasmania, Hobart 7000, Australia
*
Author to whom correspondence should be addressed.
Energies 2020, 13(16), 4053; https://doi.org/10.3390/en13164053
Submission received: 22 June 2020 / Revised: 20 July 2020 / Accepted: 28 July 2020 / Published: 5 August 2020

Abstract

:
Isolated communities are progressively integrating renewable generation to reduce the societal, economic and ecological cost of diesel generation. Unfortunately, as renewable penetration and load variability increase, systems require greater diesel generation reserves, constraining renewable utilisation. Improved diesel generator flexibility can reduce the requirement for diesel reserves, allowing increased renewable hosting. Regrettably, it is uncommon for utilities to modify diesel generator control during the integration of renewable source generation. Identifying diesel generator flexibility and co-ordination as an essential component to optimising system hosting capacity, this paper investigates improved diesel generator flexibility and coordination via low-load diesel application. Case study comparisons for both high- and low-penetration hybrid diesel power systems are presented in King Island, Australia, and Moloka`i, Hawai`i, respectively. For King Island, the approach details a 50% reduction in storage requirement, while for Moloka`i the application supports a 27% increase in renewable hosting capacity.

Graphical Abstract

1. Introduction

Isolated power systems (IPSs) have historically relied on diesel generation given the accessibility, reliability and maintainability of the technology. More recently IPSs have started to integrate renewable generation, as awareness of the economic and environmental impacts of diesel generation have become known [1,2]. Wind and solar photovoltaic (PV) represent the two most common renewable technologies employed to reduce diesel consumption, however, both are stochastic, and unable to eliminate diesel generation entirely [3,4]. To eliminate diesel generation, enabling technologies such as energy storage are required. Unfortunately, storage is currently expensive and complex, making it unsuited for the majority of IPSs [5,6]. In response, a number of IPSs with improved generation and load control have been created to mitigate the need for storage [7,8,9]. To this end, this paper assesses the role of low-load diesel within two innovative case studies, King Island, Tasmania, a high-penetration wind IPS, and the island of Moloka`i, Hawai`i, a low-penetration solar PV IPS with ambitious near-term renewable targets. The novelty of this paper lies in identifying alternative approaches to energy storage integration, validating this approach via case study review within both wind- and solar-dominated IPSs. The case studies selected, Moloka`i Hawai`I, and King Island, Tasmania, Australia, represent the current best practice for renewable integration, Figure 1.
Owing to their small size, high diesel fuel cost and resilient communities, islanded IPSs are some of the earliest adopters of renewable generation technologies [10]. King Island is a case in point, representing one of the world’s first megawatt-scale highly renewable penetration power systems. Early adopters, such as King Island, have an important role to play in the adoption, testing and commercialisation of renewable generation and enabling technologies. The challenge in leveraging and redeploying experiences, such as those obtained on King Island, has always been how to scale these approaches for larger markets while consolidating capital cost [11].
Larger systems are generally slower to reach high renewable penetrations, owing to the large capacity of renewable generation required. In this regard, the lessons learnt from IPSs can both accelerate and derisk renewable integration in larger markets. The island of Moloka`i, Hawai`i represents one such case study. Larger than King Island, and reliant on residential solar PV instead of wind, the island is looking to scale existing high renewable penetration experience, leveraging technologies such as those deployed on King Island to meet local targets for 100% renewable generation. In reviewing the technology options available to Moloka`i, this paper presents a general introduction to the legacy technology progression within Hawai`i and Australia in Section 1.1, ahead of a case study review in Section 1.2 and Section 1.3. The paper’s modelling methodology, results, and conclusions are presented in Section 2, Section 3 and Section 4, respectively.

1.1. The Technology Legacy of Hawaiian and Australian Isolated Power Systems.

Wind was first pioneered in Hawai`i as part of the US Department of Energy’s federal wind program. Administered by NASA, the program targeted the realisation of a sub 5 c/kWh levelized energy cost. This pioneering experience was quickly followed by multiple wind turbine developments across the islands of O`ahu, Maui, Hawai`i and Moloka`i, Table 1. For most of the 1980s, Hawai`i led global wind technology development, hosting the world’s largest wind turbine, the Boeing Mod-5B, a 3.2 MW twin blade turbine presenting an impressive 97 m diameter rotor. The heyday of Hawaiian wind development, unfortunately, came to an end shortly afterwards, signaling a loss in social license for wind development across the islands [12]. In stark contrast, Hawai`i has enthusiastically embraced solar PV, supported by attractive resource and net energy metering policy (2001–2015). Perhaps most importantly for Hawai`i, solar PV has also proven to be highly modular and scalable, placing the technology within community reach. Hawai`i currently generates approximately 11.2% of its load via combined centralised and distributed solar PV schemes [12]. This compares favourably to Australian and US averages of 5.2% and 2.3%, respectively [13,14]. The uptake has been so successful that, for many of the Hawaiian Islands, the adoption of solar PV has reached, or is rapidly approaching, the system’s hosting capacity. Moloka`i is a case in point, exhibiting instantaneous midday solar penetrations exceeding 75%, despite a relatively low annual penetration of below 14%.
Effective in displacing diesel generation, however in general, their performance offered poor reliability and reliance [15]. While early Australian trials were not to the extent of the Hawaiian research, they ushered in Australia’s first wind farm at Salmon Beach, Western Australia (1987), and then a second at Huxley Hill, King Island, Tasmania (1998). In contrast to the Hawaiian experience, Australia’s slow uptake found roots, with wind technology transitioning to broader network application. Tasmania currently generates approximately 9.7% of its total load via wind generation, ahead of the Australian and US national averages of 7.1% and 6.5%, respectively [13,14]. In contrast, 4.9% of Hawai`i’s energy is wind derived, despite modern wind projects realising the 5 c/kWh price point originally envisaged by the US department of energy [16]. For reference, Hawai`i’s energy tariffs currently exceed 28 c/kWh across most islands.
Australia also adopted wind turbine technology during the 1980s, wind representing the only viable renewable technology of the era. The best of these early wind turbines proved to be cost
In this regard, our two case studies (Table 2) are representative of broader regional preferences, with Moloka`i a solar-dominated decentralised IPS and King Island a wind-dominated centralised IPS.

1.2. King Island

Hydro Tasmania initially hybridised the King Island IPS to explore wind technologies in the late 1990s, with the system subsequently expanded via the integration of solar PV, batteries and flywheel technologies. This section considers the King Island experience, in particular efforts to reduce the cost and complexity of many of the developed applications.
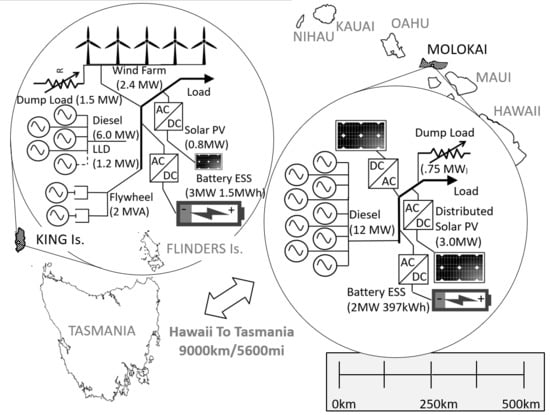
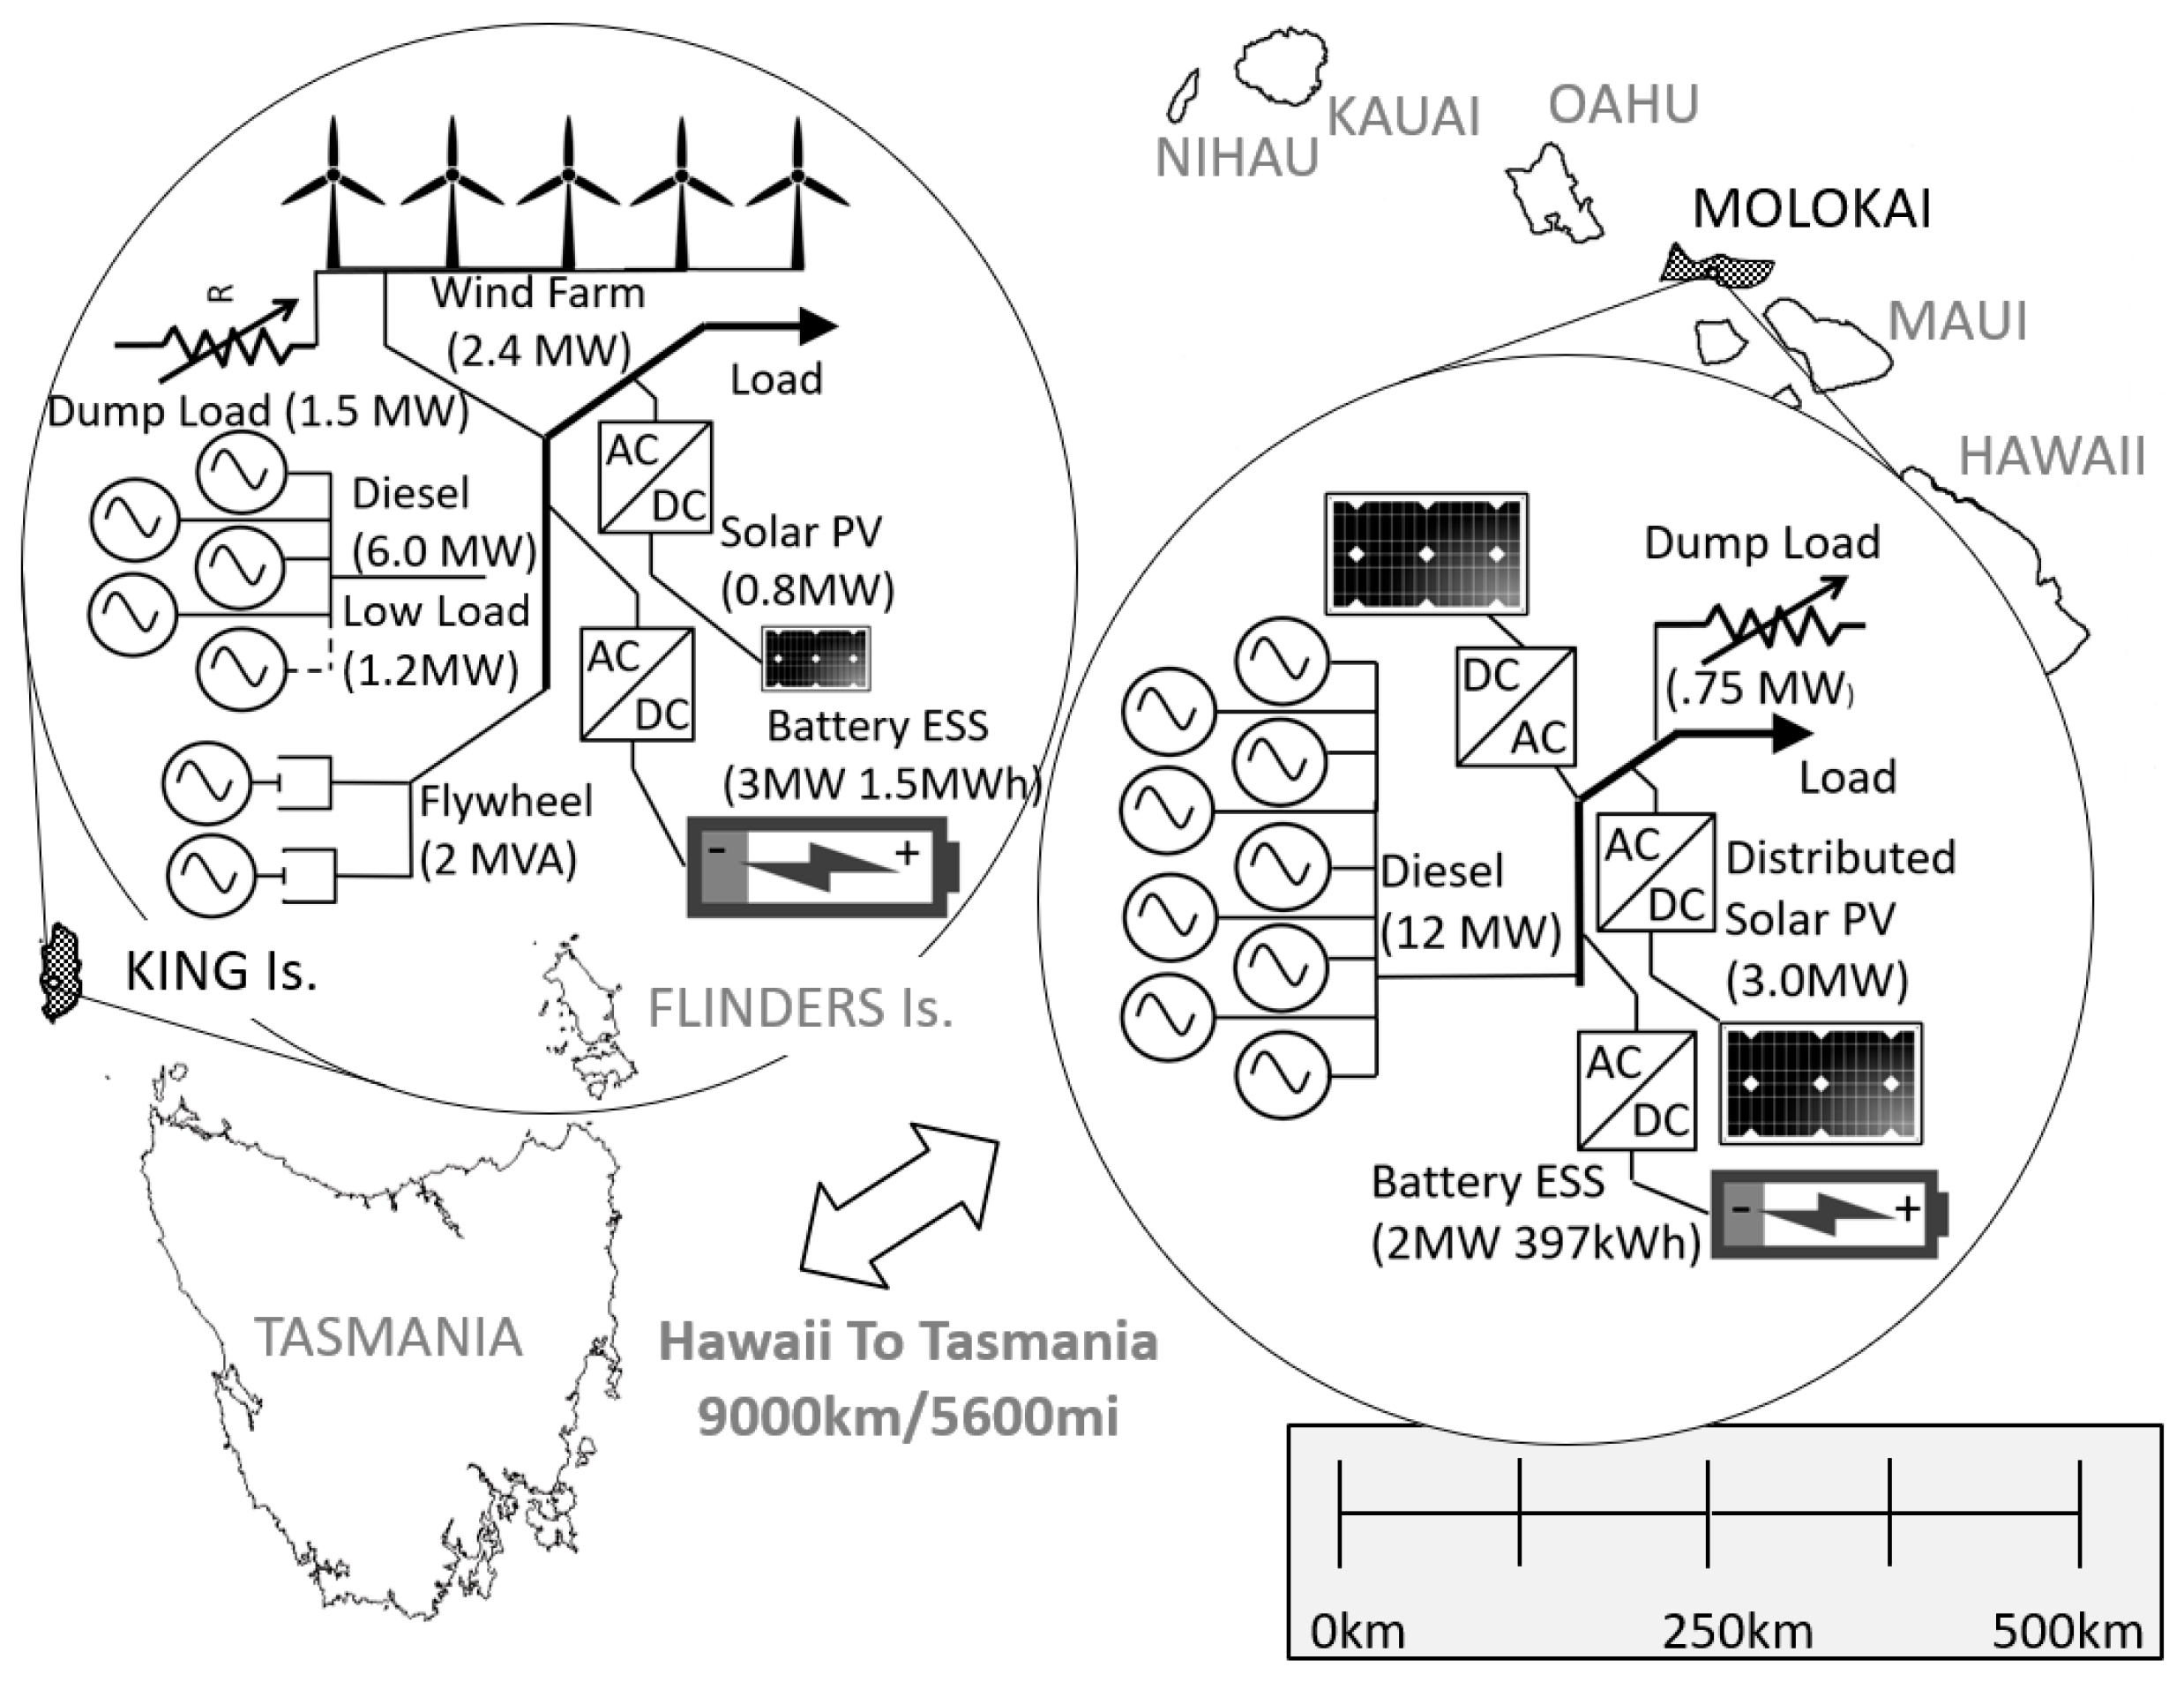
Situated between Victoria and Tasmania, Australia, King Island is located within the strategic shipping channel of Bass Strait. The wind resource on King Island, averaging 9.0 m/s at 60 m elevation, is now employed to power King Island’s IPS. Over 50% of King Island’s annual demand is met via the 2.45 MW of installed wind capacity. The remainder of King Island generation consists of 0.8 MW of uncontrolled residential solar PV and 7.2 MW of diesel generation, Table 3 [
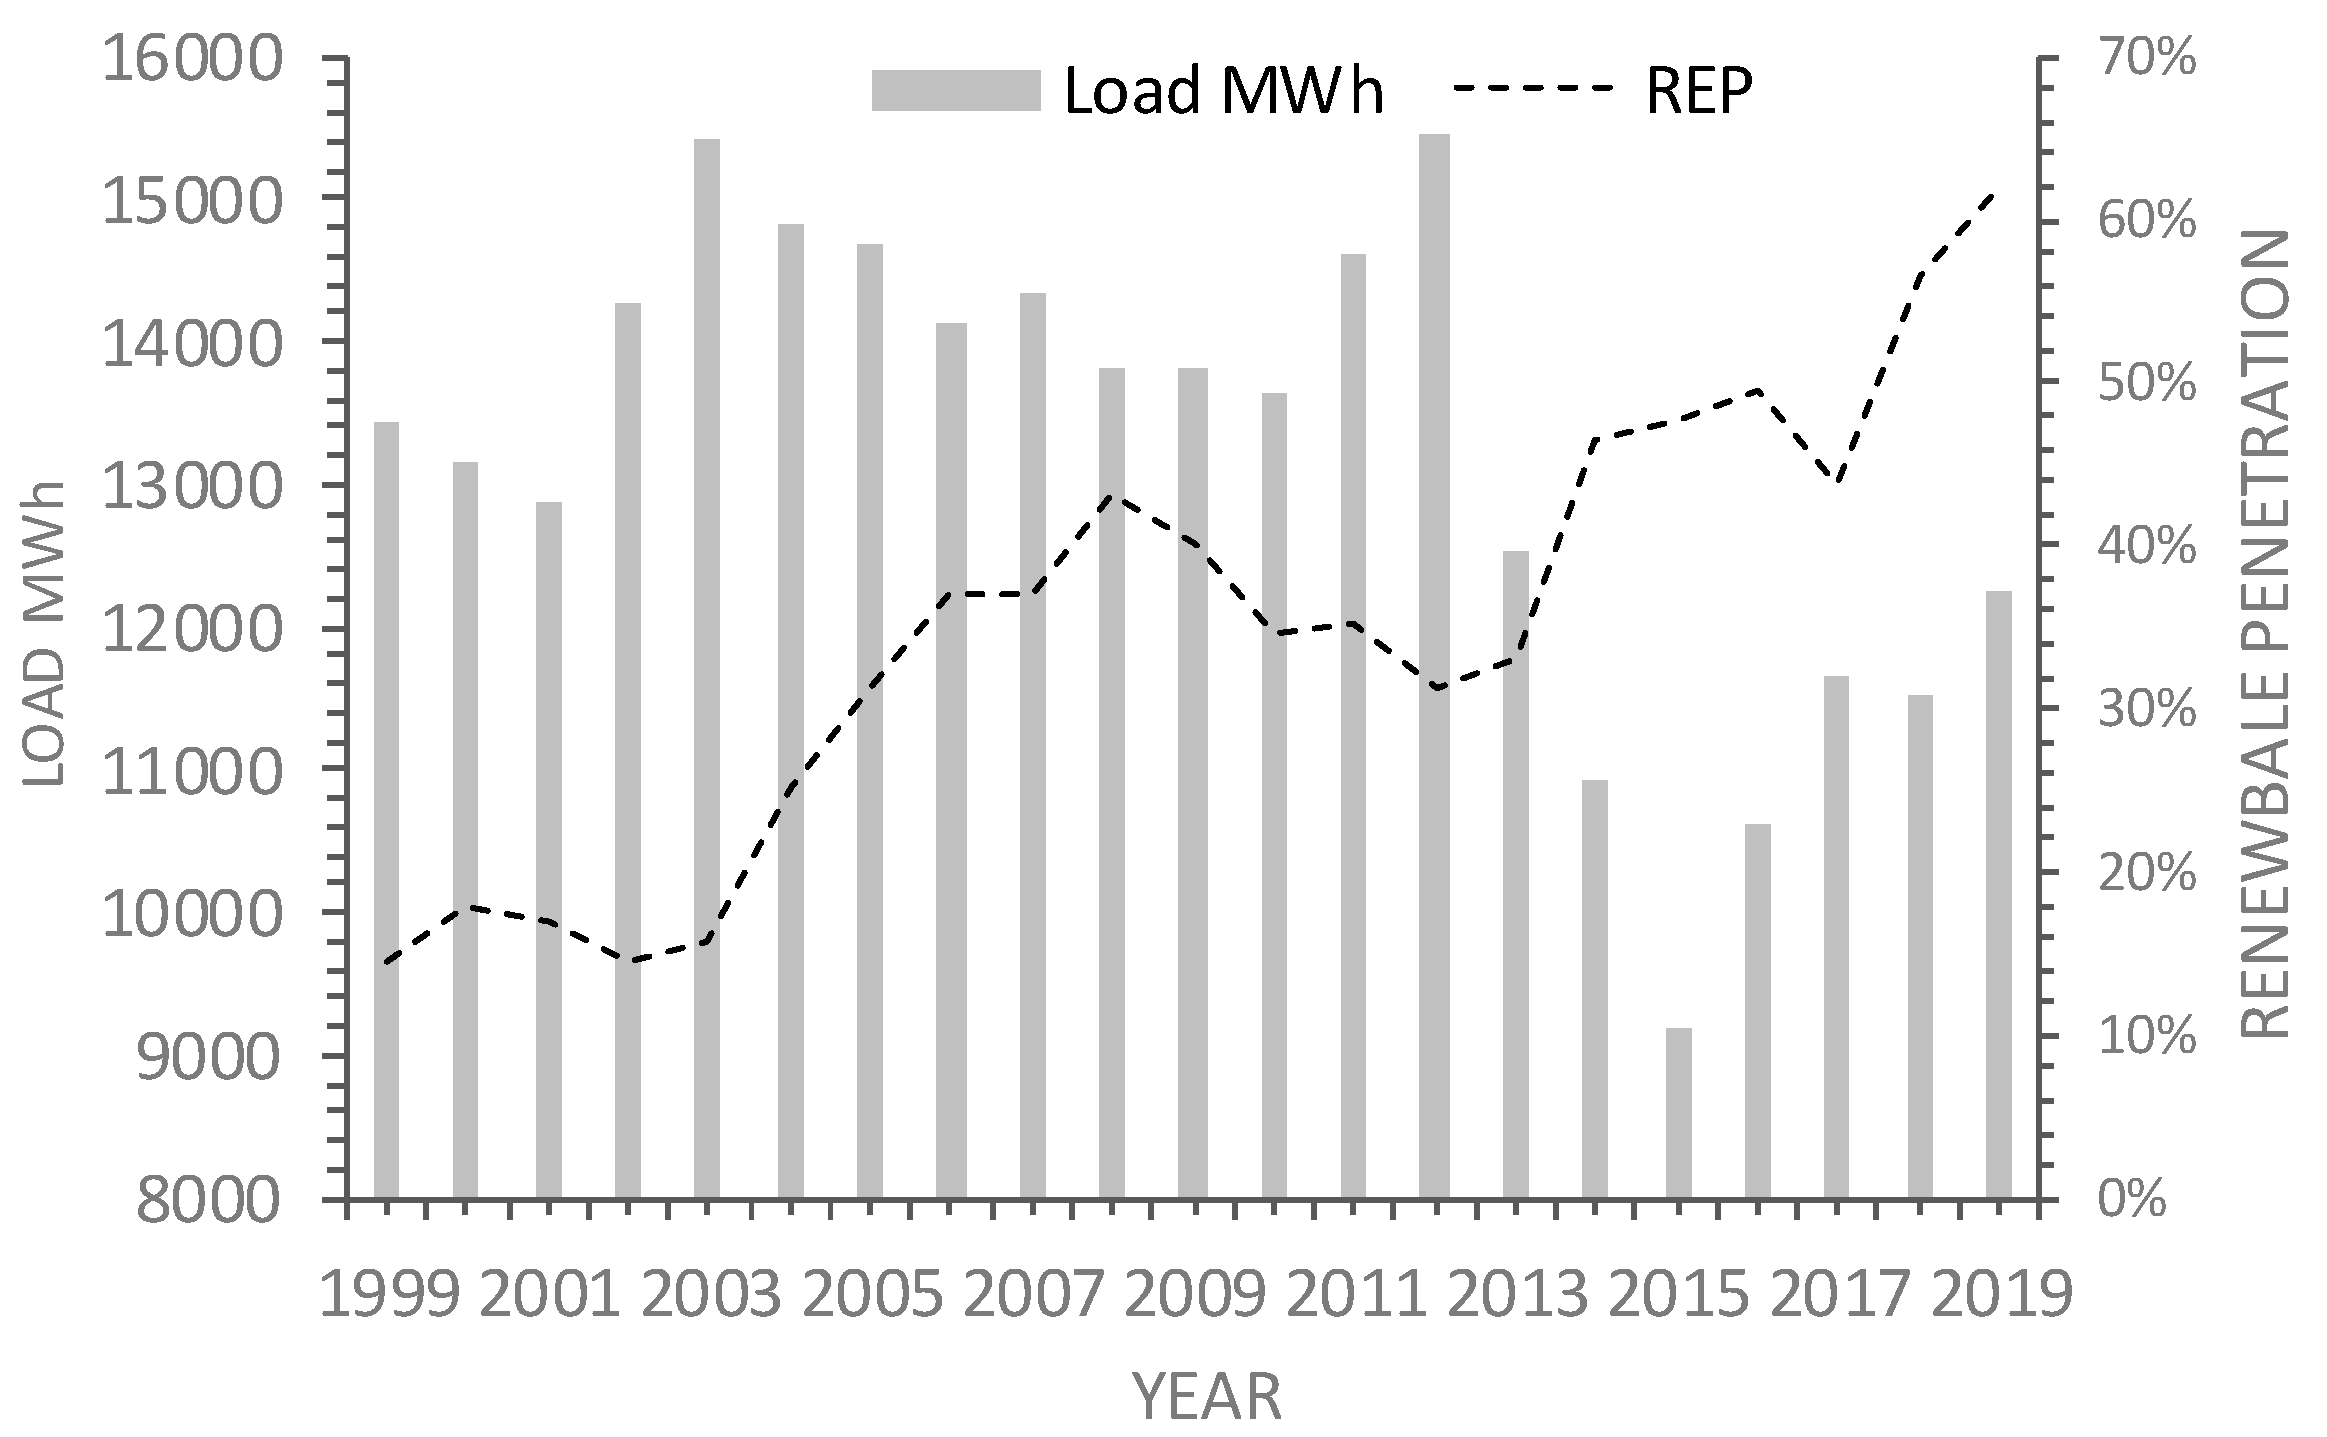
17]. Annual renewable generation, wind and solar combined, contributed over 60% of the islands load last year, Figure 2, with the system running diesel off for 20% of the year. To support system security a range of enabling technologies are employed on King Island, including a 3 MW, 1.5 MWh advanced lead acid battery energy storage system (BESS), a 2 MVA diesel coupled flywheel energy storage system, 0.1 MW of residential demand side management and a 1.5 MW resistive dump load. The King Island IPS is managed by an automated IPS controller, allowing the system to operate unattended.
The dispatch strategy adopted on King Island targets the maximum utilisation of the available wind generation. Solar PV generation is not a large determinant within the control methodology, as the utility has no visibility or control of this component of the system. Instead, dispatchable generation is scheduled to respond to load and resource variability. The diesel dispatch strategy progressively adds diesel capacity interchangeably, with the exception that the first diesel on and the last diesel off is the MTU low-load unit. In contrast the CAT engines, which adopt a 40% low-load limit, the MTU is warranted to 10% loading, assisting renewable penetration under high wind contribution.
Huxley Hill wind farm was commissioned in 1998, initially consisting of three Nordex N29 wind turbines (0.75 MW total). Huxley Hill wind farm initially reduced diesel consumption by one fifth. Encouraged, Hydro Tasmania integrated additional renewable capacity in 2004, adding two Vestas V52 turbines (1.7 MW total). In support, a 200 kW, 800 kWh vanadium redox flow battery (VRB) was also integrated the same year. The VRB uses aqueous vanadium electrolytes separated by a proton exchange membrane. Ion exchange provides an energy storage concept offering long service life and tolerance to high cycle rates and depths of discharge. Unfortunately, the flow battery proved complex and difficult to maintain. The failure of the VRB electrolyte containment resulted in the decommissioning of the battery shortly after installation. Without storage, system operation required the set point control of the wind production (renewable spillage) to ensure system security. Despite the failure of the VRB, renewable penetration exceeded one third of the system load, with King Island able to demonstrate medium levels of renewable penetration from 2005.
This milestone signified an important achievement for renewable integration within Australia. Leveraging this experience, Hydro Tasmania then embarked on a period of research and development encompassed by the King Island renewable integration program. King Island allowed Hydro Tasmania to assess a range of emergent renewable technologies, including, solar photovoltaics (2008), concentrated solar thermal (2009), flywheel energy storage (2011), biodiesel (2012), residential load shedding (2012), battery storage (2014), low-load diesel (2015) and wave generation (2020). The King Island renewable integration program is primarily responsible for the current system performance, exceeding 60% penetration. The technology successes and failures observed across this period remain relevant to a range of current applications and markets, including both isolated and networked power systems globally. Of the technologies to fail, both the concentrated solar thermal and dual axis solar PV systems were early casualties. The solar PV tracking failed due to repeat failures within the hydraulic tracking mechanism, and despite the solar PV panels being unaffected, remediation costs have prevented system reinstatement. In contrast, the concentrated solar thermal project, envisaged to consist of six 19T elevated graphite solar storage receivers, was never implemented. Ironically, the dynamic resistive heating element, developed as a complementary heating source has evolved into a flexible enabling technology in its own right. During the testing of the resistive load, it became clear that the fast and accurate response provided value as a dispatchable load, specifically offering fast frequency raise reserve. The adoption of a resistive dump load allowed Hydro Tasmania to operate wind generation unconstrained, providing improved system inertia and capacity firming. The resistive dump load provides capacity firming via either dispatch or the withdrawal of the load in a fraction of a second, as required to smooth the accompanying wind generation. In this manner, the resistive load contributes to frequency regulation, lowering the reserve requirements, and reducing diesel consumption and maintenance. The role of the resistor is illustrated in Figure 3, where control transfers between the battery, resistor and diesel generation. The plot shows a transition from battery charging (hour 1), to discharging (hour 3). The system load dips mid-plot, during which the resistive load is used to spill surplus renewable generation. As the load increases, the battery resumes control, injecting energy until a drop in wind production triggers a diesel start (hour 4). Prior to this, the system was running diesel off.
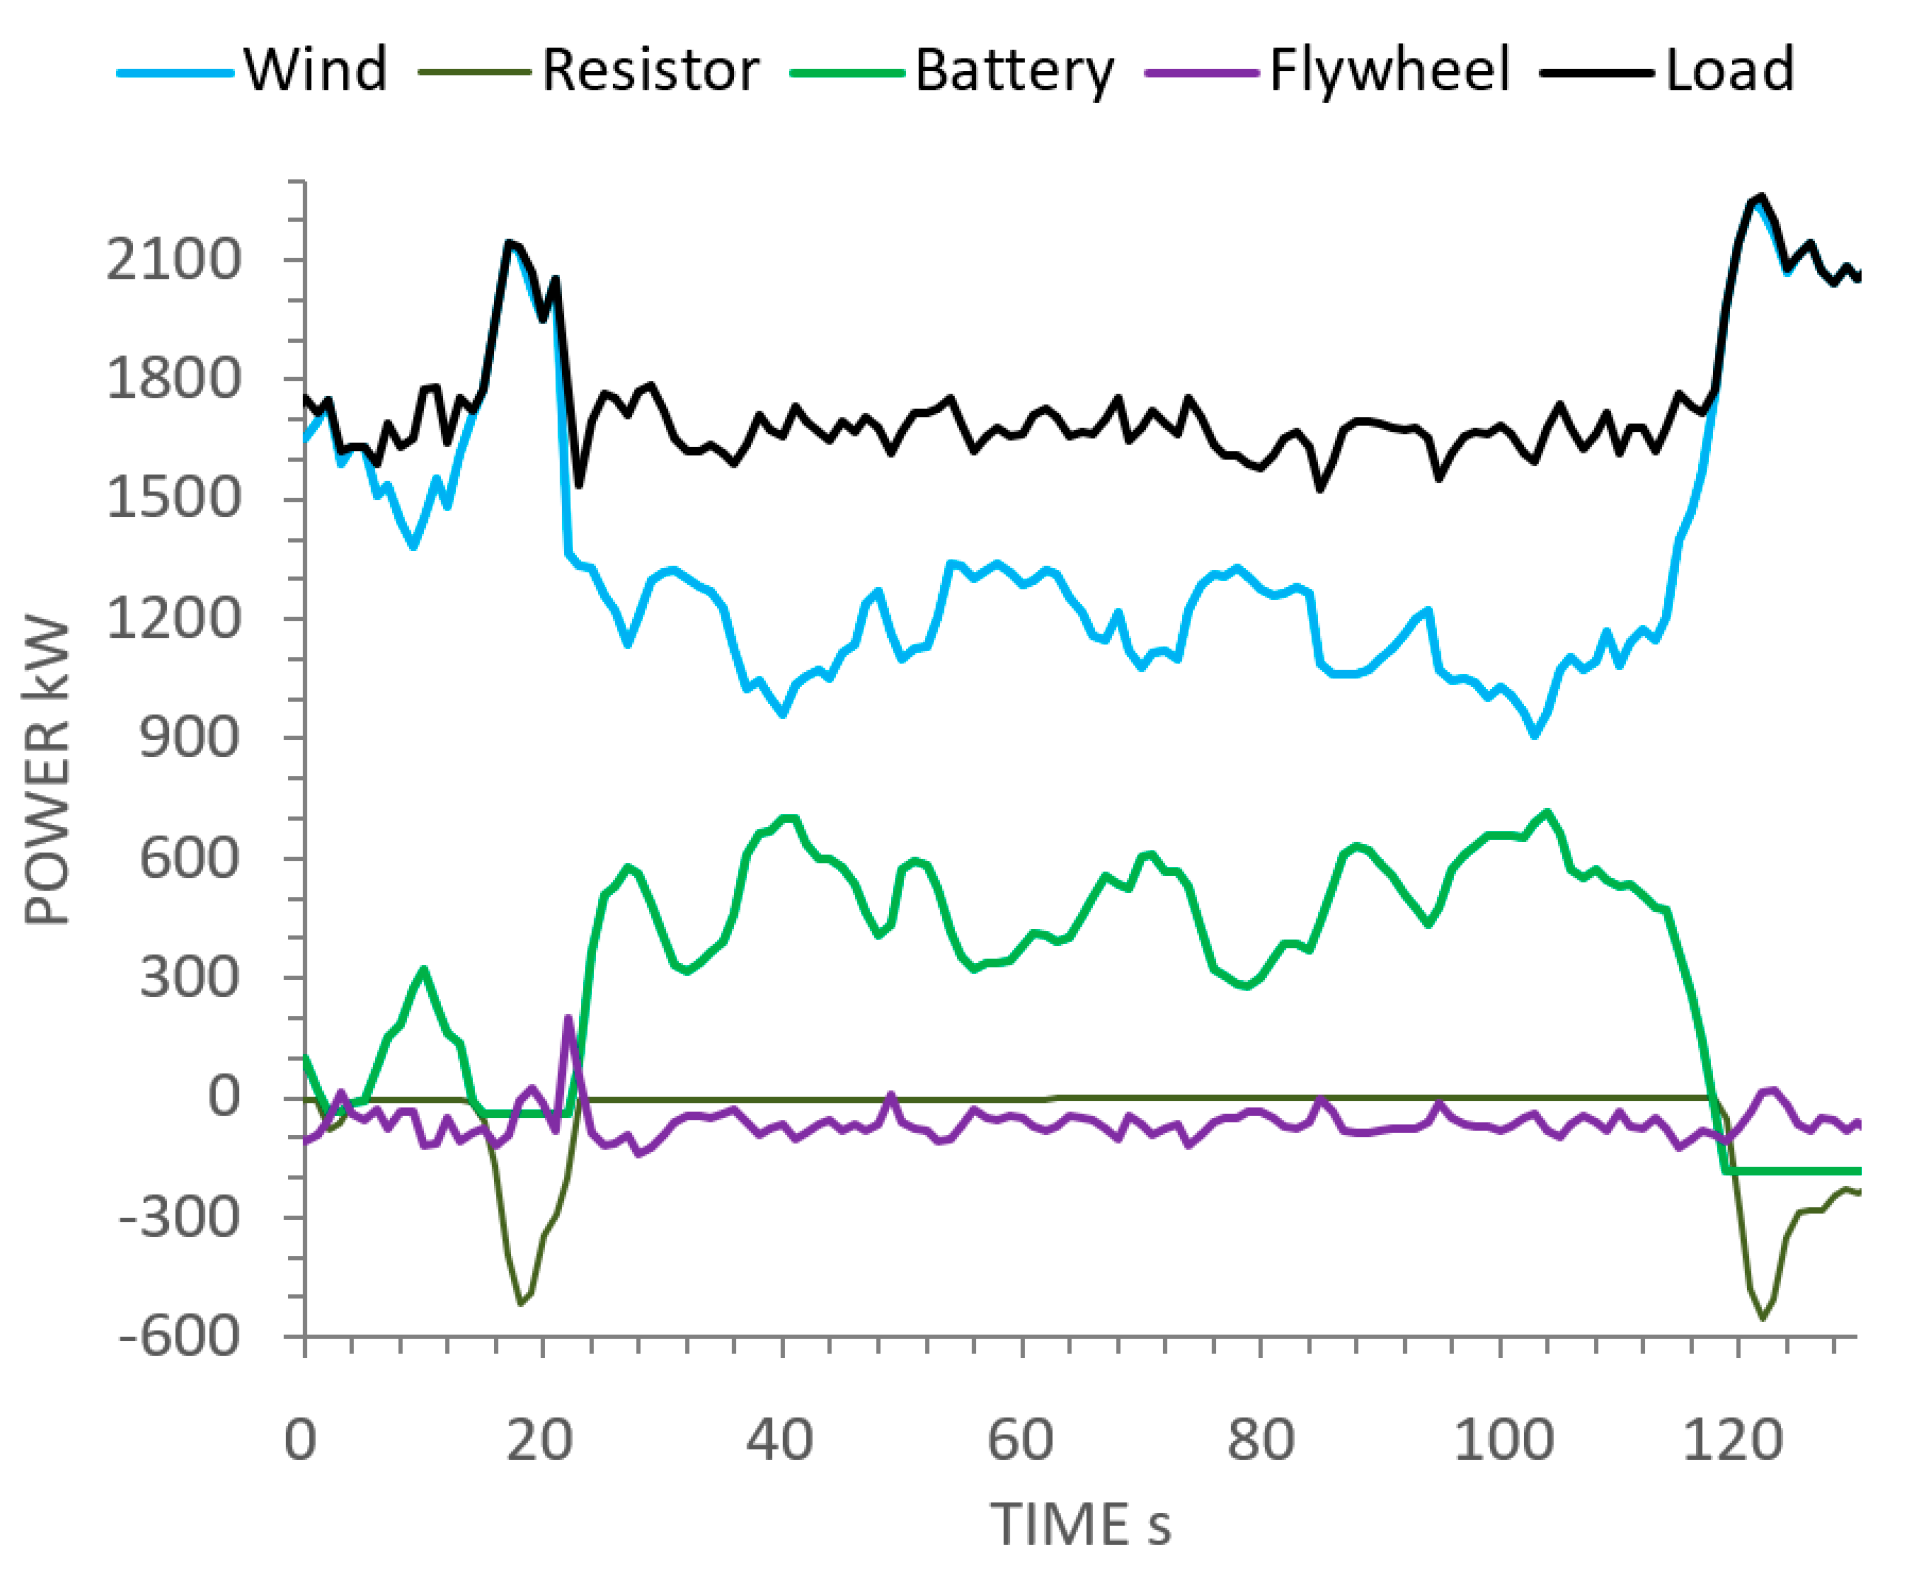
The transient response of the BESS and resistive load is further illustrated in Figure 4, inclusive of flywheel energy exchange. The plot covers a two-minute interval of steady system load, approximating 1.7 MW. A rapid drop in wind generation (t = 20 s) requires inertia support from the flywheel and a discontinuation of resistive spill. The battery responds to inject energy shortly after, allowing the flywheel to resume 50 Hz operation. Had the battery state of the charge been insufficient, the flywheel would have coupled to a paired diesel engine, performing a diesel fast start via the integrated mechanical clutch. In this instance the combination of the battery, resistor and flywheel mitigated the need to bring diesel generation online. The flywheel technology consists of two 12 T horizontal steel flywheels, each coupled to a 1 MVA diesel generator. These engines are not used outside of the provision of fast start diesel response, given the large mechanical loads and reduced service life imposed during the engagement of the mechanical clutch. The role of the flywheel within the King Island IPS is to provide inertia and a fast-start diesel contingency to both dampen and respond to variable renewable output. The fast start diesel response occurs over a few seconds, with the load transferred to the conventional diesel assets as they are brought online over a matter of minutes. The coupling of the flywheel to a diesel engine provides a system response extending beyond the 30 s of inertia available from the two flywheels. During diesel off operation, both flywheels will be operational. At other times of high renewable penetration, a single flywheel will typically be operational. Under medium or low renewable penetration, the flywheels are turned off to reduce the ~60 kW of parasitic load required to keep each unit spinning.
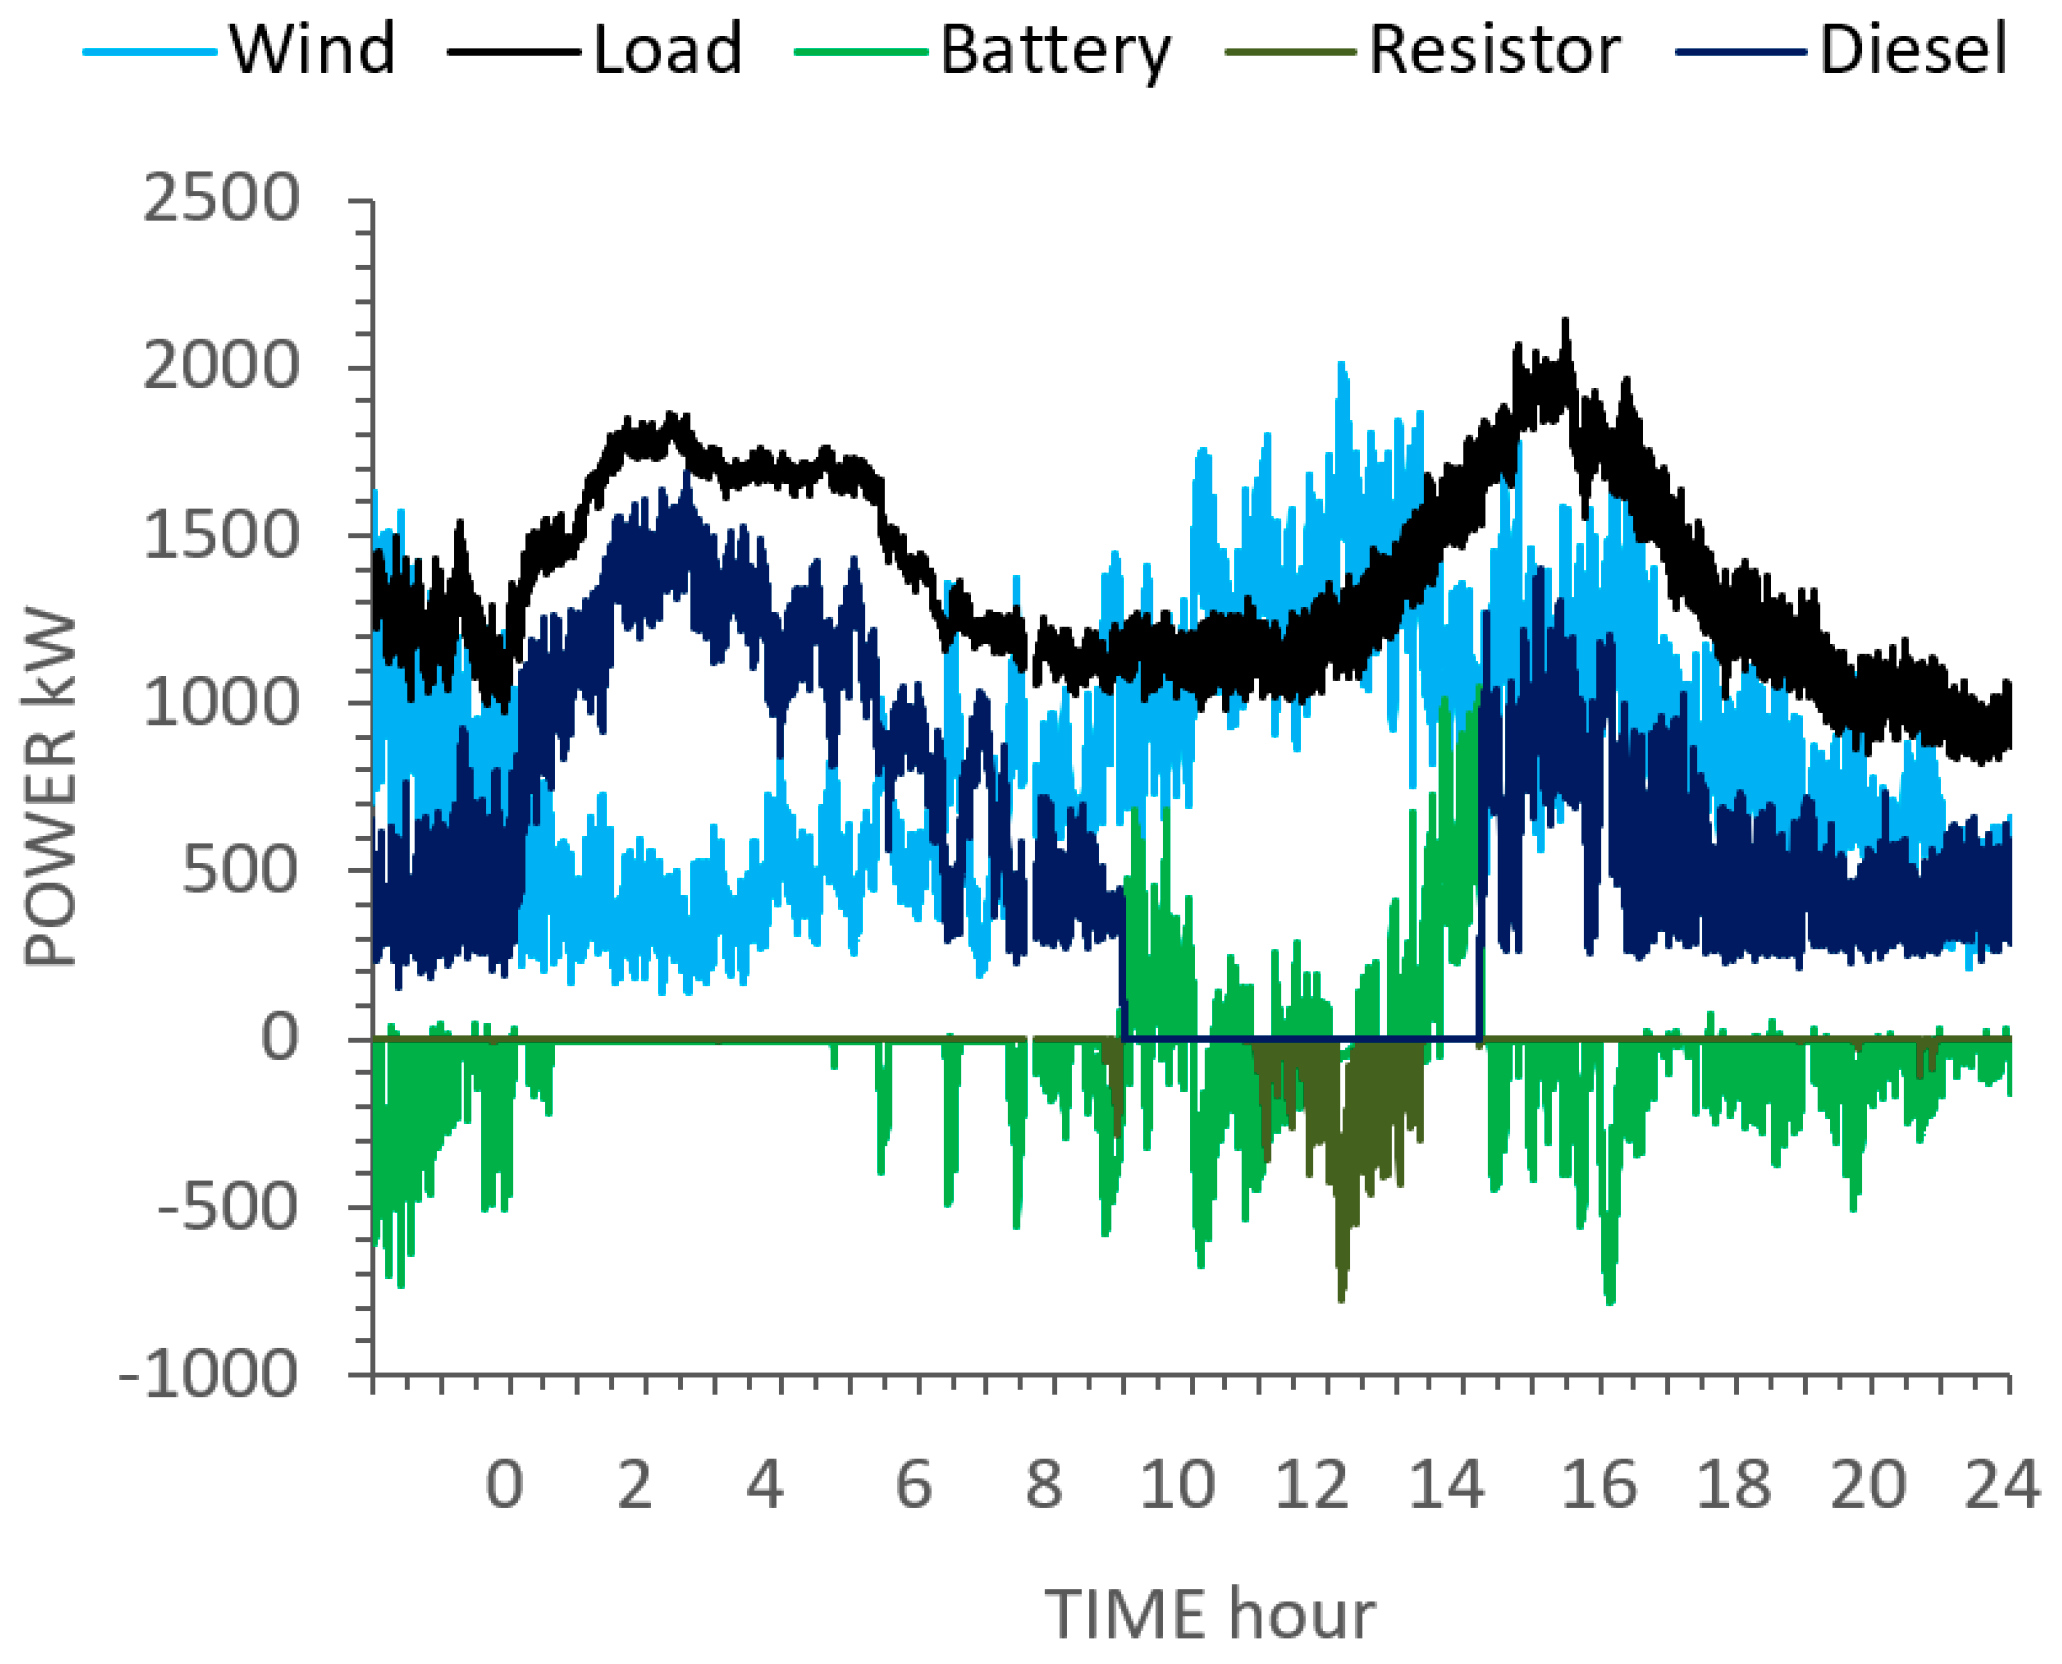
To allow for extended diesel off operation, a 3 MW, 1.5 MWh advanced lead acid BESS was integrated in 2014. The battery extended the time for which the system could remain diesel off, having accumulated over 12,000 h of diesel off operation to date. A typical daily load and generation profile is shown in Figure 5, with the twin peak load profile evident. The plot shows a five-hour diesel off period from midday, as the afternoon sea breeze produces surplus renewable generation. Throughout this period, the battery transitions from an energy source (hours 9–10) to a sink (hours 10–11), until the resistor is deployed to spill surplus renewable (hours 11–1). As the afternoon load peaks, diesel generation is again brought back online. The battery charges into the evening, indicating the inability of diesel generation to reduce its output below its operational low-load limit. The role of low-load diesel within the King Island power system is to reduce the occurrence of excess renewable generation. This is achieved by permitting the low-load diesel unit to run down to 10% of its rated capacity during periods of high wind generation.

1.3. Moloka`i Hawai`i

Maui Electric Company (MECO) have established a target for Moloka`i to achieve 100% renewable energy (RE) by 2020 [18]. In doing so, Moloka`i will be the first Hawai`i island to reach this milestone, setting a roadmap for the other islands of Hawai`i and US states to follow. This section considers to what role coordinated generation can be utilised in support of these goals. Modified diesel application is assessed via simulation of a low-load diesel operating scenario. This paper addresses operational dependencies between generation, load and storage, quantifying to what extent generation and load flexibility can provide improved near-term renewable hosting capacity.
The island of Moloka`i is located centrally within the Hawaiian archipelago, between the larger islands of O`ahu, to the west, and Maui, to the East. Approximately 90 km east of Honolulu, the coastal proximity to both O`ahu and Maui is under 40 km. The island’s population is approximately 8000, of which around 40% assert native Hawaiian ancestry. Tourism, cattle, and diversified agriculture represent the island’s major economies. The electrical demand on Moloka`i peaks at around 4500 kW, presenting the typical twin peak profile common to many island communities, Figure 6. Notably, in recent years, the increase in the capacity of residential solar PV has had a notably depressed midday load. It is also interesting to note the absence, for the time being, of centralised utility renewable development on the island, in part due to strong local opposition to large-scale development, viewed as incompatible with local customs and culture [12].
Blessed with abundant wind and solar resources, it is somewhat surprising to note the absence of centralised renewable generation on Moloka`i. The scenario is even more surprising considering MECO’s early exposure to renewable generation. Unfortunately, the failure of these early projects to be inclusive of community concerns, combined with disinterest from MECO to own and operate renewable assets, have reduced the investment in centralised generation. In contrast, since 2009, the installed capacity of uncontrolled (unable to receive a utility set point) residential solar PV has increased markedly on Moloka‘i, so much so that from 2015 to 2018 further solar PV interconnection was restricted, with the system’s hosting capacity for uncontrolled solar PV saturated. Solar PV hosting capacity is the ability of the system to accept additional PV generation without pushing the midday load below the systems reserve requirements, as set by the minimum load setpoint of the systems thermal generation, Pmin. In response, MECO in partnership with the Hawai`i Natural Energy Institute (HNEI) installed a number of enabling or ancillary technologies, including, a 2 MW 397 kWh lithium BESS and a 750-kW resistive load bank. These technologies were instrumental in relief to hosting capacity constraint, allowing the solar PV interconnection queue to reopen. Both technologies allowed for a reduced reserve requirement, providing system flexibility to manage solar resource variability. The impact of additional solar PV capacity is evident in Figure 6, where a Moloka`i daily load profile is shown inclusive of the solar PV as negative load. Notably, the reduced midday minimum loading evident in 2018, approaches Pmin, suggesting a limited ability to further integrate additional solar PV capacity. Despite midday instantaneous solar PV saturation, annual average solar PV penetration remains low at around 14%. Considering the aggressive development timeframe outlined for a 100% renewable transition, MECO are prioritising integration of near-term enabling technologies, in parallel with discontinued replacement or purchase of diesel generation. The generators supplying Moloka‘i’s Pālā‘au Power Station, Table 4, consist of a range of high-, medium- and low-speed diesel generation.
In general, high speed engines typically offer an improved generator response, while lower speeds offer improved inertia and peak efficiency. Heat release curves for all units were provided by the MECO, with efficiency varying significantly between engines. Part of this variation can be attributed to the significant age of the diesel asset base. Where outlier unit efficiencies were identified this data was flagged for low reliance and not used within subsequent analysis. Moloka‘i’s diesel asset base shares similarities with that of King Island, with a number of the King Island strategies adopted in advancing Moloka‘i’s renewable transition.
The role of the Moloka‘i battery is to provide fast-acting coordinated frequency support, improving system stability by providing the diesel generators time to respond. In this manner, the battery state of charge is maintained at 50% to provide for both the frequency rise and the lower reserve. The battery is provided with six raised and six lower set points, defining a rapid step response followed by a gradual load transfer in both over and under frequency events, Figure 7. Significant effort has been undertaken by HNEI to improve the response time of the BESS, with a revised control architecture reducing the response latency from ~250 ms to ~60 ms, [20]. The Moloka‘i battery is the third battery ESS installed in partnership between HECO and HNEI, with batteries also in place on O`ahu and Hawai`i island [21]. All three batteries target fast response frequency regulation or power-smoothing applications. Additional issues encountered across BESS integration include, high inverter temperatures and communications faults. Inverter temperatures were resolved by constraint of the inverter’s reactive setpoint. Communication issues were resolved via hardware replacement.
The role of the load bank is to manage the system frequency during periods of excess solar PV generation, subject to BESS state of charge. In this application, the load bank reduces Moloka`i’s reserve requirement, providing a discretionary load to balance the grid during periods of excess energy. In assessing what additional near-term applications may further benefit Moloka`i, this paper explores the role of low-load diesel to support generator flexibility and co-ordination.

2. Methods and Materials

2.1. Modelling

Low-load diesel application was simulated using Homer Pro software, developed by the U.S. national renewable energy agency to assist in the selection and sizing of power generation technologies. The model accepts the daily, seasonal and yearly profiles for resource and load, allowing the user to model diesel and renewable generation via control of generation dispatch order, reserve requirements, generator curtailment and efficiencies [22]. Homer Pro was selected as the appropriate software environment given the prevalence of this format within industry, providing for reduced barriers to utility review and consideration. For both the King Island and Moloka`i case studies measured resource and load data was used to define a 12-month simulation of hourly generation dispatch. Each case study was configured to represent the as-build system configuration, with observed system performance used to validate the model. Model configuration included generation dispatch and reserve definition as implemented for each case study. Model validation consisted of review across both modelled and observed annualised diesel generation run hours, renewable penetration and fuel consumption. For a known solar irradiance profile, the model develops an hourly solar resource estimate [23]. Solar PV power output is then calculated using Equation (1).
P p v = f p v Y p v I t I s
where fpv is the derating factor, Ypv is the rated capacity of solar PV (kW), It is the solar irradiance, and Is is one kW per square meter. The derating factor can be used to approximate reduced efficiency as may be experienced in specific configurations or environment conditions. For a known wind resource, the model uses a user-defined wind turbine power curve, the relationship between wind speed and power, to calculate wind generation. To facilitate this, an hourly wind resource profile can be estimated from the average wind speed, Weibull shape factor, autocorrelation factor and diurnal pattern, however, for King Island measured hub height hourly wind resource data was used. Postproduction losses applied to both wind and solar generation include electrical losses and unit availability. When the available renewable generation is insufficient to meet the system load, the model may schedule battery or diesel generation according to the maximum and minimum unit loadings. At all other times the system reserve requirements defined the battery and diesel response. The diesel generator fuel curve is assumed to be linear according to Equation (2), and is used to calculate fuel consumption.
F = F i n t Y g e n + F 1 P g e n
where Fint is the fuel curve intercept coefficient, F1 is the fuel curve slope, Ygen is the unit rated capacity (kW) and Pgen is the generator output (kW). The units of F depend on the manufacturers preferred measurement units for fuel, typically either litres or gallons per hour. In regard to the battery performance the model uses the nominal voltage, capacity curve, allowable charge range, roundtrip efficiency and cycle life to simulate any battery contribution. The capacity curve details the discharge capacity of the battery versus the discharge current, and is supplied by the manufacturer. The maximum rate of charge or discharge is specified by the kinetic battery model [24]. A detailed overview of the simulation theory is provided in [25].
For each case study the utilities reported annual fuel consumption, dispatch scheme, generator run hours and renewable penetration were used to validate the model configuration ahead of low-load diesel simulation. For Moloka`I, the generation performance and dispatch model was first established using 2009 generation and load data, representative of the system prior to residential solar PV uptake. To this model, annual reported renewable investment was added iteratively to validate the performance under increasing solar PV penetrations. The approach yielded annual diesel fuel consumption estimates within 3% of the observed performance once measured data was corrected in consideration for the high fuel consumption rate of generator 7 (this unit was removed from the model post-calibration, given its inefficient operation and non-standard performance). For King Island much the same methodology and accuracy were employed/observed with the higher annual resource variability (wind compared to solar PV) addressed via validation of the model against operational data using the 5-year moving average (1999–2019). The models were largely insensitive to economic assumptions given the fuel consumption rates were directly compared across simulations to quantify system performance. Irrespective of this, actual incurred fuel costs were adopted to match real inflation. Low-load diesel application was assessed via revision of the diesel low-load limit from 30% to 10%. The efficiency of existing diesel assets under low-load operation was established in prior studies [26], remaining predominantly linear in relationship.

2.2. Low-Load Diesel

Low-load diesel application affords diesel generation improved range and flexibility, permitting system acceptance of additional renewable generation via a reduction in the diesel engine load limit. The low-load limit is set within the primary engine controller on a case by case basis. No hardware of software replacement is required, resulting in a low complexity, low cost and accessible approach applicable to all diesel generators [27,28]. Poor combustion and cylinder condition are responsible for historical restrictions surrounding low-load operation, however, a number of manufactures now warrant low-load applications, reflecting the increased awareness and viability of the practice [29]. Due to poor low-load efficiencies, fuel consumption per kWh of diesel generation increase at low-load, however, given both the increased renewable capture and the low volume of kWh’s produced by diesel generation at low-load, the practice has a net positive reduction in fuel usage, as confirmed via system simulation. Net fuel reductions result, despite reduced efficiency, given the acceptance of greater instantaneous renewable penetration. This occurs given the engines ability to further reduce load as renewable generation increases. Conventionally, once an engine hits its 30% load limit any additional renewable generation is spilt from the system. Under low-load application this additional generation is accepted via further diesel load reduction. The major operational concern in reducing an engine’s low-load limit is the risk of reverse power acceptance given the reduced ability of the diesel assets to regulate upward renewable variability. This is commonly managed via the inclusion of a dump load to dissipate excess generation as heat.

3. Low-Load Diesel Modelling Results

For high-penetration hybrid diesel systems such as King Island, low-load diesel permits the acceptance of additional renewable generation from any reserves of surplus generation. Simulation of the annual King Island system performance in this manner identified average diesel fuel savings of 6.3% per annum (on a year by year basis savings varied with renewable resource, above average wind generation would result in increased fuel savings, while lower wind generation would decrease observed fuel savings). It can be seen from the results that a reduction in engine low limit serves to lower the systems diesel reserve requirements, reducing the time engines spend operating at their low-load limit. For King Island the application delivers both improve renewable penetration, via a reduction in renewable spillage, and an associated reduction in the requirement for energy storage [30]. For high renewable penetration systems such as King Island, low-load diesel application does not impact the systems renewable hosting capacity, acknowledging the system already hosts a renewable capacity exceeding its maximum load. For high-penetration renewable energy systems such as King Island, low-load diesel is also observed to rationalise the requirement for energy storage In this case the annual average battery utilisation (amount of energy stored, MWh) is reduced by 50%, allowing for a smaller battery capacity and reduced capital cost.
For low-penetration renewable systems, such as Moloka`i, the role of low-load diesel application is less obvious. Primarily, because low-penetration systems rarely spill renewable generation. Simulation of the Moloka`i system identified a range of alternate low-load benefit, including improved hosting capacity and reduced diesel OPEX. Simulation of the pre-2016 (prior to BESS and dump load integration) Moloka`i hosting capacity determined that the limit of uncontrolled solar PV was 2.5 MW. Simulation inclusive of the BESS and dump load, representing the current Moloka`i system, determined the hosting capacity to be 3.0 MW. A low-load diesel scenario was then considered with the diesel generation permitted to run down to 10% loading. A 10% load limit is considered conservative and was selected considering both the age of the assets, and the experience of the neighbouring Kauai Island utility cooperative in obtaining permits to operate at this level. Simulating a low-load limit of 10%, the system hosting capacity was increased to between 3.5 MW and 3.8 MW. Allowing adoption of low-load operation across only the high-speed engines, units 1 and 2, the hosting capacity was increased to 3.5 MW, a 17% increase. For adoption of low-load operation across diesel engines 1, 2 and 9, the hosting capacity was increased to 3.8 MW, a 27% increase. The results define a role for low-load diesel application in near-term relief of hosting capacity constraint. As the Moloka`i system is functionally at its hosting capacity envelope, and does not generally spill generation (less than half a percent of generation is dissipated via the resistive dump load), no immediate increase in renewable penetration was observed under low-load diesel application. Despite this, fuel savings were delivered via low-load diesel operation, achieved via a modified low-load diesel dispatch scheme. The existing Moloka‘i dispatch strategy prioritises large low-speed engines (large), generators 7–9, with small high speed (small) generators 1&2, deployed to address load variability. Band allocations 1 through 5 define the generation intensity, with band increase associated with greater diesel capacity, Table 5. Fuel usage correlates to band allocation, with lower bands consuming less fuel. A modified low-load diesel dispatch scheme, Table 6, shifts the balance of generation from band 3 to band 2, via substitution of large low-speed generation for small high-speed generation. The modified low-load diesel dispatch scheme delivers both a reduction in fuel use, and significantly, a reduced maintenance obligation. The reduced maintenance spend results in lower maintenance costs attributed to small inertia and high-speed engines [31].
In addition to improved hosting capacity, low-load diesel application within the current Moloka`i system results in a fuel reduction of 1%, and an 8% reduction in maintenance expenditure, Table 7. The combined annual OPEX reduction is $209,469 p.a., representing 2.7% of total annual operational expenditure. Economic modelling was then extended to consider a future 6 MW solar PV capacity scenario, Table 8. While in violation of the system’s current hosting capacity, this scenario is useful in exploring the storage requirements required to support additional solar PV deployment. The proposed low-load diesel methodology reduces this requirement by 43%, approximately halving the storage capacity required for grid security under future high-penetration scenarios.

4. Discussion

Few approaches to renewable integration acknowledge the resource and capital constraints common within isolated communities, yet both represent significant barriers to uptake of renewable generation. In acknowledging the urgent need for power system decarbonization, low-load diesel application has a role to play in providing greater flexibility to isolated power systems, resulting in improved renewable hosting and acceptance. In this regard, low-load diesel is identified as a low complexity technology solution, offering both hosting capacity relief and battery storage rationalisation. Future research effort should be directed to improved flexibility of dual fuel generation technologies, which remain less compatible to renewable integration than diesel due to increased ignition delay.

5. Conclusions

The presented King Island and Moloka`i case studies represent isolated power systems at differing states of technology progression and refinement. King Island is one of the world’s first high-penetration isolated power systems, able to run 100% renewable for extended periods. Unfortunately, the King Island experience has limited commercial relevance given the high cost and complexity of the approach. In this regard low-load diesel has shown to reduce the systems battery requirements by 50%, while reducing annual fuel consumption by 6.3%. The result highlights the gains possible under improved generator flexibility, offering reduced barriers to renewable integration.
For Moloka`i the challenges in progressing past low annual solar PV penetrations are very different. In this environment, low-load diesel is shown to provide near term relief from the hosting capacity constraint currently preventing connection of additional solar PV generation. On Moloka`i, the adoption of low-load applications allows for the interconnection of another 800 kW of approved, but stalled solar PV connections. For a system dependent on residential deployment of renewable generation, the hosting relief offers both commercial and social benefit, reducing community frustration regarding interconnection delay. In addition to the 27% improvement in hosting capacity low-load applications also provided for a 2.7% reduction in operational expenditure. In improving the flexibility of diesel generation on Moloka`i low-load applications provide for improved system efficiency, a recommencement of solar PV connection and a rationalisation of any future battery storage requirement (low-load diesel provided for a 43% reduction in optimal BESS sizing for a hypothetical doubling of renewable capacity). The results identify low-load diesel as a valuable near-term enabling technology, able to deliver significant value with or without BESS integration. Of the available, commercial technologies low-load diesel is unique for its ability to benefit both low and high-penetration isolated power systems. Its accessibility makes it a natural precursor to storage. The results challenge the conventional practice of prioritising high efficiency, low-speed diesel generation as the base load within diesel-based power systems, instead advocating for flexible thermal applications as systems transition towards renewable economies.

Author Contributions

Conceptualization, J.H. and E.S.; methodology, J.H., M.N. and X.W.; software, J.H.; validation, E.S.; formal analysis, M.N. and X.W.; investigation, J.H.; writing—original draft preparation, J.H.; writing—review and editing, X.W. and M.N.; visualization, J.H.; supervision, M.N.; project administration, X.W.; funding acquisition, J.H. All authors have read and agreed to the published version of the manuscript.

Funding

This research was funded by The Australian Research Council, award LP170100879, and the Office of Naval Research Global, award N00014-19-1-2161.

Acknowledgments

The authors would like to acknowledge Richard Rocheleau, from the Hawai`i Natural Energy Institute and Ray Massie from Hydro Tasmania for their assistance during the case study preparation.

Conflicts of Interest

The authors declare no conflict of interest.

References

  1. Alves, M.; Segurado, R.; Costa, M. On the road to 100% renewable energy systems in isolated islands. Energy 2020, 198, 117321. [Google Scholar] [CrossRef]
  2. Aris, A.M.; Shabani, B. Sustainable power supply solutions for off-grid base stations. Energies 2015, 8, 10904–10941. [Google Scholar] [CrossRef] [Green Version]
  3. Hamilton, J.; Negnevitsky, M.; Wang, X. Economics of renewable energy integration and energy storage via low load diesel application. Energies 2018, 18, 1080. [Google Scholar] [CrossRef] [Green Version]
  4. Hong, Y.Y.; Lai, Y.M.; Chang, Y.R.; Lee, Y.D.; Liu, P.W. Optimizing capacities of distributed generation and energy storage in a small autonomous power system considering uncertainty in renewables. Energies 2015, 8, 2473–2492. [Google Scholar] [CrossRef] [Green Version]
  5. Hamilton, J.; Negnevitsky, M.; Wang, X. Economic rationalization of energy storage under low load diesel application. Energy Procedia 2017, 110, 65–70. [Google Scholar] [CrossRef]
  6. Tsai, C.T.; Beza, T.M.; Wu, W.B.; Kuo, C.C. Optimal configuration with capacity analysis of a hybrid renewable energy and storage system for an island application. Energies 2020, 13, 8. [Google Scholar] [CrossRef] [Green Version]
  7. Hamilton, J.; Negnevitsky, M.; Wang, X.; Lyden, S. High penetration renewable generation within Australian isolated and remote power systems. Energy 2019, 168, 684–692. [Google Scholar] [CrossRef]
  8. Corsini, A.; Tortora, E. Sea-water desalination for load levelling of gen-sets in small off-grid islands. Energies 2018, 11, 2068. [Google Scholar] [CrossRef] [Green Version]
  9. Tafech, A.; Milani, D.; Abbas, A. Water storage instead of energy storage for desalination powered by renewable energy–King Island case study. Energies 2016, 9, 839. [Google Scholar] [CrossRef] [Green Version]
  10. Hansen, K.; Breyer, C.; Lund, H. Status and perspectives on 100% renewable energy systems. Energy 2019, 175, 471–480. [Google Scholar] [CrossRef]
  11. Semshchikov, E.; Negnevitsky, M.; Hamilton, J.M.; Wang, X. Cost-efficient strategy for high renewable energy penetration in isolated power systems. IEEE Trans. Power Syst. 2020, 1. [Google Scholar] [CrossRef]
  12. Gupta, C. Sustainability, self-reliance and aloha aina: The case of Molokai, Hawai’i. Int. J. Sustain. Dev. World Ecol. 2014, 21, 389–397. [Google Scholar] [CrossRef]
  13. Tasmanian Economic Regulator. Energy in Tasmania Report 2018–2019. 2020. Available online: https://www.economicregulator.tas.gov.au/Documents/Energy%20in%20Tasmania%20Report%202018-19%2020%20210.pdf (accessed on 14 April 2020).
  14. Clean Energy Council. Clean Energy Australia Report. 2020. Available online: https://assets.cleanenergycouncil.org.au/documents/resources/reports/clean-energy-australia/clean-energy-australia-report-2020.pdf (accessed on 11 April 2020).
  15. Alternative Technology Association. Windpower on Rottnest Island. Soft Technol. Altern. Technol. Aust. 1983, 13, 11–13. [Google Scholar]
  16. Hawaii State Energy Office. Hawaii Energy Facts and Figures; Hawaii State Energy Office: Honolulu, HI, USA, 2019; pp. 33–36. Available online: https://energy.hawaii.gov/wp-content/uploads/2019/07/2019-FF_Final.pdf (accessed on 13 April 2020).
  17. Gamble, S. Approaches and lessons from King Island and Flinders Island hybrid projects. In Proceedings of the Informa Remote Area Power Conference, Sydney, Australia, 15 June 2016. [Google Scholar]
  18. Fairley, P. Customers seek 100-percent-renewable grids. IEEE Spectr. 2017, 54, 12–13. [Google Scholar] [CrossRef]
  19. Reynolds, C. 100% renewable energy Moloka’i. In Proceedings of the Isolated Power System Connect, Maui, HI, USA, 17 October 2018; Available online: http://www.ipsconnect.org/ipsconnect2018/program (accessed on 23 April 2020).
  20. Rocheleau, R. Hawaii clean energy transformation policy, challenges, and opportunities. In Proceedings of the Isolated Power System Connect, Maui, HI, USA, 17 October 2018; Available online: http://www.ipsconnect.org/ipsconnect2018/program (accessed on 23 April 2020).
  21. Stein, K.T.; Musser, K.; Rocheleau, R. Evaluation of a 1 MW, 250 kW-hr battery energy storage system for grid services for the Island of Hawaii. Energies 2018, 11, 3367. [Google Scholar] [CrossRef] [Green Version]
  22. Manwell, J.F.; McGowan, J.G. A combined probabilistic/time series model for wind diesel systems simulation. Sol. Energy 1994, 53, 481–490. [Google Scholar] [CrossRef]
  23. Graham, V.; Hollands, K. A method to generate synthetic hourly solar radiation globally. Sol. Energy 1990, 44, 333–341. [Google Scholar] [CrossRef]
  24. Manwell, J.F.; McGowan, J.G. Lead acid battery storage model for hybrid energy systems. Sol. Energy 1993, 50, 399–405. [Google Scholar] [CrossRef]
  25. Lambert, T.; Gilman, P.; Lilienthal, P. Micropower system modeling with HOMER. In Integration of Alternative Sources of Energy; John Wiley and Sons: Hoboken, NJ, USA, 2006. [Google Scholar]
  26. Hamilton, J.; Negnevitsky, M.; Wang, X. The potential of low load diesel application in increasing renewable energy source penetration. Cigre Sci. Eng. 2017, 8, 49–59. [Google Scholar]
  27. Welz, R. Low Load Operation for s1600 gendrive engines. OE Development Newsletter Power Generation, MTU Friedrichshafen, Application Newsletter 15-005, 21st April, Freidrichshafen. 2015. [Google Scholar]
  28. Brooks, P. Limitations on low load operation for fixed speed engines. In Cummins Marine Application Bulletin; MSB No. 2.05.00-02172005; Cummins: Columbus, OH, USA, 2014. [Google Scholar]
  29. Hamilton, J.; Negnevitsky, M.; Wang, X. Low load diesel perceptions and practices within remote area power systems. In Proceedings of the International Symposium on Smart Electric Distribution Systems and Technologies (EDST), Vienna, Austria, 8–11 September 2015; pp. 121–126. [Google Scholar]
  30. Hamilton, J.; Negnevitsky, M.; Wang, X.; Tavakoli, A. No load diesel application to maximise renewable energy penetration in off grid hybrid systems. In Proceedings of the Cigre Session, Paris, France, 21–26 August 2016; pp. 1–10. [Google Scholar]
  31. Hawaiian Electric. 100% Renewable Energy Infrastructure Plan Moloka’i; Hawaiian Electric: Honolulu, HI, USA, 2017. [Google Scholar]
Figure 1. King Island isolated power system schematic, left hashed, and Moloka`i isolated power system schematic, right hashed.
Energies 13 04053 g001
Figure 2. King Island isolated power system performance from 1999 to 2019.
Energies 13 04053 g002
Figure 3. King Island generation showing system transition between wind (light blue), battery (light green), resistor (dark green, 1–3 h) and diesel (dark blue, post 4 h) isochronous control.
Energies 13 04053 g003
Figure 4. King Island flywheel (purple) response to rapid loss of wind generation (light blue), supporting battery response (light green) and ride through.
Energies 13 04053 g004
Figure 5. Twenty-four hours of King Island generation, showing diesel off operation as the afternoon sea breeze comes on.
Energies 13 04053 g005
Figure 6. Moloka`i average daily load profile 2016 (orange), 2017 (blue) and 2018 (purple). Note the reduction in midday load under increasing solar photovoltaic (PV) penetration [19].
Energies 13 04053 g006
Figure 7. Moloka`i isolated power system (IPS) frequency (black) and battery (green) response to loss of load [20].
Energies 13 04053 g007
Table 1. Hawai`i wind power developments 1980–2020.
NameCommissionedDecommissionedLocationCapacityTurbine
Kahuku19801982O`ahu200 kWMOD-0A 200 kW
Kahua19831992Hawai`i3.4 MWJacobs 17.5 kW
Windane19841991Maui340 kWWindane-31
Kahuku19851996O`ahu9 MWWestinghouse 600 kW
Lalamilo19852010Hawai`i2.3 MWJacobs 17.5/20 kW
Kahuku19871993O`ahu3.2 MWMOD-5A 3200 kW
Kama’oa19872006Hawai`i9 MWMitsubishi 250 kW
Moloka`i19911997Moloka`i300 kWVestas V20
Hawi2006ongoingHawai`i10.56 MWVestas V47 600 kW
Kaheawa2006ongoingMaui30 MWGE 1.5 MW
Pakini2007ongoingHawai`i20.5 MWGE 1.5 MW
Pakini Nui2007ongoingHawai`i20.5 MWGE 1.5 MW
Kahuku2011ongoingO`ahu30 MWClipper 2.5 MW
Kaheawa II2012ongoingMaui21 MWGE 1.5 MW
Auwahi2012ongoingMaui21 MWSiemens 2.1 MW
Kawailoa2012ongoingO`ahu69 MWSiemens 2.3 MW
Table 2. Island power systems case study metrics.
King Island Renewable Energy Integration ProjectMoloka`i Secure Renewable Microgrid
Developer/OwnerHydro TasmaniaMaui Electric Company
Peak Load (MW)2.55
Average Load (MW)1.43.7
Annual Generation (GWh p.a.)1232
Population16008000
Annual Tourist Numbers p.a.700080,000
Distance to major port (km)25040
Diesel Capacity (MW)613
Wind Capacity (MW)2.250
Solar PV Capacity (MW)0.83
BESS Capacity (MW/MWh)3/1.51/0.397
Flywheel SystemYesNo
Renewable Energy Penetration (% p.a.)65%13%
Development Period1998–20152009–ongoing
Utility inter-island connection (cable)NoNo
Table 3. King Island Currie Power Station generation.
UnitGeneratorGovernorMWRPMCylindersAge (Yrs)
G01Caterpillar 3516BCAT ADEM, Woodward AGLC1.615001612
G02Caterpillar 3516BCAT ADEM, Woodward AGLC1.615001612
G03Caterpillar 3516BCAT ADEM, Woodward AGLC1.615001622
G04Caterpillar 3516BCAT ADEM, Woodward AGLC1.215001634
G05MTU S4000ComAp InteliSys1.21500162
Table 4. Moloka`i’s Pālā‘au Power Station generation.
UnitGeneratorGovernorMWRPMCylindersAge (Yrs)
G01Caterpillar 3516Woodward 2301A1.2518001634
G02Caterpillar 3516Woodward 2301A1.2518001634
G03Cummins KTA50American Bosch CU673C-17 A0.9712001634
G04Cummins KTA50American Bosch CU673C-17 A0.9712001634
G05Cummins KTA50American Bosch CU673C-17 A0.9712001628
G06Cummins KTA50American Bosch CU673C-17 A0.9712001628
G07Caterpillar 3608Woodward 2301D2.2900823
G08Caterpillar 3608Woodward 2301D2.2900823
G09Caterpillar 3608Woodward 2301D2.2900823
Table 5. Moloka`i diesel utilisation for a 3 MW solar PV scenario (current dispatch scheme).
BandExisting Moloka`i Dispatch Strategy (Load Range)Band Utilisation
1ONE small and ONE large generator (<1.2 MW)1.3%
2NO small and TWO big generators (<2.3 MW)30.9%
3AT LEAST ONE small and TWO large generators (<3.5 MW)59.1%
4NO small and THREE Large generators (<4.5 MW)7.9%
5AT LEAST ONE small and THREE large generators0.8%
Table 6. Moloka`i diesel utilisation for a 3 MW solar PV scenario (low-load dispatch scheme).
BandProposed Moloka`i Dispatch Strategy (Load Range)Band Utilisation
1ONE small and ONE large generator (<1.2 MW)1.3%
2ATWO small and ONE large generator (<2.6 MW)46.3%
3AT LEAST ONE small and TWO large generators (<3.5 MW)43.7%
4NO small and THREE Large generators (<4.5 MW)7.9%
5AT LEAST ONE small and THREE large generators0.8%
Table 7. Performance of existing and proposed low-load dispatch scheme 3 MW solar PV.
Current PV Capacity (3 MW)
Control MethodologyFuel Usage gal p.a.Fuel Usage %O&M $ p.a.O&M %REP %Annual $ Saving
Existing Dispatch Scheme2,009,686100%$1,887,480100%14%
Proposed Dispatch Scheme1,991,89599%$1,729,86092%14%$209,469
Table 8. Performance of existing and proposed low-load dispatch scheme 6 MW solar PV.
Future PV Capacity (6 MW)
Control MethodologyFuel Usage gal p.a.Fuel Usage %O&M $ p.a.O&M %Excess Energy %REP %Annual $ Saving
Existing Dispatch Scheme1,818,89391%$1,952,850100%3.8%23%
Proposed Dispatch Scheme1,747,45388%$1,768,26091%2.2%26%$373,616

