1. Introduction
Low-carbon technologies in sustainable buildings have become more popular in recent years, mainly because of the aim to reduce the greenhouse effect and to save energy and natural resources. The EU is working to achieve the a 20% reduction in greenhouse gas emission by 2030 compared with the emission levels of 1990 [
1]. The built environment contributes almost 35% of the total European CO2-emissions and factory buildings are highly represented in this share [
2]. On the other hand, newly designed buildings have to meet the requirements of the Near Zero Energy Building (NZEB) standard, where renewable resources must have a share in energy consumption of at least 25%.
The proposed sustainable building design approach in this particular study is substantially based on natural ventilation (NV), which is a passive ventilation method, based on wind- and/or buoyancy-based pressure differences to refresh air from indoor spaces with outdoor air [
3]. The main benefits of NV are the lower operation energy cost in contrast to mechanical ventilation and the improved indoor environment air quality [
4]. Many parameters should be analyzed carefully to achieve these advantages and the main design of NV has to be approved in the design phase. Unfortunately, NV is still not recognized in the regulations, therefore it cannot be calculated and considered into the 25% rule of renewables. In addition, NV requires an appropriate understanding of building pressurization, façade design [
5], wind patterns, and local climate conditions, which only can be achieved by a specific design method, not regulated by the NZEB standard or any other legislations and codes.
Passive ventilation is an increasingly popular method to reduce building energy use by drawing in outdoor air without the aid of mechanical equipment. In buoyancy-driven natural ventilation systems, appropriate air inlets in the building envelope and vertical connection between each floor must be provided, directly connected to an exhaust opening typically located in or on the roof. These design elements are to be defined in the early design stage. There could be various types of architectural solutions to connect spaces vertically [
6], e.g., atria commonly provide this solution. Although well-designed atria can help significantly to lower the energy consumption of a building through natural ventilation, poorly designed atria can increase energy use [
7]. To ensure a proper design, various simulation tools predict atria performance during the design stage.
In most cases, wind flow influences even stronger building ventilation performance, infiltration rates, and the associated heat losses or gains [
8]. Therefore, the building envelope bears great importance in buildings’ energy behavior: the façade and roof performance, i.e., form (geometry), structure and openings should be improved according to indoor requirements and the surrounding outdoor environment conditions and neighboring structures, since they modify the local microclimatic flow characteristic and may cause unexpected flow effects. Appropriate aerodynamic building design, in turn, enables one to benefit from given circumstances, creating wind-climate responsive solutions.
The complexity of the aforementioned aspects is the reason why building designers often do not consider NV. The lack of knowledge in this field and the missing expertise for evaluation and implementation may result in poorly designed, constructed and operated naturally ventilated buildings. On the other hand, many methods could be used to predict ventilation in theoretical research studies [
9]. Among them, computational fluid dynamics (CFD) has been the most advanced method for predicting NV performance [
6,
10,
11,
12,
13] and among the numerous simulation tools available, CFD models have become one of the most popular in the literature and accounted for 70% of publications on simulating building ventilation recently reviewed by Chen [
14]. Although the literature review did not solely focus on either natural ventilation or atria, it concluded that the v2f-dav, RNG k–ε, and k-Ω turbulence models performed best of all the Reynolds-Average Navier–Stokes (RANS) models [
15]. Numerous studies have drawn similar conclusions [
16,
17,
18,
19]. Other CFD studies have simulated atria: Awbi simulated a 15-m high atrium to evaluate temperature, wind velocity, and CO2-levels within the space [
20]. This CFD method can optimize the building solutions by simulation instead of trial-and-error techniques that require much effort, time and resources. Moreover, several studies [
21,
22,
23,
24,
25] have been developed to assist the CFD model definition. The current research is therefore based on CFD to assist architects in the optimization of NV behavior in buildings.
Based on the above, only few concepts with NV can reach the executing stage, therefore there are rare opportunities for the evaluation and validation of these kinds of buildings, their aerodynamic performance and the simulation modelling technology. Only a marginal part of the publications reports experimental measurements, whereby such studies were rarely carried out in aerodynamically complex, voluminous buildings. Implemented building examples with innovative natural ventilation systems are rarity, and their publications usually have no scientific data [
11,
26,
27,
28,
29,
30]. As a result, knowledge of passive ventilation systems is poor due to system complexity and lack of measurements.
This case study analyzes the effect of a combination of distinct façade inlet openings with roof-integrated exhaust openings on the indoor airflow distribution to improve the NV behavior. An air sweeping effect is achieved by a special wind deflector, installed above the outflow. The aim of the work is to validate the high-resolution CFD model by comparing its results with the measurements. While the aerodynamic design approach is applied in a particular study for a factory building, it is also applicable in residential houses [
31] and for most of the built environment, i.e., settlement climate simulations [
32], but the main objective is to set a standard for small European enterprises (SME) with need of a production hall for the ventilation cost reduction.
2. Materials and Methods
The applied investigation method, consists of a high-resolution CFD model experiment, with the main aim being to provide an appropriate initial basis for PACS development in industry halls.
Real building monitoring: As a first step, an implemented prototype industry building was monitored since 2015 (5 years’ database) to gain in situ measurements of its production hall’s ventilation properties and the unique chimneys’ aerodynamic characteristics.
High-resolution CFD model: In a second stage, a high-resolution CFD model is created to be calibrated by the measured air velocity and air temperature values. During geometry creation, mathematical solver code selection (turbulence models), appropriate boundary conditions are indispensable. In order to achieve an accurate model validation, all relevant details of the interior and the exterior should be modeled, i.e., the terrain, vegetation, furniture, occupants, equipment, and lighting appliances are defined with aerodynamically reasonable simplifications.
Manual measurements: Besides the integrated, automated monitoring system, timely, limited manual measurements are necessary to capture a detailed airflow pattern and the thermal behavior of the investigated production hall.
CFD model calibration: In the final stage, calibration of the air temperatures in the ventilation towers, as well as the air volume flow in the exhaust chimneys and the total air change ACH in the hall, takes place in the CFD model.
Assessment and evaluation of the proposed PACS: The validated CFD model provides high-resolution visualization about the evolved external and internal airflow pattern characteristic of the proposed PACS. The result analysis enables development of the first generic knowledge to further improve PACS for sustainable buildings.
2.1. Prototype Building
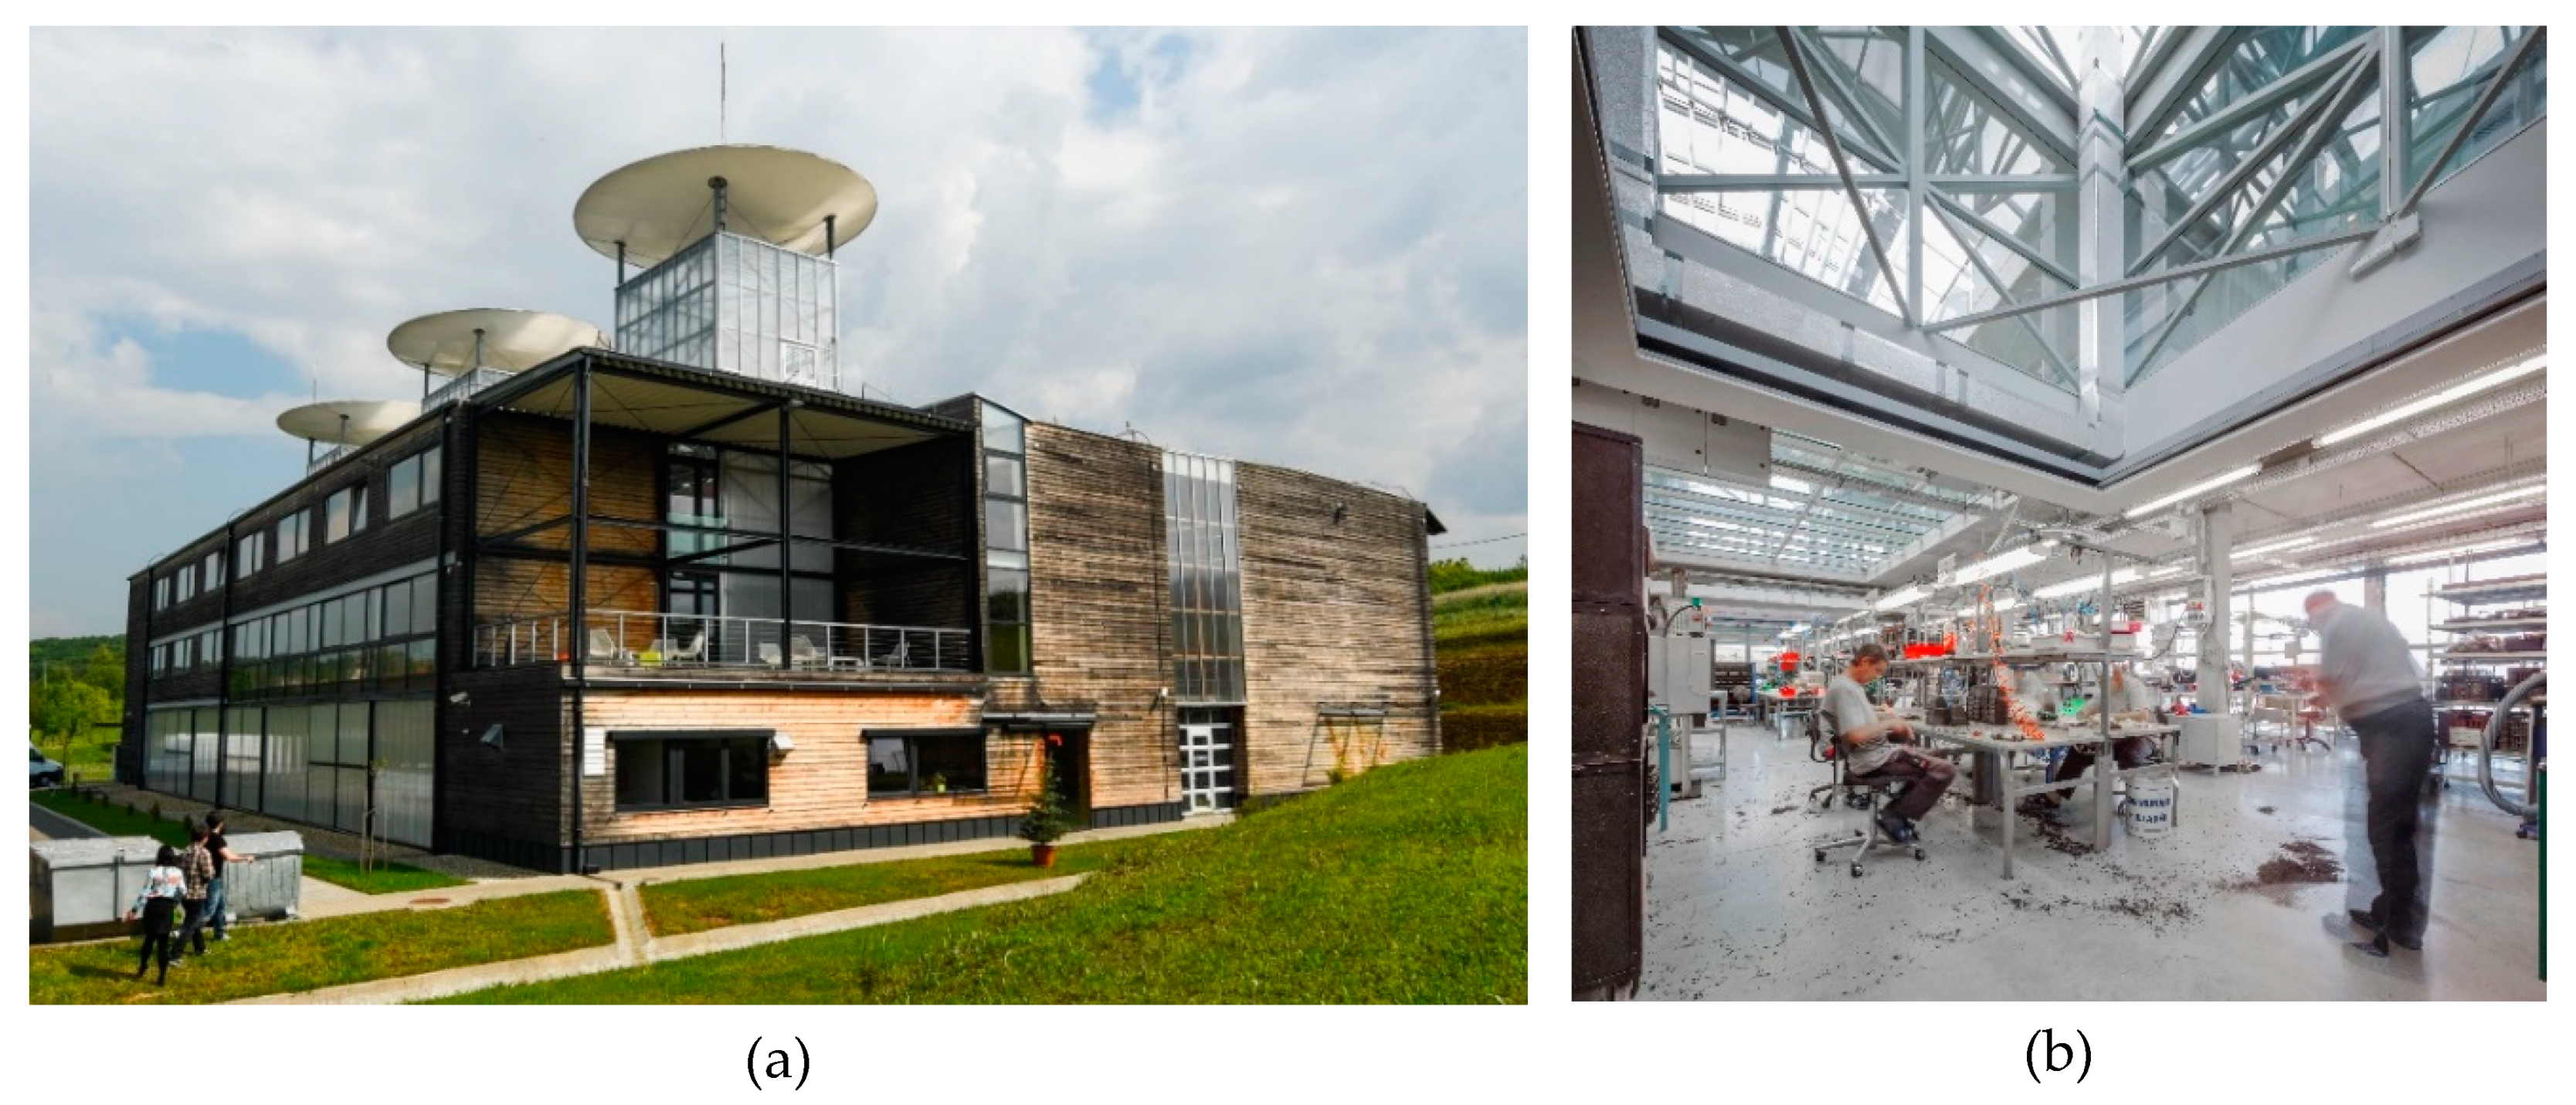
Natural ventilation in the middle European climate is not a common technique; even in Hungary it is neither applied in the building industry nor included in university curricula, so there is a strong need to have best practices for similar industrial buildings in the wider Central European area. A natural ventilated industrial building (
Figure 1) has been built in Southern Hungary, Komló, designed by the Energy Design Group of the University of Pécs. The location is considered as a temperate oceanic climate—Cfb climate zone—by a 1 km resolution Köppen–Geiger classification [
33]. The name can be confusing but the mild summer and milder winter can be valid for higher latitudes as well, especially when situated immediately poleward of the Mediterranean climate zone, as is the case here. The site is located on a north facing slope, where the vegetation is limited to grass, only a few buildings and small patch of trees can be found around the building.
The building can reach a positive energy balance as a result of the thermal and CFD-simulation-based ENERGIA DESIGN® planning method [
34]. It includes numerous techniques: passive architectural strategies as climate-zoning-based space organization and orientation, NV, strategic building body shaping, structures, materials, wall–window ratios, orientation, further active systems (solar thermal system, earth-probes, heat pumps, soil–air heat exchanger and the originally planned PV-system). The construction of the building was completed in 2012, taking up 2515 m
2 useful area. The production hall with 612.5 m
2 net floor space is placed on the ground floor and connected through 2 levels with the roof by three oversized ‘chimneys’.
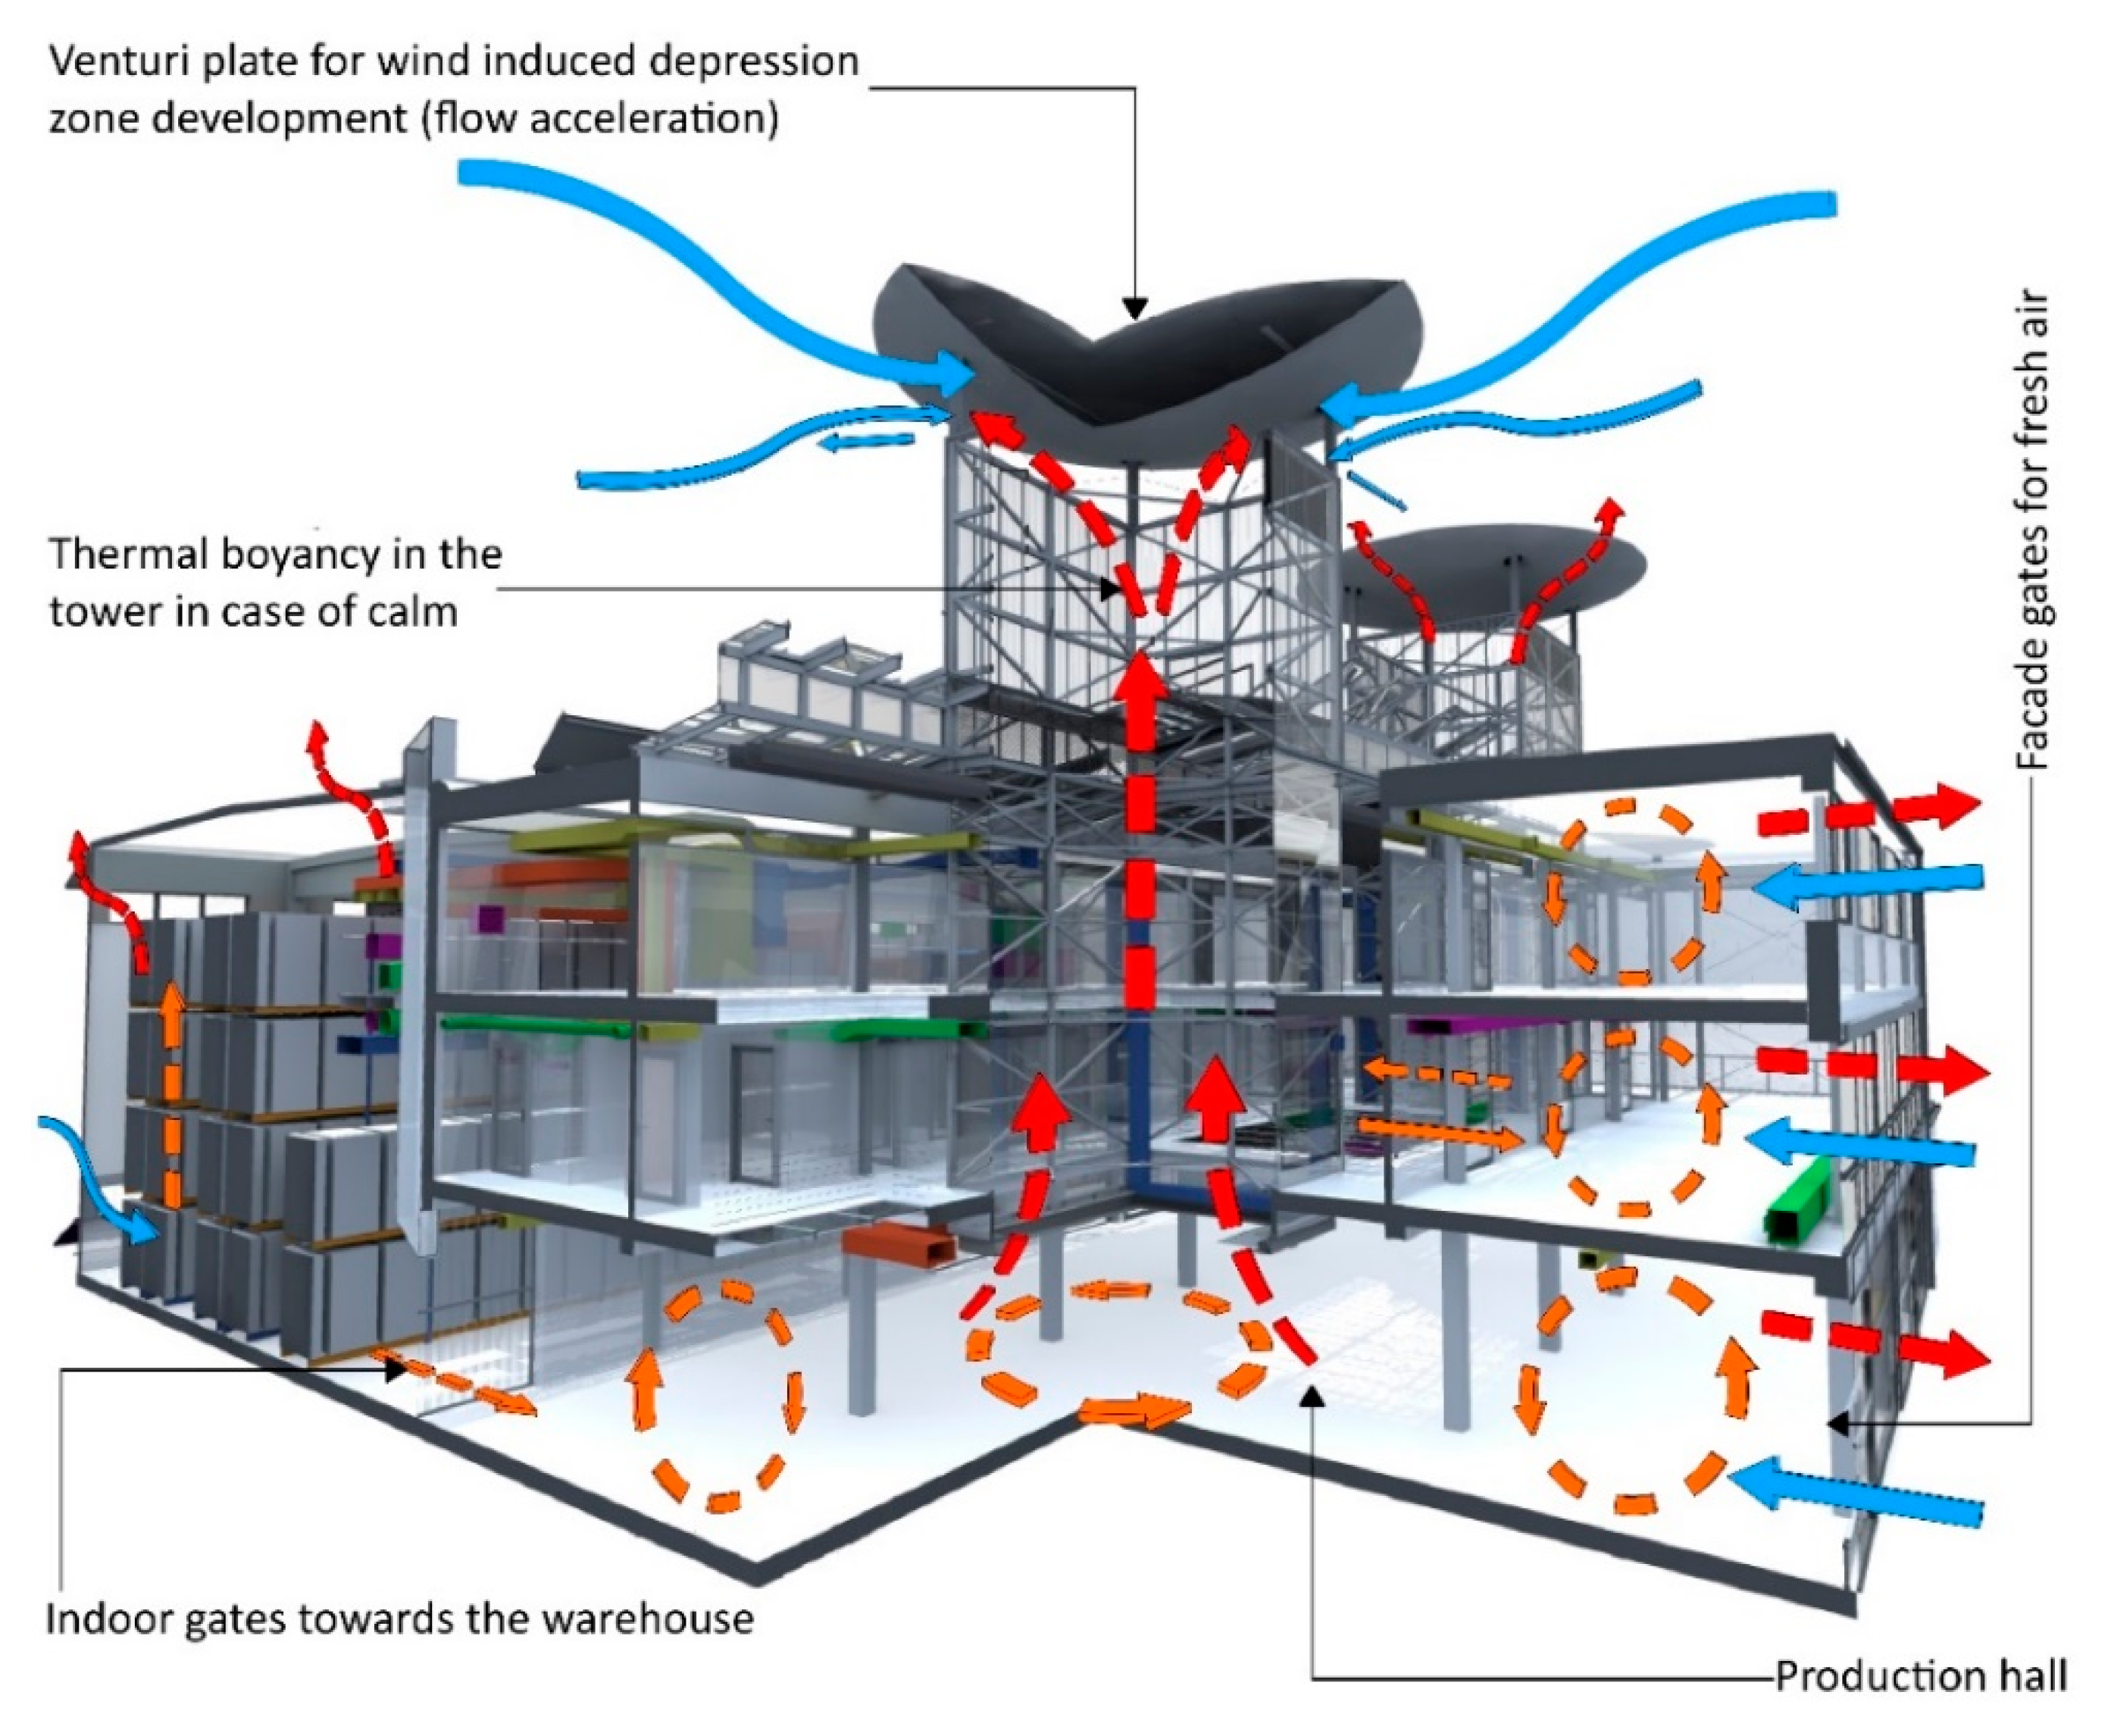
The subject of the present investigations is the NV system of the prototype building, which consists of individually developed ventilation wind towers and wind deflecting structures, which ventilates and cools the most important part of the building, the central production hall, and also contributes to the positive energy balance. In this way, a passive air conduction system (PACS) is created in the hall, combining the unidirectional solar chimney principle [
35] with updraft ventilation and a depression-generating wind tower system (
Figure 2 and
Figure 3). The wind tower principle is partly based on the vernacular Malquaf towers [
36], while the special airflow deflectors, the ‘Venturi’ structures—attached to the top of the towers to accelerate the wind flow—apply a bionic principle, based on the convex form of a penguin as a boundary layer accelerator [
37].
According to this concept, the driving force can be wind, solar gains and internal heat loads, generating continuous upward flow (stack effect) from the production hall to the chimneys. Fresh air flows into the production hall via three motorized gates in the north façade. The production hall is directly connected to the warehouse by two industrial gates as well. Through these gates, additional, indirect fresh air post-flow or air change (ACH) can take place in the production hall. The towers are also responsible for the natural lighting of the production hall and the atrium, which is penetrated by the towers. When furnished, the aerodynamically effective volume of the relatively low production hall was significantly reduced by placing machines and shelves. The PACS is operated during the transitional seasons and at mild summer for daytime ventilation (approximately 6 months), as well as on hot summer days for nocturnal ventilation (passive cooling, approximately 2 months). Since a polymer molding process for the automotive industry takes place in the production hall, it is important to have proper ACH, to provide fresh, clean air and high indoor air quality (IAQ) for the employees. The gates at the towers’ top are controlled by the building management system (BMS) according to different air temperatures in three different zones in the production hall, to air temperatures at the towers’ top, to weather conditions (wind velocity, rain, storm), to time schedules and all of these factors’ interconnections. If one of the temperature zones in the hall increases its temperature above a particular set point, the associated tower opens with 30% intensity. In case of further warming in the hall, after each 2 K temperature rise, the appropriate tower opens with 60% and 90% intensity, respectively (
Figure 3).
The ventilation performance was already investigated during the design phase by low-scale wind tunnel tests, which were compared to CFD simulations. The results showed that the difference in the wind tunnel measurement and the CFD simulation is around 10%, which is suitable for design purposes [
38]. The wind acceleration factor below the ‘Venturi’ structures resulted in a promising, high-efficient passive solution for NV systems.
2.2. Instrumentation
As part of a research collaboration between the owner and operator RATI Ltd. and the University of Pécs (PTE), the university has added a complex mobile monitoring system (MMS) to the existing building management system (BMS) in the pilot building. The BMS provides users with the ability to control general building automation which contains 300 sensors. The second system, the MMS, includes more than 750 data points and allows the research group to collect flow data from the PACS, energy-related data from the heating, ventilation and air conditioning (HVAC) system, and indoor environment comfort quality (IECQ) in the different rooms. The physical characteristics of the building have been monitored by the research team between the period 2015–2020. The measurement of the thermal and flow conditions of the production hall is crucial for this study, in order to calibrate the CFD simulation model and the comfort and energy system modeling for further research investigations. In the framework of continuous data collection, air velocity measurement was carried out with Dantec Comfort Sense Mini CTA (constant temperature anemometer) hot wire probes (which can measure velocities between 0.05 and 30 m/s with accuracy of 2% between 0.05 and 1.0 m/s and 5% between 1.0 and 5.0 m/s, respectively); the air temperature was measured with TESTO 6621 sensors, with the accuracy of 0.5 °C in temperature.
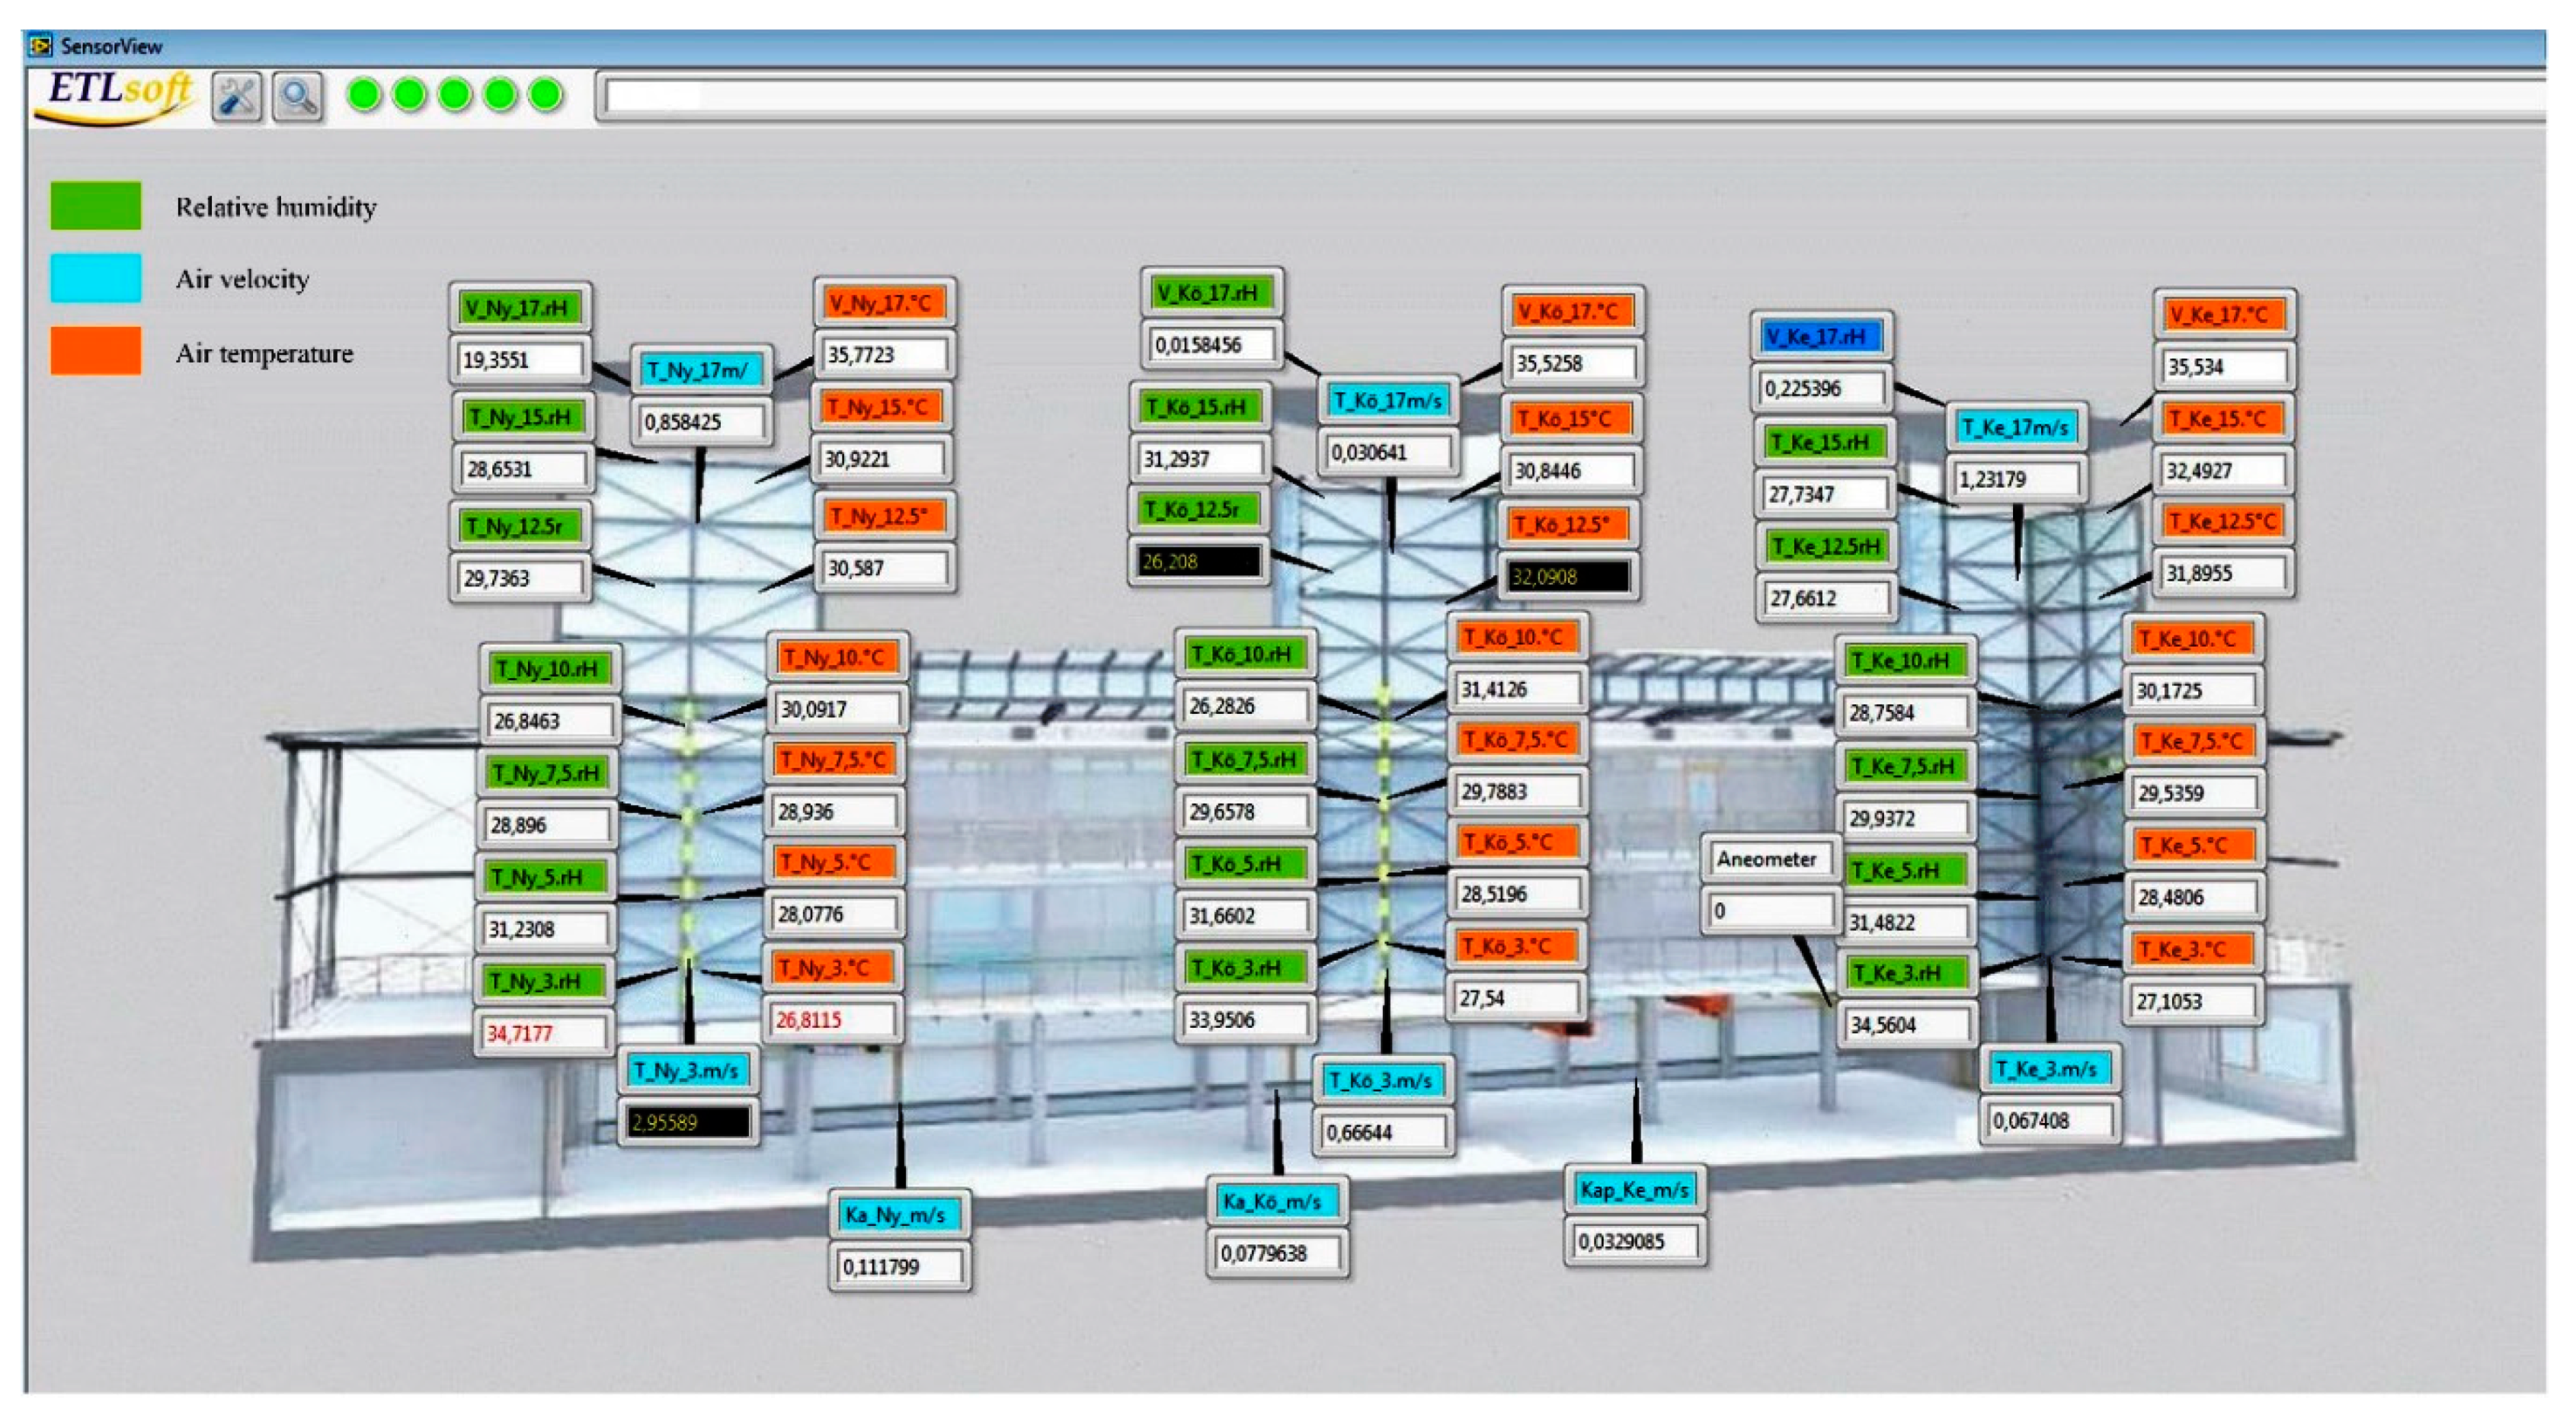
Figure 4 shows the built-in, continuous measurements in the PACS. At a height of 3.0, 5.0 or 7.5, 10, 12.5, and 17.0 m, the towers are equipped with air temperature and relative humidity measuring sensors to record temperature gradients, heat flows, etc. Additionally, in each tower, two CTA probes were installed, the lower one at hall height (at 3.5 m) and another one at the chimneys’ top height (at 17 m).
The external wind direction, wind speed, and temperature is recorded by a Vaisala XT520 Weather Station with ultrasonic sensors in a National Instruments CompactRIO field data acquisition and processing device. The measurement range and accuracy of the weather station is the following: wind speed: 0 to 60 m/s; ±0.3 m/s; temperature: −52 to 60 °C; ±0.3 °C. The measurement tool is installed at the top of the ‘Venturi’ structure above the west vent-tower (
Figure 5) in the free atmospheric wind flow and the total height of its position is 17 m above ground level.
For the purpose of this study, instantaneous values were required for the validation of presumptive flow simulations, so a brief, 3-hour operation period of the production hall was recorded in working hours, taking into account lighting function, occupant position and metabolic heat production, tools, machinery, and power. In addition to in situ continuous MMS measurements, manual measurements were also required to integrate the effects of infiltration through air ducts, facade joints, and exterior and interior windows and gates. The manual measurements were carried out by the following strategy: the air change was induced dominantly by the suctions effect of three wind towers in the production hall. All the openings were closed and the air handling units (AHU) were shut down during the measurements. Therefore, the fresh air sources were only infiltrations around the building envelope openings and the internal gates and doors, as well as the air ducts’ supply inlets of the mechanical ventilation system. Despite the AHU being shut down, the air duct inlets were considered as inlet source as well, because indirect access to outdoor fresh air is provided by a special passive soil–air heat exchanger tunnel system. This subterranean air duct system was constructed as a pre-heater or pre-cooler of the mechanical ventilation. This means that the measured temperatures were not influenced by any forced and tempered ventilation (
Table 1). The infiltrations and the air duct inlets were not integrated to the MMS, hence a manual measurement was necessary. Since the CFD simulation represents aerodynamic phenomenon in a capsuled short period of time, therefore the measured data were collected in a short time as possible (approx. 2–3 h) to finish the assigned measurements in the hall. Simultaneously, the MMS saved data in a minute frequency, to enable to collect detailed, averaged monitoring data. A Testo 480 handheld multifunctional meter was applied with telescopic air temperature, relative humidity, and anemometer (hot wire resistance probes) flow rate meter for infiltration air velocity (volume flow) and air temperature measurements, with the following specification: temperature: –20 to 70 °C; ±0.5 °C and velocity: 0 to 20 m/s; ±0.03 m/s; range and accuracy, respectively. Volumetric flow rates were measured at the ground floor openings in accordance with ISO/DIS 19455-1(en) planning for functional performance testing for building commissioning” using the equal area method for the entrance to a rectangular duct. Since each tower cross-section takes up approximately 5.2 × 3.9 m, calibration of the automated, integrated MMS anemometers in the towers in 3.5 m height were necessary: here, manual air temperature and velocity measurements were carried out within a raster, consisting of 25 sampling points per tower.
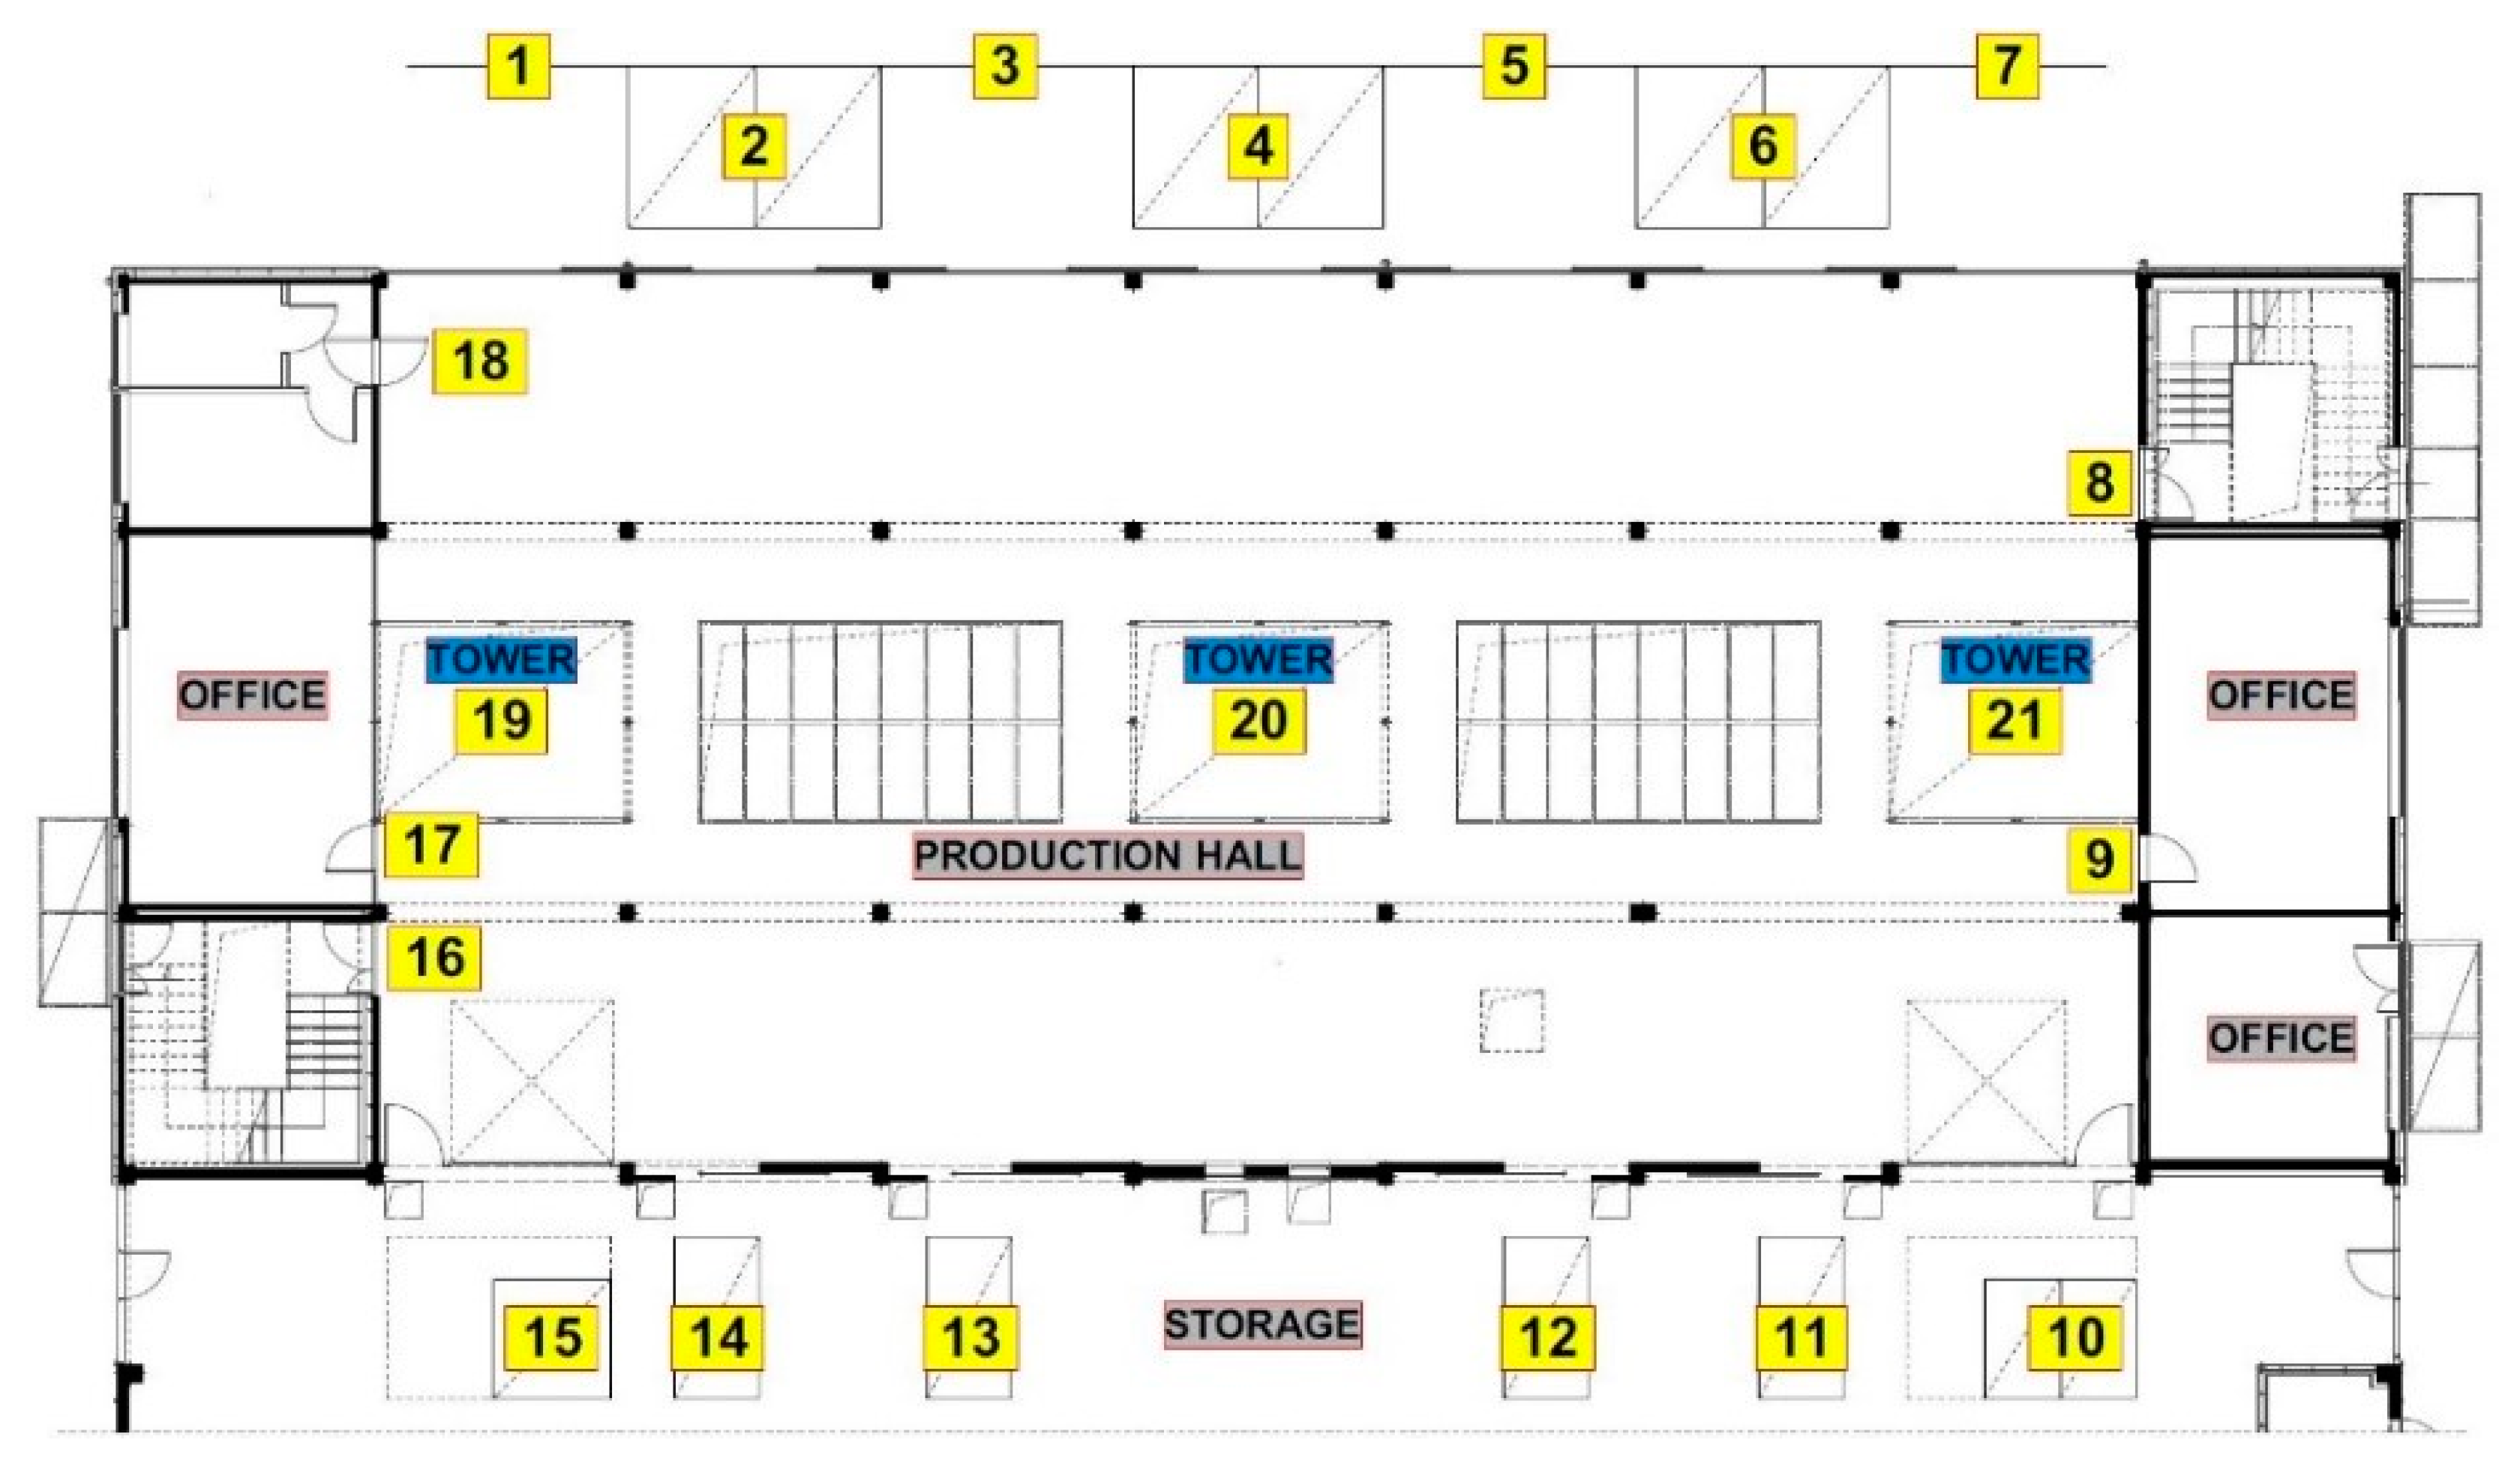
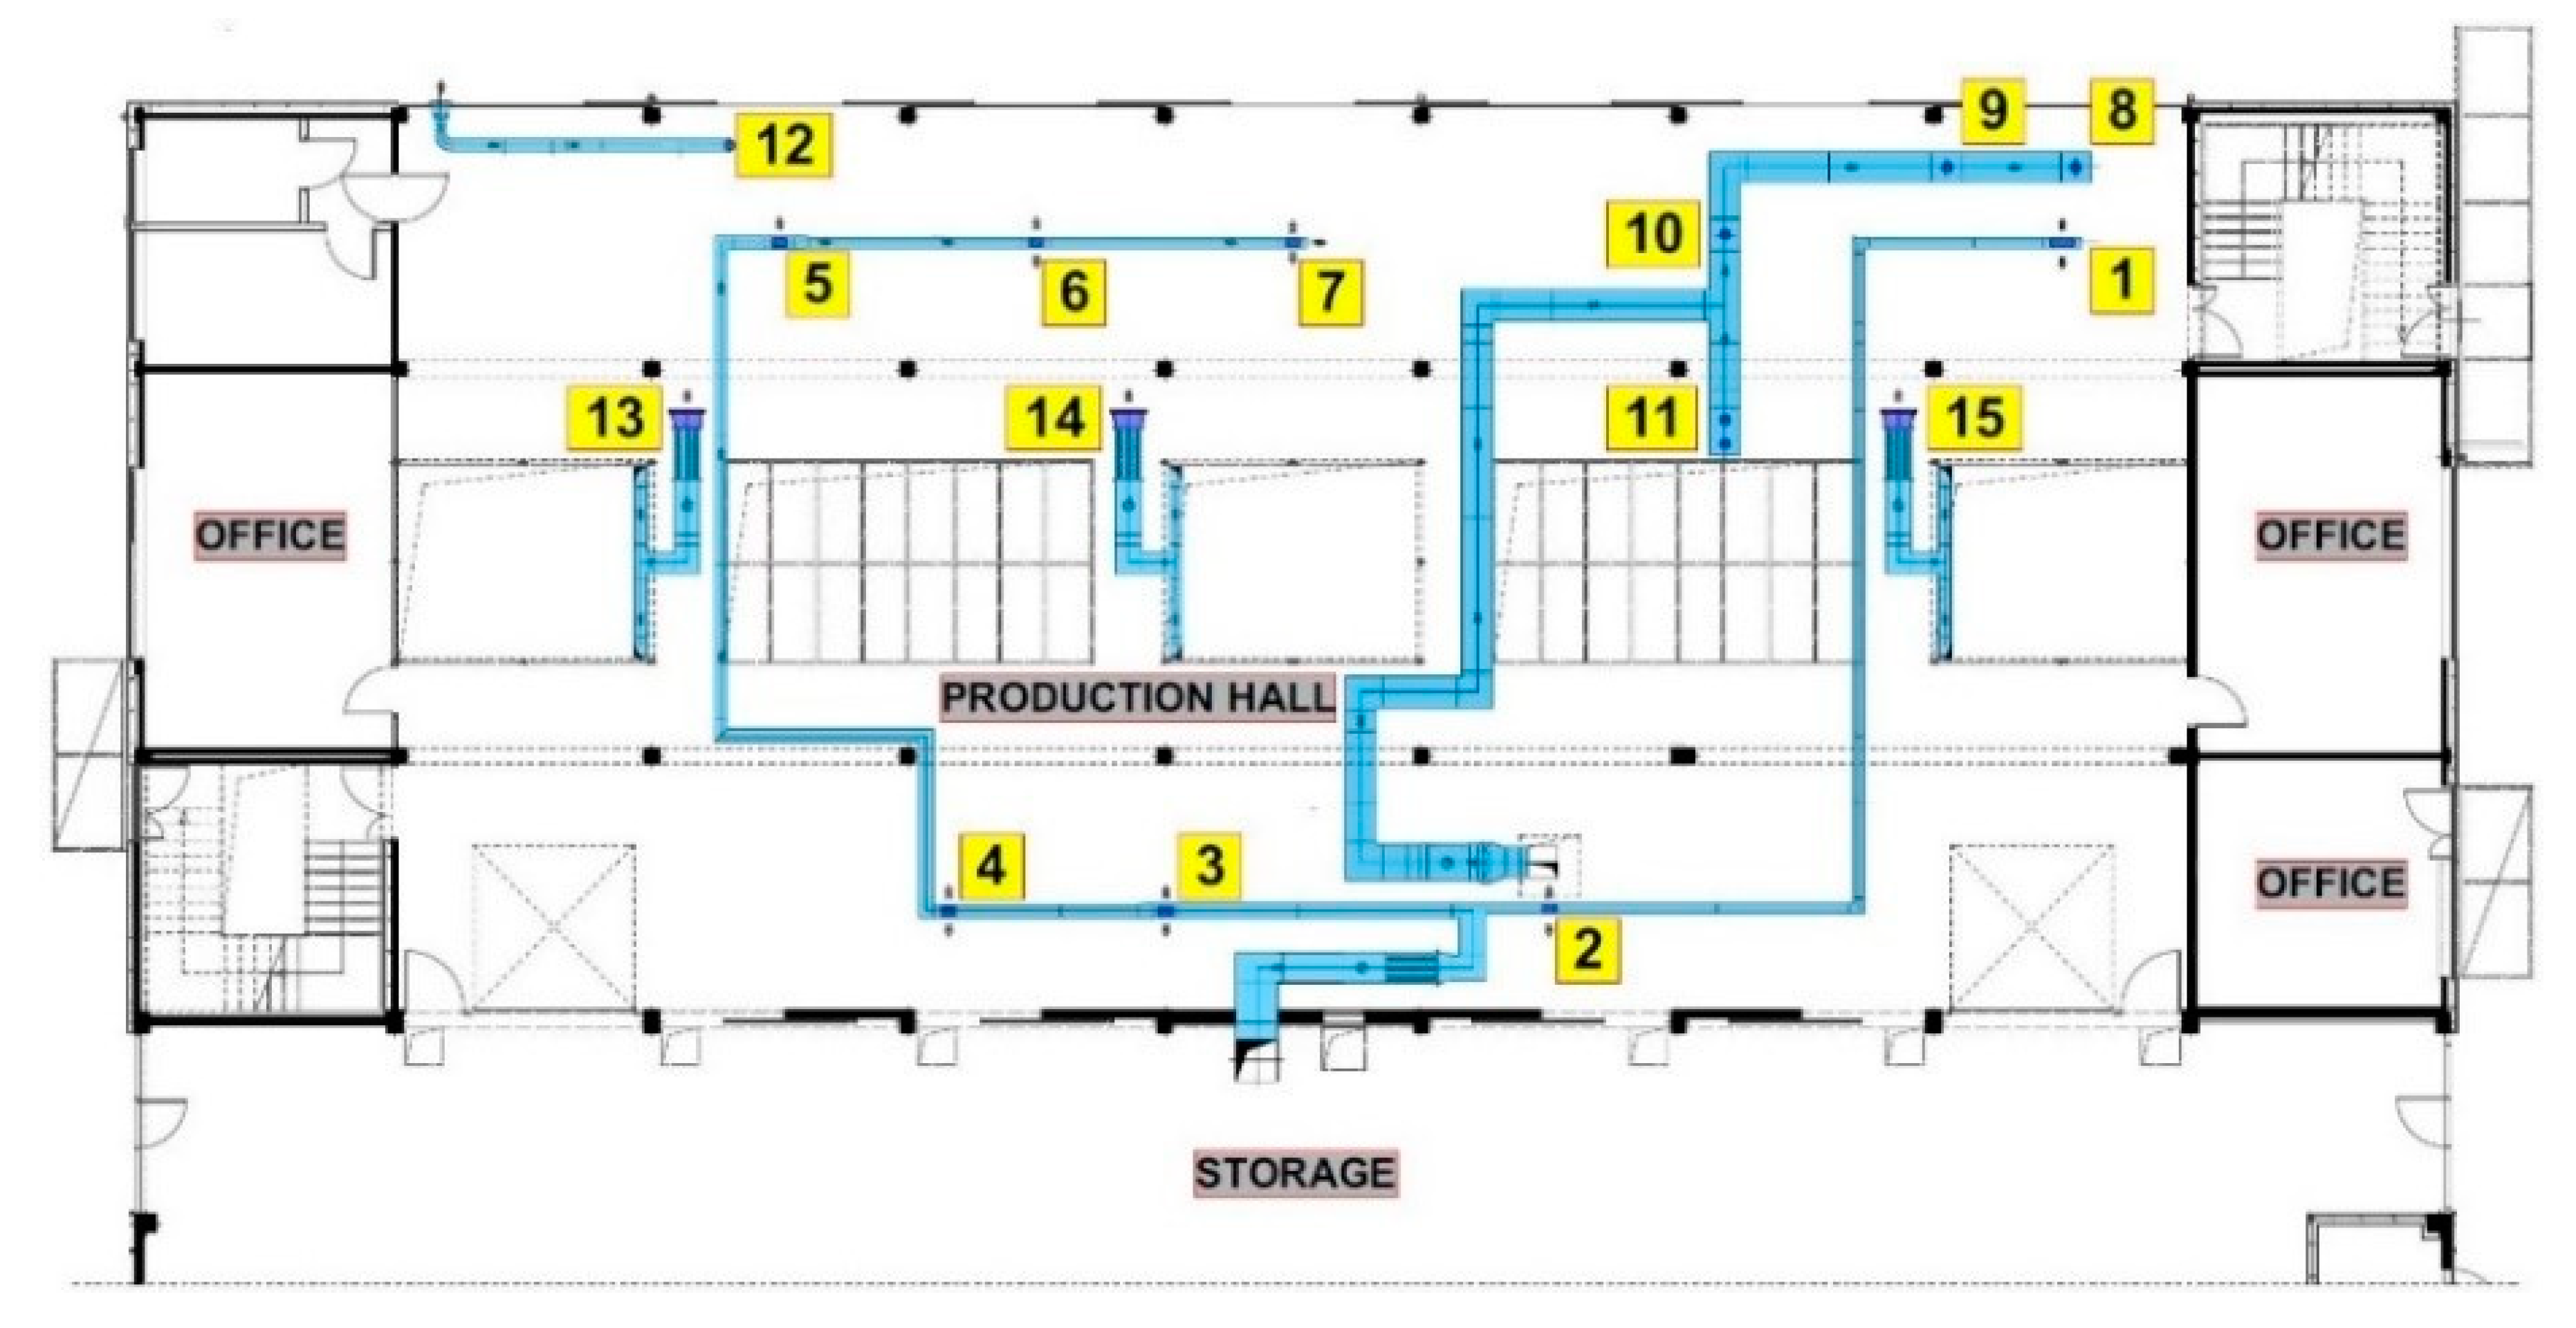
The perimeter infiltration (porosity) of the hall’s envelope structure could be determined by measuring air velocity and temperature at all external and internal openings (façade gates, internal doors) and calculating the volume flow values at each opening perimeter (
Table 1 and
Figure 6). In order to exclude effects of mechanical ventilation, the air handling units (AHU) were switched off during the typical occupation/production hours at the time point of measurements.
Table 2 and
Figure 7 assess the measured ‘passive’ inflow rates through the supply air duct-inlets, caused by the pressure difference in relation to the production hall. Exhaust air could only exit the building through the three ventilation towers. This work is typical for transition and early summer operation periods: during daytime only exhaust airing takes place through the tower openings and during night cooling by fresh air flows in via façade gates and exhaust air leaves through tower openings. Due to the principle of energy and mass conservation, the outflow measurement values through the towers should agree with the inflow into the hall [
39]. Regarding the manual metering results, it is apparent that the porosity infiltration plays a considerable role in inflow intensity, while the air duct inlets have almost no impact on the airflow characteristic of the hall.
2.3. The CFD Model
In order to analyze airflow characteristic and temperature distribution, fluid dynamics simulations (CFD) were carried out, using ANSYS FLUENT 17.1 as equation solver. Besides wind-driven airflow phenomena, the thermal buoyancy driven airflow effects (stack effect) and thermal qualities of the PACS will be examined as well. The surrounding terrain and the building geometry was overtaken from the architectural design (final plans), and remodeled according to the CFD specifications.
A highly detailed 3D-model has been built; every single furniture is placed in the hall, mostly in simplified representation as a cuboid. The model contains heat sources as well: all lamps and instruments and their heat losses and people’s heat dissipation (
Figure 8 and
Table 3). For each obstacle that possesses certain internal heat gain with different heat intensities (W/m
3) were dedicated corresponding to the automated and manual monitoring in the production hall. The heat source values are contained in
Table 3 for the machines and the worktables.
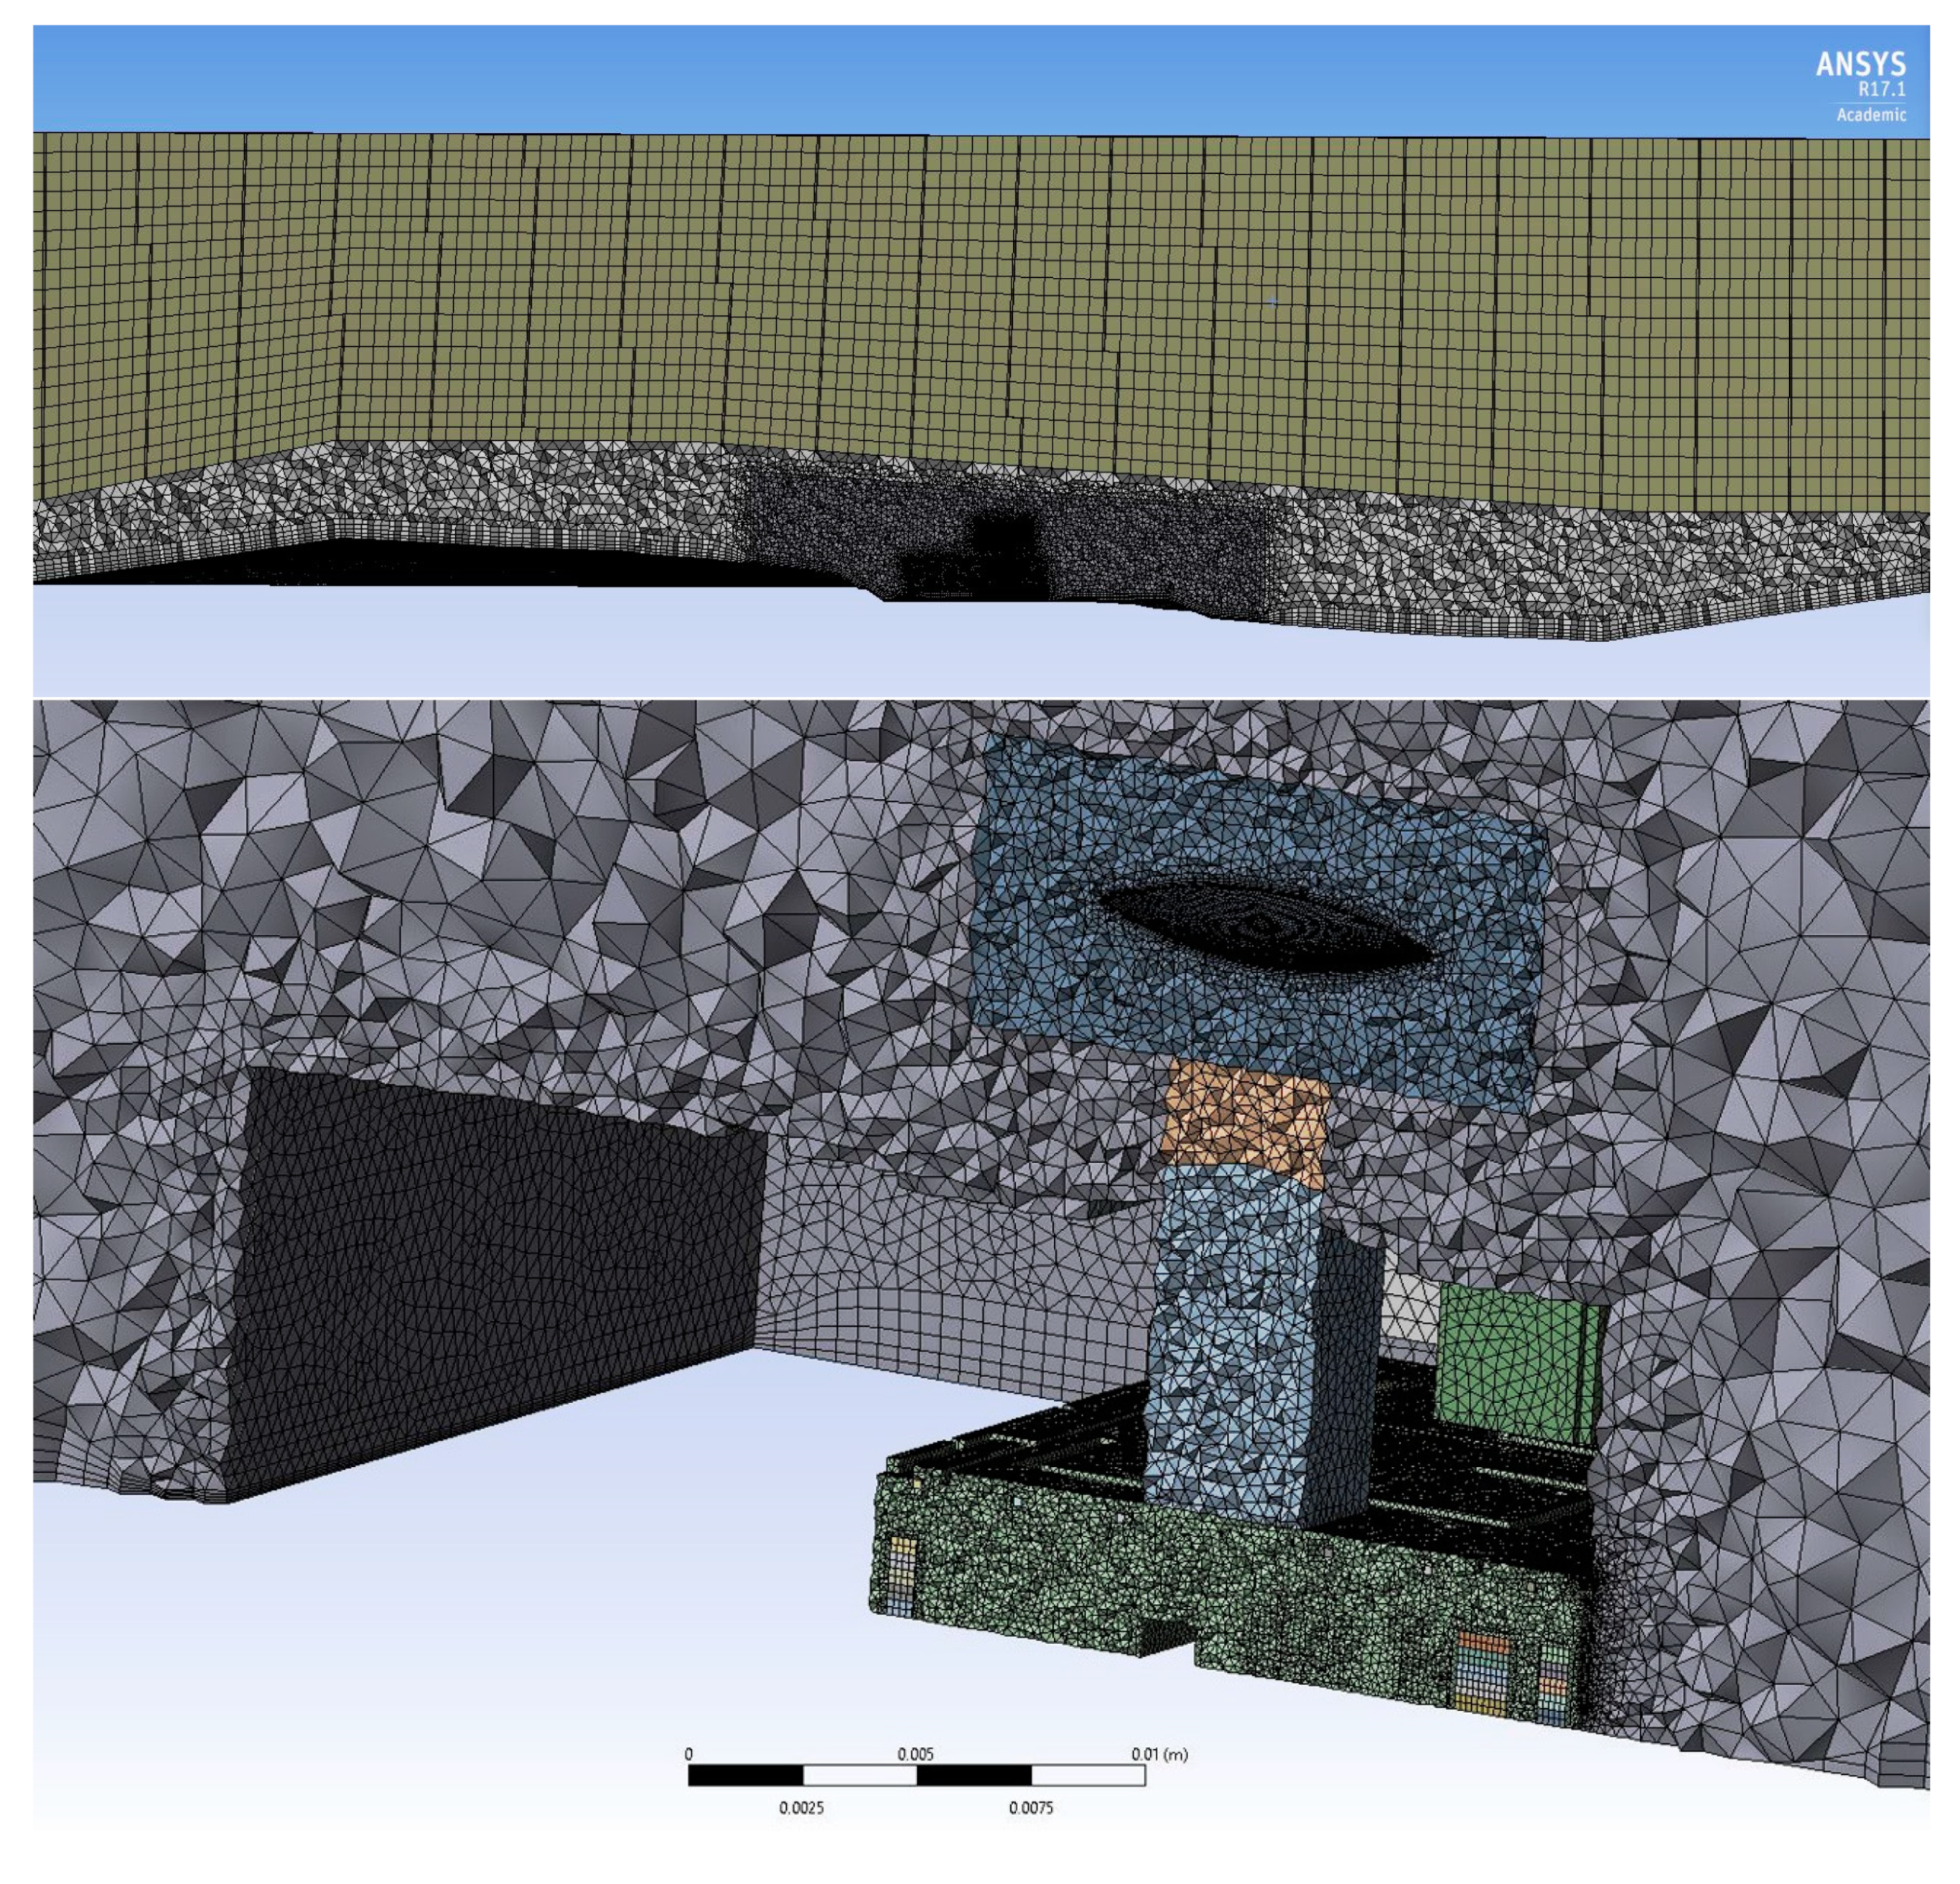
The geometrical discretization has been followed by dividing the flow field for numerous cell size domains to have accurate values where it is needed, and the model size was fitted to the computation limits with almost 9.5 million cells in volume. The most detailed is the production hall; the remaining inner rooms and spaces are not important for the research questions (
Figure 9). Different leaks were constructed around the façade gates (as an effect of the inaccurate construction), having adjustable porosity properties in order to simulate the infiltration phenomena through the façade [
40]. According to boundary conditions assessment (manual measurements), the air duct system’s supply air inlet volume flows were modeled as well. The discretized geometry consists of 0.2 m average cell size elements inside the building. The external space was divided to diverse volume domains, where the average cell size in the near building shell domain is 1.5 m, while the ground holds a 5 layers of prismatic boundary layer for the proper modelling of the important near wall flows, thus the volume mesh is an unstructured hybrid mesh with pyramid, tetra and hexagonal elements.
2.4. Boundary Conditions
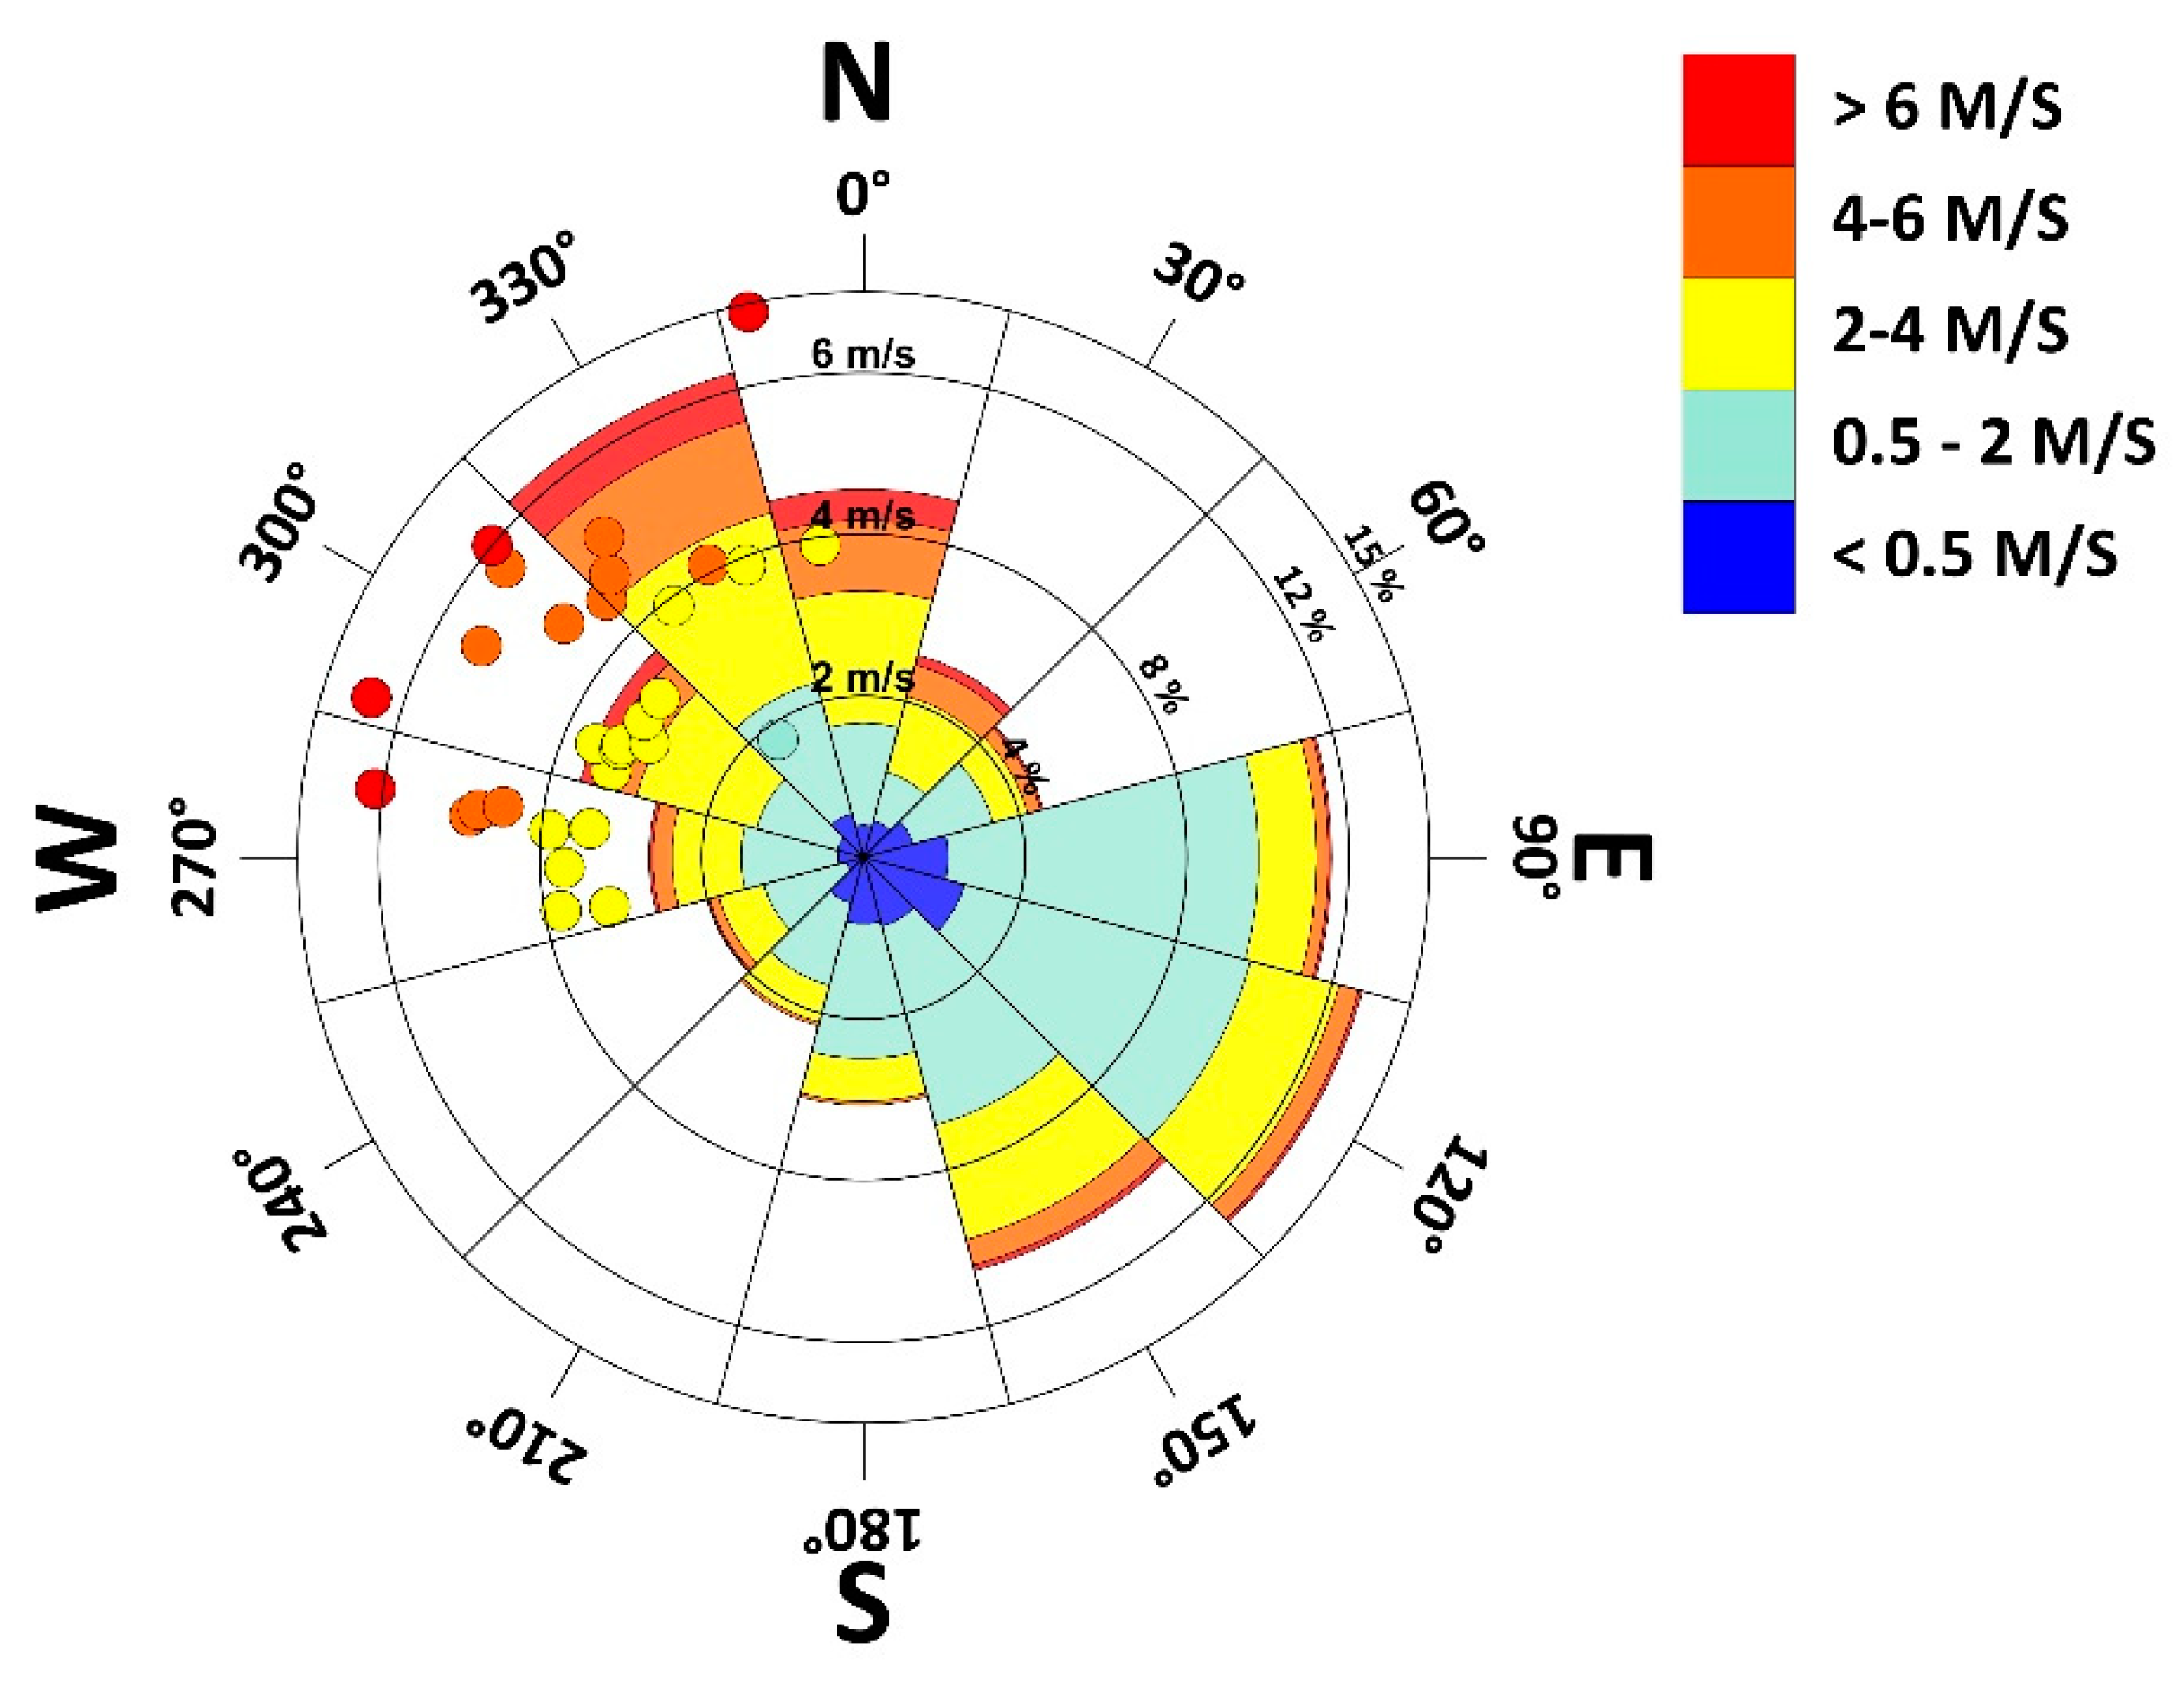
For validation purposes, nine wind directions were recorded on 32 different days during the summer. However, to manage this simply, only the prevailing wind direction case is presented in this paper, while the other datasets were recorded for overall validation. The validation was based on the NW wind direction, which was the most relevant wind direction during the boundary-condition-assessing measurements (
Figure 10).
In this particular case, the measured average wind speed amounted 4.06 m/s, which was chosen as a basis for the wind profile adjustments at 17 m elevation from ground. The simulated wind profile is based on the following Equation (1), presuming that the wind velocity reaches 3 m/s at 10 m height.
The temperature was measured individually at more points as at the weather station (ambient temperature) and in the production hall (three measurement points) and in the towers (3 × 6 sensors,
Figure 4) to set the initial values. As
Figure 8 shows, heat sources such as lamps, machines and workers in the hall were determined with position and geometry, whereas these objects were handled as porous boxes with different air tightness based on measurements [
41]. The viscous model is based on the previous experiences; a stable solution was chosen for transient solution (with initial steady state calculation), with energy transport modelling included. As shown in the literature research and own experiences, k-Ω turbulence model is well suited for this kind of investigations, therefore in the design phase simulations this turbulence model was used. Reaching a steady state situation after 10,000 iterations, the simulation was modified into transient calculation method for accurate realistic results.
3. Results
3.1. Validation of the Reference CFD Model
Figure 11 shows the cross section of the model (terrain and building) with the developed air flow around the building as an overview of the flow field. The initial comparison for the validation was derived from the average velocity magnitude in the cross section at the wind velocity meter (
Figure 12, left). The results show 0.16 % of deviation compared to measured data, which can be accepted as an accurate result [
6]. As the second reference, the air temperature differences were highlighted (
Figure 12, right), and in accordance with the results, the energy transfer simulation method can be stated as acceptable, with no need for further statistical analysis, while the difference from the measured values shows a value lower than 1%. In an engineering application, this result can be used for further joint processes.
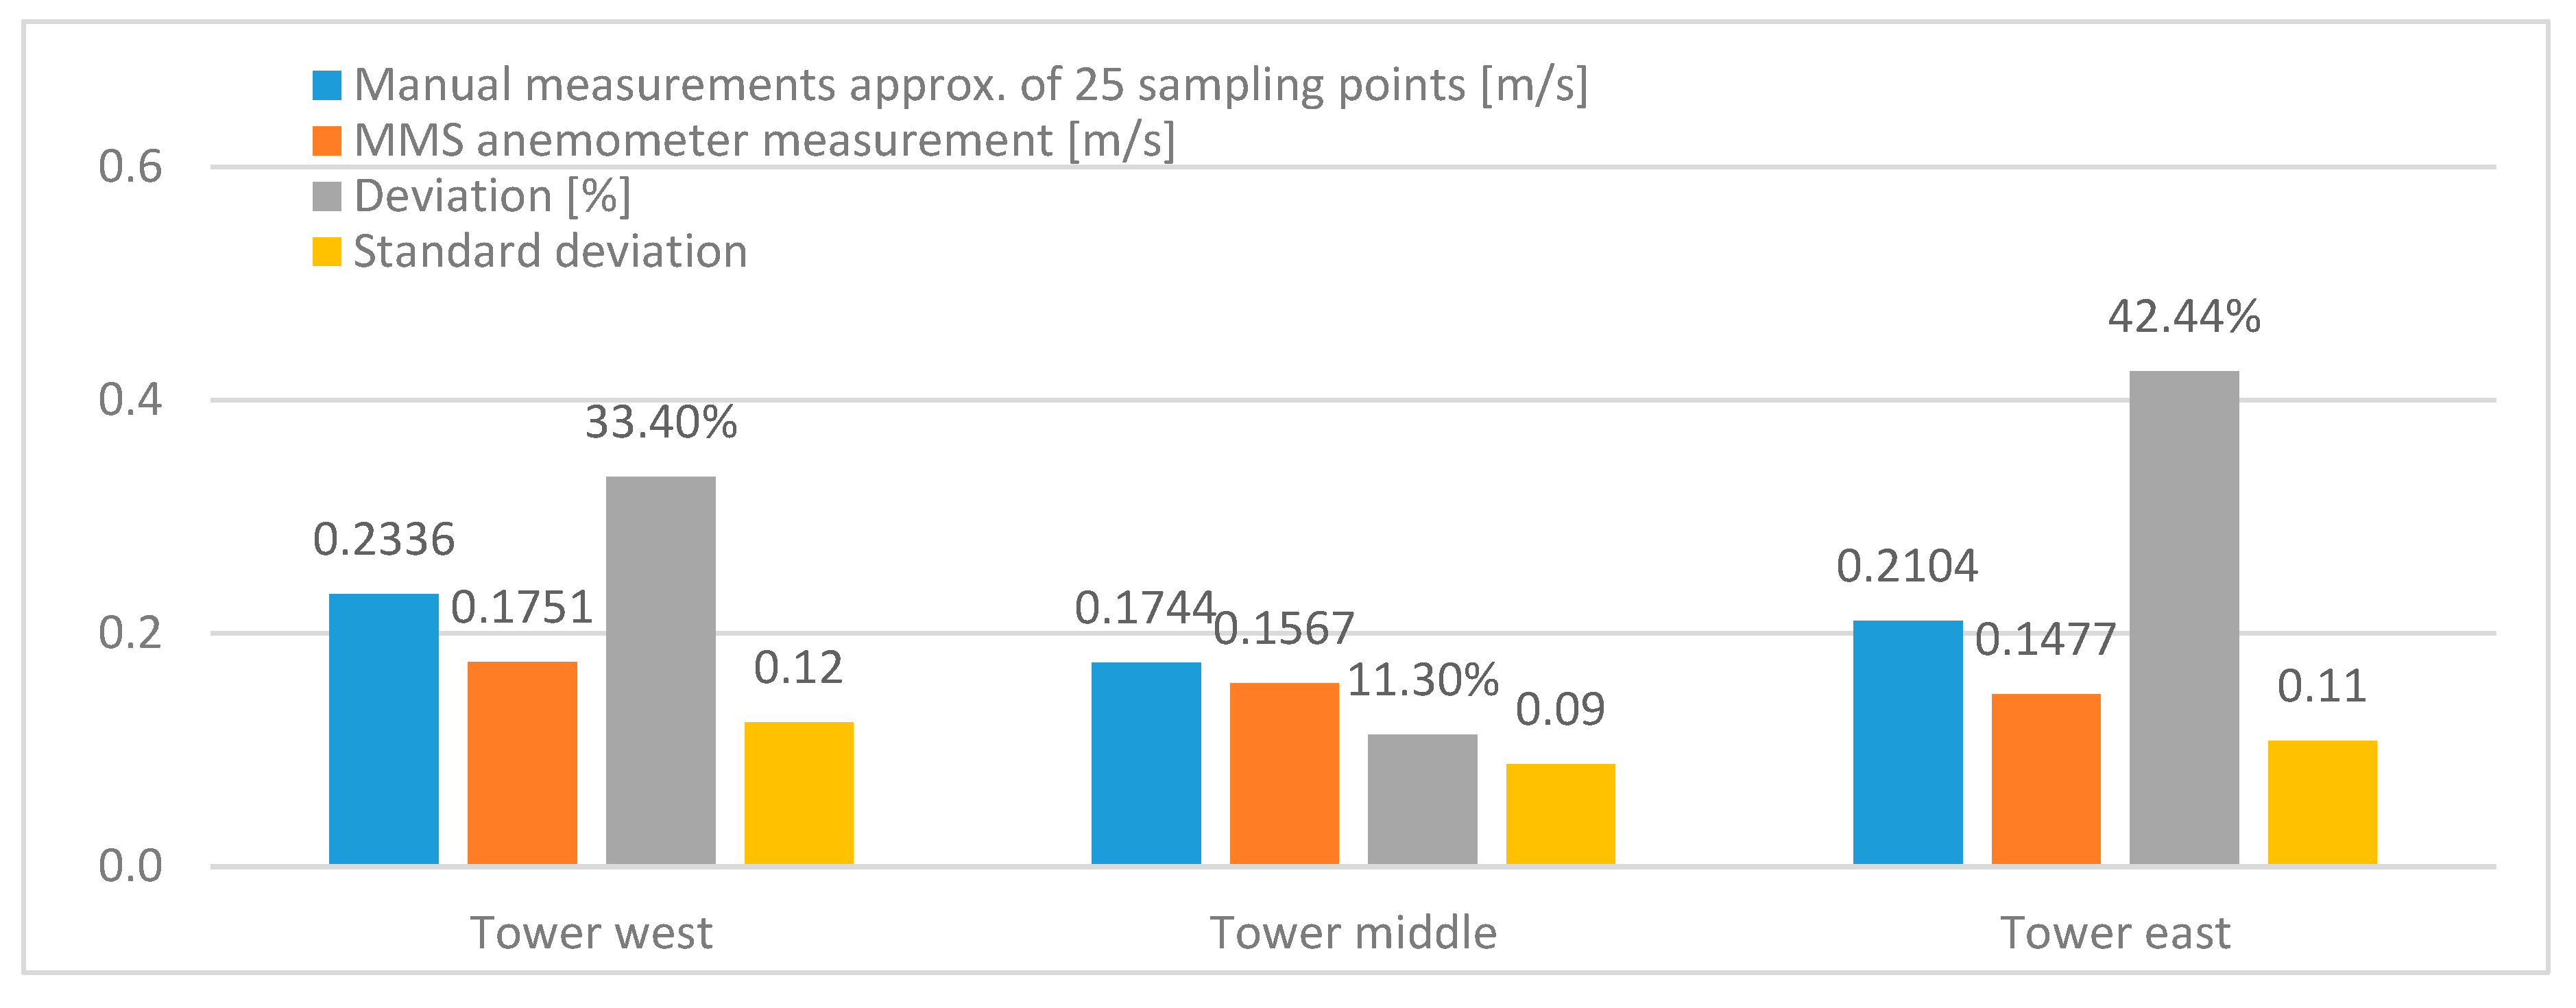
Figure 13 demonstrates the air velocity distribution at the bottom opening of the towers in 3 m height, while the comparison between the manual and automated velocity measurements is shown in
Figure 14. The automated MMS measurement shows significant deviations from the average value of the detailed manual measured results: 11.3% at middle tower, 33.4% at west tower and 42.44% at east tower.
The hand measurements demonstrated that the automated anemometer’s metering and sampling correctness is inaccurate due to occurring complex airflow turbulence in the tower, which cannot be assessed by only one metering sampling point. However, the continuous anemometer measurement can deliver a time-dependent, approximated picture about the airflow characteristic of the towers and the hall for general monitoring purposes. However, the error values are virtually important, since they provide useful correction factors for the recalculation of measured airflow results (
Figure 14) to achieve an appropriate basis for the comparison with the CFD simulations. These corrections were made accordingly in the following volume flow comparison.
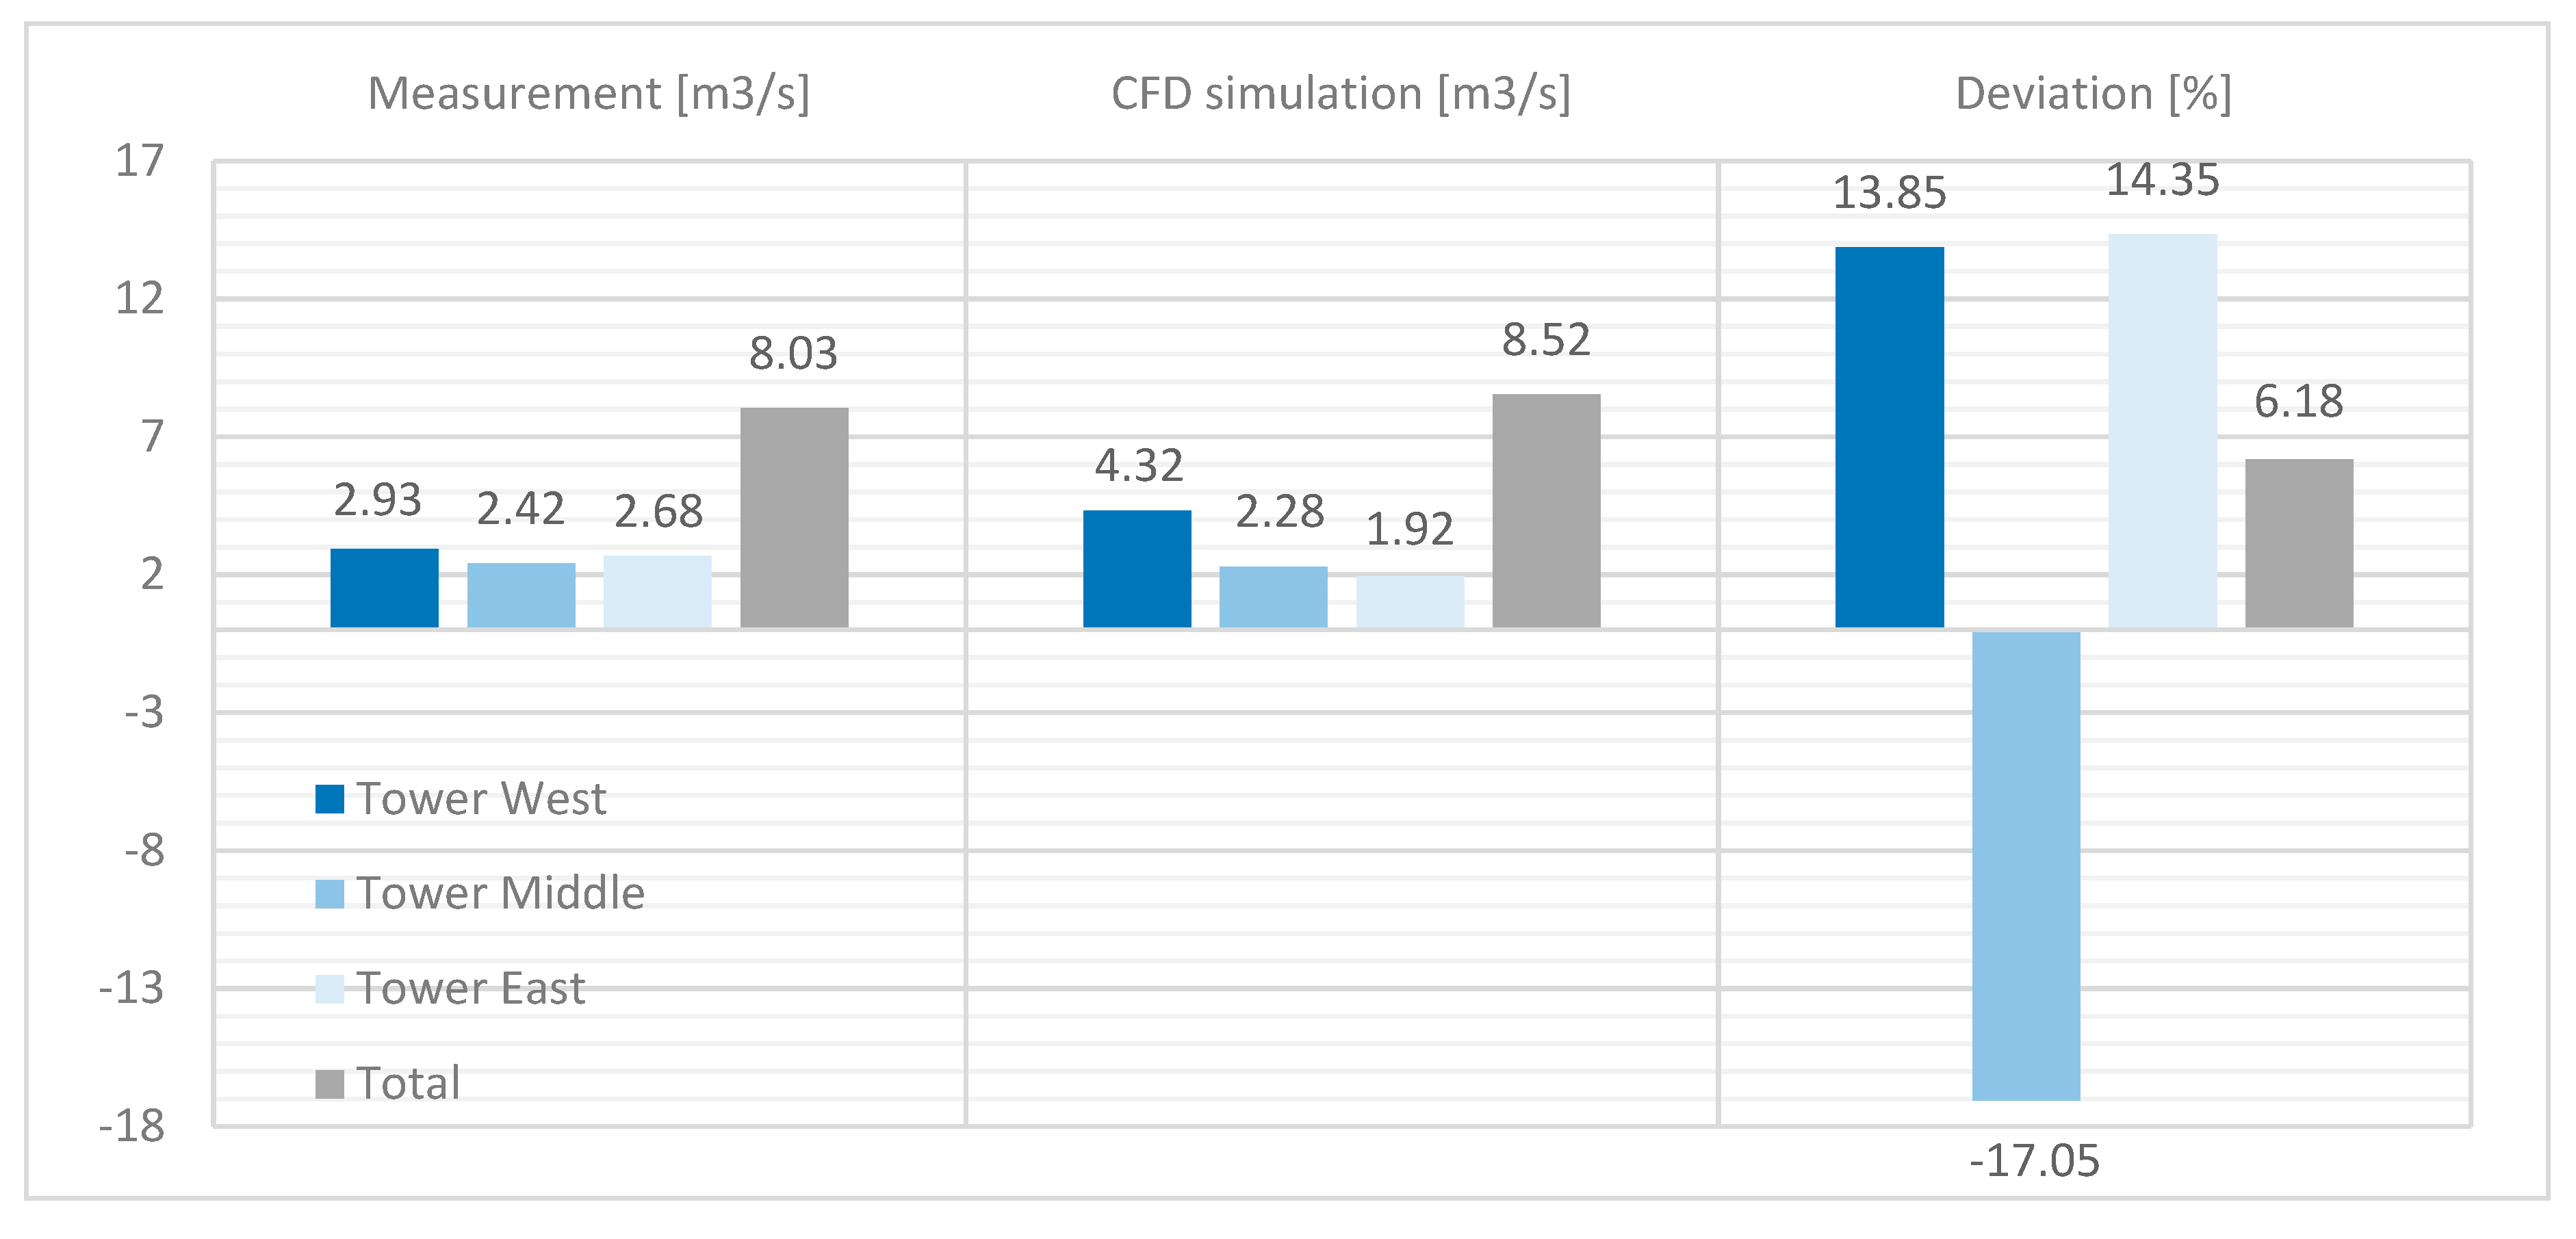
Next, the ventilation of air volume flow rate was analyzed at the three towers (
Figure 15). Regarding the total volume flow rates, a disagreement of 6.18% occurs. The detailed comparison at each tower’s airflow characteristic delivers higher deviation between 13–17% in both positive and negative directions due to the following correlations. In the simulations a constant wind flow is provided form NW direction; according to that, a constant airflow system can be developed in the model. Since the wind direction changes continuously, there is no constant wind direction in reality, so the wind direction can change even every minute. To avoid this problem, only wind direction data were taken into account between north and west. In case of a rapid wind direction change from north to west, airflow acceleration will be induced in the wind exposed west tower. During this, in the east tower—which is located now in slipstream—the airflow stops not immediately, but rather continues according to the previous N wind’s momentum to stream forward in the moment of measurement. This air movement does not change the measurement values significantly but shows the appropriate distribution as lightly distorted.
Due to the uncertainty grade of the measurement technique in such time dependent cases, the deviation values—regarding the complexity of the fluctuations and, as a result, the variation in measurements and the variation in measured and calculated values—show by all means an acceptable validation of the CFD model. Based on the result comparison, the CFD simulation model can be acknowledged as a validated, calibrated CFD model that follows reality in an accurate way and is available for further development of up- and downdraft ventilation systems, also in a generalized form.
Since the model was similarly adjusted from other wind directions, giving similar accuracy rates, the focus was put on the inside flow field.
3.2. Evaluation of the PACS Efficiency
The pathline diagram (
Figure 16) demonstrates the efficient and comfortable ventilation of the production hall in accordance with the boundary conditions of the validation measurements: during typical working hours, the gates of the north façade were closed and the doors of the towers were 100% open. The PACS is able to ensure 30,646 m
3/h volume flow rate, which means an ACH of 11.98 1/h in the production hall (the total volume contains the tempered air volumes of the three towers also). The PACS can achieve approximately 9.3 times higher ACH than the required value according to the EN 15251 standard of indoor air quality [
42] (because the standard does not concern industrial functions, as mentioned in the introduction, the given values for conference rooms were used, because the occupant density was similar to the ventilated hall). In addition, the air distribution of air is well mixed in the hall, ensuring a homogenous ACH without stagnant zones. The suction effect in the chimneys starts an upward flow, which helps to drive in outdoor air through the façade construction filtration. The air flowing in the chimneys develop large swirls, suggesting that, for the purpose of increasing flow velocity and ventilation efficiency, this tower system has too large cross-section dimensions in relation to the hall’s volume and geometry as well as related to the building’s shape and dimensions. This can be seen as a result of ‘to be mistaken for security’, by oversizing the towers with a safety margin.
At the initial wind direction, we can follow the tower efficiency by monitoring the pressure field at
Figure 17 (bottom) demonstrating decreasing efficiency in this specific wind direction.
Figure 17 (top) shows the decelerating velocities in the chimneys moving from right to left, while the pressure diagram (
Figure 17 bottom) shows that the suction power of the depression zone behind the towers is gradually decreasing, following the wind direction. In this case, when the wind approaches the building parallel to the longitudinal axis of the hall, the towers have a slipstream-effect on each other; therefore, the towers behind each other possess less suction power. Consequently, the ‘ideal’ wind direction means currents perpendicular to the longitudinal axis of the building, i.e., wind direction from N. In this wind direction case, no slipstream situation would evolve, and hence the efficiency would increase, resulting in a better ACH in the production hall.
Figure 18 shows the internal conditions of the production hall. According to the figure on the top, there is no draft inside the hall, to the detriment of the PMV-index and to the benefit of the DR-index according to EN ISO 7730 and EN 15251; only the exhaust air inside the chimney starts to accelerate. There is an efficient wind acceleration effect to observe: the wind velocity of approx. 2.5 m/s is accelerated to approximately 5 m/s between the chimney’s top opening and the ‘Venturi’ disc by developing here a depression zone (
Figure 17 and
Figure 18). Further, the wind strikes perpendicular to the right outer wall of the tower, slows down in vertical direction (from 4.06 to 2.4 m/s) and, as a weakening force, it decelerates the unobstructed higher, horizontal currents. Underneath the ‘Venturi’ plate, below the occurring velocity maximum, there is a small air drop into the chimney, suggesting that the draft booster geometry is far from the chimney opening. The figure at the bottom illustrates that the flow of cooler outside air inside the hall prevents overheating in the comfort zone (indoor space from 0 to approximately 2 m height) due to the heat generated by occupants, artificial lighting, and the equipment. While the air temperature in the comfort zone remains below 26 °C, the overheated area with 26–28 °C is only visible in the red-stained air layer below the ceiling, between 3.0–3.4 m height.
4. Discussion
Through the experimental measurements in the tested industrial building, the functionality of the proposed special-type PACS has been proven. Furthermore, the achieved high ventilation efficiency rate confirms the advantageous aerodynamic approach of the ENERGIA DESIGN® planning method, applying fluid mechanics calculations, wind tunnel tests and CFD modelling to develop working PACS in buildings.
The comparison of CFD simulation showed that experimental measurements revealed almost identical local air temperatures and wind velocities, while flow rates closed up the measured values with acceptable error rates.
Since deviations between measured and calculated data are primarily due to changing wind direction and the consequently delayed wind momentum effects in the measurements, the model can be acknowledged as validated, providing an initial model for new research experiments in the form of case modifications.
Besides quantifying the efficient functionality of the proposed PACS, the results demonstrated specific external and internal airflow characteristics, which revealed the following novel conclusions and development requirements regarding PACS system properties in middle-sized, single-story industry halls under temperate oceanic climate, i.e., in cases of common European SMEs with approximately 500–1000 m2 floor space:
The high-resolution CFD model of the tested building predicted the PACS performance with sufficient accuracy, and thus the aerodynamic planning process could be appropriately supported. Therefore, high-resolution CFD modelling is recommended in order to reliably predict the complex natural airflow phenomena in sustainable building design;
Smaller than planned chimney cross-section dimensions (5.2 × 4.9 m) would hold promise for more economic structure solutions by still maintaining the necessary air exchange rate for daytime ventilation as well as for night-cooling. The narrower chimney cross-sections could decrease the generated up-draught vortexes (lateral distribution of the air currents’ kinetic energy) in the towers, and thus a more efficient wind draw could be achieved. With the help of detailed CFD model support, the building industry standard ‘safety margin over sizing effect’, and therefore investment costs can be reduced significantly;
The deaccelerating effect on the approaching wind velocity, caused by the slowed-down upward flow along the chimney shaft’s vertical wall, could be avoided by designing the tower’s wall in tilted position. An approximately 45° slope shows a promising concept (arithmetic middle between vertical and horizontal surfaces) that needs to be quantified in future CFD experiments. Firstly, in this way, undisturbed circumstances should be created for the entering wind flow into the zone between the ‘Venturi’ disc and the tower’s top outlet opening, to ensure the generation of an appropriate under-pressure zone. Secondly, this solution should further increase the wind velocity due to its ‘nozzle-effect’;
In order to ensure an optimal depression zone (acceleration) development at the chimney’s top outlet, the ‘Venturi’ deflector plate’s position plays a key role in the creation of an efficient draw effect. Arranging the deflector structure closer to the tower’s top outlet opening gives promising indications: it would prevent relapse and increase the ventilation suction effect;
Variations in the shape and size of the ‘Venturi’ disc and the corresponding roof structure/chimney-tower open a new field of wind acceleration and ventilation optimization in PACS. Questions regarding the tilt angle of bottom surface of the ‘Venturi’ structure, height of the chimney above the roof surface, tilt angle of the tower top opening geometry, as well as he dimensions of the top opening chimney gate, must be answered in iterative future CFD investigations;
The intensity of the wind tower vent-operation changes according to their relative position to the building and to each other. It is worth arranging them in correspondence with the general wind-microclimate. To avoid weakening the ventilation capacity of the towers in wind shaded positions, it is recommended that they are not too close to each other in a given wind direction parallel to their straight arrangement axis-line. A more random arrangement is needed, whereas the distance between two towers must be great enough to prevent slipstream effect. Evidently, further CFD model tests are necessary to give precise feedback about the according performance of the diverse tower arrangements. In the current study, the least effective—most often slipstreamed—middle tower could be left out from future design: the two lateral towers provide a sufficient ACH of 8.72 1/h, 6.7-times higher than the regulatory required 1.4 1/h ACH by the EN 15251 standard.
5. Conclusions
In conclusion, the following statements are suitable for a setup of a sufficient PACS of a typical SME: two towers are able to achieve the required air quality level already and their dimensions are acceptable at approximately 5.0 × 4.0 × 17.0 m (width x deepness x height). For a reliable updraft ventilation those should be equipped with ‘Venturi’ deflector structures over the chimneys. The ‘Venturi’ plates should have lateral cantilevers with a deepness of approximately 0.5 times the min. diameter of the chimney. The required area related PACS ratio is 0.10 (10% of the net floor space is required for appropriate NV) and the necessary volumetric PACS ratio is 0.31 (31% of the space volume is required for appropriate NV). The ratio between hall and chimney height is approximately 1:5. Nevertheless, these dimensions can be specified by further studies.
In the future this validated CFD model is suitable to investigate the influencing factors of major geometry changes, arrangement variations and different types of PACS’s operation principles. Valuable results could be exploited about the geometry settings of the towers, such as different heights, cross-section shapes and dimensions, or a vertically varied tower design, for instance. These results would affect the efficiency of a PACS, as well as the architectural appearance of a building. One of the most important parts of a wind tower is the opening at the top, and, in this case, the Venturi shaped deflectors. With different variations in these 3d-deflector objects (geometry, horizontal and vertical positions) a whole generation of Venturi objects could be developed in the future. Thus, an easily applicable system would be created, which can be used in different climatic (unidirectional or omnidirectional towers, depending on the prevailing wind direction), topographic (urban, rural, etc.) or aesthetic (city regulations, customer demands, etc.) situations. A problem of multiple interest was discovered during the study: the number and the horizontal arrangement, as well as the locations of the chimneys related to each other and the buildings, can significantly affect the efficiency of the PACS. The simulation results should be also used for comfort rate validation as well.
The future PACS design guide should be able to help architects in the future choose the right PACS solution for an exact location and function.
Supplementary Materials
The following are available online at
https://www.mdpi.com/1996-1073/13/12/3157/s1, Video S1: Airflow characteristic in the production hall with three updraft ventilation towers, with short velocity pathlines (m/s), Video S2: Airflow characteristic in the production hall with three updraft ventilation towers, with continuous velocity pathlines (m/s).
Author Contributions
Conceptualization, Á.L.K., H.X. and I.K.; Methodology, Á.L.K., H.X., I.K. and I.H.; Software, Á.L.K.; Validation, Á.L.K.; Formal Analysis, I.H.; Investigation, Á.L.K. and I.K.; Resources, I.K.; Data Curation, Á.L.K.; Writing Original Draft Preparation, Á.L.K., I.K. and I.H.; Writing Review & Editing, Á.L.K., H.X., S.E., I.K. and I.H.; Visualization, Á.L.K. and S.E.; Supervision, I.K. and I.H. Project Administration, S.E. and I.K.; Funding Acquisition, H.X., S.E. and I.K. All authors have read and agreed to the published version of the manuscript.
Funding
This research received no external funding.
Acknowledgments
This paper is supported by the National Natural Science Foundation of China (Project number: 51308332).
Conflicts of Interest
The authors declare no conflict of interest.
References
- General Secretariat of the Council Conclusions Adopted by the European Council Meeting. EUCO 169/14 On the 2030 Climate and Energy Policy Framework; European Council: Brussels, Belgiuim, 2014; pp. 1–16. [Google Scholar]
- Hamdy, M.; Hasan, A.; Siren, K. Applying a multi-objective optimization approach for Design of low-emission cost-effective dwellings. Build. Environ. 2011, 46, 109–123. [Google Scholar] [CrossRef]
- Linden, P.F. The fluid mechanics of natural ventilation. Annu. Rev. Fluid Mech. 1999, 31, 201–238. [Google Scholar] [CrossRef]
- Tong, Z.; Chen, Y.; Malkawi, A.; Liu, Z.; Freeman, R.B. Energy saving potential of natural ventilation in China: The impact of ambient air pollution. Appl. Energy 2016, 179, 660–668. [Google Scholar] [CrossRef]
- Chiesa, G.; Grosso, M.; Pearlmutter, D.; Ray, S. Advances in adaptive comfort modelling and passive/hybrid cooling of buildings. Energy Build. 2017, 148, 211–217. [Google Scholar] [CrossRef]
- Ray, S.D.; Gong, N.W.; Glicksman, L.R.; Paradiso, J.A. Experimental characterization of full-scale naturally ventilated atrium and validation of CFD simulations. Energy Build. 2014, 69, 285–291. [Google Scholar] [CrossRef]
- Holford, J.M.; Hunt, G.R. Fundamental atrium design for natural ventilation. Build. Environ. 2003, 38, 409–426. [Google Scholar] [CrossRef]
- Hughes, B.R.; Mak, C.M. A study of wind and buoyancy driven flows through commercial wind towers. Energy Build. 2011, 43, 1784–1791. [Google Scholar] [CrossRef]
- Li, Y.; Heiselberg, P. Analysis Methods for Natural and Hybrid Ventilation—A Critical Literature Review and Recent Developments. Int. J. Vent. 2003, 1, 3–20. [Google Scholar] [CrossRef]
- Liddament, M.; Axley, J.; Heiselberg, P.; Li, Y.; Stathopoulos, T. Achieving natural and hybrid ventilation in practice. Int. J. Vent. 2006, 5, 115–130. [Google Scholar] [CrossRef]
- Khan, N.; Su, Y.; Riffat, S.B. A review on wind driven ventilation techniques. Energy Build. 2008, 40, 1586–1604. [Google Scholar] [CrossRef]
- Mora-Pérez, M.; López-Patiño, G.; Amparo López-Jiménez, P. Quantification of Ventilated Façade Effect Due to Convection in Buildings Buoyancy and Wind Driven Effect. Res. Appl. Mech. Eng. 2014, 3, 1–11. [Google Scholar]
- Bunkholt, N.S.; Säwén, T.; Stockhaus, M.; Kvande, T.; Gullbrekken, L.; Wahlgren, P.; Lohne, J. Experimental study of thermal buoyancy in the cavity of ventilated roofs. Buildings 2020, 10, 8. [Google Scholar] [CrossRef]
- Chen, Q. Ventilation performance prediction for buildings: A method overview and recent applications. Build. Environ. 2009, 44, 848–858. [Google Scholar] [CrossRef]
- Kuznik, F.; Rusaouën, G.; Brau, J. Experimental and numerical study of a full scale ventilated enclosure: Comparison of four two equations closure turbulence models. Build. Environ. 2007, 42, 1043–1053. [Google Scholar] [CrossRef]
- Tapsoba, M.; Moureh, J.; Flick, D. Airflow patterns inside slotted obstacles in a ventilated enclosure. Comput. Fluids 2007, 36, 935–948. [Google Scholar] [CrossRef]
- Rohdin, P.; Moshfegh, B. Numerical predictions of indoor climate in large industrial premises. A comparison between different k-ε models supported by field measurements. Build. Environ. 2007, 42, 3872–3882. [Google Scholar] [CrossRef]
- Zhao, L.; Wang, X.; Zhang, Y.; Riskowski, G.L. Analysis of airflow in a full-scale room with non-isothermal jet ventilation using PTV techniques. ASHRAE Trans. 2007, 113, 414–425. [Google Scholar]
- Kristóf, G.; Papp, B. Application of GPU-based large eddy simulation in urban dispersion studies. Atmosphere 2018, 9, 442. [Google Scholar] [CrossRef]
- Awbi, H.B. Air movement in naturally ventilated buildings. In Proceedings of the World Renewable Energy Congress, Denver, CO, USA, 15–21 June 1996; Volume 26, pp. 551–556. [Google Scholar]
- Chen, Q.; Zhai, Z. The use of Computational Fluid Dynamics tools for indoor environmental design. In Advanced Building Simulation; Malkawi, A.M., Augenbroe, G., Eds.; Spon Press: London, UK, 2003; pp. 119–140. ISBN 0203073673. [Google Scholar]
- Tominaga, Y.; Mochida, A.; Yoshie, R.; Kataoka, H.; Nozu, T.; Yoshikawa, M.; Shirasawa, T. AIJ guidelines for practical applications of CFD to pedestrian wind environment around buildings. J. Wind Eng. Ind. Aerodyn. 2008, 96, 1749–1761. [Google Scholar] [CrossRef]
- Norris, S.E.; Richards, P. Appropriate boundary conditions for computational wind engineering models using the k-ε turbulence model. In Proceedings of the Fifth International Symposium on Computational Wind Engineering, Chapel Hill, NC, USA, 23–27 May 2010; Volume 46–47, pp. 145–153. [Google Scholar]
- Hajdukiewicz, M.; Geron, M.; Keane, M.M. Calibrated CFD simulation to evaluate thermal comfort in a highly-glazed naturally ventilated room. Build. Environ. 2013, 70, 73–89. [Google Scholar] [CrossRef]
- Hajdukiewicz, M.; Geron, M.; Keane, M.M. Formal calibration methodology for CFD models of naturally ventilated indoor environments. Build. Environ. 2013, 59, 290–302. [Google Scholar] [CrossRef]
- Elmualim, A.A. Effect of damper and heat source on wind catcher natural ventilation performance. Energy Build. 2006, 38, 939–948. [Google Scholar] [CrossRef]
- Eteghad, A.N.; Guardiola, E.U.; Raviz, S.R.H.; Aira, A.A. Reinterpretation of Energy Efficiency in Thomas Herzog’s Architecture. J. Eng. Archit. 2014, 2. [Google Scholar] [CrossRef]
- Paevere, P.; Brown, S. Indoor Environment Quality and Occupant Productivity in the CH2 Building: Post-Occupancy Summary. In Proceedings of the 2008 World Conference on Sustainable Building, Melbourne, Australia, 21–25 September 2008. [Google Scholar]
- Wu, Y.C.; Yang, A.S.; Tseng, L.Y.; Liu, C.L. Myth of ecological architecture designs: Comparison between design concept and computational analysis results of natural-ventilation for Tjibaou Cultural Center in New Caledonia. Energy Build. 2011, 43, 2788–2797. [Google Scholar] [CrossRef]
- Kato, S.; Murakami, S.; Takahashi, T.; Gyobu, T. Chained analysis of wind tunnel test and CFD on cross ventilation of large-scale market building. J. Wind Eng. Ind. Aerodyn. 1997, 68, 573–587. [Google Scholar] [CrossRef]
- Feifer, L.; Imperadori, M.; Salvalai, G.; Brambilla, A.; Brunone, F. Relevant Case Studies: A Benchmark for Future Design. In Active House: Smart Nearly Zero Energy Buildings; Springer: Berlin/Heidelberg, Germany, 2018; pp. 101–138. ISBN 9783319908144. [Google Scholar]
- Bencsik, G.; Háber, I.E.; Farkas, I. Preparing climate data and city model for computational fluid dynamics simulation. In Proceedings of the 24th Workshop on Energy and Environment (EE)—Book of Abstracts, Gödöllő, Hungary, 6–7 December 2018; p. 18. [Google Scholar]
- Beck, H.E.; Zimmermann, N.E.; McVicar, T.R.; Vergopolan, N.; Berg, A.; Wood, E.F. Present and future Köppen-Geiger climate classification maps at 1-km resolution. Sci. Data 2018, 5, 1–12. [Google Scholar] [CrossRef]
- Kistelegdi, I.; Radha, C.H.; Balint, B. Decision-making Tool for Energy and Thermal Comfort Optimization in Residential Building Refurbishment Using Passive Strategies. ZANCO J. Pure Appl. Sci. 2019, 31. [Google Scholar] [CrossRef]
- Habtay, G.; Farkas, I.; Control, P. Mathematical Modelling of a cylindrical chimney effect in solar dryer. Hung. Agric. Eng. 2019, 36, 69–74. [Google Scholar] [CrossRef]
- Calautit, J.K.; Hughes, B.R.; O’Connor, D.; Shahzad, S.S. Numerical and experimental analysis of a multi-directional wind tower integrated with vertically-arranged heat transfer devices (VHTD). Appl. Energy 2016, 185, 1120–1135. [Google Scholar] [CrossRef]
- Bechert, D.W.; Bruse, M.; Hage, W.; Meyer, R. Fluid mechanics of biological surfaces and their technological application. Naturwissenschaften 2000, 87, 157–171. [Google Scholar] [CrossRef]
- Kistelegdi, I.; Baranyai, B. Windkanaluntersuchungen zwecks Quantifizierung und Validierung der Wirkung von Windinduktion und thermischen Auftriebskräften auf die natürliche Lüftung eines industriellen Innovationszentrums. Bauphysik 2012, 34, 229–237. [Google Scholar] [CrossRef]
- Zsiborács, H.; Baranyai, N.H.; Vincze, A.; Zentkó, L.; Birkner, Z.; Máté, K.; Pintér, G. Intermittent renewable energy sources: The role of energy storage in the European power system of 2040. Electronics 2019, 8. [Google Scholar] [CrossRef]
- Mikeska, T.; Fan, J.; Svendsen, S. Full scale measurements and CFD investigations of a wall radiant cooling system integrated in thin concrete walls. Energy Build. 2017, 139, 242–253. [Google Scholar] [CrossRef]
- Yuan, C.S. The effect of building shape modification on wind pressure differences for cross-ventilation of a low-rise building. Int. J. Vent. 2007, 6, 167–176. [Google Scholar] [CrossRef]
- EN 15251—Indoor Environmental Input Parameters for Design and Assessment of Energy Performance of Buildings Addressing Indoor Air Quality, Thermal Environment, Lighting and Acoustics; European Union: Brussels, Belgium, 2006; pp. 1–51.
Figure 1.
(a) Experimental reference industry and office building (RATI Ltd.) with passive ventilation towers and wind accelerator ‘Venturi’ deflectors; (b) production hall with adjacent ventilation chimney opening.
Figure 1.
(a) Experimental reference industry and office building (RATI Ltd.) with passive ventilation towers and wind accelerator ‘Venturi’ deflectors; (b) production hall with adjacent ventilation chimney opening.
Figure 2.
The passive air conduction system (PACS) concept of the prototype building.
Figure 2.
The passive air conduction system (PACS) concept of the prototype building.
Figure 3.
The passive air conduction system (PACS) in the implemented building. (a) Steel–glass–polycarbonate tower with bottom opening above the production hall; (b) central atrium penetrated by a tower; (c) upper tower opening with 60% intensity.
Figure 3.
The passive air conduction system (PACS) in the implemented building. (a) Steel–glass–polycarbonate tower with bottom opening above the production hall; (b) central atrium penetrated by a tower; (c) upper tower opening with 60% intensity.
Figure 4.
Software interface screen of the MMS monitoring system. Air temperature and relative humidity at different heights of the towers, airflow velocity at 3.5 and 17.0 m height of the towers, airflow velocity in the production hall and at façade gates.
Figure 4.
Software interface screen of the MMS monitoring system. Air temperature and relative humidity at different heights of the towers, airflow velocity at 3.5 and 17.0 m height of the towers, airflow velocity in the production hall and at façade gates.
Figure 5.
Installed position of Vaisala XT520 meteorological weather station on the west ventilation tower.
Figure 5.
Installed position of Vaisala XT520 meteorological weather station on the west ventilation tower.
Figure 6.
Location of measurements of infiltration volume flows and temperatures through the envelope openings and perimeter in the production hall.
Figure 6.
Location of measurements of infiltration volume flows and temperatures through the envelope openings and perimeter in the production hall.
Figure 7.
Location of air flow rates’ and temperatures’ measurements trough air duct inlets.
Figure 7.
Location of air flow rates’ and temperatures’ measurements trough air duct inlets.
Figure 8.
Internal heat gains from occupants, equipment and artificial lighting in the production hall.
Figure 8.
Internal heat gains from occupants, equipment and artificial lighting in the production hall.
Figure 9.
The volume mesh section from far view (top) and close view (bottom).
Figure 9.
The volume mesh section from far view (top) and close view (bottom).
Figure 10.
Wind speed frequency (%) with accruing wind directions and velocities in yearly resolution showed by segments and during the validation measurement hours showed by dots (m/s).
Figure 10.
Wind speed frequency (%) with accruing wind directions and velocities in yearly resolution showed by segments and during the validation measurement hours showed by dots (m/s).
Figure 11.
Air flow field in the CFD simulation model, velocity contours and vectors (m/s).
Figure 11.
Air flow field in the CFD simulation model, velocity contours and vectors (m/s).
Figure 12.
Measured and simulated wind velocity (left) and air temperature (right) comparison in the three ventilation towers.
Figure 12.
Measured and simulated wind velocity (left) and air temperature (right) comparison in the three ventilation towers.
Figure 13.
Manual measurement results in 25 sampling points per each tower about air velocity in the bottom inlets in 3 m height.
Figure 13.
Manual measurement results in 25 sampling points per each tower about air velocity in the bottom inlets in 3 m height.
Figure 14.
Comparison of hand measurement results in 25 sampling points per each tower (mean value) and MMS automated anemometer measurement of 1 sampling point about air velocity in the towers’ bottom inlets.
Figure 14.
Comparison of hand measurement results in 25 sampling points per each tower (mean value) and MMS automated anemometer measurement of 1 sampling point about air velocity in the towers’ bottom inlets.
Figure 15.
Measured and simulated air volume flow comparison in the three ventilation towers.
Figure 15.
Measured and simulated air volume flow comparison in the three ventilation towers.
Figure 16.
Airflow characteristic in the production hall with three updraft ventilation towers, velocity pathlines (m/s)—validated CFD model of the implemented Hungarian reference building (
Supplementary Materials).
Figure 16.
Airflow characteristic in the production hall with three updraft ventilation towers, velocity pathlines (m/s)—validated CFD model of the implemented Hungarian reference building (
Supplementary Materials).
Figure 17.
Longitudinal section through the hall with flow velocities (top) and pressure field at the ‘Venturi’ plates (bottom).
Figure 17.
Longitudinal section through the hall with flow velocities (top) and pressure field at the ‘Venturi’ plates (bottom).
Figure 18.
Cross section through the hall with velocity contours and vectors (top); air temperature distribution (bottom).
Figure 18.
Cross section through the hall with velocity contours and vectors (top); air temperature distribution (bottom).
Table 1.
Measured infiltration volume flows and temperatures through the envelope openings and perimeter in the production hall.
Table 1.
Measured infiltration volume flows and temperatures through the envelope openings and perimeter in the production hall.
| Measured Point | Filtration/Airflow Via | Airflow [m3/h] | Air Temperature [°C] | Direction of Airflow | Total Airflow [m3/h] |
|---|
| 1. | N wall | 148 | 27.7 | IN | 24,088 |
| 2. | NW gate | 3430 | 26.5 | IN |
| 3. | N wall | 140 | 25.9 | IN |
| 4. | Central-N gate | 3110 | 26.3 | IN |
| 5. | N wall | 372 | 25.1 | IN |
| 6. | NE gate | 4170 | 26.3 | IN |
| 7. | N wall | 236 | 26.7 | IN |
| 8. | E staircase door | 300 | 26.3 | IN |
| 9. | E office door | 407 | 25.8 | IN |
| 10. | Autom. SE gate | 5120 | 25.7 | IN |
| 11. | Man. S gate | 934 | 24.9 | IN |
| 12. | Man. S gate | 746 | 25.6 | IN |
| 13. | Man. S gate | 1308 | 25.4 | IN |
| 14. | Man. S gate | 854 | 25.1 | IN |
| 15. | Autom. SW gate | 2136 | 24.8 | IN |
| 16. | W staircase door | 540 | 25.4 | IN |
| 17. | W office door | 120 | 25.4 | IN |
| 18. | W workshop door | 17 | 25.9 | IN |
| 19. | W wind tower | 8029 | 26.5 | OUT | 24,088 |
| 20. | Central wind tower | 7557 | 26.6 | OUT |
| 21. | E wind tower | 8502 | 26.9 | OUT |
Table 2.
Measured air flow rates and temperatures trough air duct inlets.
Table 2.
Measured air flow rates and temperatures trough air duct inlets.
| Passively Induced Air Flow From | No. | Air Flow [m3/h] | Air Temperature [°C] | Direction of Air Flow |
|---|
| Fresh Air through Air Supply | East part of air duct | 1. | 5.76 | 31.63 | IN |
| 2. | 3.96 | 25.1 | IN |
| West part of air duct | 3. | 11.76 | 24.88 | IN |
| 4. | 7.8 | 25.23 | IN |
| 5. | 1.32 | 26.07 | IN |
| 6. | 1.44 | 27.63 | IN |
| 7. | 5.04 | 25.88 | IN |
| Air duct from wind tower—west | 13. | 55.5 | 24.2 | IN |
| Air duct from wind tower—central | 14. | 24.5 | 25.78 | IN |
| Air duct from wind tower—east | 15. | 132.5 | 26.21 | IN |
| Air Extraction From Technology | Tech. extraction—North | 8. | 37.26 | 35.83 | OUT |
| 9. | 12.96 | 32.73 | OUT |
| 10. | 6.48 | 32.73 | OUT |
| Tech. extraction—South | 11. | 41.58 | 30.93 | OUT |
| Glue machine extraction | 12. | 4.52 | 28.05 | OUT |
Table 3.
Internal heat gains from occupants, equipment and artificial lighting (W) in the production hall.
Table 3.
Internal heat gains from occupants, equipment and artificial lighting (W) in the production hall.
| Heat Sources [W] |
|---|
| No. | Name | Technology 1 | Lighting 1 |
| 1. | Vacuum machine | not operating 2 | - |
| 2. | Vacuum machine | 4400 | - |
| 3. | Vacuum machine | not operating | - |
| 4. | Vacuum machine | 2100 | - |
| 5. | Vacuum machine | not operating | - |
| 6. | Disk-type milling cutter | not operating | - |
| 7. | CNC machine | 1980 | - |
| 8. | CNC machine | not operating | - |
| 9. | CNC machine | not operating | - |
| 10. | Table (equipment) | 4 × 40 | 6 × 46 |
| 11. | Table (equipment) | 6 × 58 | 6 × 36 |
| 12. | Table (equipment) | 6 × 58 | 6 × 36 |
| 13. | Table (equipment) | 4 × 58 | 4 × 36 |
| 14. | Table (equipment) | 4 × 58 | 4 × 36 |
| 15. | Table (equipment) | 38 | 2 × 20 |
| 16. | Table (equipment) | 2 × 38 | 2 × 36 |
| 17. | Table (equipment) | 2 × 38 | 2 × 36 |
| 18. | Sitting occupants | 8 × 150 | - |
| 19. | Standing/walking occupants | 8 × 200 | - |
| 20. | Hall lighting | - | 102 × 35 |
© 2020 by the authors. Licensee MDPI, Basel, Switzerland. This article is an open access article distributed under the terms and conditions of the Creative Commons Attribution (CC BY) license (http://creativecommons.org/licenses/by/4.0/).

 ,
, 


