Abstract
The focus of this study is to provide a comparative techno-economic analysis concerning the deployment of small-scale gasification systems in dealing with various fuels from two countries, Portugal and Brazil, for electricity generation in a 15 kWe downdraft gasifier. To quantify this, a mathematical model was implemented and validated against experimental runs gathered from the downdraft reactor. Further, a spreadsheet economic model was developed combining the net present value (NPV), internal rate of return (IRR) and the payback period (PBP) over the project’s lifetime set to 25 years. Cost factors included expenses related to electricity generation, initial investment, operation and maintenance and fuel costs. Revenues were estimated from the electricity sales to the grid. A Monte Carlo sensitivity analysis was used to measure the performance of the economic model and determine the investment risk. The analysis showed an electricity production between 11.6 to 15 kW, with a general system efficiency of approximately 13.5%. The viability of the projects was predicted for an NPV set between 18.99 to 31.65 k€, an IRR between 16.88 to 20.09% and a PBP between 8.67 to 12.61 years. The risk assessment yielded favorable investment projections with greater risk of investment loss in the NPV and the lowest for IRR. Despite the feasibility of the project, the economic performance proved to be highly reliant on the electricity sales prices subdue of energy market uncertainties. Also, regardless of the broad benefits delivered by these systems, their viability is still strikingly influenced by governmental decisions, subsidiary support and favorable electricity sales prices. Overall, this study highlights the empowering effect of small-scale gasification systems settled in decentralized communities for electric power generation.
1. Introduction
The shortage and unpredictability of conventional energy sources affected by depletion and global geopolitical issues are causing an energy crisis that is accelerating the renewable energy use [1,2]. In Portugal, 28.6% of the consumed energy derives from renewable energy sources (RES), with wind accounting for 7.2%, hydroelectric 7.4%, solar 1.0%, geothermal 0.1%, and, the most preeminent, bioenergy, representing 12.9% of the total [3]. As for Brazil, the power generation from RES reaches 43.2%, out of which hydroelectric represents 11.9%, bioenergy 25.4% and other renewables combined (solar, wind and geothermal) 5.9% [4]. In both countries, the power generation from RES is above the world average, which is approximately 13.5% [5]. However, these RES may not always be available when required. Biomass products, if properly managed, can be collected and used to produce energy regardless of environmental conditions. The exploration for energy purposes of different biomass or their mixtures could increase the generation of energy and contribute to reducing fossil fuels consumption [6].
One interesting route to convert biomass and solid waste into energy is through gasification systems. When compared to other technologies such as combustion, gasification provides enhanced efficiency and environmental performance, meeting the ever-increasing environmental restrictions imposed by governments and international agencies [6]. Gasification can be best defined as the conversion of biomass and/or solid waste to syngas by oxidation of the feedstock under fuel-rich combustion conditions [7].
Syngas’ properties allow it to be burned in standard spark-ignition (SI) and compression ignition (CI) engines, however, the lower energy density from the syngas/air mixture reduces maximum brake power significantly [8]. A promising syngas application is its use in internal combustion engines-generator (ICEG) [9]. The use of such engines presents several advantages over turbines and steam generators such as bearing a wide range of power ratings, being capable of running on different fuels, and also the strong know-how concerning its system management and maintenance [9].
The replacement of diesel fuel with syngas is highly beneficial for soot emissions (due in part to the combined effects of soot formation and oxidation rates inside the cylinder when syngas is present) and also the power rating of an engine running on syngas/diesel is less affected than in an engine running on syngas/gasoline, arising high expectations concerning its use [10,11].
Particle and tar concentration in the syngas must be less than 50 mg/Nm3 and 100 mg/Nm3, respectively, for the satisfactory operation of an ICEG [12]. Under these circumstances, choosing to operate with a downdraft gasifier seems to be the most fitting solution among available gasification technologies [9]. This is due to its inherent low particulate and tar content rate which relates to the internal design of these systems as the tar produced throughout the pyrolysis stage gets thermally converted into gas during the combustion stage of the gasification process [9].
Several studies have been reported on power generation plants based on downdraft gasification and ICEG. Mancebo et al. [13], presented an analysis of a cogeneration plant composed of a downdraft gasifier coupled to an ICEG with a capacity of 15 kWe, using eucalyptus biomass as fuel. The authors declared an electricity generation efficiency of 12.5% regarding a biomass consumption of 10 kg/h.
Dasappa et al. [14] reported the experimental operation of a 100 kWe gasification power plant using wood as feedstock. Here, a downdraft reactor was employed with the capacity to process 110 kg/h of woody biomass. The specific biomass consumption was 1.36 kg/kWh and the electricity generation efficiency of 18%.
Lee et al. [15] performed an experimental evaluation of four biomasses in a generation system consisting of a downdraft gasifier and an SI engine for electric power generation. Results showed that the general efficiency of the system varied from 15.8 to 23.0% depending on the biomass used, and the electric power produced varied between 10.1 and 13.1 kWe.
Elsner et al. [16] presented a downdraft gasification system coupled with an ICEG and a waste heat recovery system for the gasification of waste sludge. Results indicated that due to the low LHV of the syngas, it is recommended to mix wood pellets with sewage sludge (40/60%). Economic results also showed that due to current energy market conditions, it is more appropriate to use the generated heat and electricity for self-consumption.
Although downdraft gasification technology is well known and studied, more experimental studies are still required due to the variability in biomass composition. Experimental tests can be expensive; therefore, numerical methods such as computational fluid dynamics (CFD) emerge as a very powerful and useful tool. The literature provides several works concerning the use of CFD approaches to model gasification process [8,17]. Silva et al. [18], developed a multiphase CFD model able to predict the syngas composition over different operating conditions, gasifying agents and feedstocks using a pilot-scale gasifier. Results showed that syngas properties can be tailored depending on the selected feedstock and operating conditions, and that syngas production can be controlled to minimize composition oscillations using adequate statistical strategies.
Table 1 summarizes a set of results from experimental studies related to the generation of electricity from downdraft gasification with different biomasses.

Table 1.
Various experimental studies on electricity generation using downdraft gasification.
To the best of our knowledge, there are very few works concerning the numerical simulation of energy generation systems integrating downdraft gasifier with ICEG. As a matter of fact, studies related to combined systems may be found in the literature, yet these fail to provide a thorough analysis concerning the system efficiency or even the most appropriate syngas composition to feed said system. Thus, studies devoted to gasification-ICEG integrated systems are of utmost importance for the successful implementation of this technology, promoting it as an auspicious and realistic solution with applications in solid waste treatment and electrification while contributing to fossil fuels consumption reduction. Finally, and as one of the main focal points of this work, these systems are deemed as especially attractive for decentralized small-scale (≤1 MW) electricity generation in rural and/or remote communities, particularly in developing countries, bearing alternative electric power solutions to communities where connection to the central grid is economically unfeasible. In fact, these units provide a window of opportunity for achieving global access to electricity being rapidly scalable, environmentally sustainable and tailor-made to local conditions, suiting as key for unlocking a sustainable future while uplifting the local economy in these locations. Moreover, biomass exploration provides a helping hand towards wildfire hazards reduction by promoting forest biomass harvesting and cleaning in over-grown areas [16,25].
In this sense, the purpose of this work is to present a CFD simulation obtaining the syngas from a 15 kWe downdraft gasification system in dealing with four different fuels, including biomass and municipal solid waste (MSW), from two countries, Portugal and Brazil, and then feed it into an ICEG. The simulation results are directly compared and validated against experimental data. A techno-economic evaluation coupled with a Monte Carlo sensitivity analysis is performed to assess the feasibility of the units from an economic standpoint. Finally, the influence of biomass characteristics on the composition of the syngas and the efficiency of the cold gas is studied.
2. Experimental System Description
2.1. Downdraft Gasifier Description
The experimental gasification runs were performed using a Power Pallet 15 kWe gasifier from All Power Labs (Berkeley, CA, USA), which is a combination of an Imbert style downdraft fixed bed reactor with an electric power generator and an electronic control unit. A schematic of the unit is depicted in Figure 1a. The downdraft gasifier (Figure 1b) is composed of a biomass storage hopper, which is simultaneously designed to dry the feedstock through the recirculation of the hot gases produced within the reactor. The biomass is supplied from the top while the air moves downwards, being preheated through contact with the walls of the reactor. Ash collection is carried out in a separate tank at the bottom of the reactor, while the produced syngas passes through a cyclone to remove fine particles. The gas is conducted to the biomass hopper for drying and further filtration. Subsequently, one may collect the gas for analysis or directly inject it into the generator. The condensates resulting from the process are collected in a filter [26].
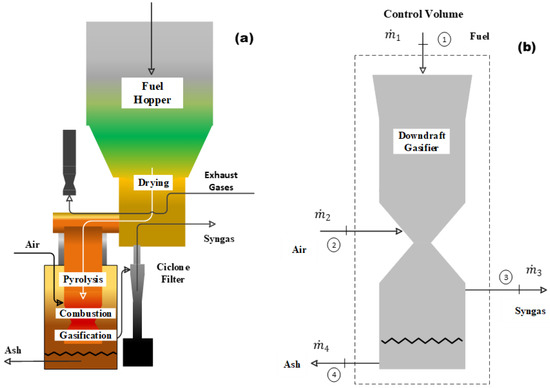
Figure 1.
(a) Physical diagram of the system, and (b) control volume of the downdraft gasifier.
The reactor vessel is cylindrically shaped, with an internal diameter of 28 cm and a height of 55 cm. Inside, a reduction cone tapers to 20 cm and the heart cone tapers to 7 cm so to increase solid residence time in the pyrolysis and combustion zones. The gasifier narrows below the flame zone to restrict the tar content in the syngas by forcing the volatiles to pass through the combustion zone. In the reduction zone, the diameter expands to 19 cm, followed by 23 cm and 38 cm, respectively. Syngas exits through a 21 cm equivalent diameter outlet. The biomass processing capacity is 22 kg/h, producing 60 m3/h of syngas [27].
2.2. Compact Generation System
The generation system is composed of an ICEG and an electricity generator. The main characteristics of the generation system are shown in Table 2 [27].
Table 2.
Main characteristics of the generation system.
The system depicted in Figure 2 is composed of an engine model GM Vortec 3.0 L I-4, coupled to a generator, model NPE 32 (Mecc Alte, Dry Creek, Australia) capable of producing 20 kW of electric power [27].
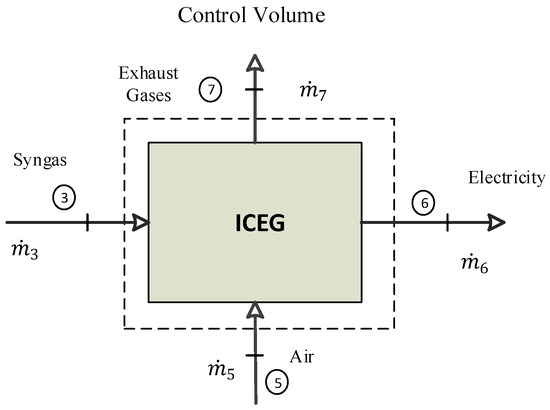
Figure 2.
Control volume of the power generation system.
3. Computational Model Set up
3.1. Fuel Characteristics
As the accuracy of the mathematical model relies upon the use of realistic data, biomass and MSW characterization from both Portugal and Brazil were gathered from experimental studies developed by Couto et al. [28], Sales et al. [29] and Luz et al. [20]. Table 3 shows the elemental and proximal analysis for the studied biomasses and MSW from both countries. Throughout this work, MSW * and MSW ** will be used to address MSW coming from Portugal and Brazil, respectively.
Table 3.
Chemical composition of the used fuels.
To determine the syngas composition a mathematical model was built gathering the experimental data obtained from the downdraft gasifier. From the model results, the H2, CO, CH4, and CO2 concentrations were obtained and the LHV of the syngas was calculated using Equation (1) [29]:
3.2. Mathematical Model
The computational geometry domain refers to a 2-D downdraft reactor with an internal diameter of 28 cm and a height of 55 cm. The initial ignition of the reactor was carried out with charcoal and then the biomass pellets were introduced, sizing 0.5 cm thick, 1 to 2 cm wide and 2 to 2.5 cm long. The obtained syngas travels between the internal and external walls of the gasifier before entering the cyclone filter to remove particles and then through the full-packed bed filter to eliminate tars. Simulations were performed using a time step size of 0.001 s, for a total number of 50,000 time steps (50 s).
The implemented 2-D Eulerian-Eulerian mathematical model was firstly developed by Silva et al. [30]. Complex phenomena regarding the gasification process for the downdraft reactor were simulated by means of a multiphase (gas and solid) model within the ANSYS Fluent database. The gas-phase was considered as a continuum and solid phase was modeled following a Eulerian granular model. Interactions between phases were modeled as well, with both phases exchanging heat by convection, momentum (due to drag between phases), and mass (given the heterogeneous chemical reactions). To appropriately describe the hydrodynamic phenomena within the fluidized bed reactor the standard k-ε turbulence model is applied. The heat transfer between the solid and gas phases, the viscous dissipation, and the expansion work is described by the energy conservation equation. Table 4 summarizes the main governing equations for both gas and solid phase and the hydrodynamic model. The energy conservation equation describes the heat exchange between gas and solid phases, the viscous dissipation, and the expansion work of the void fraction. The equation for the gas and solid phases is shown in Table 4, in which is the heat transfer intensity, the specific enthalpy of phase, the heat flux, the source term and the enthalpy of the interface. For the mass balance model the gas and solid phases continuity equations are provided, the is the volume fraction, density, velocity and is defined as the source term (Table 4). The momentum equations for both phases consider the gas stress tensor , gravity , the gas-solid interface drag coefficient , and the solid mean velocity (Table 4). The granular Eulerian model treats the continuous fluid (primary phase) as well as dispersed solids (secondary phase) as interpenetrating continua. Stresses in the granular solid phase are obtained by analogy between the random particles motion and the thermal motion of molecules within a gas accounting for the inelasticity of solid particles. The kinetic energy associated with velocity fluctuations is described by granular temperature which is proportional to the norm of particle velocity fluctuations. In the conservation equation for the granular temperature the is the collisional dissipation rate of granular energy, the diffusive flux of granular energy, the granular energy exchange between the gas and solid phase, and is the diffusion coefficient (Table 4). Since the present model has already been extensively documented in recent literature published by the research group, only key points will be highlighted. Further details on the model can be found elsewhere [30].
Table 4.
Conservation equations and hydrodynamic model for both gas and solid phases.
3.3. Chemical Reactions Model
In the chemical reaction model, the kinetic/diffusion surface reaction model portrays the heterogeneous reactions, and the finite-rate/eddy-dissipation model is used to describe the homogeneous gas-phase reactions. The gasification of biomass and MSW involves several fundamental processes. First, volatile components, such as light gases and tar are released by pyrolysis. These species undergo homogeneous gas-phase reactions forming CO, CO2, H2 and H2O which then combust and gasify the char. Table 5 provides the devolatilization model, main chemical reactions and reaction rates coefficients (based on the Arrhenius law) in the chemical model. Additional information regarding the model can be found elsewhere [30].
Table 5.
Implemented chemical reactions model.
This model weights the effect of the Arrhenius rate and the diffusion rate of the oxidant at the surface particle. The diffusion rate coefficient is defined as follows:
The final reaction rate is defined by:
4. Energy Analysis
In order to analyze the production of electricity from the selected substrates and to evaluate the efficiency of the process, an energy balance was developed to describe the gasification system in conjunction with the ICEG. Based on the principle of conservation of energy, the first law of thermodynamics, the energy balance can be written in a general form as follows:
To simplify the analysis, a series of assumptions were followed. In the system described, the energy balance can be written as:
where is the heat rate, the work rate and h the specific enthalpy. At this point, the gasification system and the ICEG will be evaluated separately. For the gasification system, the energy balance is described in the following equations:
The fuel’s energy input can be calculated as:
where LHV is the lower heating value and is the mass flow rate for fuel (biomass and MSW). As long as there is no condensation occurring the power of the supplied air can be given by:
where is the mass fraction and the specific heat of a component, represents the preheat gas temperature and ambient temperature, respectively. To calculate the energy associated with the syngas () and tar (), the following equations are used:
To calculate the energy efficiency of the cold gas, the useful output energy is divided between the energy from the input to the system, as follows:
The energy balance for the ICEG is configured as follows. The energy of the syngas that enters the ICEG is calculated by the Equation (12), shown below. The complete combustion of syngas depends on chemical composition. The general equation for the complete combustion of syngas with the theoretical amount of air required is given by:
The values of the unknown coefficients a, b, c, d, and e, in the above equation, can be determined by applying the principle of conservation of mass to each element that constitutes the syngas [8].
The total heat loss in the ICEG is calculated by:
The thermal efficiency of the ICEG is generally determined as the ratio of the power output between the incoming fuel energy, as given by:
The overall system efficiency is determined by:
5. Techno-Economic Analysis
Methodology
The economic analysis of biomass gasification is important and necessary to determine the cost of energy production and ensure the viability of the project. As an effort to bring this analysis closer to a real application scenario the present study was built based on literature review related with gasification investment projects [20,25]. The proposed 15 kW downdraft gasifying units coupled with an ICEG are set for deployment within a Portuguese and Brazilian decentralized community settled in a rural scheme. The small-scale units are set to be lodged within the community located near forest and agriculture landing for higher biomass availability with impact on transport costs and profitability of the supply operation. In Portugal, acacia is an invasive plant and estimates say that it occupies an area of approximately 43 thousand hectares, whereas in Brazil eucalyptus plantations reach around 7 million hectares [31,32]. An MSW supply chain is also considered arriving from surrounding urban areas and from the community itself. This supply chain profits from the already existing solid residues collection network to the urban areas and local communities. In Portugal, the average production rate of MSW is 1.32 kg per capita per day, making approximately 13.58 thousand tons of MSW per day, while in Brazil the average generation of MSW per capita is 1.15 kg of MSW per capita per day, approximately 234 thousand tons of MSW per day [20,33]. A near existing power line is assumed to connect the unit to the grid. The unit operation is assumed to be monitored by local workers already performing other tasks within the community, thus neither units require fully dedicated labor allowing to save on employees’ costs [34]. For the economic evaluation, the main input financial data regulated in each country, Portugal and Brazil, such as input, capital and operating costs, alongside other key financial assumptions are provided in Table 6. For uniformity purposes, all costs were converted to euros (€).
Table 6.
Main economic assumptions for the Portuguese and Brazilian proposed systems.
The analysis of costs and income of cash flow before taxes (CFBT) considers, an initial investment period related to the phase of acquisition and assembly of the gasification system, as well as, the period of debt amortization and the costs related to the operation and maintenance (O & M). Revenues incur in electricity sales to the national grid. CFBT is calculated by balancing revenues and expenses while further applying the discount rate, as shown in Equation (16) [40]:
Cash flows after taxes (CFAT), is one of the most useful liquidity measures to assess the financial health of a company since it considers the effect of the tax burden on the obtained profits. It also allows calculating the economic viability of the future investment while measuring the profitability or growth of an investment. CFAT is determined by the following equation, which relates CFBT minus taxation (Tax) [41]:
where, TXI represent the taxable income, TXR is the tax rate, Inv. is the initial investment, and DEP the depreciation, which is the amount that tax authorities allow to deduct from taxes. The depreciation of assets varies considerably from one country to another, in Portugal, a rate of 8.3% is considered for power generation companies [42], while in Brazil this rate is 10% [43].
In the case of Portugal, the calculation of taxes on profits and the fiscal incentives granted by the government for certain regions in the interior of the country were considered, coinciding with the area foreseen for the installation of this type of technology. Therefore, for the Portuguese scenario, a reduced tax rate of 15% was considered. As for Brazil, the tax burden is one of the highest in the world, over 32% [44], still, companies that generate energy from renewable sources (biomass included) benefit from a series of government tax incentives that reduce these charges up to 17% [39].
Cash flows after taxes along the project lifetime are applied to a spreadsheet-based economic model developed to calculate the net present value (NPV), internal rate of return (IRR) and the payback period (PBP).
The economic feasibility of the gasification system integrated with the ICEG is evaluated considering four distinct scenarios through the combination of three methods, NPV, IRR and PBP. According to Cardoso et al. [25], each of these methods carries its strengths and limitations. For example, NPV allows maintaining a good cash flow record, yet, a small increase or decrease in the discount rates significantly affects the results. On the contrary, IRR despite providing a simpler approach evaluates every investment by delivering merely one single discount rate. Regarding PBP, it presents an easily perceptible and direct analysis when calculating the amount of time required to recover from the investment, yet, it does not consider the financing and the risks associated with the venture. Beyond the weaknesses concerning each method, there is no doubt that each one fulfills a specific purpose in the economic analysis. Hence, in this study one provides an approach that allows evaluating the viability of the system by combining these three methods, further strengthening the economic model towards improved decision making. Additional details on the economic model formulation are provided in [25].
6. Results and Discussion
6.1. Experimental Runs and Model Validation
In order to validate the model a set of experimental data gathered from the 15 kWe downdraft gasifier was used for comparison. For validation purposes, as the research group already validated the here employed model in dealing with eucalyptus and MSW gasification in previously published works [8,45], and given the chemical similarity between Eucalyptus and MSW from both countries (Portugal and Brazil), it is then feasible to consider that the model proved to be sufficiently robust in dealing with these feedstocks. Therefore, in this work, only experimental gasification runs were performed for acacia residues to validate the model performance in dealing with this specific feedstock. In this sense, Table 7 shows the operating conditions for three experimental runs in which acacia residues were used as feedstock, while Figure 3 depicts the molar fraction as a function of gasification temperature for acacia.
Table 7.
Experimental operating conditions and syngas analysis.
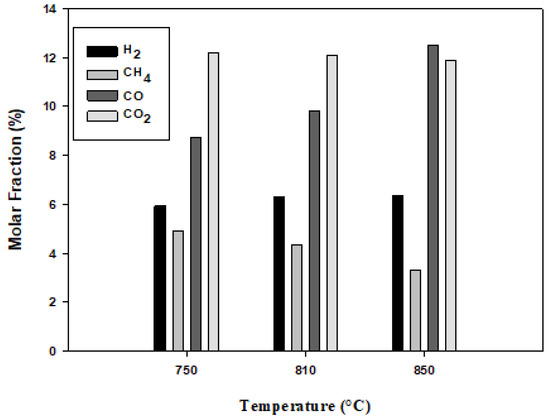
Figure 3.
Molar fraction as a function of gasification temperature for the acacia residues.
Figure 4 compares the experimental and numerical syngas composition attained from the gasification runs of acacia residues. One can verify that the numerical results provide a good agreement with the results obtained from the experimental process carried out in the downdraft gasifier in dealing with the acacia residues. Considering all the simulations (for the four fuels), the maximum error obtained was inferior to 20%. This is a reasonable margin of error for such a complex system as biomass gasification. The differences between the model and the experimental results are due to some simplifying assumptions used in our model and to differences in the biomass fuel composition [46].
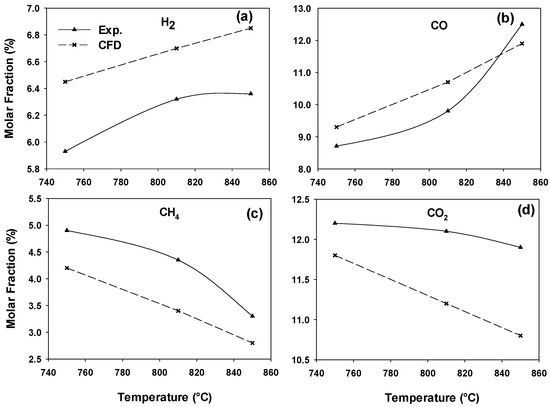
Figure 4.
Experimental and numerical syngas composition deviations for acacia residues for the gas species: (a) H2, (b) CO, (c) CH4 and (d) CO2.
The numerical model successfully describes the syngas composition changes depending on the different operating conditions. In Figure 4a,b, the increase in the gasification temperature promote the formation of syngas with higher H2 and CO content, as indicated by the experimental data. Both H2 and CO appear to increase to asymptotic values. On the other hand, Figure 4c,d, show that the contents of CH4 and CO2 follow the opposite trend. CH4 decreases as a function of temperature as the methane reaction is exothermic. These results are in close agreement with the literature [46]. According to Le Chatelier’s principle, higher temperatures favor products in endothermic reactions. Therefore, the endothermic reaction in Table 5 (r13) was strengthened leading to an increase in the hydrogen content. A more detailed explanation of the model used in this work can be found elsewhere [30,46].
Finally, in this work, only three experimental runs were considered, once the numerical model applied has already been thoroughly validated concerning the syngas compositions attained from various reactors, multiple gasification agents and feedstocks at various operating conditions, strengthening the accurate predictability of the numerical model in a broad range of applications [28,47].
6.2. Energy Analysis Results
To investigate the distribution of the energy flows of each stream in the gasification system-ICEG, the energy analysis was performed by the first law of thermodynamics. Table 8 shows the mass and energy balance for the analyzed feedstocks. The mass balance allows calculating the mass flow of the syngas and engine exhaust gases, as well as the air flows for the gasification process and syngas combustion. Biomass fuel consumption is assumed constant considering the nominal capacity of the gasification system, around 22 kg/h. Given the downdraft gasifier’s hopper capacity, around 60 kg, the fuel residence time is about 3 h, depending on the used feedstock density and the air/ratio gas (equivalence ratio, ER).
Table 8.
Main results of the technical analysis.
The calculated values of the energy analysis for the downdraft-ICEG system given by the first law of thermodynamics are as follows. The power supplied by the biomass varies from 88 to 112 kW depending on the LHV of the fuel, the cooling efficiency of the gasifier varies from 73 to 75%, the power supplied by the syngas ranges from 64.2 to 83 kW. The electricity generated ranges between 11.6 and 15 kW, with an overall system efficiency of approximately 13.5%, as shown in Figure 5. It can be seen that the value of the overall efficiency of the system is in range with the values reported in the literature, approximately 14% [13,23].
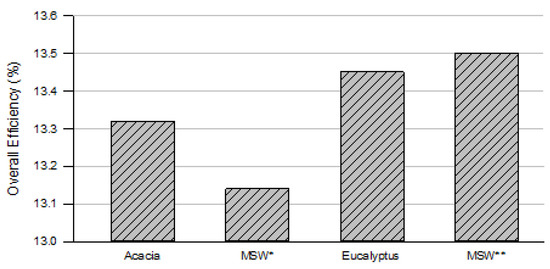
Figure 5.
Overall efficiency for the four fuels considered.
Figure 6 shows the Sankey diagram of the energy flows for the proposed unit which includes the flow for the downdraft gasification system and the flow for the ICEG. The energy rates of each current vary accordingly to the LHV of the used fuel. The fuel processing capacity of the gasification system is limited to 22 kg/h, so fuels with lower LHV (acacia and MSW *) generate less energy. The energy contained in the fuel (biomass and MSW) is converted into physical and chemical energy of the syngas during the gasification process, thermal energy and solid waste become the main loss sources during this stage of the process, representing 26% for the acacia (Figure 6a), 27% for the MSW * (Figure 6b), 25.3% for the eucalyptus (Figure 6c) and 25% for MSW ** (Figure 6d). The syngas is combusted in an ICEG to generate electricity, the energy losses at this stage are the largest of the system, representing 60.7% for the acacia, 59.9% for the MSW *, 61.3% for the eucalyptus and 61.5% for MSW **. These losses are given mainly to the heat energy loss by the exhaust gases and the ICEG system. The overall efficiency of the system is approximately 14%. One possible route to reduce these losses is by implementing a cogeneration system that, in addition to producing electricity, will generate hot and cold water increasing the total efficiency of the system.
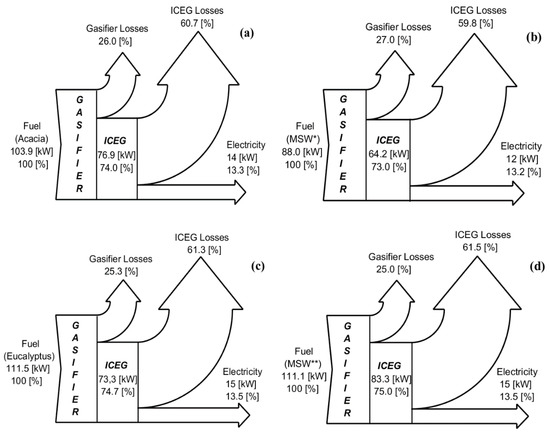
Figure 6.
Sankey diagram of the gasification system-ICEG for: (a) acacia, (b) MSW *, (c) eucalyptus and (d) MSW **.
Figure 7 shows the fuel feeding rate effect in the overall efficiency of the downdraft-ICEG system for each one of the studied fuels. One can see that the overall efficiency ranges from 12.1 to 13.6%, setting the optimal values range for the fuel supply. The fuel feed value in the gasifier is approximately 22 kg/h, producing between 60 to 70 m3/h of syngas depending on the fuel.
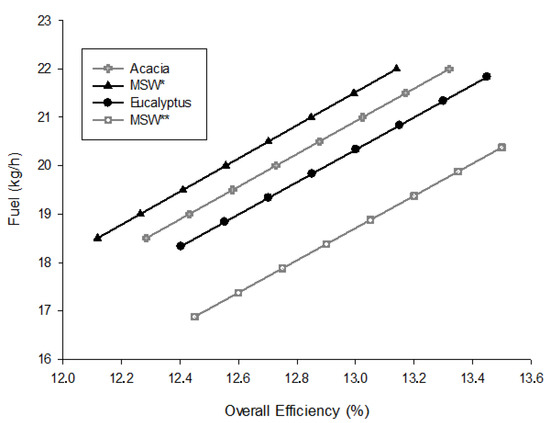
Figure 7.
Effect of fuel feeding rate on the downdraft-ICEG system overall efficiency.
The calculations made in this study show that it is technically and energetically possible to produce electrical energy through employing a downdraft gasifier in dealing with different fuels (biomass and MSW) so to produce syngas to feed an ICEG. However, syngas usage leads to engine power losses that can vary between 20 and 55% mainly in engines that were originally designed to operate with gasoline or natural gas [22]. These output engine power losses relate with the syngas LHV, the amount of combustible mixture supplied to the cylinder, and the number of combustion strokes in each time (number of revolutions per minute, rpm). For comparison purposes, Table 9 summarizes several studies also performed with downdraft gasifiers coupled with ICEG using 100% syngas.
Table 9.
Various studies performed with downdraft gasifiers coupled with ICEG using 100% syngas.
Downdraft-ICEG gasification systems can be applied to meet the energy needs of small communities or households, especially in difficult-to-reach rural settings. For instance, in Brazil, there are around 1 million residences without proper access to electricity, residences in which grid extension is unfeasible due to their limited access and low demand [4]. Thus, a viable route to electrify these residences is by implementing renewable energy solutions such as solar photovoltaics, small-hydroelectric, wind and small-scale gasification units. Among these solutions, downdraft-ICEG gasification systems are a feasible option for the Brazilian context as these residences are located in decentralized areas, of a rural or mountainous kind, where agriculture is a primary activity hence biomass availability is of no concern. Moreover, some of these communities dispose of easy access to MSW, either arriving from the community itself or even from surrounding urban areas, that when properly conditioned can be used to fuel the gasifying systems allowing the treatment and valorization of the organic fraction of this unsought product while maintaining a stable feedstock supply [13,25].
Regarding Portugal, most of the forest biomass availability is located mainly in the country’s central region, out of which nearly 97.5% of the woodlands belong to private owners or local communities [33]. In 2017, deadly wildfires flared across central and north of Portugal, calling for an articulated set of actions promoting active forest management focusing on increasing the value of forest products through the use of biomass for energy purposes [25].
Thus, in this follow-up, the implementation of small power generation systems, such as the one analyzed in this study, suits as a viable option for the valorization of local forest biomass residues for decentralized communities, while preventing wildfire hazard and maintaining a biomass-to-energy strategy and policy measures impacting forest products trade. Again, acknowledging the gasification with local MSW stands as a clever strategy to increase the unit’s production efficiency aiding towards achieving the energy independence of these remote communities.
6.3. Economic Model Results
The economic analysis provides the financial viability of an investment project throughout its lifetime. Figure 8 illustrates the initial outlay for the 15 kWe downdraft gasifier-ICEG project, set around 45,000 € for a lifetime of 25 years, jointly with the calculated cash flows, total annual outflows and inflows. During the investment period (year 0), the expenses required to initiate the project are thought-through. For year 1, the project’s cash flow increases to positive status due to electricity sales income as the plant starts generating electric power. It is assumed that starting this year the plant will generate approximately 36,000 kWh/year for the rest of the project’s lifetime, achieving an average profit rate of 10,500 €/year. In addition to the initial investment (only reflected in year 0), outflows result from expenses related to fuel purchase (biomass or MSW) and O&M costs. Expenses related to fuel represent approximately 85% of the total expenses of the plant. Revenues show a positive flow over the years, emphasizing the importance of the electricity sales price and reimbursements to the projects’ viability. The project installation will be completely debt-free in 9.20 years for the acacia option (as seen in Figure 8a), 12.61 years for the MSW * (Figure 8b), 9.38 years for the eucalyptus option (Figure 8c) and 8.67 years for MSW ** (Figure 8d). These assumptions go hand in hand with the PBP calculations, as explained below. The present project cash flows distribution results are in accordance with the assumptions and recommendations found in the literature [25,49]
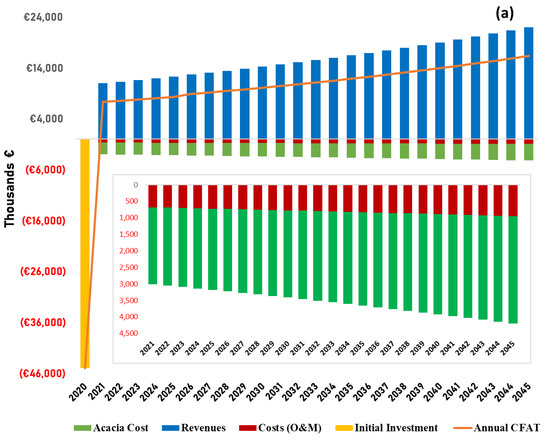
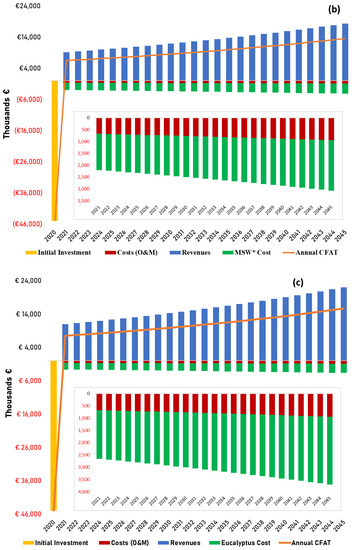
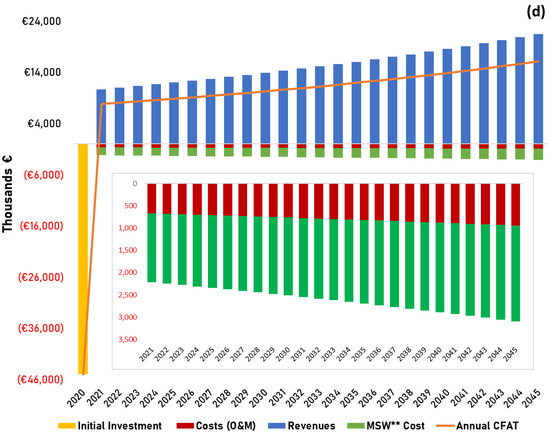
Figure 8.
Cash flows concerning the various gasification projects depicting the annualized costs and revenues throughout the plant’s lifetime for Portugal with (a) acacia and (b) MSW *, and Brazil with (c) eucalyptus and (d) MSW **.
After calculating the cash flows, one must determine if the project is economically acceptable. Figure 9 provides the economic evaluation results for the NPV, IRR and PBP calculations. The NPV is calculated concerning a discount rate of 12%, which will determine whether the project is to be accepted or not. For higher discount rates the NPV value decreases, while for lower discount rates the NPV value increases, showing that the NPV behavior is inversely proportional to the discount rate. Results show that the NPV for the downdraft-ICEG system project dealing with acacia is of 29.32 k€ (Figure 9a), 18.99 k€ for MSW * (Figure 9b), 28.45 k€ for eucalyptus (Figure 9c) and 31.65 k€ for MSW ** (Figure 9d). The IRR rate is 19.34% for acacia, 16.88% for MSW *, 19.28% for eucalyptus and 20.09% for MSW **. Please note that the IRR is calculated concerning the CFAT results and not on the CFBT results. Lastly, the PBP varies from 8.67 to 12.61 years according to the fuels considered. A closer look at the results shows that the investment projects set for deployment in Brazil deliver enhanced economic performances showing increased feasibility. Such behavior is due mainly to the higher electricity sales price practiced in Brazil as the projects’ revenues arrive from electricity sales to the national grid.
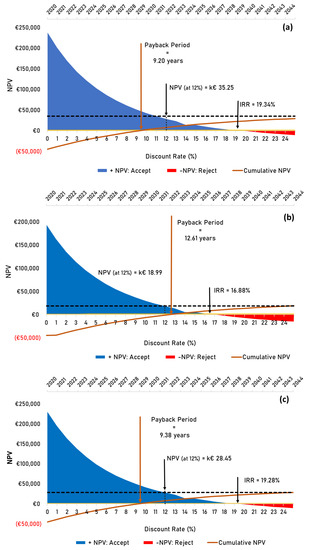
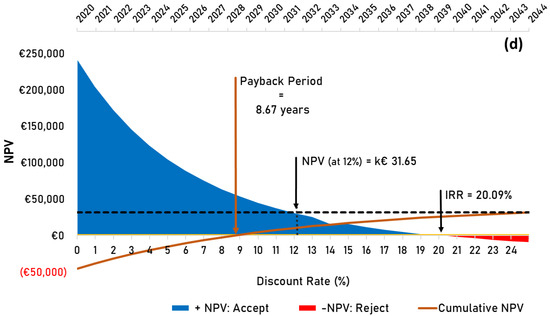
Figure 9.
Financial indicators overview throughout the gasification power plant lifetime for (a) acacia, (b) MSW *, (c) eucalyptus and (d) MSW **.
The financial indicator results obtained for the energy generation system projects are consistent with the current literature [13,20]. According to the World Bank Group, typical benchmarks for key financial parameters in biomass projects indicate that the NPV should be a positive value, the IRR should be higher than 10% and the PBP less than 10 years [49]. Bearing in mind these considerations, the projects here purposed may indeed be considered economically feasible. However, despite its apparent viability, one must go beyond these numbers and assess how economically attractive the venture may be to most investors and which are the main risks associated with it. In this sense, a sensitivity analysis must be performed so to determine which variables are the most critical to the project’s success.
7. Sensitivity Analysis
7.1. Monte Carlo Simulation
The sensitivity analysis evaluates the risk impact by varying each parameter while all other variables remain constant. This approach will enable changes in the results of the economic analysis, indicating the importance of specific risk parameters while assessing its influence on the system’s performance [49]. The risk analysis was evaluated by means of the Monte Carlo method implemented within the economic model spreadsheet. A Monte Carlo method was employed for a total of 10,000 iterations following a triangular distribution considering a lower, upper and reference value. The sensitivity analysis moves in a range of ±30% over the reference value of the selected input variables. The input variables considered as the most influential in the project results are the initial investment, discount rate, electricity sales price, O & M and fuel costs. The input variables chosen coincide with those indicated as the most critical in the literature [25,49].
7.2. Sensitivity Analysis Results and Discussion
Figure 10a–d show the values for the NPV probability distribution for the four analyzed fuels respecting each system settled in both Portugal and Brazil. The mean distribution values, given by the ‘Mean’ vertical line in the NPV probability distributions figures, are very close to the average values previously calculated in the economic analysis. This closeness supports the validity of the simulations. The low standard deviation (referred to as St. dev.) indicates that the expected values within the distribution are close to the mean. In this sense, the higher the standard deviation is, the greater the investment risk will be. The highest standard deviation values are presented for acacia σ = 15.62 k€ (Figure 10a), eucalyptus σ = 15.18 k€ (Figure 10c) and MSW ** σ = 15.07 k€ (Figure 10d), and the lowest value for MSW * σ = 14.48 k€ (Figure 10b). Therefore, a higher probability of investment risk loss in the NPV is more likely to occur for the acacia, followed by eucalyptus and MSW **, and finally, MSW * which gathers the lowest risk of investment loss. Describing the NPV projection, the probability of attaining a negative NPV is given by the probability density area at the left of zero, for acacia and MSW * these are placed around 1.82% and 7.52%, respectively, while for eucalyptus and MSW ** these are set around 1.53% and 0.66%. This means that there is a rather low probability of reaching a negative NPV. Whereas the probability of this investment exceeding an NPV of 50 k€ is approximately 10.56% for acacia, 2.90% for MSW *, 9.65% for eucalyptus and 12.59% for MSW **.
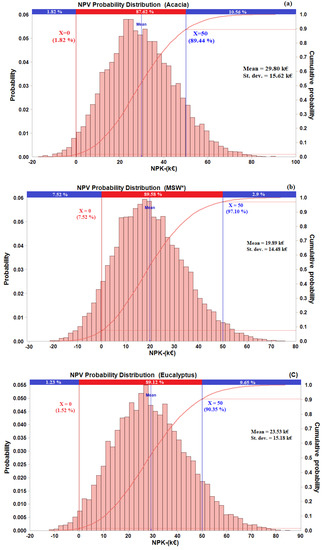
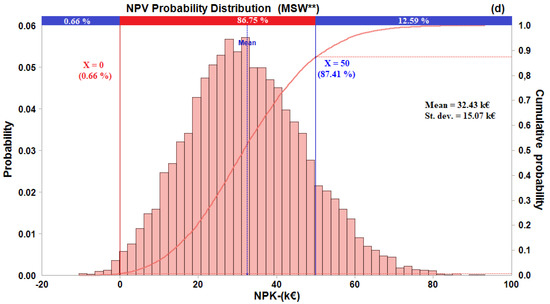
Figure 10.
Probability distributions for NPV: (a) Acacia, (b) MSW *, (c) Eucalyptus and (d) MSW **.
In general, the NPV showed wider distribution over its mean value resulting in the highest standard deviation values as compared to IRR and PBP. Higher standard deviation values mean that higher investment loss is more likely to occur in the NPV. Therefore, for the sake of simplicity, instead of providing individual figures for all the studied fuels for both IRR and PBP, Table 10 is provided summarizing the mean and standard deviations values for the IRR and PBP probability distributions. In contrast to the NPV, both IRR and PBP carry lower standard deviation values of about 0.03% for IRR and between 3.21 to 5.52% for PBP, indicating that all their expected values tend to be very close to the mean, signifying that the lowest investment risk failure comes associated with these financial indicators, especially with the IRR, delivering the lowest values.
Table 10.
IRR and PBP probability distributions for the four studied fuels.
From all the financial indicators studied, NPV is the highest risk facing indicator as it presents the highest standard deviations. Hence, one will focus on discussing how the uncertainty of the input variables considered affects the NPV for each fuel. Figure 11 shows the impact of each input variable on the NPV and its sensitivity range. Results show that the impact changes on NPV are identical in the systems settled in Portugal and Brazil, as the profitability of the projects is highly sensitive to the electricity sales price and discount rate for all analyzed fuels. The next most striking input variables are mainly the initial investment, followed by O & M costs and fuel costs (as generally the least affecting). The electricity sale price and discount rate show a considerable impact change on the NPV as compared to the remaining input variables.
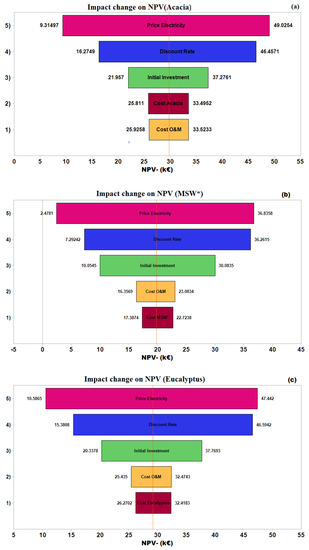
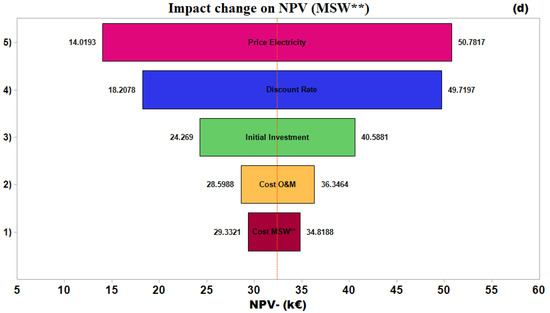
Figure 11.
Sensitivity range to input variables for NPV for the different fuels: (a) acacia, (b) MSW *, (c) eucalyptus and (d) MSW **.
Out of all variables considered, the electricity sales price can considerably hamper the economic viability of the project, when considering an unfavorable scenario, the NPV can reach low values for the MSW * 2.48 k€ (Figure 11b). On the other hand, it can also considerably increase the income of the project into the most favorable scenario with acacia attaining 49.03 k€, MSW * 36.84 k€, eucalyptus 47.44 k€, and MSW ** 50.78 k€. The electricity sales price is a variable of extreme importance significantly affecting the viability of the projects as it is a rather uncertain parameter due to the energy market price fluctuations and subsidies, both highly dependent upon political decisions. The discount rate is the second variable with the greatest impact on the NPV, such is true given to the high impact in the NPV discounted cash flow calculations. As for the initial investment, it can be an impactful variable since it greatly influences the calculation of the NPV given the high initial cash flow of the project. Following, the O & M variable carries slither impact risk. This variable heights-in all costs necessary to maintain the system fully operational. Finally, and even in the most worsening scenario, the fuel cost is the variable that usually least affects the NPV. Ultimately, despite not being directly accounted for in the sensitivity analysis, in a real scenario, and according to the energy results, the increased LHV attributed to the Brazilian feedstocks would assist both the economic feasibility and risk assessment, in the long run, by allowing increased system performance.
Unsurprisingly, and even despite the narrow difference, the results of the economic analysis show that the costs of energy generation based on biomass gasification systems do vary accordingly with the country’s economic scenario, as regulated expenses, revenues and fuel composition vary widely from one country to the other. To compare the results here attained with the ones found in the literature, Table 11 provides a record of economic analysis results from several previous works set in different countries employing power generation systems similar to the one set in this study. Indeed, the economic analysis results are in accordance with a range of values present in the literature under similar circumstances.
Table 11.
Record of downdraft gasifiers’ economic analysis results found in the literature suiting as means to of comparison for this work.
8. Considerations on Small-Scale Biomass Gasification vs. Conventional Diesel Solutions
Contextually, small-scale biomass gasification-ICEG systems granted a good fit for both Portuguese and Brazilian energy policies when applied to electric power generation in decentralized areas, particularly when settled in small municipalities of rural kind aiding to reduce the energy dependence from external sources.
So far, small-scale decentralized electrification solutions addressed to decentralized communities have been dominated by conventional diesel generators [52]. The world’s growing demand for cleaner energy calls however for an urgent and sustainable low-carbon expansion in the power sector. As known, fossil fuel-driven engines emit NOx, CO, unburned hydrocarbons and particulate matter, which contribute to air pollution and are particularly harmful to local inhabitants. Moreover, electric power production from these systems may fare expensive due to high diesel fuel costs, hampered by fuel price fluctuations and additional costs related to fuel transportation to remote sites with sparsely developed road structure. Plus, fuel transportation must be effectively planned to the point of safeguarding fuel supply, avoiding shortages or interruptions, which, in the long run, will lead communities into facing increased energy costs [53].
Renewable energy sources solutions such as biomass gasification systems coupled with ICEG, are proving to be a far more clean, reliable and efficient option for decentralized electrification, not requiring regular fuel supply and being cost-competitive with diesel generators [54]. In fact, a well operated and established biomass gasification system can produce far less greenhouse gas emissions since biomass is considered carbon-neutral, feedstocks arrive from renewable sources and most of the produced gas is used as fuel [55]. Therefore, the biomass systems’ environmental performance and technical competitiveness with conventional diesel systems alongside with the current global warming paradigm upholds gasification technology to a frontline position shift towards a more sustainable energy market.
9. Conclusions
This work presented a comparative techno-economic analysis concerning the gasification of four fuels from two distinct countries, acacia and MSW * from Portugal and eucalyptus and MSW ** from Brazil, employed for electricity generation purposes. Experimental gasification runs for acacia were carried out in a 15 kWe gasifier manufactured by All Power Labs coupled with an ICEG. The syngas composition was predicted by employing a 2-D Eulerian-Eulerian approach developed within the ANSYS Fluent framework. The mathematical model was able to predict the experimental syngas composition within a reasonable 20% error, considering the complexity associated with biomass and MSW gasification processes.
The technical evaluation focused mainly on electricity generation and system efficiencies. Main energy analysis results settled the fuel power supply between 88 to 112 kW, depending on the LHV, the gasifier’s cooling efficiency varied from 73 to 75% and the syngas power supply from 64.2 to 83 kW. Ultimately, the generated electricity ranged from 11.6 to 15 kW with an overall system efficiency of approximately 13.5%. Hereupon, calculations showed the adequacy of producing electric power by means of a downdraft gasifier dealing with different fuels to produce proper syngas to feed an ICEG.
Regarding the economic analysis, a spreadsheet-based economic model was developed based on a combination of three financial indicators, NPV, IRR and PBP. The main cost factors considered included electricity generation costs, initial investment, O & M cost and fuel costs. Revenues were calculated from the electricity sales to the national grid. The economic model presented positive perspectives admitting the possibility of establishing the project under current market conditions. For the Portuguese scenario, the results showed an NPV of 29.32 k€ for the acacia and 18.99 k€ for MSW *, whereas, for the Brazilian scenario, eucalyptus resulted in an NPV of 28.45 k€ and 31.65 k€ for MSW **. Concerning the IRR, results showed rates of 19.34% for acacia, 16.88% for MSW *, 19.28% for eucalyptus and 20.09% for MSW **. As for PBP, results predicted a time frame of 9.20 years for acacia, 12.61 years for MSW *, 9.38 years for eucalyptus and 8.67 years for MSW **. In general, the investment projects set for deployment in Brazil delivered enhanced economic performances showing increased feasibility mainly due to higher electricity sales price practiced in the country.
A sensitivity analysis was carried out by employing the Monte Carlo method to assess the risks and measure the level of uncertainty associated with the ventures. The risk assessment yielded rather favorable investment projections with a probability of the NPV reaching positive values of 98.18% for acacia, 92.48% for MSW *, 98.77% for eucalyptus and 99.34% for MSW **. As compared to the NPV, IRR and PBP carried lower standard deviation values, of about 0.03% and 3.21 to 5.52%, respectively, signifying that the lowest investment risk failure comes associated with these two financial indicators, especially with the IRR. Hence, a greater risk of investment loss was detected for the NPV. Overall, the NPV showed to be considerably more sensitive to uncertainties associated with the electricity sales price and discount rate, while fuel cost was generally the least affecting variable. Finally, the least affected NPV given out by the Brazilian feedstocks showed that the units set for deployment in this context offer a slight lower risk of investment loss as compared to the Portuguese projects mostly due to improved electricity sales price regulations.
At last, this work states the positive effect of energy generation from small-scale gasification-ICEG systems in different scenarios (Portugal and Brazil) particularly towards decentralized communities inserted in a rural scheme. However, despite the broad benefits shown by this technology, its viability is still highly influenced by local government decisions, who must enforce light-handed regulatory measures concerning subsidiary support and favorable electricity sales prices so to benefit the dissemination and development of this technology. In the long run, these policies will not only allow investors to face the high initial outlays required for deploying such ventures, but also stimulate research interest in further developing gasification technology coupled with ICEG to a wide commercial viability status. Truly, small-scale gasification systems for decentralized solutions provide the opportunity for achieving global access to electricity, suiting as key for unlocking a sustainable future while uplifting the local economy in these locations.
Author Contributions
Conceptualization, V.S. and J.L.S.; methodology, C.E.T. and P.B.; software, D.E., J.C. and J.R.C.; validation, D.E., J.C. and J.R.C.; formal analysis, C.E.T., R.A.M.B. and V.S.; investigation, J.R.C..; resources, P.B. and J.L.S.; data curation, R.A.M.B. and C.E.T.; writing—J.R.C. and J.C.; writing—review and editing, J.R.C.; J.C., V.S. visualization, J.R.C.; supervision, R.A.M.B., J.L.S. and V.S.; project administration, V.S. and J.L.S.; funding acquisition, V.S. and J.L.S. All authors have read and agreed to the published version of the manuscript.
Funding
This research was funded by Coordination for the Improvement of Higher Education Personnel (CAPES) and by the Portuguese Foundation for Science and Technology (FCT) through the project number 88881.156267/2017-01, entitled Uso de Misturas Syngas/Biodiesel em MCI para a Geração Descentralizada de Energia. This paper is also a result of the project “Apoio à Contratação de Recursos Humanos Altamente Qualificados” (Norte -06-3559-FSE-000045), supported by Norte Portugal Regional Operational Programme (NORTE 2020), under the PORTUGAL 2020 Partnership Agreement.
Acknowledgments
The authors would also like to thank to the FCT for the grant SFRH/BD/146155/2019 and for the project IF/01772/2014.
Conflicts of Interest
The authors declare no conflict of interest. The funders had no role in the design of the study; in the collection, analyses, or interpretation of data; in the writing of the manuscript, or in the decision to publish the results.
Nomenclature
| calibration constants | |
| equation coefficient related to the main factors | |
| interception coefficient | |
| quadratic effects (give the curvature to the response surface) | |
| cross interactions between factors | |
| constants | |
| specific heat capacity | |
| cash flows | |
| diffusion rate coefficient | |
| generation of turbulence kinetic energy due to the mean velocity gradients | |
| generation of turbulence kinetic energy due to buoyancy | |
| gravitational acceleration | |
| h | specific enthalpy |
| heat transfer coefficient between the fluid phase and the solid phase | |
| radiation intensity | |
| diffusion flux of specie | |
| thermal conductivity | |
| lower heating value | |
| total mole flow of carbon in the syngas components | |
| molecular weight | |
| molecular weight of component | |
| biomass flow into the gasifier | |
| mass flow | |
| mass flow between the fluid phase and the solid phase | |
| Nusselt number | |
| particle phase pressure due to particle collisions | |
| gas pressure | |
| heat flux | |
| th | specific enthalpy |
| heat transfer intensity between phases | |
| heat rate | |
| universal gas constant | |
| net generation rate of specie due to homogeneous reaction | |
| reaction rate | |
| source term related to the specie production from the solid heterogeneous reaction | |
| user-defined source terms | |
| source term due to chemical reactions | |
| user-defined source terms | |
| temperature | |
| mean velocity | |
| instantaneous velocity | |
| work rate | |
| carbon fraction in the biomass (obtained from the ultimate analysis) | |
| mass fraction | |
| contribution of the fluctuating dilatation in compressible turbulence to the overall dissipation rate | |
| Other symbols | |
| volume fraction | |
| gas-solid interphase drag coefficient | |
| density | |
| granular temperature, proportional to the kinetic energy of the random motion of the particles | |
| energy exchange between the fluid phase and the solid phase | |
| diffusion energy ( is the diffusion coefficient) | |
| generation of energy by the solid stress tensor | |
| collisional dissipation of energy | |
| tensor stress | |
| viscosity | |
| stoichiometric coefficient | |
| efficiency | |
| Subscripts | |
| gas phase | |
| solid phase | |
| component | |
References
- Alsharif, M.H. Techno-economic evaluation of a stand-alone power system based on solar/battery for a base station of global system mobile communication. Energies 2017, 10, 392. [Google Scholar] [CrossRef]
- Pardo, J.E.; Mejías, A.; Sartal, A. Assessing the importance of biomass—Based heating systems for more sustainable buildings: A case study based in Spain. Energies 2020, 13, 1025. [Google Scholar] [CrossRef]
- APREN. Eletricidade Renovável. Panorama Energético Nacional; APREN: Lisboa, Portugal, 2017. [Google Scholar]
- Ministry of Mines and Energy. Resenha Energética Brasileira; Ministry of Mines and Energy: Brasilia, Brazil, 2018.
- Dudley, B.; Dale, S. BP Energy Economics. In BP Energy Outlook; BP: London, UK, 2018. [Google Scholar]
- Uddin, M.N.; Techato, K.; Taweekun, J.; Rahman, M.M.; Rasul, M.G.; Mahlia, T.M.I.; Ashrafur, S.M. An overview of recent developments in biomass pyrolysis technologies. Energies 2018, 11, 3115. [Google Scholar] [CrossRef]
- Ferreira, S.; Monteiro, E.; Calado, L.; Silva, V.; Brito, P.; Vilarinho, C. Experimental and modeling analysis of brewers’ spent grains gasification in a downdraft reactor. Energies 2019, 12, 4413. [Google Scholar] [CrossRef]
- Couto, N.; Silva, V.; Monteiro, E.; Teixeira, S.; Chacartegui, R.; Bouziane, K.; Brito, P.S.D.; Rouboa, A. Numerical and experimental analysis of municipal solid wastes gasification process. Appl. Therm. Eng. 2015, 78, 185–195. [Google Scholar] [CrossRef]
- Rinaldini, C.A.; Allesina, G.; Pedrazzi, S.; Mattarelli, E.; Savioli, T.; Morselli, N.; Puglia, M.; Tartarini, P. Experimental investigation on a Common Rail Diesel engine partially fuelled by syngas. Energy Convers. Manag. 2017, 138, 526–537. [Google Scholar] [CrossRef]
- Thi, T.; Huong, T.; Khanh, N.D.; Luong, P.H.; Tuan, L.A. A computational study of the effects of injection strategies on performance and emissions of a Syngas/Diesel dual-fuel engine. In Proceedings of the 5th AUN/SEED-Net Regional Conference on Global Environment, Bandung, Indonesia, 21–22 November 2012; pp. 379–392. [Google Scholar]
- Guo, H.; Neill, W.S.; Liko, B. The combustion and emissions performance of a syngas-diesel dual fuel compression ignition engine. In Proceedings of the ASME 2016 Internal Combustion Engine Fall Technical Conference, Greenville, SC, USA, 9–12 October 2016. ICEF 2016. [Google Scholar]
- Omar, M.M.; Munir, A.; Ahmad, M.; Tanveer, A. Downdraft gasifier structure and process improvement for high quality and quantity producer gas production. J. Energy Inst. 2018, 91, 1034–1044. [Google Scholar] [CrossRef]
- Boloy, R.A.M.; Silveira, J.L.; Tuna, C.E.; Coronado, C.R.; Antunes, J.S. Ecological impacts from syngas burning in internal combustion engine: Technical and economic aspects. Renew. Sustain. Energy Rev. 2011, 15, 5194–5201. [Google Scholar] [CrossRef]
- Dasappa, S.; Subbukrishna, D.N.; Suresh, K.C.; Paul, P.J.; Prabhu, G.S. Operational experience on a grid connected 100 kWe biomass gasification power plant in Karnataka, India. Energy Sustain. Dev. 2011, 15, 231–239. [Google Scholar] [CrossRef]
- Lee, U.; Balu, E.; Chung, J.N. An experimental evaluation of an integrated biomass gasification and power generation system for distributed power applications. Appl. Energy 2013, 101, 699–708. [Google Scholar] [CrossRef]
- Elsner, W.; Wysocki, M.; Niegodajew, P.; Borecki, R. Experimental and economic study of small-scale CHP installation equipped with downdraft gasifier and internal combustion engine. Appl. Energy 2017, 202, 213–227. [Google Scholar] [CrossRef]
- Cardoso, J.; Silva, V.; Eusébio, D.; Brito, P. Hydrodynamic modelling of municipal solid waste residues in a pilot scale fluidized bed reactor. Energies 2017, 10, 1773. [Google Scholar] [CrossRef]
- Silva, V.; Rouboa, A. Combining a 2-D multiphase CFD model with a Response Surface Methodology to optimize the gasification of Portuguese biomasses. Energy Convers. Manag. 2015, 99, 28–40. [Google Scholar] [CrossRef]
- Coronado, C.R.R.; Yoshioka, J.T.T.; Silveira, J.L. Electricity, hot water and cold water production from biomass. Energetic and economical analysis of the compact system of cogeneration run with woodgas from a small downdraft gasifier. Renew. Energy 2011, 36, 1861–1868. [Google Scholar] [CrossRef]
- Luz, F.C.; Rocha, M.H.; Lora, E.E.S.; Venturini, O.J.; Andrade, R.V.; Leme, M.M.V.; Del Olmo, O.A. Techno-economic analysis of municipal solid waste gasification for electricity generation in Brazil. Energy Convers. Manag. 2015, 103, 321–337. [Google Scholar] [CrossRef]
- Raman, P.; Ram, N.K. Performance analysis of an internal combustion engine operated on producer gas, in comparison with the performance of the natural gas and diesel engines. Energy 2013, 63, 317–333. [Google Scholar] [CrossRef]
- Indrawan, N.; Thapa, S.; Bhoi, P.R.; Huhnke, R.L.; Kumar, A. Engine power generation and emission performance of syngas generated from low-density biomass. Energy Convers. Manag. 2017, 148, 593–603. [Google Scholar] [CrossRef]
- La Villetta, M.; Costa, M.; Cirillo, D.; Massarotti, N.; Vanoli, L. Performance analysis of a biomass powered micro-cogeneration system based on gasification and syngas conversion in a reciprocating engine. Energy Convers. Manag. 2018, 175, 33–48. [Google Scholar] [CrossRef]
- Chang, C.T.; Costa, M.; La Villetta, M.; Macaluso, A.; Piazzullo, D.; Vanoli, L. Thermo-economic analyses of a Taiwanese combined CHP system fuelled with syngas from rice husk gasification. Energy 2019, 167, 766–780. [Google Scholar] [CrossRef]
- Cardoso, J.; Silva, V.; Eusébio, D. Techno-economic analysis of a biomass gasification power plant dealing with forestry residues blends for electricity production in Portugal. J. Clean. Prod. 2019, 212, 741–753. [Google Scholar] [CrossRef]
- Brito, P.; Calado, L.; Garcia, B.; Alves, O.; Samanis, M. A Critical Review on Acacia Gasification and Mix Acacia/Tires Co-Gasification, and Their Energy Assessments; IPP: Portalegre, Portugal, 2017.
- The Global Leader in Small-Scale Gasification. Available online: https://www.allpowerlabs.com (accessed on 15 March 2020).
- Couto, N.; Silva, V.; Cardoso, J.; Rouboa, A. 2nd law analysis of Portuguese municipal solid waste gasification using CO2/air mixtures. J. CO2 Util. 2017, 20, 347–356. [Google Scholar] [CrossRef]
- De Sales, C.A.V.B.; Maya, D.M.Y.; Lora, E.E.S.; Jaén, R.L.; Reyes, A.M.M.; González, A.M.; Andrade, R.V.; Martínez, J.D. Experimental study on biomass (eucalyptus spp.) gasification in a two-stage downdraft reactor by using mixtures of air, saturated steam and oxygen as gasifying agents. Energy Convers. Manag. 2017, 145, 314–323. [Google Scholar] [CrossRef]
- Couto, N.; Silva, V.; Monteiro, E.; Rouboa, A. Exergy analysis of Portuguese municipal solid waste treatment via steam gasification. Energy Convers. Manag. 2017, 134, 235–246. [Google Scholar] [CrossRef]
- CEPEA (Centro de Estudos Avançados em Economia Aplicada). Setor Florestal; CEPEA: São Paulo, Brazil, 2018; Volume 93. [Google Scholar]
- Ferreira, A.L.D. Culturas Energéticas: Produção De Biomassa E Bioenergia; Universidade de Coimbra: Coimbra, Portugal, 2015. [Google Scholar]
- Ferreira, S.; Monteiro, E.; Brito, P.; Vilarinho, C. Biomass resources in Portugal: Current status and prospects. Renew. Sustain. Energy Rev. 2017, 78, 1221–1235. [Google Scholar] [CrossRef]
- Bilek, E.M.; Skog, K.E.; Fried, J.; Christensen, G. Fuel to Burn: Economics of Converting Forest Thinnings to Energy Using BioMax in SOUTHERN Oregon; U.S. Dept. of Agriculture, Forest Service, Forest Products Laboratory: Madison, WI, USA, 2005.
- ERSE. Proveitos Permitidos e Ajustamentos Para 2019 Das Empresas Reguladas do Setor Elétrico; ERSE: Lisboa, Portugal, 2019.
- ANEEL. Relatório Pesquisa Iasc 2018 Brasil, Categorias e Distribuidoras; ANEEL: Brasilia, Brazil, 2019.
- Abrantes, J.M. Avaliação Técnica e Económica da Aplicação de Sistemas Waste to Energy no Tratamento de Resíduos Urbanos em Aglomerados de Média e Pequena Dimensão; Instituto Superior Técnico Lisboa: Lisboa, Portugal, 2016. [Google Scholar]
- Ministerio das Finanças. Guia Fiscal 2019; Ministério das Finanças: Lisboa, Portugal, 2019.
- Receita Federal do Brasil. Capítulo XIII—IRPJ—Lucro Presumido 2017; Receita Federal do Brasil: Brasilia, Braszil, 2017.
- Lyons, W.C.; Plisga, G.J.; Michael, D. Lorenz Petroleum Economic Evaluation. In Standard Handbook of Petroleum and Natural Gas Engineering; ELSEVIER: Amsterdam, The Netherlands, 2016; pp. 7-1–7-55. ISBN 9780123838469. [Google Scholar]
- Investopedia Corporate Finance & Accounting. Available online: https://www.investopedia.com/terms/c/cfat.asp (accessed on 4 June 2020).
- Diário da República. Decreto Regulamentar n.o 25/2009 de 14 de Setembro. Diário da República, 1.a Série—N.o 178—11 de Setembro de 2015; Diário da República: Lisboa, Portugal, 2009.
- ANEEL Biomassa. Atlas de Energia Elétrica no Brasil; ANNEL: Brasilia, Braszil, 2005; Volume 5, pp. 77–92. ISBN 978-85-87491-10-7.
- BBC. Los Países de América Latina Donde se Pagan Más y Menos Impuestos—BBC News Mundo. Available online: https://www.bbc.com/mundo/noticias-47572413 (accessed on 10 March 2020).
- Cardoso, J.; Silva, V.; Eusébio, D.; Brito, P.; Tarelho, L. Improved numerical approaches to predict hydrodynamics in a pilot-scale bubbling fl uidized bed biomass reactor: A numerical study with experimental validation. Energy Convers. Manag. 2018, 156, 53–67. [Google Scholar] [CrossRef]
- Silva, V.; Monteiro, E.; Couto, N.; Brito, P.; Rouboa, A. Analysis of syngas quality from Portuguese biomasses: An experimental and numerical study. Energy Fuels 2014, 28, 5766–5777. [Google Scholar] [CrossRef]
- Cardoso, J.; Silva, V.; Eusébio, D.; Brito, P.; Hall, M.J.; Tarelho, L. Comparative scaling analysis of two different sized pilot-scale fluidized bed reactors operating with biomass substrates. Energy 2018, 151, 520–535. [Google Scholar] [CrossRef]
- Homdoung, N.; Tippayawong, N.; Dussadee, N. Performance and emissions of a modified small engine operated on producer gas. Energy Convers. Manag. 2015, 94, 286–292. [Google Scholar] [CrossRef]
- Glenting, C.; Jakobsen, N.F.B. Converting Biomass to Energy. A Guide for Developers and Investors; World Bank Group: Washington, DC, USA, 2017. [Google Scholar]
- Vera, D.; Jurado, F.; Margaritis, N.K.; Grammelis, P. Experimental and economic study of a gasification plant fuelled with olive industry wastes. Energy Sustain. Dev. 2014, 23, 247–257. [Google Scholar] [CrossRef]
- Rentizelas, A.; Karellas, S.; Kakaras, E.; Tatsiopoulos, I. Comparative techno-economic analysis of ORC and gasification for bioenergy applications. Energy Convers. Manag. 2009, 50, 674–681. [Google Scholar] [CrossRef]
- Szabó, S.; Bódis, K.; Huld, T.; Moner-Girona, M. Energy solutions in rural Africa: Mapping electrification costs of distributed solar and diesel generation versus grid extension. Environ. Res. Lett. 2011, 6, 034002. [Google Scholar] [CrossRef]
- Amirante, R.; Bruno, S.; Distaso, E.; La Scala, M.; Tamburrano, P. A biomass small-scale externally fired combined cycle plant for heat and power generation in rural communities. Renew. Energy Focus 2019, 28, 36–46. [Google Scholar] [CrossRef]
- Mainhardt, H. Funding Clean Energy Access for the Poor: Can the World Bank Meet the Challenge; Bank Information Center Europe: Amsterdam, The Netherlands, 2017. [Google Scholar]
- Zanchi, G.; Frieden, D.; Pucker, J.; Bird, D.N.; Buchholz, T.; Windhorst, K. Climate benefits from alternative energy uses of biomass plantations in Uganda. Biomass Bioenergy 2013, 59, 128–136. [Google Scholar] [CrossRef]
© 2020 by the authors. Licensee MDPI, Basel, Switzerland. This article is an open access article distributed under the terms and conditions of the Creative Commons Attribution (CC BY) license (http://creativecommons.org/licenses/by/4.0/).